Embed Size (px)
Citation preview

Veterans BenefitsAdministration
U.S. Departmentof Veterans Affairs
A note on the data:
The 2017 Annual Benefits Report is based on data from the VBA corporate database.
The availability of gender and age data is limited, as some records are listed as “unknown.” Those records are accounted for in the totals for each table, but not in the category columns. Please see footnotes for additional information.
All Veterans counted in this section are receiving compensation benefit payments as of Sept. 30, 2017. The category of 0 percent indicates payment due to special monthly compensation or two or more permanent 0 percent service-connected disabilities which clearly interfere with normal employability. Veterans with a 0 percent combined degree of disability not receiving payment are not counted in this section.
Please see the section: “The Presentation of FY 2017 Compensation Data” on page 2 for important information on the color coding of the data tables.
Dependency and Indemnity Compensation data are found beginning on page 48.
Compensation Service-Connected Disability or Death Benefits
The Compensation program provides tax-free monthly benefits to Veterans in recognition of the effects of disabilities caused by diseases, events, or injuries incurred or aggravated during active military service. The program also provides monthly payments to surviving spouses, dependent children, and dependent parents in recognition of the economic loss caused by the death of individuals during their military service or as a result of service-connected disability after their discharge.
To be eligible for disability compensation, the Veteran must have served under conditions other than dishonorable, and the disability must not be the result of the Veteran’s own misconduct. VA pays disability compensation monthly, and the amount varies according to the degree of disability and the number of dependents. The degree of disability varies from 0 percent to 100 percent, in increments of 10 percent. VA calculates the total service-connected disability by combining evaluations for individual disabilities rather than adding them. VA pays additional special monthly compensation when severe disabilities confine Veterans to their immediate premises, require the aid and assistance of others, or include anatomical loss or loss of use of extremities or creative organs.
Photo credit: U.S. Air Force
56 Regional offices 15,338 employees 5.0 million compensation and service-connected death benefit recipients
Compensation - Page 2 of 52
Veterans BenefitsAdministration
U.S. Departmentof Veterans Affairs
Table of Contents Compensation ---------------------------------------------------------------------------------------------------------------------------67
Service-Connected Disability or Death Benefits --------------------------------------------------------------------------------------------------------------- 67 The Presentation of FY 2017 Compensation Data ---------------------------------------------------------------------------------------------------------- 3 Quick Reference: Recipients, Payments and Disabilities ------------------------------------------------------------------------------------------------ 4 Quick Reference: Recipients and Disabilities by Period of Service -------------------------------------------------------------------------------- 6 GWOT Quick Reference: Veterans Involved Global War on Terror ---------------------------------------------------------------------------------- 7 Veterans by Fiscal Year and Combined Degree of Disability ------------------------------------------------------------------------------------------- 8 Veterans by Combined Degree of Disability and Gender ------------------------------------------------------------------------------------------------ 10 Estimated Annual Total Payments by Combined Degree of Disability and Gender ------------------------------------------------------- 12 Estimated Annual Average Individual Payments by Combined Degree of Disability and Gender --------------------------------- 14 Veterans and Estimated Annual Payments by Age ---------------------------------------------------------------------------------------------------------- 16 Charts: Veterans and Estimated Annual Payments by Age --------------------------------------------------------------------------------------------- 17 Veterans and Estimated Annual Payments by Period of Service ------------------------------------------------------------------------------------ 18 Charts: Veterans and Estimated Annual Payments by Period of Service ----------------------------------------------------------------------- 19 GWOT Veterans and Estimated Annual Payments by Gender ----------------------------------------------------------------------------------------- 20 GWOT Veterans and Estimated Annual Payments by Combined Disability Degree ------------------------------------------------------- 21 GWOT Veterans by Combined Degree of Disability and Gender ------------------------------------------------------------------------------------- 22 GWOT Estimated Annual Total Payment by Combined Degree of Disability and Gender ---------------------------------------------- 23 GWOT Estimated Annual Average Individual Payment by Combined Degree of Disability and Gender ----------------------- 24 Regarding Service-Connected Disability Data ------------------------------------------------------------------------------------------------------------------ 25 Number of SC Disabilities by Body System and Fiscal Year -------------------------------------------------------------------------------------------- 26 Number of SC Disabilities by Evaluation and Gender ------------------------------------------------------------------------------------------------------ 28 Number of SC Disabilities by Body System and Gender -------------------------------------------------------------------------------------------------- 29 Most Prevalent SC Disabilities by Gender ------------------------------------------------------------------------------------------------------------------------ 30 Number of SC Disabilities and Prevalence by Body System ------------------------------------------------------------------------------------------- 32 Number of SC Disabilities and Prevalence by Body System and Evaluation ----------------------------------------------------------------- 33 The Three Most Prevalent SC Disabilities by Body System --------------------------------------------------------------------------------------------- 35 Most Prevalent SC Disabilities – by Disability Type --------------------------------------------------------------------------------------------------------- 38 Most Prevalent SC Disabilities by Period of Service -------------------------------------------------------------------------------------------------------- 39 GWOT Most Prevalent SC Disabilities by Gender ------------------------------------------------------------------------------------------------------------- 42 GWOT SC Disabilities by Body System and Gender --------------------------------------------------------------------------------------------------------- 44 GWOT Three Most Prevalent SC Disabilities by Body System ----------------------------------------------------------------------------------------- 45
Dependency and Indemnity Compensation (DIC) ------------------------------------------------------------------48 New DIC recipients during FY 2013 to FY 2017 by relationship ------------------------------------------------------------------------------------ 48 All DIC recipients by relationship --------------------------------------------------------------------------------------------------------------------------------------- 48 New surviving spouse DIC recipients -------------------------------------------------------------------------------------------------------------------------------- 48 All surviving spouse DIC recipients by age ----------------------------------------------------------------------------------------------------------------------- 49 New surviving child DIC recipients by age ------------------------------------------------------------------------------------------------------------------------ 49 All surviving child DIC recipients by age --------------------------------------------------------------------------------------------------------------------------- 49
Appendix ------------------------------------------------------------------------------------------------------------------------------------50 VBA Regional Office Addresses ----------------------------------------------------------------------------------------------------------------------------------------- 50 District Offices -------------------------------------------------------------------------------------------------------------------------------------------------------------------- 52 Centralized Mail Address --------------------------------------------------------------------------------------------------------------------------------------------------- 52 Contact Information ----------------------------------------------------------------------------------------------------------------------------------------------------------- 52

Com
pens
atio
n - P
age
3 of
52
Veterans BenefitsAdministration
U.S. Departmentof Veterans Affairs
The Presentation of FY 2017 Compensation Data
New to the rolls On the rolls
Individuals who began receiving benefits during fiscal year 2017 (October 1, 2016 to September 30, 2017) are considered “New to the rolls,” and the tables are outlined in blue.
All individuals receiving benefits on September 30, 2017 are considered “On the rolls” and the tables are outlined in green. These tables include “New to the rolls” recipients.
Please note the difference between counts of Veterans and counts of disabilities. A Veteran may be receiving benefits based on one or more disabilities, which is why numbers of disabilities are much higher than numbers of Veterans. Counts of disabilities are indicated by the section title and table header and begin on page 25.
Data regarding payments do not reflect actual amounts paid by VA. This document only addresses monthly benefit payments and does not include retroactive payments. Also, estimated average annual individual payments for the same combined degree differ slightly due to additional payments for dependents and/or special monthly compensation. Also, all payment information is annual unless stated otherwise. Please refer to the official budget internet site at https://www.va.gov/budget/ for actual amounts paid by VA.
This document counts all Veterans with 0 percent combined disability as long as they receive payment for special monthly compensation or a 10 percent rate because they have two or more separate permanent 0 percent service-connected disabilities which clearly interfere with normal employability. This document does not count Veterans with 0 percent combined disabilities who are not receiving payment of any kind.
VA has incorporated Global War on Terror (GWOT) data to the main data tables as a subset of the Gulf War era (GW) period of service. Since September 11, 2001, the Department of Defense has deployed personnel overseas in support of GWOT, including Operation Iraqi Freedom/Operation Enduring Freedom/Operation New Dawn (OIF/OEF/OND). For more information, see pages 7, 20 through 24, and 42 through 47.
VBA’s computer systems do not contain data that would allow us to attribute Veterans’ disabilities to specific periods of service or deployment. Therefore, GWOT is a subset that includes Veterans who filed disability compensation claims at some point either prior to or following their GWOT deployment. VBA is not able to identify which of these Veterans filed a claim for disabilities incurred during their actual overseas GWOT deployment.
The Office of Performance Analysis and Integrity is available to answer questions regarding the data contained in this report by email at [email protected].
Release history
Version & changes Date
Data as of 09/30/2017

Compensation – Page 4 of 52
Veterans BenefitsAdministration
U.S. Departmentof Veterans Affairs
Quick Reference: Recipients, Payments and Disabilities
Totals – new recipients
Veterans who began receiving compensation benefits 296,718
Survivors who began receiving service-connected death benefits 32,002
Total: 328,720
Estimated annual payments – new recipients
Benefit program Number of recipients
Estimated annual total payments
Estimated annual average individual
payment
Compensation 296,718 $3.51 Billion $11,822
Service-Connected Death1 32,002 $512.5 Million $16,015
Total: 328,720 $4.02 Billion $12,230
Most prevalent service-connected (SC) disabilities of new compensation recipients
Tinnitus 159,800
Limitation of flexion, knee 83,329
Hearing loss 81,529
Lumbosacral or cervical strain 73,073
Limitation of motion of the arm 67,563
Scars, general 61,580
Post-traumatic stress disorder 51,273
Limitation of motion of the ankle 50,384
Migraine 41,912
Paralysis of the sciatic nerve 36,584
Total number of most prevalent disabilities
Total number of disabilities2
707,027
1,516,948
Average number of SC disabilities per new compensation recipient
New recipients: 296,718 Total number of disabilities: 1,516,948
Average SC disabilities per Veteran: 5.11
1 Dependency and Indemnity Compensation and Death Compensation. 2 See page 91 for more information.

Com
pens
atio
n –
Page
5 o
f 52
Veterans BenefitsAdministration
U.S. Departmentof Veterans Affairs
Totals – all recipients
Veterans receiving compensation benefits 4,552,819
Survivors receiving service-connected death benefits 411,390
Total: 4,964,209
Estimated annual payments– all recipients
Benefit program Number of recipients
Estimated annual total payments
Estimated annual average individual
payment
Compensation 4,552,819 $69.99 Billion $15,373
Service-Connected Death 411,390 $6.53 Billion $15,874
Total: 4,964,209 $76.52 Billion $15,415
Most prevalent SC disabilities of all compensation recipients
Tinnitus 1,786,980
Hearing loss 1,157,585
Post-traumatic stress disorder 964,038
Scars, general 934,967
Lumbosacral or cervical strain 916,515
Limitation of flexion, knee 872,536
Paralysis of the sciatic nerve 675,155
Limitation of motion of the ankle 571,552
Migraine 491,267
Degenerative Arthritis of the Spine 470,390
Total number of most prevalent disabilities:
Total number of disabilities
8,840,985
23,216,495
Average number of SC disabilities per compensation recipient
All Veterans: 4,552,819 Total number of disabilities3: 23,216,495
Average SC disabilities per Veteran: 5.10
3 Total does not reflect all claimed disabilities as some disabilities are determined not to be related to service.
Compensation – Page 6 of 52
Veterans BenefitsAdministration
U.S. Departmentof Veterans Affairs
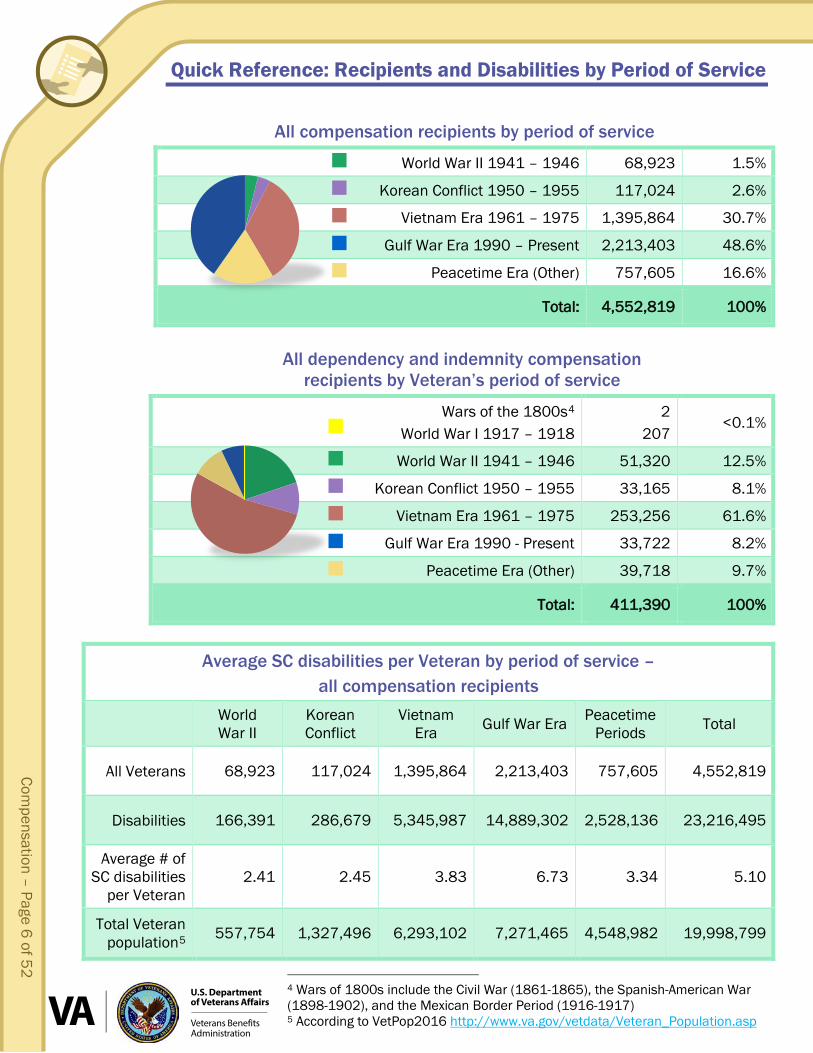
Quick Reference: Recipients and Disabilities by Period of Service
All compensation recipients by period of service
World War II 1941 – 1946 68,923 1.5%
Korean Conflict 1950 – 1955 117,024 2.6%
Vietnam Era 1961 – 1975 1,395,864 30.7%
Gulf War Era 1990 – Present 2,213,403 48.6%
Peacetime Era (Other) 757,605 16.6%
Total: 4,552,819 100%
All dependency and indemnity compensation recipients by Veteran’s period of service
Wars of the 1800s4 World War I 1917 – 1918
2 207
<0.1%
World War II 1941 – 1946 51,320 12.5%
Korean Conflict 1950 – 1955 33,165 8.1%
Vietnam Era 1961 – 1975 253,256 61.6%
Gulf War Era 1990 - Present 33,722 8.2%
Peacetime Era (Other) 39,718 9.7%
Total: 411,390 100%
Average SC disabilities per Veteran by period of service – all compensation recipients
World War II
Korean Conflict
Vietnam Era Gulf War Era Peacetime
Periods Total
All Veterans 68,923 117,024 1,395,864 2,213,403 757,605 4,552,819
Disabilities 166,391 286,679 5,345,987 14,889,302 2,528,136 23,216,495
Average # of SC disabilities
per Veteran 2.41 2.45 3.83 6.73 3.34 5.10
Total Veteran population5 557,754 1,327,496 6,293,102 7,271,465 4,548,982 19,998,799
4 Wars of 1800s include the Civil War (1861-1865), the Spanish-American War (1898-1902), and the Mexican Border Period (1916-1917) 5 According to VetPop2016 http://www.va.gov/vetdata/Veteran_Population.asp

Com
pens
atio
n –
Page
7 o
f 52
Veterans BenefitsAdministration
U.S. Departmentof Veterans Affairs
0%
10%
20%
30%
40%
50%
60%
Veterans Disabilities
Perc
ent o
f all
Gul
f War
Era
com
pens
atio
n re
cipi
ents
GW
OT -
59%
Non
-GW
OT -
41%
GW
OT -
52%
Non
-GW
OT -
48%
GWOT Quick Reference: Veterans Involved Global War on Terror
VBA has incorporated GWOT data within the “Gulf War Era” in all other tables. For more information see pages 20 through 24 and 42 through 47.
All Gulf War Era compensation recipients by GWOT status
GWOT 1,148,660 52%
Non-GWOT 1,064,743 48%
Gulf War Era Total: 2,213,403 100%
Number of SC disabilities of all Gulf War Era compensation recipients by GWOT status
GWOT 8,732,529 58.6%
Non-GWOT 6,156,773 41.4%
Gulf War Era Total: 14,889,302 100%
All Gulf War Era compensation recipients - average number of SC disabilities per Veteran by GWOT status
GWOT Non-GWOT Gulf War Era Total
7.60 5.78 6.73

Compensation – Page 8 of 52
Veterans BenefitsAdministration
U.S. Departmentof Veterans Affairs
Veterans by Fiscal Year and Combined Degree of Disability
Note: These tables count Veterans in receipt of individual unemployability benefits by their combined evaluation, rather than as totally disabled i.e. evaluated as 100%.
New compensation recipients FY 2013 to FY 2017
Combined degree 2013 2014 2015 2016 2017
% Chg. FY 2016 to 2017
0%6 781 753 611 490 517 6%
10% 72,608 72,759 77,773 72,639 79,841 10%
20% 32,248 30,286 29,771 26,222 26,904 3%
30% 31,549 29,985 30,604 27,193 26,615 -2%
40% 26,554 25,436 26,294 23,871 23,728 -1%
50% 23,083 22,727 24,518 21,712 21,561 -1%
60% 26,880 26,341 27,697 24,571 24,338 -1%
70% 25,410 25,318 27,738 24,974 25,331 1%
80% 19,664 20,799 22,234 20,204 19,875 -2%
90% 13,611 16,208 18,439 17,247 18,683 8%
100% 20,287 23,264 27,373 25,427 29,325 15%
Total 292,675 293,876 313,052 284,550 296,718 4%
6 This document counts all Veterans with 0 percent combined disability as long as they receive payment for special monthly compensation or a 10 percent rate because they have two or more separate permanent 0 percent service-connected disabilities which clearly interfere with normal employability. This document does not count Veterans with a 0 percent combined disability who are not receiving payment of any kind.

Com
pens
atio
n –
Page
9 o
f 52
Veterans BenefitsAdministration
U.S. Departmentof Veterans Affairs
All compensation recipients FY 2013 to FY 2017
Combined degree 2013 2014 2015 2016 2017
% Chg. FY 2016 to 2017
0% 11,096 10,844 10,462 10,053 9,567 -5%
10% 815,921 828,770 843,984 857,134 870,547 2%
20% 454,475 455,183 454,151 451,752 447,341 -1%
30% 394,669 400,270 404,121 404,936 402,871 -1%
40% 354,862 365,317 374,061 380,751 384,240 1%
50% 247,875 261,224 275,183 284,836 292,608 3%
60% 324,546 348,226 371,842 391,029 407,506 4%
70% 311,242 340,122 371,104 398,160 423,956 6%
80% 261,925 295,482 331,077 363,315 394,925 9%
90% 171,425 204,167 239,825 272,330 309,933 14%
100% 395,223 439,461 492,964 542,147 609,325 12%
Total 3,743,259 3,949,066 4,168,774 4,356,443 4,552,819 5%

Compensation – Page 10 of 52
Veterans BenefitsAdministration
U.S. Departmentof Veterans Affairs
Veterans by Combined Degree of Disability and Gender
New compensation recipients
Combined degree Male % Male Female % Female Total7 % Total
0% 419 0.2% 35 0.1% 517 0.2%
10% 70,749 28.2% 4,478 14.2% 79,841 26.9%
20% 23,270 9.3% 2,012 6.4% 26,904 9.1%
30% 22,287 8.9% 2,991 9.5% 26,615 9.0%
40% 20,121 8.0% 2,569 8.1% 23,728 8.0%
50% 17,635 7.0% 3,060 9.7% 21,561 7.3%
60% 20,345 8.1% 2,942 9.3% 24,338 8.2%
70% 20,485 8.2% 3,985 12.6% 25,331 8.5%
80% 16,149 6.4% 3,113 9.8% 19,875 6.7%
90% 15,111 6.0% 3,074 9.7% 18,683 6.3%
100% 24,343 9.7% 3,354 10.6% 29,325 9.9%
Total 250,914 31,613 296,718
7 Total includes 14,191 Veterans with no gender indicated in the award record.
Com
pens
atio
n –
Page
11
of 5
2
Veterans BenefitsAdministration
U.S. Departmentof Veterans Affairs
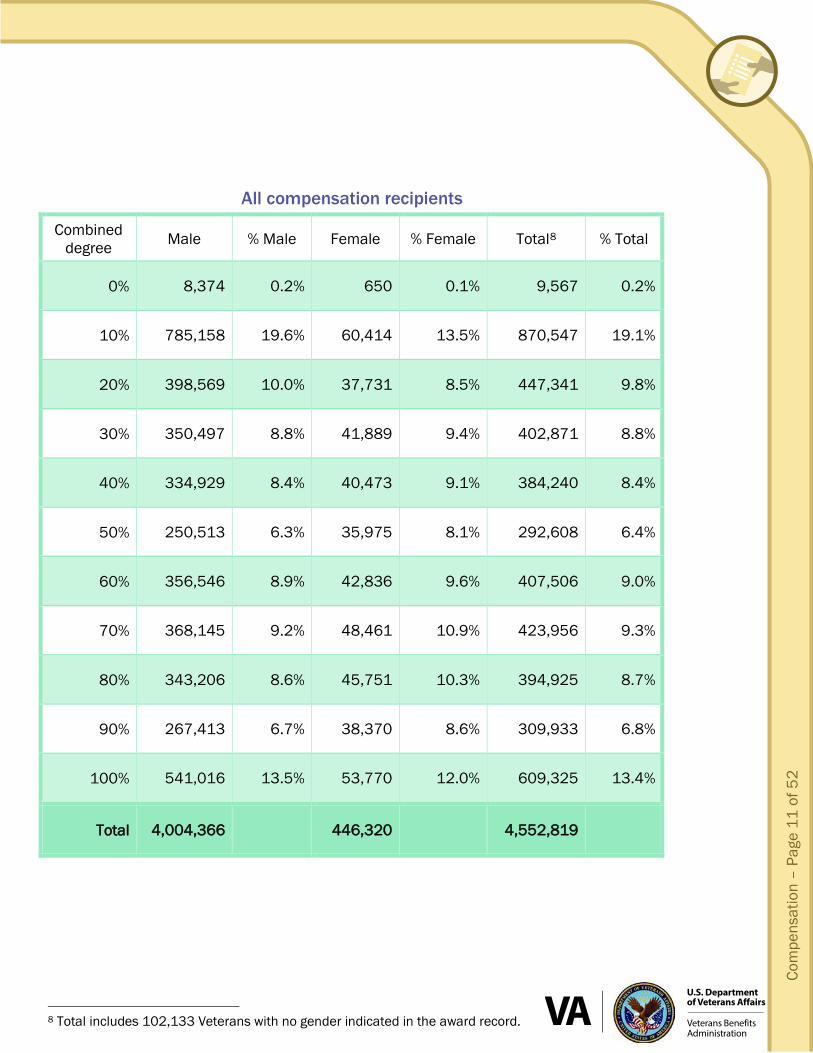
All compensation recipients
Combined degree Male % Male Female % Female Total8 % Total
0% 8,374 0.2% 650 0.1% 9,567 0.2%
10% 785,158 19.6% 60,414 13.5% 870,547 19.1%
20% 398,569 10.0% 37,731 8.5% 447,341 9.8%
30% 350,497 8.8% 41,889 9.4% 402,871 8.8%
40% 334,929 8.4% 40,473 9.1% 384,240 8.4%
50% 250,513 6.3% 35,975 8.1% 292,608 6.4%
60% 356,546 8.9% 42,836 9.6% 407,506 9.0%
70% 368,145 9.2% 48,461 10.9% 423,956 9.3%
80% 343,206 8.6% 45,751 10.3% 394,925 8.7%
90% 267,413 6.7% 38,370 8.6% 309,933 6.8%
100% 541,016 13.5% 53,770 12.0% 609,325 13.4%
Total 4,004,366 446,320 4,552,819
8 Total includes 102,133 Veterans with no gender indicated in the award record.
Compensation – Page 12 of 52
Veterans BenefitsAdministration
U.S. Departmentof Veterans Affairs
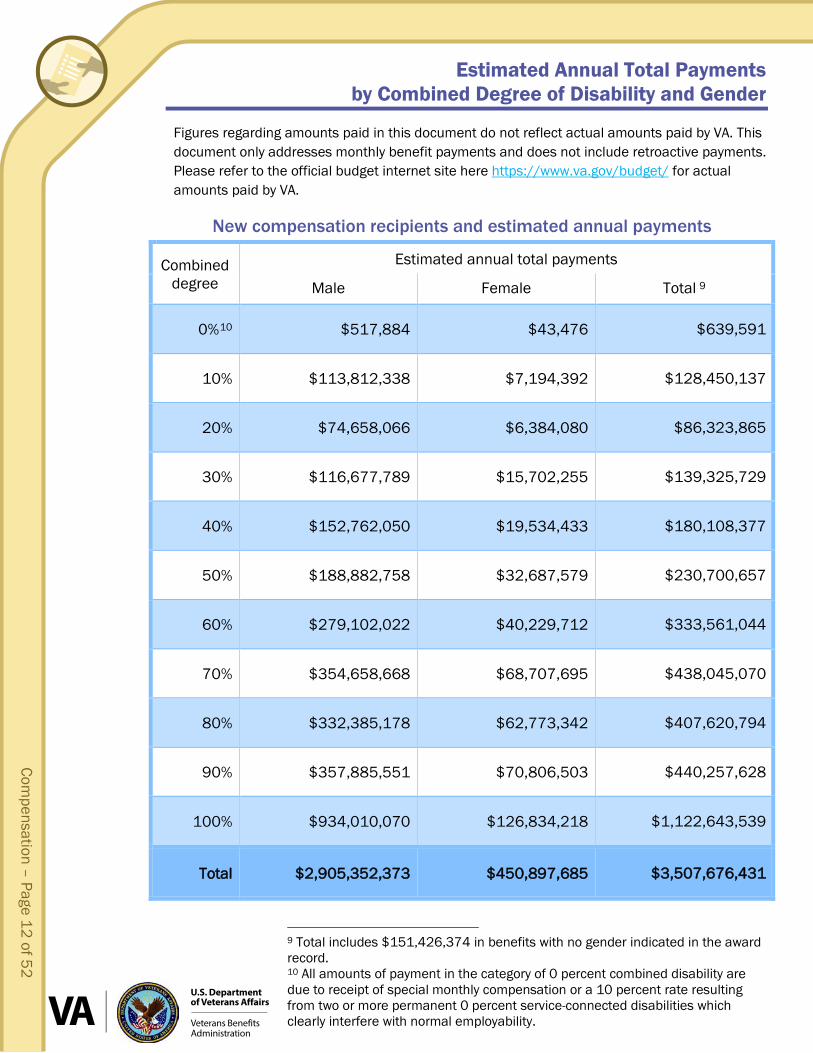
Estimated Annual Total Payments by Combined Degree of Disability and Gender
Figures regarding amounts paid in this document do not reflect actual amounts paid by VA. This document only addresses monthly benefit payments and does not include retroactive payments. Please refer to the official budget internet site here https://www.va.gov/budget/ for actual amounts paid by VA.
New compensation recipients and estimated annual payments
Combined degree
Estimated annual total payments
Male Female Total 9
0%10 $517,884 $43,476 $639,591
10% $113,812,338 $7,194,392 $128,450,137
20% $74,658,066 $6,384,080 $86,323,865
30% $116,677,789 $15,702,255 $139,325,729
40% $152,762,050 $19,534,433 $180,108,377
50% $188,882,758 $32,687,579 $230,700,657
60% $279,102,022 $40,229,712 $333,561,044
70% $354,658,668 $68,707,695 $438,045,070
80% $332,385,178 $62,773,342 $407,620,794
90% $357,885,551 $70,806,503 $440,257,628
100% $934,010,070 $126,834,218 $1,122,643,539
Total $2,905,352,373 $450,897,685 $3,507,676,431
9 Total includes $151,426,374 in benefits with no gender indicated in the award record. 10 All amounts of payment in the category of 0 percent combined disability are due to receipt of special monthly compensation or a 10 percent rate resulting from two or more permanent 0 percent service-connected disabilities which clearly interfere with normal employability.

Com
pens
atio
n –
Page
13
of 5
2
Veterans BenefitsAdministration
U.S. Departmentof Veterans Affairs
All compensation recipients and estimated annual payments
Combined degree
Estimated annual total payments
Male Female Total 11
0% $9,623,268 $778,197 $11,042,817
10% $1,267,990,427 $97,849,446 $1,406,269,846
20% $1,283,327,772 $120,165,460 $1,439,474,918
30% $1,907,986,140 $230,381,763 $2,194,573,399
40% $2,638,010,761 $320,575,417 $3,027,310,222
50% $2,785,182,013 $400,239,375 $3,252,188,575
60% $5,568,393,205 $629,310,316 $6,326,494,517
70% $8,336,515,543 $1,015,787,853 $9,516,924,157
80% $8,715,318,776 $1,077,772,286 $9,946,971,925
90% $7,667,352,781 $1,023,709,509 $8,810,379,443
100% $21,402,453,864 $2,082,505,517 $24,059,813,860
Total $61,582,154,550 $6,999,075,139 $69,991,443,679
11 Total includes $1,410,213,990 in benefits with no gender indicated in the award record.

Compensation – Page 14 of 52
Veterans BenefitsAdministration
U.S. Departmentof Veterans Affairs
Estimated Annual Average Individual Payments by Combined Degree of Disability and Gender
Note: Estimated annual average individual payments for the same combined degree differ slightly due to additional payments for dependents and/or special monthly compensation.
New compensation recipients and estimated annual payments
Combined degree
Estimated annual average individual payment
Male Female Total
0% $1,236 $1,242 $1,237
10% $1,609 $1,607 $1,609
20% $3,208 $3,173 $3,209
30% $5,235 $5,250 $5,235
40% $7,592 $7,604 $7,591
50% $10,711 $10,682 $10,700
60% $13,718 $13,674 $13,705
70% $17,313 $17,242 $17,293
80% $20,582 $20,165 $20,509
90% $23,684 $23,034 $23,565
100% $38,369 $37,816 $38,283
Total $11,579 $14,263 $11,822

Com
pens
atio
n –
Page
15
of 5
2
Veterans BenefitsAdministration
U.S. Departmentof Veterans Affairs
All compensation recipients and estimated annual payments
Combined degree
Estimated annual average individual payment
Male Female Total
0% $1,149 $1,197 $1,154
10% $1,615 $1,620 $1,615
20% $3,220 $3,185 $3,218
30% $5,444 $5,500 $5,447
40% $7,876 $7,921 $7,879
50% $11,118 $11,125 $11,114
60% $15,618 $14,691 $15,525
70% $22,645 $20,961 $22,448
80% $25,394 $23,557 $25,187
90% $28,672 $26,680 $28,427
100% $39,560 $38,730 $39,486
Total $15,379 $15,682 $15,373

Compensation – Page 16 of 52
Veterans BenefitsAdministration
U.S. Departmentof Veterans Affairs
Veterans and Estimated Annual Payments by Age
New compensation recipients and estimated annual payments
Age Number of Veterans
Estimated annual total payments
Estimated annual average individual
payment
Age 34 and under 89,013 $1,114,067,864 $12,516
Age 35 through 54 90,040 $1,338,223,665 $14,863
Age 55 through 74 93,204 $826,991,800 $8,873
Age 75 and over 24,456 $228,358,368 $9,338
Total12 296,718 $3,507,676,431 $11,822
All compensation recipients and estimated annual payments
Age Number of Veterans
Estimated annual total payments
Estimated annual average individual
payment
Age 34 and under 567,624 $8,134,097,300 $14,330
Age 35 through 54 1,356,243 $20,683,030,885 $15,250
Age 55 through 74 2,077,324 $33,738,993,563 $16,242
Age 75 and over 551,033 $7,430,978,322 $13,486
Total13 4,552,819 $69,991,443,679 $15,373
12 Total includes 5 Veterans and $34,733 in total estimated annual payment amounts unidentifiable by age. 13 Total includes 595 Veterans and $4,343,609 in total estimated annual payment amounts unidentifiable by age.

Com
pens
atio
n –
Page
17
of 5
2
Veterans BenefitsAdministration
U.S. Departmentof Veterans Affairs
Charts: Veterans and Estimated Annual Payments by Age
The chart below displays the ages of the Veterans who began receiving benefits in FY 2017 (blue line, left axis) vs. the total number of Veterans receiving benefits at the end of the fiscal year (green line, right axis).
New compensation recipients compared to all compensation recipients by age
The chart below displays the annual estimated average individual payments to Veterans who began receiving benefits in FY 2017 (blue bars on the left) vs. the estimated annual average individual payments for all Veterans receiving benefits at the end of the fiscal year (green bars on the right) according to age.
New compensation recipients compared to all compensation recipients by estimated annual average individual payment by age
Compensation – Page 18 of 52
Veterans BenefitsAdministration
U.S. Departmentof Veterans Affairs
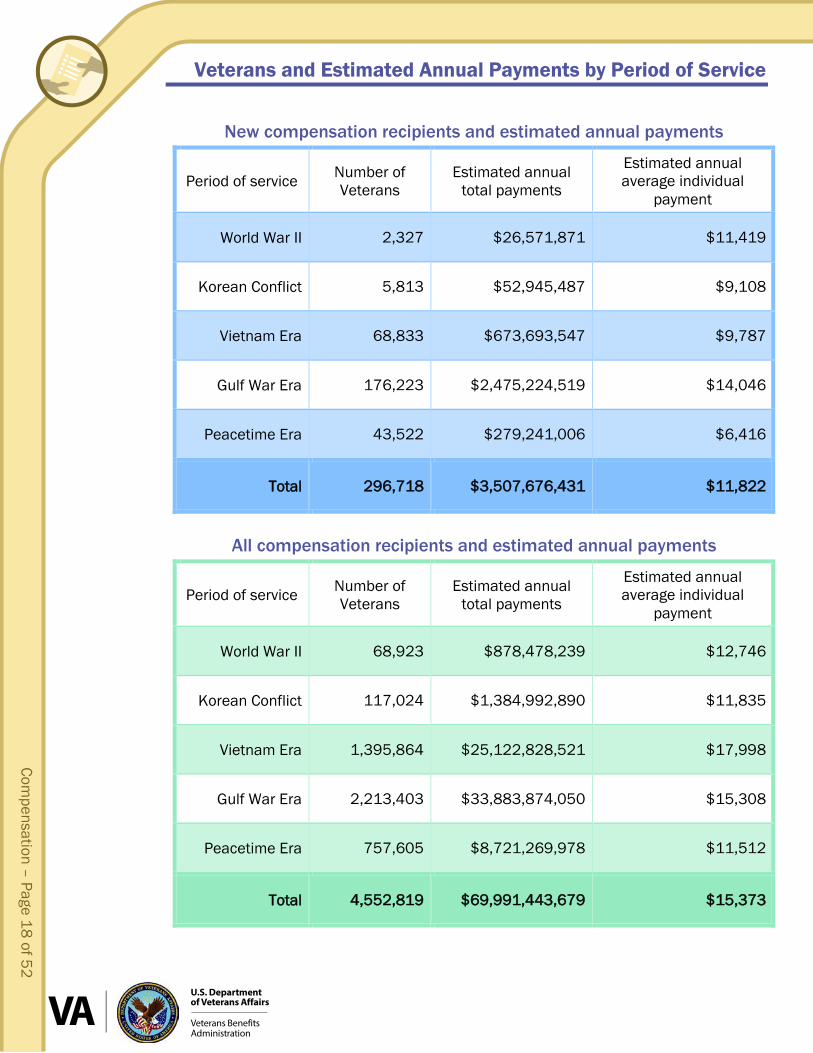
Veterans and Estimated Annual Payments by Period of Service
New compensation recipients and estimated annual payments
Period of service Number of Veterans
Estimated annual total payments
Estimated annual average individual
payment
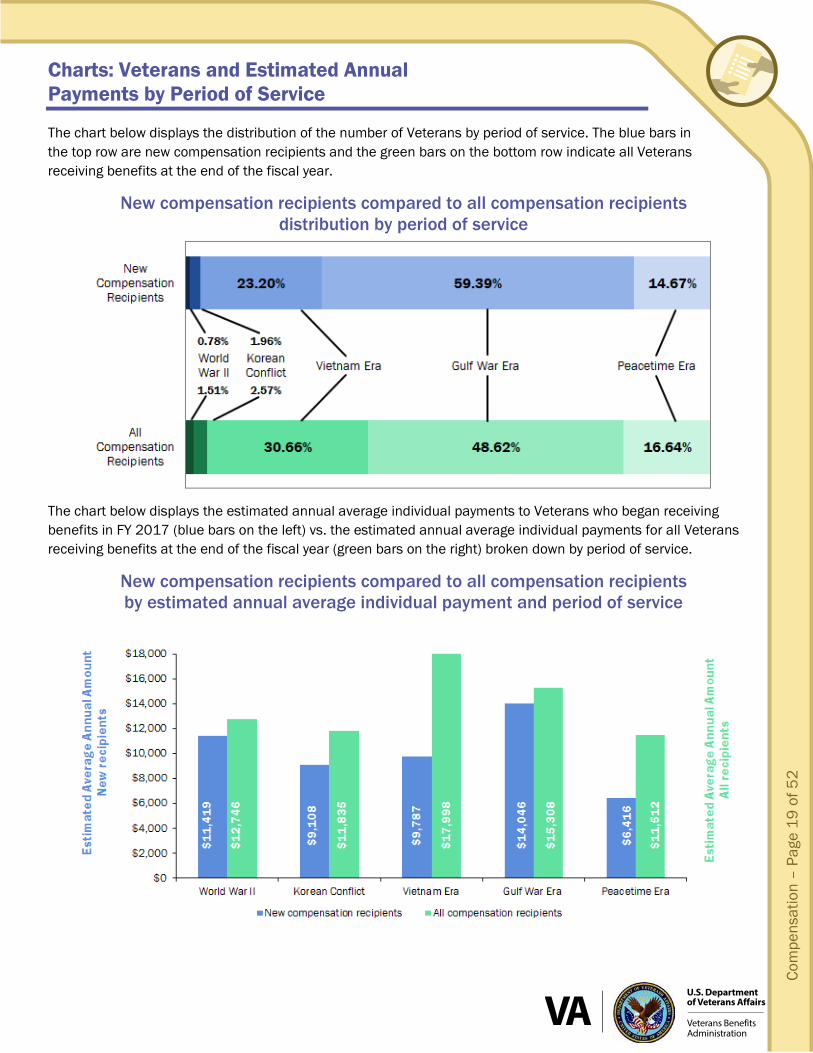
World War II 2,327 $26,571,871 $11,419
Korean Conflict 5,813 $52,945,487 $9,108
Vietnam Era 68,833 $673,693,547 $9,787
Gulf War Era 176,223 $2,475,224,519 $14,046
Peacetime Era 43,522 $279,241,006 $6,416
Total 296,718 $3,507,676,431 $11,822
All compensation recipients and estimated annual payments
Period of service Number of Veterans
Estimated annual total payments
Estimated annual average individual
payment
World War II 68,923 $878,478,239 $12,746
Korean Conflict 117,024 $1,384,992,890 $11,835
Vietnam Era 1,395,864 $25,122,828,521 $17,998
Gulf War Era 2,213,403 $33,883,874,050 $15,308
Peacetime Era 757,605 $8,721,269,978 $11,512
Total 4,552,819 $69,991,443,679 $15,373
Com
pens
atio
n –
Page
19
of 5
2
Veterans BenefitsAdministration
U.S. Departmentof Veterans Affairs
Charts: Veterans and Estimated Annual Payments by Period of Service
The chart below displays the distribution of the number of Veterans by period of service. The blue bars in the top row are new compensation recipients and the green bars on the bottom row indicate all Veterans receiving benefits at the end of the fiscal year.
New compensation recipients compared to all compensation recipients distribution by period of service
The chart below displays the estimated annual average individual payments to Veterans who began receiving benefits in FY 2017 (blue bars on the left) vs. the estimated annual average individual payments for all Veterans receiving benefits at the end of the fiscal year (green bars on the right) broken down by period of service.
New compensation recipients compared to all compensation recipients by estimated annual average individual payment and period of service

Compensation – Page 20 of 52
Veterans BenefitsAdministration
U.S. Departmentof Veterans Affairs
GWOT Veterans and Estimated Annual Payments by Gender
The Global War on Terror (GWOT) data are a subset of the Gulf War era period of service and are included with all other discussions of period of service.
New GWOT compensation recipients and estimated annual payments
Gender Number of Veterans
Estimated annual total payments
Estimated annual average individual
payment
Male 69,830 $1,012,376,996 $14,498
Female 11,660 $183,525,108 $15,740
Total14 82,774 $1,217,842,107 $14,713
All GWOT compensation recipients and estimated annual payments
Gender Number of Veterans
Estimated annual total payments
Estimated annual average individual
payment
Male 987,935 $16,556,148,483 $16,758
Female 154,775 $2,614,552,064 $16,893
Total15 1,148,660 $19,270,856,834 $16,777
14 Total includes 1,284 Veterans and $21,940,003 in payments with no gender indicated in the award record. 15 Total includes 5,950 Veterans and $100,156,287 in payments with no gender indicated in the award record.

Com
pens
atio
n –
Page
21
of 5
2
Veterans BenefitsAdministration
U.S. Departmentof Veterans Affairs
GWOT Veterans and Estimated Annual Payments by Combined Disability Degree
New GWOT compensation recipients and estimated annual payments
Combined degree
Number of Veterans
Estimated annual total payments
Estimated annual average individual payment
0% 57 $70,795 $1,242
10% 11,208 $18,032,657 $1,609
20% 4,999 $15,927,836 $3,186
30% 7,103 $37,928,356 $5,340
40% 7,437 $57,389,731 $7,717
50% 7,387 $80,151,774 $10,850
60% 8,974 $124,354,218 $13,857
70% 10,077 $175,443,479 $17,410
80% 8,514 $175,615,264 $20,627
90% 8,374 $198,300,459 $23,680
100% 8,644 $334,627,537 $38,712
Total 82,774 $1,217,842,107 $14,713

Compensation – Page 22 of 52
Veterans BenefitsAdministration
U.S. Departmentof Veterans Affairs
GWOT Veterans by Combined Degree of Disability and Gender
All GWOT compensation recipients
Combined degree Male % Male Female % Female Total16 % Total
0% 538 0.05% 85 0.05% 627 0.05%
10% 96,083 9.73% 13,192 8.52% 109,905 9.57%
20% 66,356 6.72% 9,595 6.20% 76,400 6.65%
30% 79,177 8.01% 12,705 8.21% 92,313 8.04%
40% 87,785 8.89% 14,153 9.14% 102,396 8.91%
50% 75,210 7.61% 12,501 8.08% 88,152 7.67%
60% 117,842 11.93% 16,753 10.82% 135,234 11.77%
70% 115,906 11.73% 17,814 11.51% 134,379 11.70%
80% 126,361 12.79% 19,799 12.79% 146,926 12.79%
90% 102,960 10.42% 17,868 11.54% 121,509 10.58%
100% 119,717 12.12% 20,310 13.12% 140,819 12.26%
Total 987,935 100% 154,775 100% 1,148,660 100%
16 Total includes 5,950 Veterans with no gender indicated in the award record.

Com
pens
atio
n –
Page
23
of 5
2
Veterans BenefitsAdministration
U.S. Departmentof Veterans Affairs
GWOT Estimated Annual Total Payment by Combined Degree of Disability and Gender
All GWOT compensation recipients and estimated annual payments
Combined degree
Estimated annual total payments
Male Female Total17
0% $739,634 $105,600 $850,204
10% $155,160,533 $21,269,734 $177,451,229
20% $211,616,951 $30,526,158 $243,573,104
30% $442,192,291 $70,524,082 $515,156,255
40% $705,066,138 $112,776,441 $821,589,416
50% $853,076,218 $139,904,970 $998,006,879
60% $1,695,269,310 $237,141,122 $1,941,677,041
70% $2,215,152,068 $334,670,453 $2,562,044,992
80% $2,844,212,814 $434,016,496 $3,294,868,227
90% $2,688,318,629 $451,380,202 $3,156,957,720
100% $4,745,343,897 $782,236,806 $5,558,681,768
Total $16,556,148,483 $2,614,552,064 $19,270,856,834
.
17 Total includes $100,156,287 in benefits with no gender indicated in the award record.

Compensation – Page 24 of 52
Veterans BenefitsAdministration
U.S. Departmentof Veterans Affairs
GWOT Estimated Annual Average Individual Payment by Combined Degree of Disability and Gender
All GWOT compensation recipients and estimated annual payments
Combined degree
Estimated annual average individual payments
Male Female Total18
0% $1,375 $1,242 $1,356
10% $1,615 $1,612 $1,615
20% $3,189 $3,181 $3,188
30% $5,585 $5,551 $5,581
40% $8,032 $7,968 $8,024
50% $11,343 $11,192 $11,321
60% $14,386 $14,155 $14,358
70% $19,112 $18,787 $19,066
80% $22,509 $21,921 $22,425
90% $26,110 $25,262 $25,981
100% $39,638 $38,515 $39,474
Total $16,758 $16,893 $16,777
18 Total includes average of $16,833 in benefits with no gender indicated in the award record.

Com
pens
atio
n –
Page
25
of 5
2
Veterans BenefitsAdministration
U.S. Departmentof Veterans Affairs
Regarding Service-Connected Disability Data
The tables on the following pages present information on the number of service-connected disabilities, as opposed to the number of Veterans with those disability evaluations.
Tables labeled “Number of SC disabilities of new compensation recipients” display counts of service-connected disabilities which VBA rated for new recipients during FY 2017. Tables labeled “Number of SC disabilities of all compensation recipients” display counts of all rated service-connected disabilities for all Veterans receiving compensation at the end of FY 2017.
VBA has abbreviated the names of the body systems to allow for a clearer presentation of the information. The three body systems with the greatest changes in terminology are:
• “Organs of special sense” abbreviated to: “The Eye”
• “Infectious Diseases, Immune Disorders, and Nutritional Deficiencies” abbreviated to: “Infection/Immune/Nutrition”
• “Neurological Conditions and Convulsive Disorders” abbreviated to: “Neurological”
Any use of the term “disabilities” in the following section includes service-connected disabilities only.

Compensation – Page 26 of 52
Veterans BenefitsAdministration
U.S. Departmentof Veterans Affairs
Number of SC Disabilities by Body System and Fiscal Year
Number of SC disabilities of new compensation recipients FY 2013 to FY 2017
Body system 2013 2014 2015 2016 2017
% Chg. FY
2016 to
2017
Musculoskeletal 541,280 570,608 654,669 602,983 611,857 1%
Auditory 222,139 226,994 250,436 233,324 247,944 6%
Skin 150,423 152,655 167,002 148,897 150,311 1%
Neurological 133,195 140,221 160,750 145,346 145,617 0%
Mental 100,515 98,209 110,420 99,840 97,897 -2%
Respiratory 70,058 72,980 82,720 75,514 74,633 -1%
Digestive 53,258 54,846 60,334 54,874 55,438 1%
Genitourinary 50,291 43,187 45,591 40,496 41,871 3%
Cardiovascular 41,494 48,749 48,302 39,584 37,260 -6%
Endocrine 26,056 24,030 22,443 18,006 17,000 -6%
The Eye 15,385 16,044 18,176 16,065 15,388 -4%
Dental/ Oral 7,139 7,357 8,338 7,950 8,365 5%
Gynecological 6,340 6,324 7,594 6,929 7,316 6%
Hemic/ Lymphatic 3,626 3,799 4,105 3,660 4,311 18%
Infection/ Immune/ Nutrition 2,129 2,111 2,114 1,905 1,740 -9%
Total 1,423,328 1,468,114 1,642,994 1,495,373 1,516,948 1%

Com
pens
atio
n –
Page
27
of 5
2
Veterans BenefitsAdministration
U.S. Departmentof Veterans Affairs
Number of SC disabilities of all compensation recipients FY 2013 to FY 2017
Body system 2013 2014 2015 2016 2017
% Chg. FY
2016 to 2017
Musculoskeletal 5,780,195 6,397,255 7,117,586 7,779,603 8,481,844 9%
Auditory 2,116,528 2,352,609 2,613,285 2,846,483 3,101,223 9%
Neurological 1,557,654 1,788,151 2,058,164 2,299,581 2,561,741 11%
Skin 1,726,884 1,910,027 2,111,444 2,292,040 2,503,676 9%
Mental 1,110,050 1,230,063 1,368,427 1,492,483 1,622,814 9%
Respiratory 719,770 798,353 889,002 971,673 1,058,623 9%
Digestive 772,021 825,345 884,368 936,490 992,557 6%
Cardiovascular 834,775 878,381 919,068 946,832 973,411 3%
Genitourinary 570,093 627,252 684,965 732,526 785,903 7%
Endocrine 447,399 469,910 488,942 500,362 510,195 2%
The Eye 216,955 233,430 252,069 267,124 282,611 6%
Gynecological 85,043 92,164 101,008 109,198 118,540 9%
Dental/ Oral 72,588 80,526 89,713 98,416 107,895 10%
Hemic/ Lymphatic 46,517 50,677 55,075 58,737 63,783 9%
Infection/ Immune/ Nutrition 48,928 49,495 50,275 50,851 51,679 2%
Total 16,105,400 17,783,638 19,683,391 21,382,399 23,216,495 9%

Compensation – Page 28 of 52
Veterans BenefitsAdministration
U.S. Departmentof Veterans Affairs
Number of SC Disabilities by Evaluation and Gender
Number of SC disabilities of all compensation recipients
Disability Evaluation
Male19 Female Total20
0% 6,661,583 981,868 7,749,786
10% 7,902,968 1,076,340 9,113,048
20% 2,027,654 192,205 2,264,429
30% 1,259,143 221,883 1,510,627
40% 429,579 47,068 486,956
50% 733,353 111,766 856,899
60% 275,442 20,222 303,190
70% 397,639 54,053 458,650
80% 20,096 1,034 21,850
90% 4,615 155 4,946
100% 403,250 30,222 446,109
Total 20,115,327 2,736,816 23,216,495
19 Total include 5 male disabilities unidentifiable by evaluation. 20 Total includes 364,352 disabilities unidentifiable by gender.
Com
pens
atio
n –
Page
29
of 5
2
Veterans BenefitsAdministration
U.S. Departmentof Veterans Affairs
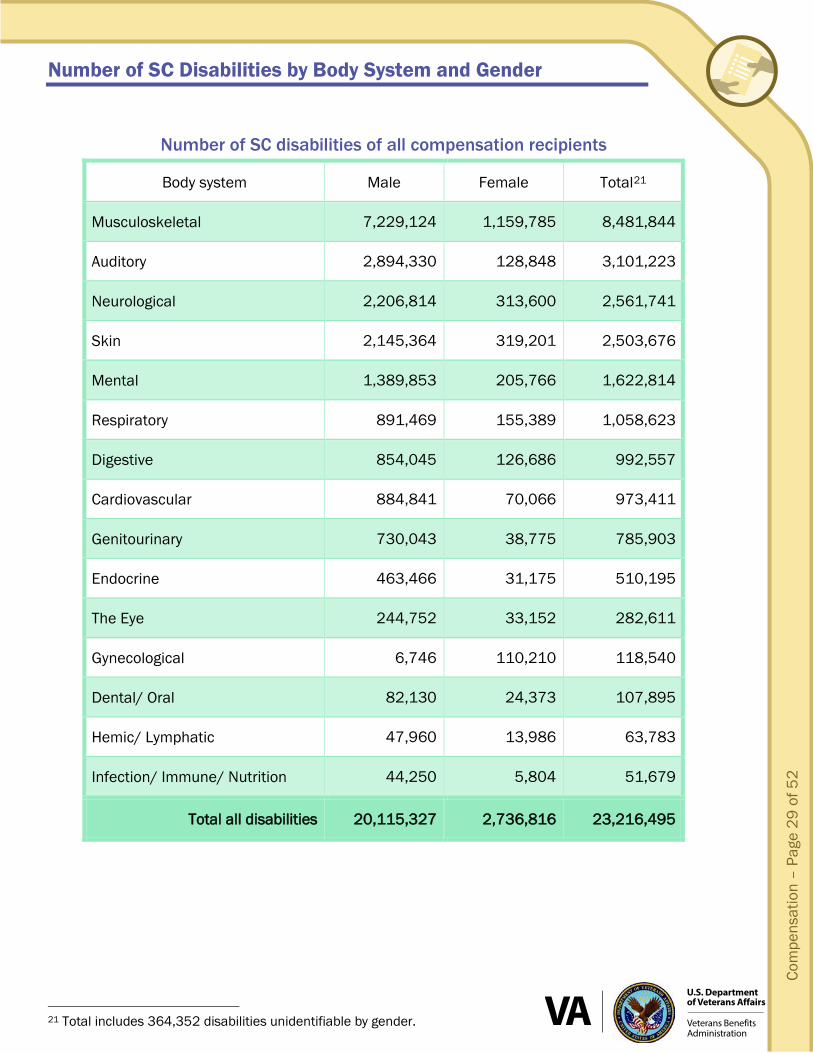
Number of SC Disabilities by Body System and Gender
Number of SC disabilities of all compensation recipients
Body system Male Female Total21
Musculoskeletal 7,229,124 1,159,785 8,481,844
Auditory 2,894,330 128,848 3,101,223
Neurological 2,206,814 313,600 2,561,741
Skin 2,145,364 319,201 2,503,676
Mental 1,389,853 205,766 1,622,814
Respiratory 891,469 155,389 1,058,623
Digestive 854,045 126,686 992,557
Cardiovascular 884,841 70,066 973,411
Genitourinary 730,043 38,775 785,903
Endocrine 463,466 31,175 510,195
The Eye 244,752 33,152 282,611
Gynecological 6,746 110,210 118,540
Dental/ Oral 82,130 24,373 107,895
Hemic/ Lymphatic 47,960 13,986 63,783
Infection/ Immune/ Nutrition 44,250 5,804 51,679
Total all disabilities 20,115,327 2,736,816 23,216,495
21 Total includes 364,352 disabilities unidentifiable by gender.
Compensation – Page 30 of 52
Veterans BenefitsAdministration
U.S. Departmentof Veterans Affairs
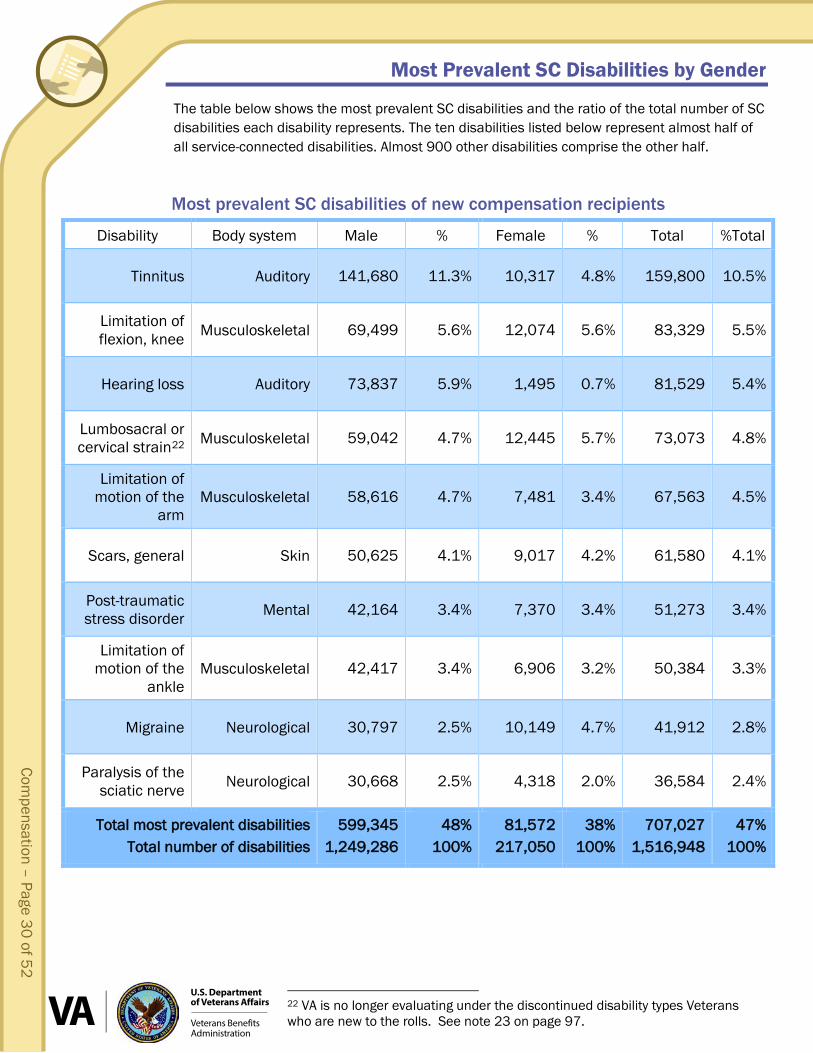
Most Prevalent SC Disabilities by Gender
The table below shows the most prevalent SC disabilities and the ratio of the total number of SC disabilities each disability represents. The ten disabilities listed below represent almost half of all service-connected disabilities. Almost 900 other disabilities comprise the other half.
Most prevalent SC disabilities of new compensation recipients
Disability Body system Male % Female % Total %Total
Tinnitus Auditory 141,680 11.3% 10,317 4.8% 159,800 10.5%
Limitation of flexion, knee Musculoskeletal 69,499 5.6% 12,074 5.6% 83,329 5.5%
Hearing loss Auditory 73,837 5.9% 1,495 0.7% 81,529 5.4%
Lumbosacral or cervical strain22 Musculoskeletal 59,042 4.7% 12,445 5.7% 73,073 4.8%
Limitation of motion of the
arm Musculoskeletal 58,616 4.7% 7,481 3.4% 67,563 4.5%
Scars, general Skin 50,625 4.1% 9,017 4.2% 61,580 4.1%
Post-traumatic stress disorder Mental 42,164 3.4% 7,370 3.4% 51,273 3.4%
Limitation of motion of the
ankle Musculoskeletal 42,417 3.4% 6,906 3.2% 50,384 3.3%
Migraine Neurological 30,797 2.5% 10,149 4.7% 41,912 2.8%
Paralysis of the sciatic nerve Neurological 30,668 2.5% 4,318 2.0% 36,584 2.4%
Total most prevalent disabilities Total number of disabilities
599,345 1,249,286
48% 100%
81,572 217,050
38% 100%
707,027 1,516,948
47% 100%
22 VA is no longer evaluating under the discontinued disability types Veterans who are new to the rolls. See note 23 on page 97.

Com
pens
atio
n –
Page
31
of 5
2
Veterans BenefitsAdministration
U.S. Departmentof Veterans Affairs
23 The number of lumbosacral or cervical strain disabilities in this report includes disabilities which, in Annual Benefits Reports prior to FY 13, were counted under 5 discontinued disability names related to lumbosacral or cervical strain. 24 Total includes 160,210 disabilities unidentifiable by gender. 25 Total includes 364,352 disabilities unidentifiable by gender.
Most prevalent SC disabilities of all compensation recipients
Disability Body system Male % Female % Total %Total
Tinnitus Auditory 1,654,756 8.2% 92,860 3.4% 1,786,980 7.7%
Hearing loss Auditory 1,101,363 5.5% 21,048 0.8% 1,157,585 5.0%
Post-traumatic stress disorder Mental 866,005 4.3% 81,549 3.0% 964,038 4.2%
Scars, general Skin 805,971 4.0% 111,568 4.1% 934,967 4.0%
Lumbosacral or cervical
strain23 Musculoskeletal 763,632 3.8% 144,594 5.3% 916,515 3.9%
Limitation of flexion, knee Musculoskeletal 745,186 3.7% 119,921 4.4% 872,536 3.8%
Paralysis of the sciatic nerve Neurological 609,375 3.0% 53,226 1.9% 675,155 2.9%
Limitation of motion of the
ankle Musculoskeletal 498,027 2.5% 68,622 2.5% 571,552 2.5%
Migraine Neurological 365,472 1.8% 121,465 4.4% 491,267 2.1%
Degenerative Arthritis of the
Spine
Musculoskeletal 409,666 2.0% 57,000 2.1% 470,390 2.0%
Total most prevalent disabilities24 Total number of disabilities25
7,819,453 20,115,327
39% 100%
871,853 2,736,816
32% 100%
8,840,985 23,216,495
38% 100%
Compensation – Page 32 of 52
Veterans BenefitsAdministration
U.S. Departmentof Veterans Affairs
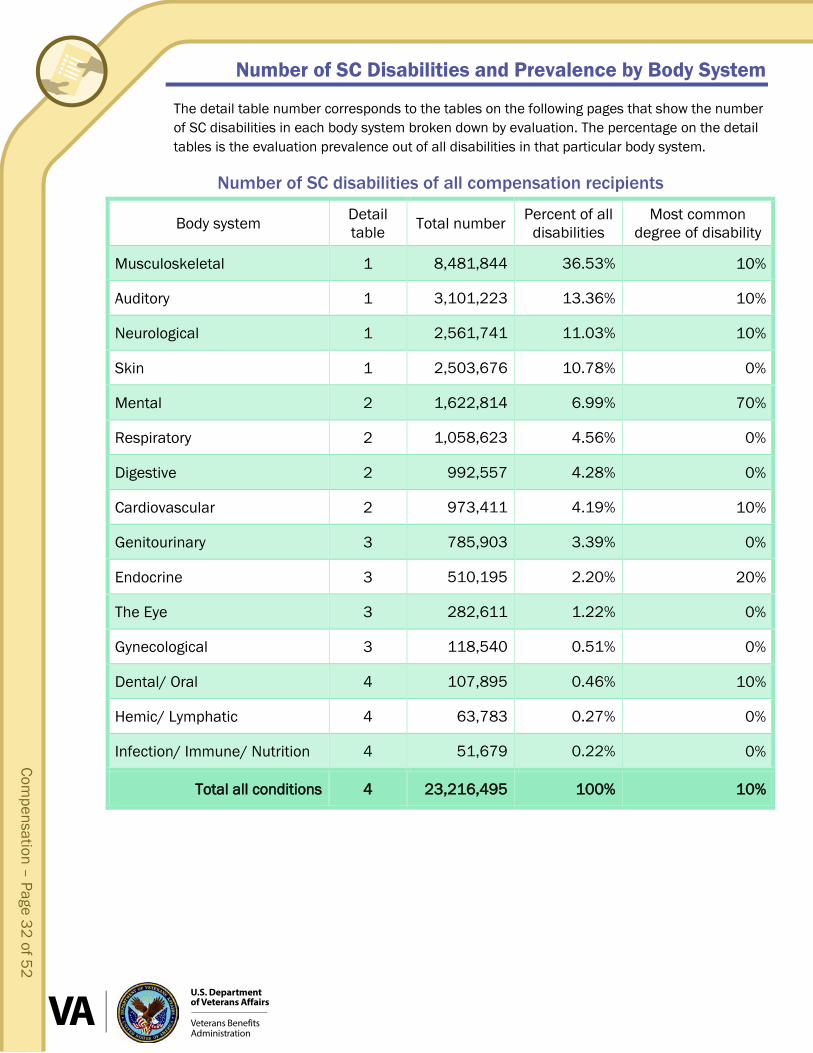
Number of SC Disabilities and Prevalence by Body System
The detail table number corresponds to the tables on the following pages that show the number of SC disabilities in each body system broken down by evaluation. The percentage on the detail tables is the evaluation prevalence out of all disabilities in that particular body system.
Number of SC disabilities of all compensation recipients
Body system Detail table Total number Percent of all
disabilities Most common
degree of disability
Musculoskeletal 1 8,481,844 36.53% 10%
Auditory 1 3,101,223 13.36% 10%
Neurological 1 2,561,741 11.03% 10%
Skin 1 2,503,676 10.78% 0%
Mental 2 1,622,814 6.99% 70%
Respiratory 2 1,058,623 4.56% 0%
Digestive 2 992,557 4.28% 0%
Cardiovascular 2 973,411 4.19% 10%
Genitourinary 3 785,903 3.39% 0%
Endocrine 3 510,195 2.20% 20%
The Eye 3 282,611 1.22% 0%
Gynecological 3 118,540 0.51% 0%
Dental/ Oral 4 107,895 0.46% 10%
Hemic/ Lymphatic 4 63,783 0.27% 0%
Infection/ Immune/ Nutrition 4 51,679 0.22% 0%
Total all conditions 4 23,216,495 100% 10%

Com
pens
atio
n –
Page
33
of 5
2
Veterans BenefitsAdministration
U.S. Departmentof Veterans Affairs
Number of SC Disabilities and Prevalence by Body System and Evaluation
Table 1 Number of SC disabilities of all compensation recipients
Rating % Musculoskeletal Auditory Neurological Skin
0% 2,350,845 27.72% 964,001 31.08% 420,702 16.42% 1,897,640 75.79%
10% 4,410,942 52.00% 1,936,233 62.43% 1,098,931 42.90% 477,525 19.07%
20% 1,065,758 12.57% 54,516 1.76% 545,791 21.31% 27,612 1.10%
30% 286,655 3.38% 51,862 1.67% 264,277 10.32% 75,832 3.03%
40% 219,837 2.59% 30,664 0.99% 124,015 4.84% 2,959 0.12%
50% 56,654 0.67% 20,958 0.68% 66,453 2.59% 4,379 0.17%
60% 52,474 0.62% 10,430 0.34% 14,577 0.57% 16,339 0.65%
70% 4,517 0.05% 6,663 0.21% 12,535 0.49% 13 <0.01%
80% 1,241 0.01% 6,555 0.21% 5,056 0.20% 989 0.04%
90% 965 0.01% 2,605 0.08% 457 0.02% 2 <0.01%
100% 31,952 0.38% 16,735 0.54% 8,947 0.35% 386 0.02%
Total26 8,481,844 100% 3,101,223 100% 2,561,741 100% 2,503,676 100%
Table 2
Rating % Mental Respiratory Digestive Cardiovascular
0% 36,153 2.23% 450,061 42.51% 553,309 55.75% 276,379 28.39%
10% 126,577 7.80% 184,196 17.40% 290,890 29.31% 322,077 33.09%
20% 608 0.04% 3,458 0.33% 34,422 3.47% 54,755 5.63%
30% 398,097 24.53% 109,723 10.36% 82,586 8.32% 131,568 13.52%
40% 525 0.03% 464 0.04% 6,345 0.64% 22,297 2.29%
50% 414,000 25.51% 269,586 25.47% 1,690 0.17% 543 0.06%
60% 329 0.02% 20,460 1.93% 11,595 1.17% 98,521 10.12%
70% 431,818 26.61% 34 <0.01% 295 0.03% 69 0.01%
80% 12 <0.01% 33 <0.01% 559 0.06% 27 <0.01%
90% 10 <0.01% 3 <0.01% 1 <0.01% 20 <0.01%
100% 214,685 13.23% 20,605 1.95% 10,865 1.09% 67,155 6.90%
Total 1,622,814 100% 1,058,623 100% 992,557 100% 973,411 100%
26 Totals include 1 auditory, and 4 musculoskeletal disabilities with unknown evaluation.

Compensation – Page 34 of 52
Veterans BenefitsAdministration
U.S. Departmentof Veterans Affairs
Number of SC Disabilities, Prevalence by Body System and Evaluation (Continued)
Table 3 Number of SC disabilities of all compensation recipients
Rating % Genitourinary Endocrine The Eye Gynecological
0% 474,495 60.38% 16,543 3.24% 148,655 52.60% 55,635 46.93%
10% 49,644 6.32% 79,995 15.68% 68,343 24.18% 12,988 10.96%
20% 63,443 8.07% 378,703 74.23% 17,505 6.19% 220 0.19%
30% 31,879 4.06% 5,455 1.07% 29,611 10.48% 28,470 24.02%
40% 48,549 6.18% 19,419 3.81% 6,353 2.25% 747 0.63%
50% 26 <0.01% 22 0.00% 2,801 0.99% 19,525 16.47%
60% 64,199 8.17% 6,512 1.28% 2,203 0.78% 266 0.22%
70% 9 <0.01% 3 <0.01% 2,083 0.74% 2 <0.01%
80% 6,545 0.83% 1 <0.01% 649 0.23% 143 0.12%
90% - 0.00% 1 <0.01% 881 0.31% - 0.00%
100% 47,114 5.99% 3,541 0.69% 3,527 1.25% 544 0.46%
Total 785,903 100% 510,195 100% 282,611 100% 118,540 100%
Table 4
Rating % Dental/ Oral Hemic/ Lymphatic Infection/ Immune/ Nutrition Total all body systems27
0% 42,302 39.21% 29,156 45.71% 33,910 65.62% 7,749,786 33.38%
10% 43,677 40.48% 6,064 9.51% 4,966 9.61% 9,113,048 39.25%
20% 13,227 12.26% 2,850 4.47% 1,561 3.02% 2,264,429 9.75%
30% 6,009 5.57% 6,934 10.87% 1,669 3.23% 1,510,627 6.51%
40% 2,406 2.23% 371 0.58% 2,005 3.88% 486,956 2.10%
50% 229 0.21% 11 0.02% 22 0.04% 856,899 3.69%
60% 7 0.01% 339 0.53% 4,939 9.56% 303,190 1.31%
70% 1 <0.01% 602 0.94% 6 0.01% 458,650 1.98%
80% 2 <0.01% 2 <0.01% 36 0.07% 21,850 0.09%
90% - 0.00% - 0.00% 1 <0.01% 4,946 0.02%
100% 35 0.03% 17,454 27.36% 2,564 4.96% 446,109 1.92%
Total 107,895 100% 63,783 100% 51,679 100% 23,216,495 100%
27 Totals include 5 disabilities with unknown evaluations.
Com
pens
atio
n –
Page
35
of 5
2
Veterans BenefitsAdministration
U.S. Departmentof Veterans Affairs
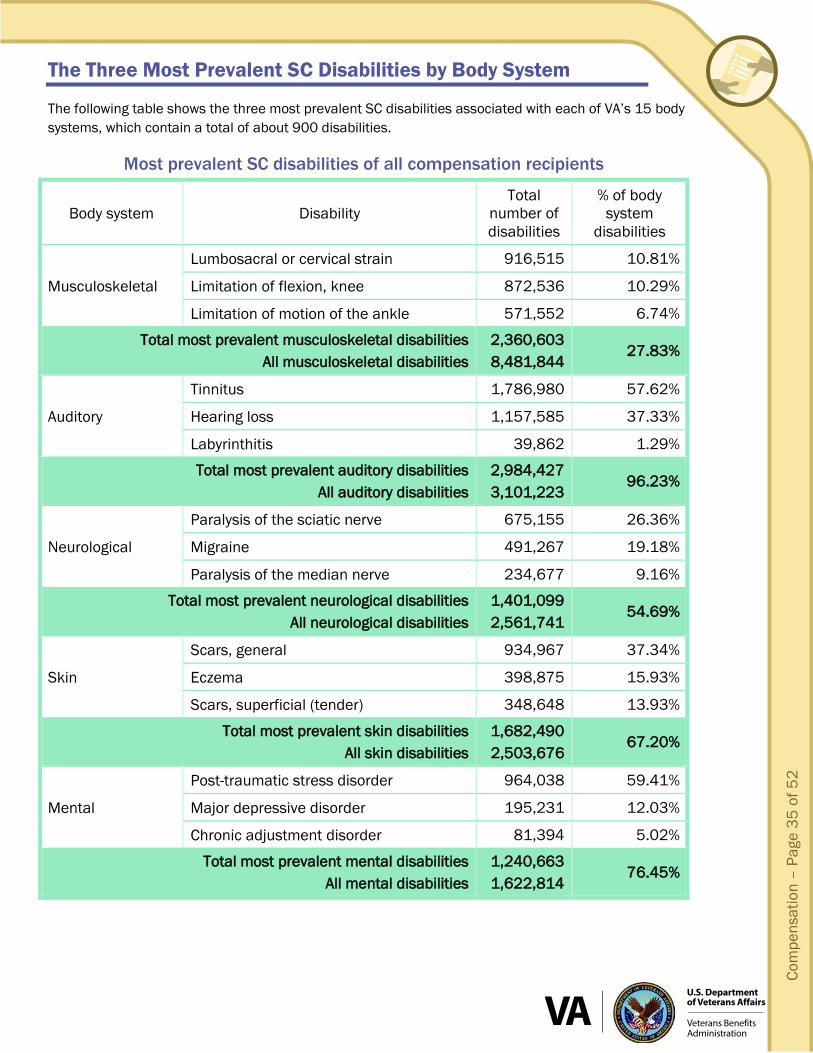
The Three Most Prevalent SC Disabilities by Body System
The following table shows the three most prevalent SC disabilities associated with each of VA’s 15 body systems, which contain a total of about 900 disabilities.
Most prevalent SC disabilities of all compensation recipients
Body system Disability Total
number of disabilities
% of body system
disabilities
Musculoskeletal
Lumbosacral or cervical strain 916,515 10.81%
Limitation of flexion, knee 872,536 10.29%
Limitation of motion of the ankle 571,552 6.74%
Total most prevalent musculoskeletal disabilities All musculoskeletal disabilities
2,360,603 8,481,844
27.83%
Auditory
Tinnitus 1,786,980 57.62%
Hearing loss 1,157,585 37.33%
Labyrinthitis 39,862 1.29%
Total most prevalent auditory disabilities All auditory disabilities
2,984,427 3,101,223
96.23%
Neurological
Paralysis of the sciatic nerve 675,155 26.36%
Migraine 491,267 19.18%
Paralysis of the median nerve 234,677 9.16%
Total most prevalent neurological disabilities All neurological disabilities
1,401,099 2,561,741
54.69%
Skin
Scars, general 934,967 37.34%
Eczema 398,875 15.93%
Scars, superficial (tender) 348,648 13.93%
Total most prevalent skin disabilities All skin disabilities
1,682,490 2,503,676
67.20%
Mental
Post-traumatic stress disorder 964,038 59.41%
Major depressive disorder 195,231 12.03%
Chronic adjustment disorder 81,394 5.02%
Total most prevalent mental disabilities All mental disabilities
1,240,663 1,622,814
76.45%

Compensation – Page 36 of 52
Veterans BenefitsAdministration
U.S. Departmentof Veterans Affairs
The Three Most Prevalent SC Disabilities by Body System (Continued)
Most prevalent SC disabilities of all compensation recipients
Body system Disability Total
number of disabilities
% of body system
disabilities
Respiratory
Sleep apnea syndromes (obstructive, central, mixed) 282,323 26.67%
Allergic rhinitis 248,020 23.43%
Bronchial asthma 121,023 11.43%
Total most prevalent respiratory disabilities All respiratory disabilities
651,366 1,058,623 61.53%
Digestive
Hiatal hernia 304,872 30.72%
Hemorrhoids 245,291 24.71%
Irritable bowel syndrome 98,674 9.94%
Total most prevalent digestive disabilities All digestive disabilities
648,837 992,557
65.37%
Cardiovascular
Hypertensive vascular disease 398,917 40.98%
Arteriosclerotic heart disease (coronary artery disease) 222,424 22.85%
Varicose veins 68,896 7.08%
Total most prevalent cardiovascular disabilities All cardiovascular disabilities
690,237 973,411
70.91%
Genitourinary
Penile deformity (loss of erectile power) 310,176 39.47%
Malignant growths of genitourinary system 123,181 15.67%
Prostate gland injuries 59,459 7.57%
Total most prevalent genitourinary disabilities All genitourinary disabilities
492,816 785,903
62.71%
Endocrine
Diabetes mellitus 444,309 87.09%
Hypothyroidism 42,646 8.36%
Hyperthyroidism 8,609 1.69%
Total most prevalent endocrine disabilities All endocrine disabilities
495,564 510,195
97.13%

Com
pens
atio
n –
Page
37
of 5
2
Veterans BenefitsAdministration
U.S. Departmentof Veterans Affairs
Most prevalent SC disabilities of all compensation recipients
Body system Disability Total
number of disabilities
% of body system
disabilities
The Eye
Loss of 1 eye; vision 20/40 in other 49,997 17.69%
Impairment to field of vision 28,183 9.97%
Conjunctivitis, chronic 26,735 9.46%
Total most prevalent eye related disabilities All eye related disabilities
104,915 282,611
37.12%
Gynecological
Removal of uterus 21,941 18.51%
Removal of uterus and both ovaries 17,019 14.36%
Benign growths of gynecological system or breast 12,509 10.55%
Total most prevalent gynecological disabilities All gynecological disabilities
51,469 118,540
43.42%
Dental/ Oral
Limited motion of the jaw 82,883 76.82%
Malunion of lower jaw 8,957 8.30%
Loss of teeth 7,144 6.62%
Total most prevalent dental/oral disabilities All dental/oral disabilities
98,984 107,895
91.74%
Hemic/ Lymphatic
Anemia 22,083 34.62%
Non-Hodgkin’s lymphoma 10,908 17.10%
Splenectomy (removal of spleen) 7,916 12.41%
Total most prevalent hemic/lymphatic disabilities All hemic/lymphatic disabilities
40,907 63,783
64.28%
Infection/ Immune/ Nutrition
Malaria 25,842 50.00%
Chronic fatigue syndrome 10,842 20.98%
HIV-related illness 4,979 9.63%
Total most prevalent infection/immune/nutrition disabilities All infection/immune/nutrition disabilities
41,663 51,679
80.62%

Compensation – Page 38 of 52
Veterans BenefitsAdministration
U.S. Departmentof Veterans Affairs
Most Prevalent SC Disabilities – by Disability Type
The disabilities listed on pages 35 through 37 are grouped by one of over 900 individual disability codes. Disability types in the table below with a 28 footnote are groups of these code based on the general disability type or condition. VBA created these groups to show more clearly the most prevalent types of disabilities which affect Veterans.
For example: on page 35 under Musculoskeletal Disabilities, only the top 27.83% are listed and two of them are related to limited motion. The table below lists the top 69.20% of Musculoskeletal disabilities, grouping all limitation-of-motion disabilities regardless of body part affected.
Most prevalent SC disabilities of all compensation recipients
Body system Disability type Total number
% of body system
disabilities
Musculoskeletal
Limitation of motion of a joint or appendage28 2,938,579 34.65%
Lumbosacral or cervical strain28 916,515 10.81%
Degenerative arthritis of the spine 470,390 5.55%
Impairment of the knee, general 435,178 5.13%
Flatfoot, acquired 291,851 3.44%
Intervertebral Disc Syndrome 274,929 3.24%
Degenerative arthritis 272,951 3.22%
Traumatic arthritis 269,457 3.18%
Total most prevalent musculoskeletal disabilities All musculoskeletal disabilities
5,869,580 8,481,844
69.20%
Neurological
Paralysis of a nerve or nerve group (all types) 28 1,520,606 59.36%
Migraine 491,267 19.18%
Inflammation of a nerve or nerve group (all types) 28 203,579 7.95%
Neuralgia of a nerve or nerve group (all types) 28 128,842 5.03%
Brain disease due to trauma 119,669 4.67%
Total most prevalent neurological disabilities All neurological disabilities
2,463,659 2,561,741
96.17%
The Eye
Blind in one or both eyes28 63,766 22.56%
Impaired vision - one or both eyes28 53,685 19.00%
Conjunctivitis28 27,172 9.61%
Unhealed eye injury 18,158 6.43%
Total most prevalent eye related disabilities All eye related disabilities
162,781 282,611
57.60%
28 This disability type is composed of several disability codes.

Com
pens
atio
n –
Page
39
of 5
2
Veterans BenefitsAdministration
U.S. Departmentof Veterans Affairs
Most Prevalent SC Disabilities by Period of Service
Most prevalent SC disabilities of all compensation recipients
Period of service (POS) Disability Total number
% of all POS disabilities
World War II
Hearing loss 32,212 19.36%
Tinnitus 22,617 13.59%
Residuals of cold injury 9,028 5.43%
Post-traumatic stress disorder 7,613 4.58%
Scars, general 6,067 3.65%
Scars, superficial (tender) 3,299 1.98%
Generalized anxiety disorder 3,165 1.90%
Traumatic arthritis 2,410 1.45%
Scars, head, face or neck 2,266 1.36%
Flatfoot, acquired 2,136 1.28%
Total most prevalent World War II disabilities All World War II disabilities
90,813 166,391
54.58%
Korean Conflict
Hearing loss 65,278 22.77%
Tinnitus 54,381 18.97%
Residuals of cold injury 15,517 5.41%
Post-traumatic stress disorder 10,296 3.59%
Scars, general 9,499 3.31%
Scars, superficial (tender) 4,938 1.72%
Paralysis of the sciatic nerve 3,891 1.36%
Scars, head, face or neck 3,548 1.24%
Lumbosacral or cervical strain 3,301 1.15%
Traumatic arthritis 2,748 0.96%
Total most prevalent Korean Conflict disabilities All Korean Conflict disabilities
173,397 286,679
60.48%

Compensation – Page 40 of 52
Veterans BenefitsAdministration
U.S. Departmentof Veterans Affairs
Most Prevalent SC Disabilities by Period of Service (Continued)
Most prevalent SC disabilities of all compensation recipients
Period of service Disability Total number
% of POS disabilities
Vietnam Era
Tinnitus 531,692 9.95%
Hearing loss 504,056 9.43%
Post-traumatic stress disorder 395,201 7.39%
Diabetes mellitus 373,595 6.99%
Paralysis of the sciatic nerve 289,605 5.42%
Scars, general 225,090 4.21%
Arteriosclerotic heart disease (coronary artery disease) 184,972 3.46%
Penile deformity (loss of erectile power) 151,588 2.84%
Malignant growths of genitourinary system 109,261 2.04%
Paralysis of the median nerve 80,854 1.51%
Total most prevalent Vietnam Era disabilities All Vietnam Era disabilities
2,845,914 5,345,987
53.23%
Gulf War Era
Tinnitus 944,930 6.35%
Lumbosacral or cervical strain 744,308 5.00%
Limitation of flexion, knee 744,191 5.00%
Scars, general 582,998 3.92%
Post-traumatic stress disorder 512,732 3.44%
Limitation of motion of the ankle 474,662 3.19%
Migraine 430,810 2.89%
Degenerative arthritis of the spine 371,989 2.50%
Hearing loss 355,424 2.39%
Eczema 312,024 2.10%
Total most prevalent Gulf War Era disabilities All Gulf War Era disabilities
5,474,068 14,889,302
36.77%

Com
pens
atio
n –
Page
41
of 5
2
Veterans BenefitsAdministration
U.S. Departmentof Veterans Affairs
Most prevalent SC disabilities of all compensation recipients
Period of service Disability Total number
% of POS disabilities
Peacetime
Tinnitus 233,360 9.23%
Hearing loss 200,615 7.94%
Scars, general 111,313 4.40%
Lumbosacral or cervical strain 91,821 3.63%
Limitation of flexion, knee 77,610 3.07%
Impairment of the knee, general 72,804 2.88%
Paralysis of the sciatic nerve 70,829 2.80%
Limitation of motion of the ankle 56,923 2.25%
Hypertensive vascular disease 50,278 1.99%
Degenerative arthritis of the spine 50,064 1.98%
Total most prevalent Peacetime disabilities All Peacetime disabilities
1,015,617 2,528,136
40.17%
Number of SC disabilities of new compensation recipients by period of service
World War II
Korean Conflict
Vietnam Era Gulf War Era Peacetime
Periods Total
Disabilities 4,299 11,179 164,614 1,234,864 101,992 1,516,948
Number of SC disabilities of all compensation recipients by period of service
World War II
Korean Conflict
Vietnam Era Gulf War Era Peacetime
Periods Total
Disabilities 166,391 286,679 5,345,987 14,889,302 2,528,136 23,216,495
Average # of disabilities
per Veteran 2.41 2.45 3.83 6.73 3.34 5.10

Compensation – Page 42 of 52
Veterans BenefitsAdministration
U.S. Departmentof Veterans Affairs
GWOT Most Prevalent SC Disabilities by Gender
VA’s computer systems do not contain data that would allow us to attribute Veterans’ disabilities to a specific period of service or deployment. Therefore, GWOT is a subset defined by Veterans who filed a disability compensation claim at some point either prior to or following their GWOT deployment. VA cannot identify which of these Veterans filed claims for disabilities incurred during their actual overseas GWOT deployment.
Most prevalent SC disabilities of new GWOT compensation recipients
Disability Body system Male % Female % Total29 %Total
Tinnitus Auditory 39,273 8.1% 4,228 4.6% 44,185 7.6%
Limitation of flexion, knee Musculoskeletal 30,297 6.3% 4,985 5.5% 35,971 6.1%
Lumbosacral or cervical strain30 Musculoskeletal 26,024 5.4% 5,139 5.7% 31,764 5.4%
Limitation of motion of the
arm Musculoskeletal 27,324 5.7% 3,242 3.6% 31,223 5.3%
Post-traumatic stress disorder Mental 21,041 4.4% 3,135 3.4% 24,471 4.2%
Scars, general Skin 18,753 3.9% 3,599 4.0% 22,807 3.9%
Limitation of motion of the
ankle Musculoskeletal 18,869 3.9% 2,854 3.1% 22,182 3.8%
Migraine Neurological 14,092 2.9% 4,331 4.8% 18,818 3.2%
Eczema Skin 11,127 2.3% 2,097 2.3% 13,479 2.3%
Flatfoot, acquired Musculoskeletal 10,226 2.1% 2,275 2.5% 12,778 2.2%
Total most prevalent disabilities Total number of disabilities
217,026 482,656
44.96% 100%
35,885 90,949
39.46% 100%
257,678 585,063
44.04% 100%
29 Total most prevalent GWOT disabilities include 4,767 disabilities unidentifiable by gender. Total of all GWOT disabilities include 11,458 disabilities unidentifiable by gender. 30 VA is no longer evaluating Veterans who are New to the rolls under the discontinued disability types.

Com
pens
atio
n –
Page
43
of 5
2
Veterans BenefitsAdministration
U.S. Departmentof Veterans Affairs
31 Total most prevalent GWOT disabilities include 18,386 disabilities unidentifiable by gender. Total of all GWOT disabilities include 51,775 disabilities unidentifiable by gender. 32 The number of lumbosacral or cervical strain disabilities in this report includes disabilities which, in Annual Benefits Reports prior to FY 13, were counted under 5 discontinued disability names related to lumbosacral or cervical strain.
Most prevalent SC disabilities of all GWOT compensation recipients
Disability Body system Male % Female % Total31 %Total
Tinnitus Auditory 539,101 7.3% 49,464 4.0% 591,464 6.8%
Limitation of flexion, knee Musculoskeletal 402,379 5.4% 59,738 4.8% 464,938 5.3%
Lumbosacral or cervical strain32
Musculoskeletal 364,927 4.9% 66,653 5.3% 434,164 5.0%
Post-traumatic stress disorder Mental 346,569 4.7% 40,536 3.3% 388,700 4.5%
Scars, general Skin 280,402 3.8% 50,999 4.1% 333,460 3.8%
Limitation of motion of the
ankle Musculoskeletal 252,136 3.4% 33,423 2.7% 287,376 3.3%
Migraine Neurological 211,992 2.9% 58,285 4.7% 272,082 3.1%
Degenerative arthritis of the
spine Musculoskeletal 204,798 2.8% 28,723 2.3% 234,688 2.7%
Sleep apnea syndromes
(obstructive, central, mixed)
Respiratory 178,654 2.4% 9,506 0.8% 189,125 2.2%
Hearing loss Auditory 175,747 2.4% 7,606 0.6% 184,027 2.1%
Total most prevalent disabilities Total number of disabilities
2,956,705 7,434,676
39.77% 100%
404,933 1,246,078
32.50% 100%
3,380,024 8,732,529
38.71% 100%

Compensation – Page 44 of 52
Veterans BenefitsAdministration
U.S. Departmentof Veterans Affairs
GWOT SC Disabilities by Body System and Gender
Number of SC disabilities of all GWOT compensation recipients
Body system Male Female Total33
Musculoskeletal 3,292,949 537,369 3,853,906
Skin 835,990 152,179 994,260
Neurological 725,997 140,981 872,165
Auditory 748,619 63,458 815,889
Mental 531,618 91,577 626,271
Respiratory 422,645 70,693 496,447
Digestive 319,182 55,658 377,128
Cardiovascular 201,732 28,988 232,006
Genitourinary 179,704 16,788 197,671
The Eye 83,306 16,579 100,575
Dental/ Oral 38,601 11,450 50,434
Endocrine 36,149 12,485 48,948
Gynecological 2,661 39,011 42,241
Hemic/ Lymphatic 8,821 6,716 15,671
Infection/ Immune/ Nutrition 6,702 2,146 8,917
Total 7,434,676 1,246,078 8,732,529
33 Total includes 51,775 disabilities unidentifiable by gender

Com
pens
atio
n –
Page
45
of 5
2
Veterans BenefitsAdministration
U.S. Departmentof Veterans Affairs
GWOT Three Most Prevalent SC Disabilities by Body System
Most prevalent SC disabilities of all GWOT compensation recipients
Body system Disability Total Number
% of body system
disabilities
Musculoskeletal
Limitation of flexion, knee 464,938 12.06%
Lumbosacral or cervical strain 434,164 11.27%
Limitation of motion of the ankle 287,376 7.46%
Total most prevalent musculoskeletal disabilities All musculoskeletal disabilities
1,186,478 3,853,906
30.79%
Skin
Scars, general 333,460 33.54%
Eczema 183,272 18.43%
Scars, superficial (tender) 129,740 13.05%
Total most prevalent skin disabilities All skin disabilities
646,472 994,260
65.02%
Neurological
Migraine 272,082 31.20%
Paralysis of the sciatic nerve 166,333 19.07%
Brain disease due to trauma 77,534 8.89%
Total most prevalent neurological disabilities All neurological disabilities
515,949 872,165
59.16%
Auditory
Tinnitus 591,464 72.49%
Hearing loss 184,027 22.56%
Labyrinthitis 18,032 2.21%
Total most prevalent auditory disabilities All auditory disabilities
793,523 815,889
97.26%
Mental
Post-traumatic stress disorder 388,700 62.07%
Major depressive disorder 63,548 10.15%
Anxiety disorder, unspecified 44,441 7.10%
Total most prevalent mental disabilities All mental disabilities
496,689 626,271
79.31%

Compensation – Page 46 of 52
Veterans BenefitsAdministration
U.S. Departmentof Veterans Affairs
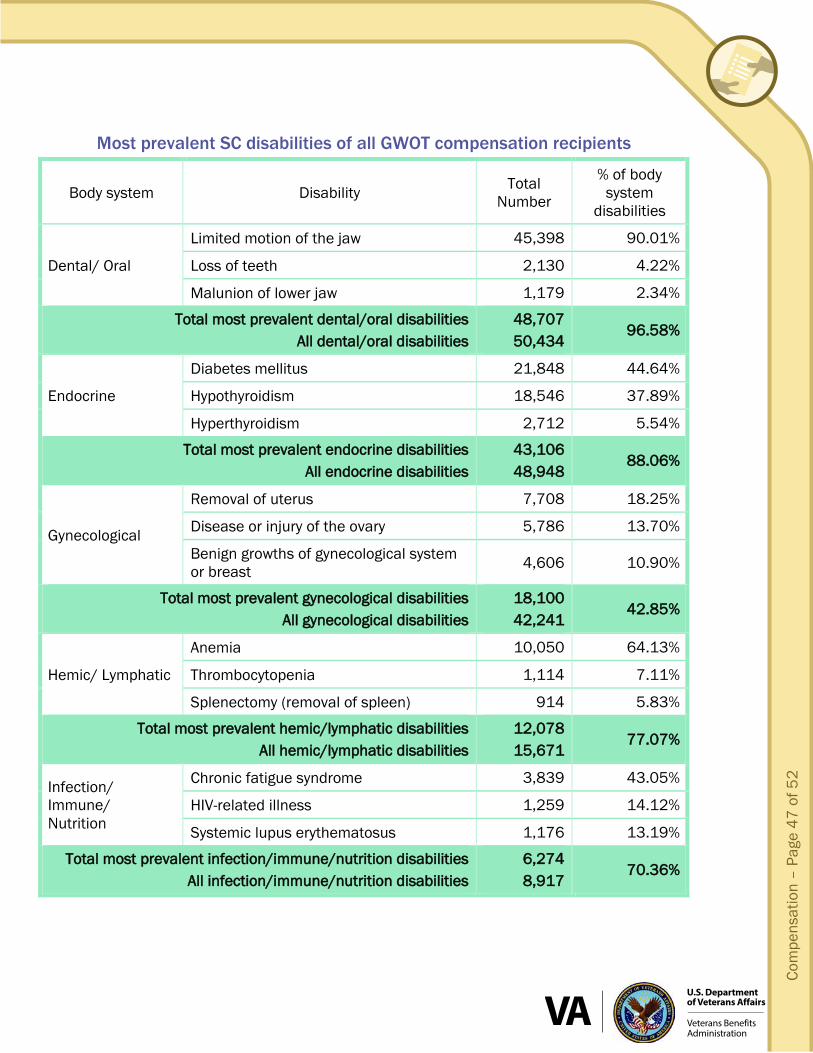
GWOT Three Most Prevalent SC Disabilities by Body System (Continued)
Most prevalent SC disabilities of all GWOT compensation recipients
Body system Disability Total Number
% of body system
disabilities
Respiratory
Sleep apnea syndromes (obstructive, central, mixed) 189,125 38.10%
Allergic rhinitis 142,195 28.64%
Bronchial asthma 47,030 9.47%
Total most prevalent respiratory disabilities All respiratory disabilities
378,350 496,447
76.21%
Digestive
Hiatal hernia 165,727 43.94%
Hemorrhoids 81,885 21.71%
Irritable bowel syndrome 44,328 11.75%
Total most prevalent digestive disabilities All digestive disabilities
291,940 377,128
77.41%
Cardiovascular
Hypertensive vascular disease 153,143 66.01%
Varicose veins 23,230 10.01%
Residuals of cold injury 8,554 3.69%
Total most prevalent cardiovascular disabilities All cardiovascular disabilities
184,927 232,006
79.71%
Genitourinary
Penile deformity (loss of erectile power) 92,158 46.62%
Nephrolithiasis (kidney stones) 19,206 9.72%
Prostate gland injuries 15,865 8.03%
Total most prevalent genitourinary disabilities All genitourinary disabilities
127,229 197,671
64.36%
The Eye
Loss of 1 eye; vision 20/40 in other 20,817 20.70%
Conjunctivitis, chronic 13,364 13.29%
Impairment to field of vision 8,456 8.41%
Total most prevalent eye related disabilities All eye related disabilities
42,637 100,575
42.39%
Com
pens
atio
n –
Page
47
of 5
2
Veterans BenefitsAdministration
U.S. Departmentof Veterans Affairs
Most prevalent SC disabilities of all GWOT compensation recipients
Body system Disability Total Number
% of body system
disabilities
Dental/ Oral
Limited motion of the jaw 45,398 90.01%
Loss of teeth 2,130 4.22%
Malunion of lower jaw 1,179 2.34%
Total most prevalent dental/oral disabilities All dental/oral disabilities
48,707 50,434
96.58%
Endocrine
Diabetes mellitus 21,848 44.64%
Hypothyroidism 18,546 37.89%
Hyperthyroidism 2,712 5.54%
Total most prevalent endocrine disabilities All endocrine disabilities
43,106 48,948
88.06%
Gynecological
Removal of uterus 7,708 18.25%
Disease or injury of the ovary 5,786 13.70%
Benign growths of gynecological system or breast 4,606 10.90%
Total most prevalent gynecological disabilities All gynecological disabilities
18,100 42,241
42.85%
Hemic/ Lymphatic
Anemia 10,050 64.13%
Thrombocytopenia 1,114 7.11%
Splenectomy (removal of spleen) 914 5.83%
Total most prevalent hemic/lymphatic disabilities All hemic/lymphatic disabilities
12,078 15,671
77.07%
Infection/ Immune/ Nutrition
Chronic fatigue syndrome 3,839 43.05%
HIV-related illness 1,259 14.12%
Systemic lupus erythematosus 1,176 13.19%
Total most prevalent infection/immune/nutrition disabilities All infection/immune/nutrition disabilities
6,274 8,917
70.36%
Compensation – Page 48 of 52
Veterans BenefitsAdministration
U.S. Departmentof Veterans Affairs
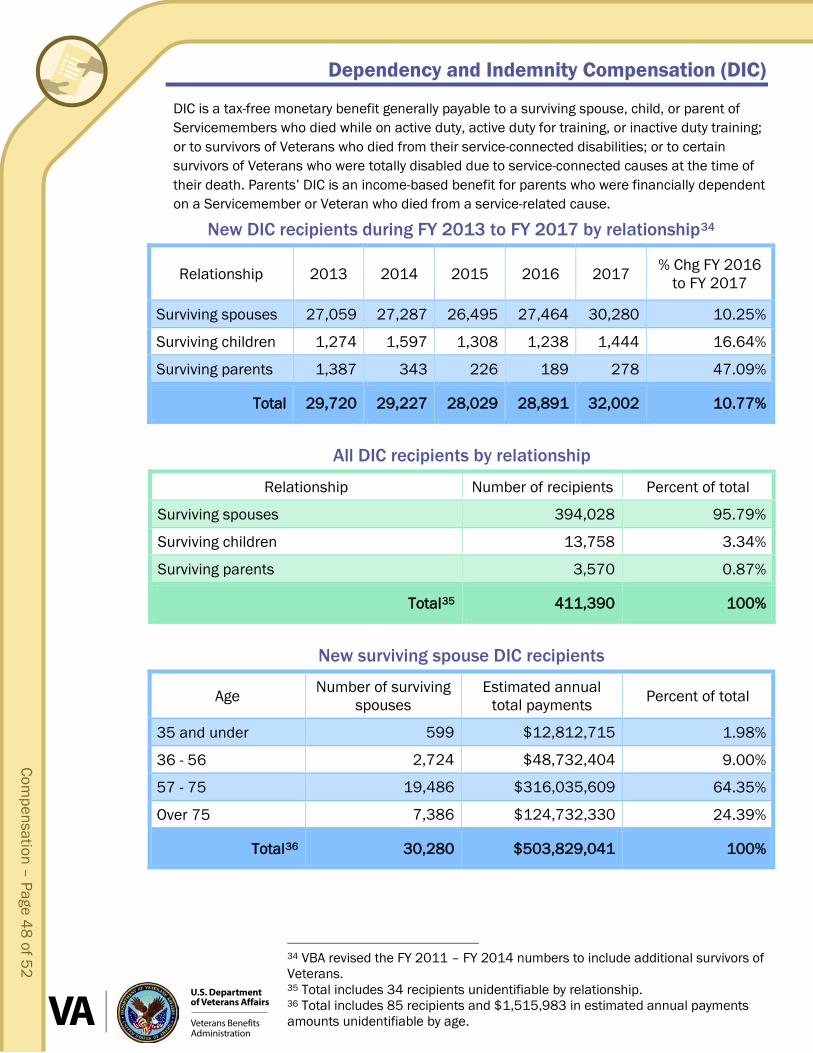
Dependency and Indemnity Compensation (DIC)
DIC is a tax-free monetary benefit generally payable to a surviving spouse, child, or parent of Servicemembers who died while on active duty, active duty for training, or inactive duty training; or to survivors of Veterans who died from their service-connected disabilities; or to certain survivors of Veterans who were totally disabled due to service-connected causes at the time of their death. Parents’ DIC is an income-based benefit for parents who were financially dependent on a Servicemember or Veteran who died from a service-related cause.
New DIC recipients during FY 2013 to FY 2017 by relationship34
Relationship 2013 2014 2015 2016 2017 % Chg FY 2016 to FY 2017
Surviving spouses 27,059 27,287 26,495 27,464 30,280 10.25%
Surviving children 1,274 1,597 1,308 1,238 1,444 16.64%
Surviving parents 1,387 343 226 189 278 47.09%
Total 29,720 29,227 28,029 28,891 32,002 10.77%
All DIC recipients by relationship
Relationship Number of recipients Percent of total
Surviving spouses 394,028 95.79%
Surviving children 13,758 3.34%
Surviving parents 3,570 0.87%
Total35 411,390 100%
New surviving spouse DIC recipients
Age Number of surviving spouses
Estimated annual total payments Percent of total
35 and under 599 $12,812,715 1.98%
36 - 56 2,724 $48,732,404 9.00%
57 - 75 19,486 $316,035,609 64.35%
Over 75 7,386 $124,732,330 24.39%
Total36 30,280 $503,829,041 100%
34 VBA revised the FY 2011 – FY 2014 numbers to include additional survivors of Veterans. 35 Total includes 34 recipients unidentifiable by relationship. 36 Total includes 85 recipients and $1,515,983 in estimated annual payments amounts unidentifiable by age.
Com
pens
atio
n –
Page
49
of 5
2
Veterans BenefitsAdministration
U.S. Departmentof Veterans Affairs
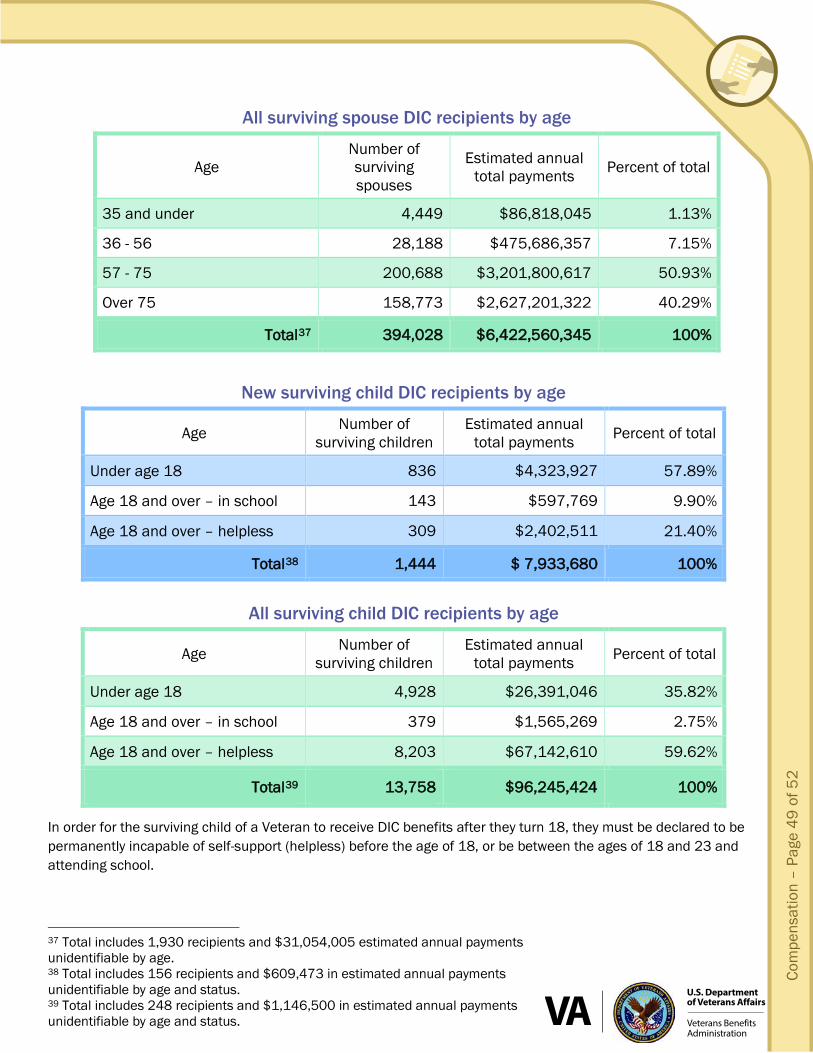
New surviving child DIC recipients by age
Age Number of surviving children
Estimated annual total payments Percent of total
Under age 18 836 $4,323,927 57.89%
Age 18 and over – in school 143 $597,769 9.90%
Age 18 and over – helpless 309 $2,402,511 21.40%
Total38 1,444 $ 7,933,680 100%
All surviving child DIC recipients by age
Age Number of surviving children
Estimated annual total payments Percent of total
Under age 18 4,928 $26,391,046 35.82%
Age 18 and over – in school 379 $1,565,269 2.75%
Age 18 and over – helpless 8,203 $67,142,610 59.62%
Total39 13,758 $96,245,424 100%
In order for the surviving child of a Veteran to receive DIC benefits after they turn 18, they must be declared to be permanently incapable of self-support (helpless) before the age of 18, or be between the ages of 18 and 23 and attending school.
37 Total includes 1,930 recipients and $31,054,005 estimated annual payments unidentifiable by age. 38 Total includes 156 recipients and $609,473 in estimated annual payments unidentifiable by age and status. 39 Total includes 248 recipients and $1,146,500 in estimated annual payments unidentifiable by age and status.
All surviving spouse DIC recipients by age
Age Number of surviving spouses
Estimated annual total payments Percent of total
35 and under 4,449 $86,818,045 1.13%
36 - 56 28,188 $475,686,357 7.15%
57 - 75 200,688 $3,201,800,617 50.93%
Over 75 158,773 $2,627,201,322 40.29%
Total37 394,028 $6,422,560,345 100%
Compensation - Page 50 of 52
Veterans BenefitsAdministration
U.S. Departmentof Veterans Affairs
Appendix
VBA Regional Office Addresses
Anchorage AK VA Regional Office 1201 North Muldoon Road Anchorage, AK 99504
Montgomery AL VA Regional Office 345 Perry Hill Road Montgomery, AL 36109-3798
Little Rock AR VA Regional Office 2200 Fort Roots Drive, Building 65 North Little Rock, AR 72114-1756
Phoenix AZ VA Regional Office 3333 North Central Avenue Phoenix, AZ 85012-2405
Oakland CA VA Regional Office Ronald V. Dellums Federal Building 1301 Clay Street – Suite 1400N Oakland, CA 94612-5209
San Diego CA VA Regional Office 8810 Rio San Diego Drive San Diego, CA 92108-1508
Los Angeles CA VA Regional Office Federal Building 11000 Wilshire Boulevard Los Angeles, CA 90024-3602
Denver CO VA Regional Office 155 Van Gordon Street Denver, CO 80228
Hartford CT VA Regional Office 555 Willard Avenue, Building 2E – Room 5137 Newington, CT 06111-2693 Mailing Address: P.O. Box 310909 Newington, CT 06131
Wilmington DE VA Regional Office 1601 Kirkwood Highway Wilmington, DE 19805
St. Petersburg FL VA Regional Office 9500 Bay Pines Boulevard St. Petersburg, FL 33708 Mailing Address: P.O. Box 1437 St. Petersburg, FL 33731
Atlanta GA VA Regional Office 1700 Clairmont Road Atlanta, GA 30033-4032 Mailing Address: P.O. Box 100026 Decatur, GA 30031-7026
Honolulu HI VA Regional Office 459 Patterson Road, East Wing Honolulu, HI 96819
Des Moines IA VA Regional Office 210 Walnut Street – Room 1063 Des Moines, IA 50309-9825
Boise ID VA Regional Office 444 West Fort Street Boise, ID 83702
Chicago IL VA Regional Office 2122 W. Taylor Street Chicago, IL 60612
Indianapolis IN VA Regional Office 575 North Pennsylvania Street Indianapolis, IN 46204-1526
Wichita KS VA Regional Office Robert J. Dole Regional Office 5500 E. Kellogg Avenue Wichita, KS 67218-1698
Louisville KY VA Regional Office 321 West Main Street, Suite 390 Louisville, KY 40202-3835
New Orleans LA VA Regional Office 1250 Polydras Street, Rm 200 New Orleans, LA 70113-2692
Boston MA VA Regional Office John F. Kennedy Building Government Center – Room 1265 Boston, MA 02203-0393
Baltimore MD VA Regional Office Federal Building 31 Hopkins Plaza – Room 233 Baltimore, MD 21201-0001
Togus ME VA Regional Office One VA Center Augusta, ME 04330-6795

Com
pens
atio
n - P
age
51 o
f 52
Veterans BenefitsAdministration
U.S. Departmentof Veterans Affairs
Detroit MI VA Regional Office Patrick V. McNamara Federal Building 477 Michigan Avenue – Room 1400 Detroit, MI 48226-2591
St. Paul MN VA Regional Office Bishop Henry Whipple Federal Building One Federal Drive – Fort Snelling St. Paul, MN 55111-4050
St. Louis MO Records Mgmt. Center 4300 Goodfellow Boulevard Building 104 St. Louis, MO 63120-8950
St. Louis MO VA Regional Office 9700 Page Avenue St. Louis, MO 63103
Jackson MS VA Regional Office 1600 East Woodrow Wilson Avenue Jackson, MS 39216
Ft. Harrison MT VA Regional Office 3633 Veterans Drive Ft. Harrison, MT 59636
Winston-Salem NC VA Regional Office Federal Building 251 North Main Street Winston-Salem, NC 27155-1000
Fargo ND VA Regional Office 2101 Elm Street Fargo, ND 58102
Lincoln NE VA Regional Office 3800 Village Drive Lincoln, NE 68516-4198 Mailing Address: P.O. Box 85816 Lincoln, NE 68501-5816
Manchester NH VA Regional Office Norris Cotton Federal Building 275 Chestnut Street Manchester, NH 03101
Newark NJ VA Regional Office 20 Washington Place Newark, NJ 07102-3174
Albuquerque NM VA Regional Office 500 Gold Avenue, South West Albuquerque, NM 87102-3118
Reno NV VA Regional Office 5460 Reno Corporate Drive Reno, NV 89511
Buffalo NY VA Regional Office 130 South Elmwood Avenue Buffalo, NY 14202-2478
New York NY VA Regional Office 245 W. Houston Street New York, NY 10014-4805
Cleveland OH VA Regional Office Anthony J. Celebrezze Federal Building 1240 East 9th Street Cleveland, OH 44199-2001
Muskogee OK VA Regional Office Federal Building 125 South Main Street Muskogee, OK 74401-7025
Portland OR VA Regional Office 100 SW Main Street, Floor 2 Portland, OR 97204-2998 Mailing Address: 100 SW Main St FL 2 Portland, OR 97204
Philadelphia PA VA Regional Office 5000 Wissahickon Avenue Philadelphia, PA 19144 Mailing Address: P.O. Box 8079 Philadelphia, PA 19101
Pittsburgh PA VA Regional Office 1000 Liberty Avenue Pittsburgh, PA 15222-4004
San Juan PR VA Regional Office 50 Carr 165 Guaynabo San Juan, PR 00968-8024
Providence RI VA Regional Office 380 Westminster Street Providence, RI 02903-3246
Columbia SC VA Regional Office 6437 Garners Ferry Road Columbia, SC 29209-2495
Sioux Falls SD VA Regional Office 2501 West 22nd Street Sioux Falls, SD 57105
Compensation - Page 52 of 52
Veterans BenefitsAdministration
U.S. Departmentof Veterans Affairs
Nashville TN VA Regional Office 110 Ninth Avenue, South Nashville, TN 37203-3817
Houston TX VA Regional Office 6900 Almeda Road Houston, TX 77030-4200
Waco TX VA Regional Office One Veterans Plaza 701 Clay Avenue Waco, TX 76799-0001
Salt Lake City UT VA Regional Office 550 Foothill Drive Salt Lake City, UT 84113
Roanoke VA VA Regional Office 210 Franklin Rd, SW Roanoke, VA 24011
White River Junction VT VA Regional Office 215 North Main Street White River Junction, VT 05001
Seattle WA VA Regional Office Federal Building 915 Second Avenue, Room 1392 Seattle, WA 98174-1060
Milwaukee WI VA Regional Office 5400 W. National Avenue Milwaukee, WI 53214
Huntington WV VA Regional Office 640 Fourth Avenue Huntington, WV 25701-1340
Cheyenne WY VA Benefits Office 2360 E. Pershing Blvd. Cheyenne, WY 82001-5356 The above address is the Cheyenne benefits office. The Denver regional office processes claims for the state of Wyoming.
Manila VA Regional Office U.S. Embassy 1501 Roxas Blvd Pasay City, Philippines 1302 Mailing Address: PSC 501 DPOAP 96515
District Offices
North Atlantic PA District 5000 Wissahickon Avenue Philadelphia, PA 19144
Southeast District TN 3322 West End, Suite 408 Nashville, TN 37203
Midwest District MO 9700 Page Avenue, Suite 301 St. Louis, MO 63132
Pacific District AZ 3333 North Central Avenue, Suite 3026 Phoenix, AZ 85012-2402
Continental District CO 155 Van Gordon Street Lakewood, CO 80228
Centralized Mail Address
SMS Janesville Facility – Centralized Mail Department of Veterans Affairs Claims Intake Center P.O. Box 5235 Janesville, WI 53547-5235
Contact Information
Compensation Information: 1-800-827-1000
Vets.gov www.vets.gov
Department of Veterans Affairs home page www.va.gov
Veterans Benefits Administration home page benefits.va.gov
eBenefits (Online forms and applications) ebenefits.va.gov
Compensation home page benefits.va.gov/compensation


![Veterans Benefits: Compensation & · PDF file[VETERANS BENEFITS: COMPENSATION & PENSION] ... Osteitis deformans (Paget’s disease). Osteomalacia. Palsy, bulbar. Paralysis agitans](https://img.dokumen.tips/doc/110x75/5a7353817f8b9aa2538e908e/veterans-benefits-compensation-pensioncymcdncomsites-veterans-benefits.jpg)