Embed Size (px)
Citation preview

COMPENSATION METHODS FOR QUASI-STATIC
ACCELERATION SENSITIVITY OF MEMS GYROSCOPES
A THESIS SUBMITTED TO
THE GRADUATE SCHOOL OF NATURAL AND APPLIED SCIENCES
OF
MIDDLE EAST TECHNICAL UNIVERSITY
BY
HASAN DOĞAN GAVCAR
IN PARTIAL FULFILLMENT OF THE REQUIREMENTS
FOR
THE DEGREE OF MASTER OF SCIENCE
IN
ELECTRICAL AND ELECTRONICS ENGINEERING
NOVEMBER 2014

ii

iii
Approval of the thesis:
COMPENSATION METHODS FOR QUASI-STATIC
ACCELERATION SENSITIVITY OF MEMS GYROSCOPES
submitted by HASAN DOĞAN GAVCAR in partial fulfillment of the requirements
for the degree of Master of Science in Electrical and Electronics Engineering
Department, Middle East Technical University by,
Prof. Dr. Gülbin Dural
Dean, Graduate School of Natural and Applied Sciences
Prof. Dr. Gönül Turhan Sayan
Head of Department, Electrical and Electronics Eng.
Prof. Dr. Tayfun Akın
Supervisor, Electrical and Electronics Eng. Dept., METU
Assist. Prof. Dr. Kıvanç Azgın
Co-Supervisor, Mechanical Eng. Dept., METU
Examining Committee Members
Assoc. Prof. Dr. Haluk Kulah
Electrical and Electronics Eng. Dept., METU
Prof. Dr. Tayfun Akın
Electrical and Electronics Eng. Dept., METU
Assist. Prof. Dr. Kıvanç Azgın
Mechanical Eng. Dept., METU
Dr. Fatih Koçer
Electrical and Electronics Eng. Dept., METU
Dr. Said Emre Alper
MEMS Research and Application Center, METU
Date:

iv
I hereby declare that all information in this document has been obtained and
presented in accordance with academic rules and ethical conduct. I also declare
that, as required by these rules and conduct, I have fully cited and referenced
all referenced material and results that are not original to this work.
Name, Surname: Hasan Doğan Gavcar
Signature:

v
ABSTRACT
COMPENSATION METHOS FOR QUASI-STATIC
ACCELERATION SENSITIVITY OF MEMS GYROSCOPES
Gavcar, Hasan Doğan
M.S., Department of Electrical and Electronics Engineering
Supervisor: Prof. Dr. Tayfun Akın
Co-supervisor: Assist. Prof. Dr. Kıvanç Azgın
November 2014, 122 pages
This thesis presents the quasi-static acceleration compensation methods for a fully
decoupled MEMS gyroscope. These methods are based on the utilization of the
amplitude difference information between the residual quadrature signals on the
differential sense mode electrodes to sense the static acceleration acting on the sense
mode of the gyroscope. There are three different quasi-static acceleration
compensation methods presented in this thesis. In the first method, the static
acceleration is measured by comparing the amplitudes of the out of phase sustained
residual quadrature signals. By using the experimental relation between the rate and
acceleration outputs, the quasi-static acceleration sensitivity of the gyroscope is
mitigated. This method requires the additional process of data collection. In the
second method, in addition to the circuit proposed in the first method, a closed loop
controller is implemented in the acceleration compensation system to suppress the
effect of the acceleration. The generated feedback voltage is applied to the sense
mode electrodes by using the non-inverting inputs of the sense mode preamplifiers.

vi
The advantage of this method compared to the first one is that it does not require any
additional data process thanks to the closed loop controller. However, this method
cannot completely suppress the quasi-static acceleration of the gyroscope. Moreover,
changing the voltage of the non-inverting inputs of the preamplifiers may affect the
operation of all other control loops. In the third method, the additional acceleration
cancellation electrodes are utilized in the mechanical design of the gyroscope. This
method overcomes the problems encountered in the second acceleration
compensation method. This study mainly focuses on the third acceleration
compensation method which provides the best result. Therefore, a single-mass fully
decoupled gyroscope including the dedicated acceleration cancellation electrodes is
designed. FEM simulations are performed to determine the mode shapes and mode
resonance frequencies of the designed gyroscope. The designed gyroscopes are
fabricated using the modified silicon-on-glass (SOG) process and are packaged at the
wafer level. The closed loop controllers are designed for the drive amplitude control,
force-feedback, quadrature cancellation, and acceleration cancellation loops and are
implemented on a printed circuit board (PCB). The acceleration compensation
system consisting of vacuum packaged gyroscope and controller modules is
populated on the same PCB, and the system level tests are performed.
Measurements show that the proposed acceleration compensation system operates as
expected. Test results demonstrate that the g-sensitivity of the studied gyroscopes are
substantially reduced from 0.31°/s/g to 0.025°/s/g, and the effect of the static
acceleration is highly-suppressed up to 12 times with the use of the third
compensation method proposed in this work. Moreover, the nonlinearity in the scale
factor is improved from 0.53% to 0.36% for +/-600°/s range for centrifugal
accelerations as much as 0.5g. Furthermore, the proposed acceleration compensation
methods do not deteriorate the bias and noise performances of the gyroscopes.
To conclude, the proposed acceleration compensation methods improves the
g-sensitivity of MEMS gyroscope by using the control electronics rather than
employing complex mechanical design.
Keywords: MEMS Gyroscope, Acceleration Sensitivity, G-Sensitivity, Acceleration
Sensitivity Compensation Techniques, MEMS Fabrication.

vii
ÖZ
MEMS DÖNÜÖLÇERİN DURAĞAN İVME DUYARLILIĞINI
AZALTMA YÖNTEMLERİ
Gavcar, Hasan Doğan
Yüksek Lisans, Elektrik ve Elektronik Mühendisliği Bölümü
Tez Yöneticisi: Prof. Dr. Tayfun Akın
Ortak Tez Yöneticisi: Assist. Prof. Dr. Kıvanç Azgın
Kasım 2014, 122 sayfa
Bu tez, literatürde ilk defa, bir MEMS dönüölçerin okuma parmak yapıları
üzerindeki zıt fazlı artık ofset hatası sinyallerinin genliklerini karşılaştırarak
dönüölçerin okuma eksenine etkiyen ivmeyi algılamaya dayalı dönüölçerin durağan
ivme duyarlılığını azaltma yöntemleri sunmaktadır. Bu çalışmada, üç farklı g-
duyarlılığı düzeltme yöntemi önerilir. İlk yöntemde, zıt fazlı artık ofset hatası
sinyallerinin genlik farkına bakarak dönüölçerin okuma eksenine etkiyen ivmeyi
algılayan bir ivme algılama devresi kullanılır. Test sırasında, dönüölçerin ivme ve
dönü verileri eş zamanlı olarak toplanır. Daha sonra bu iki veri arasındaki ilişki
kurularak, ivmenin dönü çıkışı üzerindeki etkisi bilgisayar ortamında düzeltilir.
İkinci yöntemde, birinci yöntemde önerilen devreye ek olarak kapalı-döngü kontrol
devresi eklenir. Bu yöntemde, okuma önelektroniğindeki yükselticilerin pozitif girişi
vasıtasıyla okuma parmak yapılarına geri besleme uygulanır. Bu yöntemde amaç,
dönüölçerin durağan ivmeye olan duyarlılığını dönüölçerin çalışması sırasında
azaltmaktır. Bu yöntem, dönüölçerin g-duyarlılığını belli bir noktaya kadar

viii
azaltmasına rağmen, ivme algılama yönteminin çalışma prensibinden dolayı bu
hatayı tamamen ortadan kaldıramamaktadır. Ayrıca, okuma parmak yapılarına geri
besleme uygulamak, diğer kontrol devrelerinin de çalışmasını etkilemektedir. İkinci
yöntemde belirtilen sorunları çözmek için, üçüncü yöntemde ivmenin etkisini
ortadan kaldırmak için geri besleme, özelleşmiş ivme durdurma parmak yapılarına
uygulanır. Bu yöntem, algılama eksenine etkiyen ivme kuvvetini durdurmak için özel
olarak tasarlanmış ivme durdurma parmak yapılarının kullanımını gerektirir. Bu
çalışmada, özellikle son yöntem üzerinde yoğunlaşılmıştır. Bu sebeple, özel ivme
durdurma parmak yapıları içeren tek kütleli, tamamen etkileşimsiz bir dönüölçer
tasarlanmıştır. Tasarlanan dönüölçerin mod analizi ve rezonans frekansları, sonlu
eleman analiz yöntemi kullanılarak belirlenmiştir. Bu dönüölçerler, değiştirilmiş
SOG üretim tekniği ve pul seviyesinde paketleme yöntemi kullanılarak üretilmiştir.
Bir sonraki adımda, sürüş genlik kontrol, güç geri besleme, ofset giderme ve ivme
duyarlılığı azaltma işlemleri için kapalı döngü kontrol devreleri tasarlanmıştır. Bu
devreler, duyarga paketi ile bir baskı devre kartı (PCB) üzerinde birleştirilmiş ve
sistem seviyesinde testler yürütülmüştür.
Testler, önerilen durağan ivme duyarlılığı azaltma yöntemlerinin istenilen şekilde
çalışmakta olduğunu göstermiştir. Test sonuçları, önerilen üçüncü ivme duyarlılığı
azaltma devre yapısını kullanarak, çalışılan MEMS dönüölçerin g-duyarlılığının
0.31°/s/g ‘den 0.025°/s/g ’e düştüğünü ve durağan ivmenin etkisinin 12 kata kadar
azaldığını göstermektedir. Ayrıca, dönüölçerin orantı katsayısındaki doğrusalsızlık,
+/-600°/s sınırındaki merkezkaç ivme testi için önerilen yöntem ile 0.53%’den
0.36%’a düşmektedir. Bunun dışında, önerilen ivme duyarlılığı azaltma yöntemin
dönüölçerin performansını kötüleştirecek yönde bir etkisi olmadığı gözlemlenmiştir.
Sonuç olarak, önerilen durağan ivme duyarlılığı azaltma yöntemleri, karmaşık yapılı
mekanik tasarımlar gerektirmeden, dönüölçerin kontrol elektroniğini değiştirerek
sensörün durağan ivmeye olan duyarlılığını sensörün çalışma sırasında azaltmaktadır.
Anahtar Kelimeler: MEMS Dönüölçer, İvme Duyarlılığı, G-Duyarlılığı, İvme
Duyarlılığı Azaltma Yöntemleri, MEMS Üretimi.

ix
To My Family

x
ACKNOWLEDGEMENTS
First of all, I would like thank to my thesis advisor Prof. Dr. Tayfun Akın for his
support, guidance, and encouragement during my graduate studies. It is a great
chance for me to work in his MEMS research group.
I also would like to thank to Assist. Prof. Kıvanç Azgın and Dr. Said Emre Alper for
sharing their deep knowledge and experiences in all phases of this research. Without
their guidance and helps, this study could not exist.
I would like to express my gratitude to M. Mert Torunbalcı, the master of process,
for his worthy helps during gyroscope fabrication and endless discussions about life.
Special thanks to Soner Sönmezoğlu, my smart research partner, for his valuable
suggestions and helps in tests of the acceleration compensation system. I would like
also thank Ferhat Yeşil, the master of readout, for his valuable discussions and
suggestions during the design of the control electronics.
I would like to express my gratitude to Gülşah Demirhan, Yunus Terzioğlu, Ulaş
Aykutlu, Serdar Tez, and Talha Köse for their helps in the fabrication phases of this
study and fruitful discussions about the controller electronic design. I am very
grateful to METU-MEMS center staff for their helps during the gyroscope
fabrication, especially Orhan Şevket Akar. Special thanks to Selçuk Keskin, Ozan
Ertürk, Ramazan Çetin, Başak Kebapçı and Osman Aydın for their friendship.
Moreover, I would like to thank all members of the METU-MEMS VLSI research
group for providing a nice research environment.
I would express my deepest gratitude to my parents for their endless support, love
and encouragement throughout my whole life.

xi
TABLE OF CONTENTS
ABSTRACT ................................................................................................................. v
ÖZ .............................................................................................................................. vii
ACKNOWLEDGEMENTS ......................................................................................... x
TABLE OF CONTENTS ............................................................................................ xi
LIST OF FIGURES .................................................................................................. xiv
LIST OF TABLES .................................................................................................... xix
CHAPTERS
1 INTRODUCTION ................................................................................................ 1
1.1 Operation Principle of MEMS Vibratory Gyroscopes .................................. 3
1.2 Metrics of MEMS Gyroscopes and Their Application Areas ....................... 4
1.3 Overview of the Micromachined Vibratory Gyroscopes .............................. 7
1.4 Gyroscopes Studied in This Thesis ............................................................... 9
1.5 Overview of Acceleration Sensitivity of MEMS Gyroscope and
Compensation Techniques ..................................................................................... 12
1.6 Research Objectives and Thesis Organization ............................................ 14
2 VIBRATORY GYROSCOPE THEORY AND MODELLING ......................... 17
2.1 Mechanical Model of the Gyroscope .......................................................... 17
2.1.1 Drive Mode Dynamics ............................................................................ 19
2.1.2 Coriolis Coupling and Sense Mode Dynamics ....................................... 20
2.2 Design of MEMS Vibratory Gyroscope and Model Parameters ................. 23
2.2.1 Mechanical Spring Constant Estimation ................................................. 23
2.2.2 Mass and Damping Factor Estimation .................................................... 24

xii
2.3 Electrostatic Actuation Using Parallel Plate Capacitor ............................... 24
2.4 Capacitive Sensing ...................................................................................... 25
2.5 Electrostatic Spring Effect ........................................................................... 26
2.6 Quasi-static Acceleration Sensitivity........................................................... 27
2.6.1 Effect of Static Acceleration on the Sense-Mode Electrodes ................. 28
2.6.2 Effect of Static Acceleration on the Force-feedback Electrodes ............ 30
2.6.3 Effect of Static Acceleration on the Quadrature Cancellation Electrodes
and Sense Mode Springs ..................................................................................... 32
2.6.4 Design of Acceleration Cancellation Electrodes ..................................... 34
2.7 Finite-Element Simulations ......................................................................... 36
2.7.1 Modal Analysis ....................................................................................... 36
2.8 Summary ...................................................................................................... 39
3 CONTROL ELECTRONICS FOR MEMS GYROSCOPES ............................. 41
3.1 Front-End Electronics .................................................................................. 41
3.2 Drive Mode Controller Design for MEMS Gyroscope ............................... 43
3.3 Design of Closed Loop Rate Sensing Mechanism ...................................... 51
3.4 Design of Quadrature Control Electronics .................................................. 58
3.5 Design of Acceleration Sensing and Compensation Electronics ................. 64
3.5.1 Open Loop Acceleration Compensation Electronics .............................. 65
3.5.2 Closed Loop Acceleration Cancellation Electronics Using Sense Mode
Electrodes ............................................................................................................ 69
3.5.3 Closed Loop Acceleration Cancellation Electronics Using Acceleration
Cancellation Electrodes ....................................................................................... 73
4 FABRICATION OF MEMS GYROSCOPES .................................................... 77
4.1 Fabrication of Sensor Wafer Using Modified SOG (M-SOG) Process ....... 78
4.2 Wafer Level Hermetic Encapsulation of MEMS Gyroscopes using SOI Cap
Wafers with Vertical Feedthroughs ........................................................................ 82
4.3 Fabrication Results ...................................................................................... 85

xiii
4.4 Summary ..................................................................................................... 88
5 TEST RESULTS ................................................................................................. 89
5.1 Characterization and Test Procedure of Gyroscopes................................... 89
5.2 System Level Test Setup for the Acceleration and Performance Tests of the
Studied MEMS Gyroscopes ................................................................................... 92
5.3 Test Results of the Studied MEMS Gyroscopes for Static Acceleration
Tests ..................................................................................................................... 93
5.4 Test Results of the Studied MEMS Gyroscopes for Centrifugal Acceleration
Tests ................................................................................................................... 102
5.5 Test Results of the Studied MEMS Gyroscopes for Performance Tests ... 104
5.6 Summary ................................................................................................... 108
6 CONCLUSIONS AND FUTURE WORK ....................................................... 111
REFERENCES ......................................................................................................... 117

xiv
LIST OF FIGURES
FIGURES
Figure 1.1: Inertial frame showing Coriolis force. ....................................................... 3
Figure 1.2: A conceptual view of the vibratory gyroscope. ......................................... 4
Figure 1.3: Simplified view of the single-mass fully decoupled MEMS gyroscope
without the dedicated acceleration cancellation electrodes studied in the scope of this
thesis [30]. .................................................................................................................... 9
Figure 1.4: Simplified view of the single-mass fully decoupled MEMS gyroscope
with the dedicated acceleration cancellation electrodes studied in the scope of this
thesis. .......................................................................................................................... 11
Figure 2.1: Three basic decoupling mechanisms: (a) simplest decoupling
configuration with no special decoupling treatment, (b) improved decoupling
configuration and (c) fully-decoupled configuration. ................................................ 18
Figure 2.2: Conceptual view of the differential sense-mode electrodes under the
conditions of (a) zero and (b) static acceleration. The sense mode output current
increases in one side and decreases in the other under the static acceleration. .......... 29
Figure 2.3: Conceptual view of the force-feedback electrodes under the conditions of
(a) zero and (b) static acceleration. ............................................................................ 31
Figure 2.4: Conceptual view of the quadrature cancellation electrodes under the
conditions of (a) zero and (b) static acceleration. ...................................................... 33
Figure 2.5: Configuration of the acceleration cancellation electrodes. ...................... 34
Figure 2.6: Mode shape for drive mode. .................................................................... 37
Figure 2.7: Mode shape for sense mode. .................................................................... 38
Figure 2.8: Mode shape for the closest undesired higher order mode at 24.6 kHz. ... 38
Figure 3.1: Schematic of the transimpedance amplifier implemented in this study. . 42
Figure 3.2: Block diagram of the closed loop drive mode controller. ....................... 44
Figure 3.3: Simplified view of the drive mode resonance test schematic. ................. 45
Figure 3.4: Bode diagram of the drive mode open loop transfer function. ................ 48
Figure 3.5: Step response of the closed loop drive mode controller. ......................... 49

xv
Figure 3.6: SIMULINK model of the closed loop drive mode control electronics for
the sample gyroscope. ................................................................................................ 50
Figure 3.7: Drive pick signal obtained using the realistic SIMULINK model of the
drive mode control electronics. .................................................................................. 50
Figure 3.8: Block diagram of the closed loop sense mode controller for the mismatch
operation. .................................................................................................................... 52
Figure 3.9: Bode diagram of the sense mode open loop transfer function. ............... 54
Figure 3.10: Step response of the closed loop sense mode controller. ...................... 55
Figure 3.11: SIMULINK model of the closed loop sense mode control electronics for
the sample gyroscope. ................................................................................................ 56
Figure 3.12: Settling behavior of the gyroscope rate output in response to 1°/s
angular rate input........................................................................................................ 56
Figure 3.13: Transient behavior of the sense pick signal in response to 1°/s angular
rate input..................................................................................................................... 57
Figure 3.14: Response of the gyroscope rate output to a time varying rate which has
amplitude of 1°/s. ....................................................................................................... 58
Figure 3.15: Block diagram of the closed loop quadrature cancellation controller for
the mismatch operation. ............................................................................................. 59
Figure 3.16: Bode diagram of the open loop quadrature control electronics. ............ 61
Figure 3.17: Step response of the closed loop quadrature cancellation controller..... 61
Figure 3.18: SIMULINK model of the closed loop quadrature cancellation control
electronics for the sample gyroscope. ........................................................................ 62
Figure 3.19: Transient behavior of the sense pick signal in the presence of the
quadrature error and closed loop quadrature control electronics. .............................. 63
Figure 3.20: Applied quadrature force to suppress the quadrature error exists in the
system. ........................................................................................................................ 63
Figure 3.21: Block diagram of the acceleration sensing electronics for the mismatch
operation. .................................................................................................................... 65
Figure 3.22: SIMULINK model of the open loop acceleration sensing circuit with the
force-feedback and quadrature cancellation loops. .................................................... 67
Figure 3.23: Transient behavior of the acceleration output which is picked from the
low pass filter output of the acceleration sensing circuit as response to 1 g
acceleration using the first acceleration compensation method. ................................ 68

xvi
Figure 3.24: Transient behavior of the sense mode displacement which shifts when
the 1g acceleration is applied using the first acceleration compensation method. ..... 69
Figure 3.25: Block diagram of the closed loop acceleration cancellation electronics
which utilizes the sense mode electrodes for the generation of the acceleration
cancellation voltage for the mismatch operation. ....................................................... 70
Figure 3.26: SIMULINK model of closed loop acceleration compensation circuit
which utilizes the sense mode electrodes for the generation of the acceleration
cancellation voltage. ................................................................................................... 71
Figure 3.27: Transient behavior of the acceleration controller output as response to 1
g acceleration using the second acceleration compensation method. ....................... 72
Figure 3.28: Transient behavior of the sense mode displacement as response to 1 g
acceleration using the second acceleration compensation method. ........................... 72
Figure 3.29: Block diagram of the closed loop acceleration cancellation electronics
which employs the dedicated electrodes for the generation of the acceleration
cancellation voltage for the mismatch operation. ....................................................... 73
Figure 3.30: SIMULINK model of closed loop acceleration compensation circuit
which employs the dedicated electrodes for the generation of the acceleration
cancellation voltage. ................................................................................................... 74
Figure 3.31: Transient behavior of the acceleration controller output as response to 1
g acceleration using the third acceleration compensation method. ............................ 75
Figure 3.32: Transient behavior of the sense mode displacement for acceleration
compensation method. In this method, the closed loop controller completely
eliminates the effect of the static acceleration on the sense mode displacement. ...... 75
Figure 4.1: Empty glass wafer.................................................................................... 79
Figure 4.2: Anchor formation ..................................................................................... 79
Figure 4.3: Formation of the electrical interconnects ................................................ 80
Figure 4.4: Empty SOI wafer ..................................................................................... 80
Figure 4.5: Shallow etch on the device layer ............................................................. 80
Figure 4.6: Formation of the sensor structure ............................................................ 81
Figure 4.7: Anodic bonding of glass and SOI wafers ................................................ 81
Figure 4.8: Release of the device structure after anodic bonding .............................. 81
Figure 4.9: Empty SOI cap wafer ............................................................................... 82
Figure 4.10: Formation of the via openings on the handle layer............................... 83
Figure 4.11: Formation of the wire bonding pads ...................................................... 83

xvii
Figure 4.12: Formation of the vertical feedthroughs and sealing walls on the device
layer ............................................................................................................................ 83
Figure 4.13: Getter deposition.................................................................................... 84
Figure 4.14: Anodic/Eutectic bonding of cap wafer and sensor wafer for packaging84
Figure 4.15: Final view of the wafer level vacuum packaged sensor wafer .............. 84
Figure 4.16: SEM pictures of (a) double-folded, (b) half-folded, and (c) clamped
guided springs after the fabrication. ........................................................................... 85
Figure 4.17: SEM pictures of (a) sense, (b) quadrature, and (c) acceleration
cancellation electrodes after the fabrication. .............................................................. 86
Figure 4.18: SEM picture of the fabricated single-mass fully-decoupled gyroscope
including the acceleration cancellation electrodes. .................................................... 87
Figure 4.19: SEM picture of the cross sectional view of the packaged sensor. ......... 88
Figure 5.1: Resonance test set-up for the die level gyroscope test. ........................... 90
Figure 5.2: Gyroscope integrated with the front-end electronics on the hybrid glass
substrate...................................................................................................................... 91
Figure 5.3: Test setup for the system level tests. ....................................................... 93
Figure 5.4: (a) Schematic and (b) actual views of test setup for the static acceleration
tests on the rotation table............................................................................................ 94
Figure 5.5: Measured (blue one) and compensated (blue-dashed one) rate outputs,
and acceleration output (red one) as a function of the rotation angle for the gyroscope
(E02) using the compensation Method-1. .................................................................. 96
Figure 5.6: Rate outputs without (blue one) and with (blue-dashed one) acceleration
cancellation circuit, and acceleration controller output (red one) as a function of the
rotation angle for the gyroscope (H02) using the compensation Method-2............... 97
Figure 5.7: Rate outputs without (blue one) and with (blue-dashed one) acceleration
cancellation circuit, and acceleration controller output (red one) as a function of the
rotation angle for the gyroscope (0803) using the compensation Method-3. ............ 99
Figure 5.8: Rate outputs without (blue one) and with (blue-dashed one) acceleration
cancellation circuit, and acceleration controller output (red one) as a function of the
rotation angle for the gyroscope (1207) using the compensation Method-3. ............ 99
Figure 5.9: G-sensitivity of the gyroscope (1207) as a function of the quadrature
controller set voltage using Method-3...................................................................... 101
Figure 5.10: (a) Schematic and (b) actual views of test setup for the centrifugal
acceleration tests on the rate table. ........................................................................... 102

xviii
Figure 5.11: Rate output responses of the gyroscope (1207) to the angular rate in the
centered and off-centered position on the rate table using the acceleration
compensation Method-3. .......................................................................................... 103
Figure 5.12: A typical Allan Variance graph. .......................................................... 104
Figure 5.13: Allan Variance graph of the gyroscope (1207) with and without the
acceleration cancellation circuit for the mismatch operation. .................................. 106
Figure 5.14: Allan Variance graph of the acceleration controller output of the
gyroscope (1207). ..................................................................................................... 108

xix
LIST OF TABLES
TABLES
Table 1.1: Performance requirements for different type of gyroscope [10]. .............. 6
Table 2.1: Modal analysis results of the single-mass fully decoupled gyroscope
designed in this work. ................................................................................................ 37
Table 3.1: Drive mode resonance characteristics of the sample gyroscope (Gyro
1207) used during the design of the closed loop drive mode controller for 14 VPM . 47
Table 5.1: Drive mode resonance characteristics of the vacuum packaged gyroscopes
studied in this thesis. .................................................................................................. 91
Table 5.2: Sense mode resonance characteristics of the vacuum packaged gyroscopes
studied in this thesis. .................................................................................................. 92
Table 5.3: Summary of the static acceleration test results for the gyroscopes studied
in this thesis. ............................................................................................................. 100
Table 5.4: Measured g-sensitivity of the gyroscope (1207) with and without the
acceleration cancellation electronics for the different quadrature set voltages. ....... 101
Table 5.5: Scale factor measurement results of the studied single-mass gyroscopes
with and without the acceleration cancellation electronics for the mismatch
operation. .................................................................................................................. 105
Table 5.6: ARW and bias instability performances of the single-mass fully decoupled
MEMS gyroscopes studied in this thesis. ................................................................ 107
Table 5.7: ARW and bias instability performances of the acceleration outputs of the
single-mass fully decoupled MEMS gyroscopes studied in this thesis.................... 108

xx

1
CHAPTER 1
1 INTRODUCTION
The adaptation of the IC processing technology for creating controllable, mechanical
and movable micro structures in the past few decades has made the major
contribution to the evolution of today’s high-technology systems. The rapid growth
of the micromachining technologies has generated various kinds of developments in
many diverse fields, ranging from consumer products to communication, from
inertial navigation systems to medicine and bioengineering. The great demand of the
technology market for the low-cost high-performance miniaturized systems and
challenging requirements for these systems have speeded up the efforts on the
development of the different kinds of microsystems. In today’s technology, many of
the MEMS sensors have presented better performances than their macro scale
counterparts. Similarly, MEMS gyroscopes are expected to take the place of the ring
laser and fiber optic gyroscopes in many applications because of their high
reliability, promising performance, small size, and low cost in the near future [1].
Over the last decade, significant performance improvements took place in the
operation of vibratory MEMS gyroscopes, either by suppressing the undesired
quadrature error between the resonance modes of the gyroscope or by matching the
resonance mode frequencies [2], [3]. However, most of the high performance
gyroscopes suffer from the environmental effects on the gyroscope output. The
output of a high performance gyroscope should be independent of the environmental
factors such as temperature, acceleration and vibration for a reliable operation.
Particularly, the static acceleration acting along the sense axis of MEMS gyroscope
is one of the considerable error sources for the micromachined gyroscopes [4].
Considering the application areas of high performance MEMS inertial sensors, these
sensors are usually exposed to various vibrations and acceleration during the

2
operation. The external acceleration acting on the sense-axis of the gyroscope causes
fluctuations in the output bias and shifts the scale factor, which directly degrade the
reliability of the gyroscope output [5]. Therefore, the acceleration effect on the
gyroscope output, or shortly its g-sensitivity, should be reduced for high reliability.
This thesis mainly focuses on the compensation of the static acceleration sensitivity
of MEMS gyroscopes.
This work proposes three different acceleration compensation methods based on the
readout of the gyroscope rather than the mechanical design. The main working
principle of all of the proposed methods is to sense the static acceleration acting
along the sense axis of the gyroscope by comparing the amplitudes of the residual
quadrature signals on the differential sense mode electrodes. The proposed methods
are implemented in a logical order, i.e. each acceleration compensation study is an
improved version of the previous one. In the first phase of the work, the acceleration
sensing circuit is implemented without using any closed loop controller. In this
method, the acceleration and rate outputs are simultaneously measured, and the effect
of the acceleration on the rate output is compensated according to their experimental
relations. In the second method, a controller is added to the acceleration sensing
circuit by applying feedback to the sense mode electrodes to stop the motion of the
sense axis caused by the static acceleration. Finally, special acceleration cancellation
electrodes are added to the gyroscope structure by changing its mechanical design. In
this technique, the feedback voltage is applied to these electrodes to cancel the effect
of the static acceleration. In the scope of this thesis, closed loop drive, force-
feedback, quadrature cancellation, and acceleration cancellation loops are designed
and implemented to achieve the compensation of the static acceleration sensitivity of
the gyroscope.
The organization of this chapter is as follows; Section 1.1 presents the fundamental
operation principle of MEMS vibratory gyroscopes. Section 1.2 summarizes the
performance parameters to evaluate the grade of the gyroscope and application areas
of these sensors. Section 1.3 provides a brief overview of the micromachined
gyroscopes reported in the literature. Section 1.4 demonstrates the gyroscope
structure studied in this thesis. Section 1.5 gives information about the acceleration
sensitivity of MEMS gyroscope and summarizes the different techniques used to

3
reduce the g-sensitivity. Finally, Section 1.6 presents the research objectives and
thesis organization.
1.1 Operation Principle of MEMS Vibratory Gyroscopes
The fundamental operation principle of micromachined vibratory gyroscope relies on
the Coriolis force. Figure 1.1 depicts an inertial frame to make the Coriolis force
perceptible to the mind. To understand the Coriolis force, consider an object driven
into a time-dependent motion along the x-axis. If the inertial frame is rotated along
the z-axis with respect to a stationary frame, the Coriolis force exerts on the moving
object. This fictitious force is orthogonal to both the oscillation and rotation axes.
The Coriolis force can be expressed as [6]
𝐹𝐶 = −2𝑚Ω× 1.1
where m denotes the mass of the moving object, and Ω represent the velocity of
the object and the rotation rate, respectively.
Figure 1.1: Inertial frame showing Coriolis force.

4
Figure 1.2 shows the conceptual view of the MEMS vibratory gyroscope. The
MEMS vibratory gyroscope is basically comprised of three suspended frames which
are drive frame, sense frame and proof mass. During the operation of the gyroscope,
firstly, the movable proof mass is driven into the sustained oscillation along the drive
axis of the gyro frame by means of electrostatic, piezoelectric, electromagnetic or
electrothermal actuation mechanism [7]. If an angular rate is applied to the gyro
frame in the sensitive axis of the gyroscope which is orthogonal to the drive and
sense axes, a secondary oscillation, which amplitude is proportional to the applied
angular rate, is induced along the sense axis. This oscillation can be detected by
using capacitive, optical, piezoresistive, or piezoelectric sensing mechanisms [8].
Figure 1.2: A conceptual view of the vibratory gyroscope.
1.2 Metrics of MEMS Gyroscopes and Their Application Areas
There are a number of parameters that determine the quality of a gyroscope. These
parameters are bias instability, angle random walk, measurement range, scale factor
and linearity, bandwidth, vibration sensitivity and g-sensitivity. Increasing the
number of the performance specifications also makes the design more complex, and
the importance of these parameters depends on the application. The whole definitions

5
and specifications to evaluate the performance of vibratory gyroscopes can be found
in [9], some of which are briefly summarized below:
Angle Random Walk: It specifies the angular error increase with time because of the
white noise in angular rate. The unit of angle random walk (ARW) is °/√hr or
°/s/√Hz.
Bias Instability: There exists a nonzero rate output in all gyroscopes even in the
absence of angular rate input. This nonzero gyroscope output is called rate bias or
zero-rate-output (ZRO). The stability of rate bias for a certain time is very important
for a reliable gyroscope operation. Bias instability specifies the random variation in
bias as computed over specified finite sample time and averaging time intervals,
which is generally expressed in °/hr.
Scale Factor: Scale factor represents the change of the gyroscope output to the
applied angular rotation, typically expressed in mV/°/s. Linearity (R2) is another
important parameter that shows how successful the fitted line expresses the variation
of the measured data. It should be noted that nonlinearity is a different term which is
used to express the systematic deviation from a specified output function.
Measurement Range: It is the maximum angular rate input that gyroscope can
measure without saturation, which has unit of ± °/sec.
Input Bandwidth: It is the maximum frequency of the angular rate input that
gyroscope can detect without any loss. Input bandwidth depends on the settling time
of the system, and it shows how fast gyroscope gives response to the input. It is
typically expressed in the unit of Hz.
Vibration and Acceleration Sensitivity (G-Sensitivity): Vibration sensitivity is the
ratio of the change in output because of the vibration about a sensor axis. Linear
acceleration sensitivity or g-sensitivity is defined as the ratio of drift rate due to the
acceleration about a gyro axis to the acceleration causing it.

6
While developing a complete rate sensor product, all of the design specifications
discussed above should be considered, but the importance of these criteria depends
on the application area of the gyroscope. In general, performance grades of the
gyroscope are classified in three major categories according to the performance
metrics; rate-grade, tactical-grade, and inertial-grade [10]. Table 1.1 shows the
different requirements of these grades.
Table 1.1: Performance requirements for different type of gyroscope [10].
Parameter Rate Grade Tactical Grade Inertial Grade
Angle Random Walk, ⁰/√hr >0.5 0.5-0.05 <0.001
Bias Instability, ⁰/hr 10-1000 0.1-10 <0.01
Scale Factor Linearity, % 0.1-1 0.01-0.1 <0.001
Measurement Range, ⁰/sec 50-10000 >500 >400
Bandwidth, Hz >70 ~100 ~100
Due to their small size, extremely low cost, and promising performances,
micromachined gyroscopes have been becoming a feasible alternative to expensive
and bulky conventional inertial sensors. In today’s technology, MEMS gyroscopes
have found applications in many different areas including military, automotive and
consumer electronics market, aerospace industry [11]. In the automotive industry,
MEMS gyroscopes are utilized in automotive safety systems such as the roll-over
detection, ride stabilization, and advanced airbag and brake systems. Moreover,
MEMS gyroscopes are used in the digital cameras for image stabilization, smart
phones, and computer gaming industry. Miniaturization of gyroscopes provides the
utilization of these sensors in the high-end applications such as micro-satellites and
micro-robotics.

7
1.3 Overview of the Micromachined Vibratory Gyroscopes
The first micromachined gyroscope implementations were presented in the early
1980’s with quartz gyroscopes, however their fabrication process was not adaptable
to IC fabrication technology. In 1991, The Charles Stark Draper Laboratory reported
the first IC compatible micromachined vibratory gyroscope, having a gimbal
structure fabricated on a silicon wafer, with a resolution of 4°/sec in 1 Hz
measurement bandwidth [12]. In 1993, the Draper Laboratory developed an
improved version of the silicon-on-glass tuning fork gyroscope fabricated through
the dissolved wafer process, having an equivalent resolution of 0.19°/sec in 1 Hz
bandwidth [13].
In early 90’s, many different fabrication methods and gyroscope structures were
utilized to improve the performances of the micromachined gyroscopes. In 1994,
University of Michigan demonstrated a vibrating ring gyroscope having a resolution
of 0.5°/sec in 25 Hz bandwidth. This gyroscope was fabricated by metal
electroforming [14]. Then, they improved the performance of the vibrating ring
gyroscope using the high-aspect ratio trench-refill technology [15]. In 1994, British
Aerospace Systems also reported a single crystal ring gyroscope which was
fabricated by deep dry etching of a 100µm silicon wafer on a glass wafer, with a
resolution of 0.15°/sec/√Hz in 30 Hz bandwidth [16]. In 2001, University of
Michigan further developed the performance of the vibrating ring gyroscope through
the high aspect-ratio combined poly and single-crystal silicon MEMS technology
(HARPSS), achieving up to a resolution of 0.01°/sec in a bandwidth of 1 Hz [17].
Although the vibrating ring gyroscopes have some certain advantages such as perfect
matching between the drive and sense mode frequencies and minimum quadrature
error between the corresponding modes compared to other gyroscope design, the
limited actuation displacement is main drawback of this design. Therefore, the tuning
fork type gyroscope structure had widely used to boost the performance of the
MEMS gyroscopes by taking the advantage of large drive displacement. In 1997,
Robert Bosch GmbH reported z-axis micromachined tuning fork gyroscope design
which uses electromagnetic drive and capacitive sensing [18]. In 1997, Daimler Benz
also developed a bulk-micromachined tuning-fork gyroscope with piezoelectric drive
and piezoresistive detection [19]. In 2004, Honeywell presented commercial MEMS
vibratory gyroscopes adapting the tuning fork architecture previously demonstrated

8
by Draper’s Laboratory. These gyroscopes showed less than 30 °/hr of bias in-run
stability performance and 0.05°/√hr of angle random walk performance [20].
In mid-1990’s, surface micromachined gyroscopes started to appear by the
fabrication of the mechanical sensor element and readout on the same chip area. In
1995, Murata demonstrated the first surface micromachined gyroscope. Its resolution
was about 2°/sec/√Hz [21]. In 2001, Carnegie Mellon University demonstrated
CMOS integrated z-axis gyroscopes with a noise floor of 0.5°/sec/√Hz using a
maskless post-CMOS micromachining process [22]. In 2002, Analog Device
developed a dual resonator z-axis gyroscope fabricated by the iMEMS process. This
gyroscope was the first commercial gyroscope with a bias instability of 50°/hr and a
resolution of 0.015°/sec [23]. In 2003, Carnegie Mellon demonstrated a better
version of the surfaced micromachined gyroscope which was fabricated on a thicker
structural layer to decrease the Brownian noise by increasing the mass. The noise
floor of this gyroscope was 0.02°/sec/√Hz at 5 Hz [24]. Apart from these groups,
Microsystem Laboratory at UC Irvine focused on the mechanical design of the
gyroscopes and presented new design architecture of vibratory gyroscope in 2006.
This gyroscope has 1-DOF drive mode and 2-DOF sense mode [25]. This gyroscope
demonstrated a noise floor of 0.64°/sec/√Hz at 50 Hz. In 2008, they further improved
the design architecture, achieving a gyroscope with a resolution of 0.09°/sec/√Hz and
a bias instability of 0.08°/sec [26]. Georgia Institute of Technology implemented
mode-matched gyroscopes to achieve the bias instability less than 1°/hr [27], [28];
however, the bandwidth of these gyroscopes was limited by the mechanical
bandwidth of the gyroscope which was about a few Hz under mode-matched
condition. In 2009, Thales Avionics demonstrated a mode-matched gyroscope with
digital control system, achieving an ARW of 0.01°/√hr and a bias instability of less
than 0.1°/hr [29]. In 2010, Draper Laboratories reported the gyroscope with bias
instability of 0.03°/hr and ARW of 0.002°/√hr, which has been one of the best
performances in the recent times.

9
1.4 Gyroscopes Studied in This Thesis
Figure 1.3 depicts the simplified view of the single-mass fully decoupled MEMS
gyroscope without additional acceleration cancellation electrodes studied in this
thesis. Previously, this gyroscope was used to achieve the automatic mode-matching
between the drive and sense mode resonance frequencies of the gyroscope by
applying a feedback voltage to frequency tuning electrodes [30]. After the mode-
matching study, it is also used for the implementation of the acceleration
compensation methods in the first and second phases of this study [31].
Figure 1.3: Simplified view of the single-mass fully decoupled MEMS gyroscope
without the dedicated acceleration cancellation electrodes studied in the scope of this
thesis [30].

10
The proposed acceleration sensing method uses the amplitude difference information
of the quadrature signals on the differential sense mode electrodes; therefore, the
sense mode of the gyroscope should have one resonance peak to exactly sense the
amplitude of the quadrature signal. Thus, a single mass gyroscope or mechanically
connected double mass gyroscope is required for the implementation of the proposed
acceleration compensation techniques. The gyroscope shown in Figure 1.3 employs
additional frequency tuning electrodes for the mode-matching operation; however,
the mismatch operation is preferred in this study to ensure that there is no phase error
exists due to the operation mode during the acceleration test. If the mode matching
between the drive and sense mode resonance frequencies is not exactly achieved,
additional phase error occurs during the modulation and demodulation steps in the
control electronics, causing the leakage of the quadrature error to the rate output.
Although the sensitivity of gyroscope is less in the mismatch mode, it provides more
reliable operation in terms of stability and phase error.
In this study, the acceleration acting along the sense axis of the gyroscope is sensed
by comparing the amplitudes of the differential quadrature signals which already
exist in the system. In the first phase of this study, the acceleration and rate
information are simultaneously collected during the acceleration tests. Then, the rate
output is corrected by using the experimental relation between the rate and
acceleration outputs [31]. In the second phase of this study, the effect of the
acceleration on the rate output is suppressed during the operation by applying a DC
feedback voltage to the sense mode electrodes using the non-inverting inputs of the
sense mode preamplifiers.
Figure 1.4 shows the simplified view of the single-mass fully-decoupled MEMS
gyroscope with the dedicated acceleration cancellation electrodes. In the third phase
of this study, the compensation of the static acceleration sensitivity on the rate output
of the gyroscope is achieved by applying a DC potential to the additional
acceleration cancellation electrodes. Implementing additional electrodes for the
acceleration cancellation provides the isolation of the acceleration cancellation
circuit from the remaining part of the gyroscope; as a result, the acceleration
cancellation controller does not affect the other control loops. The gyroscope is
consisted of a single mass due to the reason discussed above. This gyroscope also
includes the frequency tuning electrodes considering the mode-matching operation.

11
Two gyroscopes studied in this thesis are fabricated in METU using the modified
SOG process [32]. While the first gyroscope is vacuum packaged at die level using
the projection welder method, the second gyroscope is fabricated using wafer level
vacuum packaging process [33].
Figure 1.4: Simplified view of the single-mass fully decoupled MEMS gyroscope
with the dedicated acceleration cancellation electrodes studied in the scope of this
thesis.

12
The main purpose of this thesis is to compensate the effect of the quasi-static
acceleration on the rate output of the gyroscope. Although a study was conducted on
the static acceleration sensitivity of the MEMS gyroscope in METU [5], the
acceleration compensation methods were proposed and implemented successfully for
the first time. Before using these methods, the drive, sense and quadrature control
loops were constructed and optimized. Then, the acceleration sensing and
compensation cancellation circuits were successfully implemented using the
gyroscope in Figure 1.3. Finally, the closed loop acceleration cancellation circuit was
implemented on the gyroscope having additional acceleration cancellation electrodes,
shown in Figure 1.4.
1.5 Overview of Acceleration Sensitivity of MEMS Gyroscope and
Compensation Techniques
The operation of the MEMS vibratory gyroscopes relies on the Coriolis coupling,
which enables the transfer of the energy from the drive to sense mode in the presence
of an angular rotation. With the advance development in the gyroscope performance
characteristics including the bias instability, resolution and bandwidth, the
environmental effects such as vibration and acceleration acting on the gyroscope
have a prominent impact on the reliability and robustness of the gyroscope [34], [35].
These effects causes an output error, namely ‘acceleration sensitivity’ or
‘acceleration output’.
In real applications, the outputs of all MEMS gyroscopes are affected from the
acceleration because of the fabrication imperfections and asymmetry in their
mechanical designs. The effect of acceleration on the gyroscope output can be seen
in the different forms, the most significant ones are usually sensitivity to linear
acceleration (or g sensitivity) and vibration rectification (or g2 sensitivity). Since
most of the gyroscopes are subjected to the Earth’s 1 g field of gravity in the
application, the sensitivity acceleration exhibits one of the largest error sources [36].
The high frequency acceleration or vibration outputs are difficult to predict and very
hard to compensate using electronics; thus, the compensation of the vibration
rectification error is usually done by improving the mechanical design of gyroscope
rather than the control electronics. A common method to reduce the effect of the

13
external acceleration or vibration is to use the tuning-fork type vibrating gyroscopes
(TFG) which are believed to be insensitive to the common mode signals such as
linear acceleration because these signals are mitigated by the differential reading of
the sense mode signals coming from the two differentially-connected masses [24],
[34], [37], [38]. However, it has been found that tuning fork type gyroscopes could
still experience an output error caused by applying the linear acceleration along the
sense axis to the gyros. University of Michigan made a study on the error sources
causing the acceleration output in ideal fabricated TFGs and identified three major
error sources which are the capacitive nonlinearity of the parallel plate sense
electrodes, the unbalanced electrostatic force along the sense direction of the drive
electrodes and the unbalanced electrostatic force along the drive direction of the
drive electrodes [39]. The most significant error source has been reported as the
acceleration along the sense direction. However, the analysis was based on the ideal
fabricated TFG without considering the mismatch during fabrication. Due to the
limitation of the technology, there are no perfectly ideal TFGs.
Implementing a micro-mechanical shock absorber under the sensor structure is
another method to eliminate the effect of random high-frequency accelerations or
vibrations [40]. Although this method provides a solution for the vibration sensitivity
of a gyroscope, it does not eliminate the effects of static or low frequency
accelerations. Acceleration sensitivity of the gyroscope can also be improved by
calibrating the gyroscope output with the aid of an additional external accelerometer;
however, the amount of the measured acceleration cannot always be the acceleration
sensed by the gyroscope due to the difference in the physical locations of both
sensors [36]. Quadruple mass gyroscope design is also implemented to make the
sensor more immune to the external shock and vibration [41]. However, it is hard to
realize a higher performance due to the complex structure of four-mass gyroscopes.
This thesis study focuses on the static or low frequency acceleration sensitivity of the
MEMS gyroscopes. As opposed to the previously reported studies in the literature, it
aims to improve quasi-static acceleration sensitivity of the gyroscope by modifying
the control electronics instead of utilizing complex mechanical design. It should be
noted that the high frequency acceleration or vibration sensitivity of the gyroscope is
out of the concept of this thesis study.

14
1.6 Research Objectives and Thesis Organization
The fundamental object of this thesis study is to theoretically analyze the static
acceleration sensitivity of the fully decoupled MEMS gyroscope and to successfully
construct the acceleration sensing and compensation circuits to improve the quasi-
static acceleration sensitivity of the gyroscope. The definite goals of this research can
be listed in the following way:
1. Analysis of the effect of the static acceleration on the single mass gyroscope
operation. The effect of the static acceleration on the sense-mode electrodes,
force-feedback electrodes, quadrature cancellation electrodes and sense mode
springs should be examined analytically to determine the main reason of the
static acceleration sensitivity of the gyroscope. Moreover, the experimental data
should be provided to show the effect on the acceleration on the rate output.
2. Design of single-mass fully-decoupled gyroscope including of acceleration
cancellation electrodes. The acceleration cancellation electrodes are supposed to
generate an electrostatic force to balance the acceleration force acting along the
sense axis of the gyroscope. Using dedicated electrodes, the operation of the
acceleration cancellation control loop should be isolated from the other control
loops in the gyroscope system. Moreover, the number of the acceleration
cancellation electrodes should be determined for the range of the g-cancellation
circuit.
3. Fabrication of a designed single-mass gyroscope by using the modified SOG
process and the corresponding wafer level hermetic encapsulation process. The
problems related with process should be identified and solved. The process steps
should be optimized to achieve a consistency between parameters of the
fabricated and design sensor. The fabricated gyroscope wafer should be vacuum
packaged, and the fabrication steps for the vacuum packaging process should also
be optimized.
4. Design and implementation of the controller electronics. The controller
electronics includes the drive, sense, quadrature and acceleration control loops.
The controller values should be optimized by the simulation to achieve enough
phase margin, fast settling time and small overshoot for all control loops. Each
loop should be separately designed but their interactions to each other should also

15
be considered during the operation. As a final step, the control electronics should
be integrated with the gyroscope on a PCB for the overall system evaluation.
The organization of the thesis and the contents of the following chapters are as
follows.
Chapter 2 introduces mathematical modeling of vibratory MEMS gyroscopes. After
presenting the related equations, the design of acceleration cancellation electrodes for
the corresponding gyroscope structure is provided. Moreover, the effect of the static
acceleration on the sense mode electrodes, force-feedback electrodes, quadrature
cancellation electrodes and sense mode springs are investigated analytically. Finally
FEM simulations for modal analysis are demonstrated.
Chapter 3 presents the control electronics design for drive control, force feedback,
quadrature cancellation and acceleration cancellation loops. The details of the design
steps are provide and the designed systems are evaluated in SIMULINK.
Chapter 4 gives the details of modified SOG process used for the fabrication of the
sensor wafer. Moreover, wafer level vacuum packaging process is explained in
details. Finally, the fabrication results are represented.
Chapter 5 gives the test results of the single mass gyroscopes for three different
acceleration compensation methods. Firstly, static and centrifugal acceleration test
results are represented with and without the acceleration compensation circuits.
Then, the experimental data is provided to show the relation between the level of the
quadrature error and g-sensitivity. Finally, the performance test results of the studied
gyroscopes are given.
Finally, Chapter 6 summarizes this thesis study and highlights the achievements of
this work. Future research topics are also suggested.

16

17
CHAPTER 2
2 VIBRATORY GYROSCOPE THEORY AND
MODELLING
This chapter presents the vibratory gyroscope theory and describes the mechanical
model of the gyroscopes studied in this thesis. Section 2.1 presents mechanical
model of the gyroscope providing brief information about the drive and sense mode
dynamics. Section 2.2 gives the extraction of the model parameters. Section 2.3 and
2.4 shows the capacitive actuation and sensing mechanism. Section 2.5 explains the
electrostatic tuning effect used to tune the resonance frequencies. Section 2.6
provides information about the effect of the static acceleration on the gyroscope
operation and presents the design of the g-cancellation electrodes for the fully
decoupled gyroscope. Section 2.7 presents the FEM simulations used for the model
analysis. Finally, Section 2.8 summarizes this chapter.
2.1 Mechanical Model of the Gyroscope
There is a trade-off between the angular rate sensitivity and mechanical crosstalk in
the micromachined gyroscopes. As the coupling among the drive, sense and proof
masses increases, both the sensitivity of gyroscope to angular rate input and the
undesired mechanical crosstalk increase. However, the mechanical crosstalk should
be minimized to achieve minimum zero-rate offset in a good gyroscope. Therefore,
micromachined gyroscopes structures employ different decoupling mechanisms to
decrease the mechanical crosstalk. Figure 2.1 shows three basic decoupling
mechanisms. Figure 2.1-a describes the simplest configuration which the gyroscope
is coupled. In this mechanism, the drive, sense and proof mass are connected to each
other and they have 2DOF (Degree-of-Freedom) motion capability. Thus, any
misalignment associated with the drive axis and drive actuation force causes a rate

18
error signal at the output. Figure 2.1-b shows an improved decoupling mechanism, in
which the motion of the drive mass is restricted to 1DOF along the predetermined
drive axis whereas the sense mass has 2DOF motion capability. Figure 2.1-c shows
the fully-decoupled gyroscope structure, in which the drive and sense masses have
1DOF movement capability along their drive and sense axes, respectively. By
keeping the drive and sense axes orthogonal to each other, the mechanical crosstalk
is minimized in the expense of losing rate sensitivity this mechanism.
(a)
(b)
(c)
Figure 2.1: Three basic decoupling mechanisms: (a) simplest decoupling
configuration with no special decoupling treatment, (b) improved decoupling
configuration and (c) fully-decoupled configuration.

19
Figure 1.4 depicts the simplified view of the fully-decoupled gyroscopes studied in
this thesis. The gyroscope structure is composed of drive frame, proof mass and
sense frame. The drive and sense frames have 1DOF movement capability, whereas
the proof mass frame have 2DOF movement capability to transfer Coriolis
acceleration induced by rotation to the sense mode, as in Figure 2.1-c. In mechanical
structure, the drive and sense axes are designed to be completely orthogonal.
However, an undesired mechanical cross-talk, called quadrature error is inevitable
between the drive and sense modes due to the fabrication imperfections.
2.1.1 Drive Mode Dynamics
The proof mass should be driven into a sustained oscillation along the drive axis for
the generation of the Coriolis acceleration along sense axis of the gyroscope when an
angular input is applied. The Coriolis force is directly proportional with the drive
displacement. Therefore, the drive mode of the gyroscope should be well-modeled,
and the drive mode oscillation should be kept constant over time for a stable
operation. The mathematical model of drive mode resonator can be represented by
the second order differential equation based on the mass-spring-damper system as
follows:
𝑓𝐷(𝑡) = 𝑚𝐷(𝑡) + 𝑏𝐷(𝑡) + 𝑘𝐷𝑥(𝑡) 2.1
where 𝑓𝐷 is the actuation force acting on drive resonator, 𝑚𝐷 is the drive frame mass
including the drive and proof masses, 𝑥(𝑡) is the displacement of the drive mode, 𝑏𝐷
and 𝑘𝐷 denote the damping factor and spring constant of the drive mode,
respectively. The frequency domain representation of the time domain equation in
Equation 2.1 is obtained by taking Laplace Transform, and the resultant relation can
be expressed as
𝐹𝐷(𝑠) = 𝑚𝐷𝑠2𝑋𝐷(𝑠) + 𝑏𝐷𝑠𝑋𝐷(𝑠) + 𝑘𝐷𝑋𝐷(𝑠) 2.2
By rearranging the terms in Equation 2.2, the direct relation between the force and
displacement can be written in terms of the mechanical system parameters as
follows:

20
𝑋𝐷(𝑠)
𝐹𝐷(𝑠)=
1
𝑚𝐷(𝑠2 +
𝑤𝐷𝑄𝐷
𝑠 + 𝑤𝐷2)
2.3
In equation 2.3, 𝑤𝐷 is the resonance frequency of the drive mode, and 𝑄𝐷 is the
quality factor of the drive mode. These parameters can be calculated by using the
following relations:
𝑤𝐷 = √𝑘𝐷𝑚𝐷
2.4
𝑄𝐷 =√𝑘𝐷𝑚𝐷
𝑏𝐷 2.5
If the operating frequency of the actuation force is equal to the mechanical resonance
frequency of the system, i.e. under the resonance condition, Equation 2.3 is
simplified to
𝑋𝐷(𝑗𝑤)
𝐹𝐷(𝑗𝑤)=
1
𝑚𝐷𝑤𝐷2
𝑄𝐷
=1
𝑗
𝑄𝐷𝑘𝐷
2.6
Equation 2.6 states that there is a phase shift of 90⁰ between the drive mode
displacement and the applied actuation force under the resonance condition. It also
implies that the amplitude of the drive mode displacement is directly proportional
with the quality factor. Under the resonance condition, the energy dissipation in the
system is minimized; therefore, the maximum displacement with the minimum
applied force is achieved under this condition.
2.1.2 Coriolis Coupling and Sense Mode Dynamics
The mechanical structure of the sense mode is similar to which of the drive mode,
therefore; the sense mode dynamics can also be modeled with the second order
differential equation based on the mass-spring-damper system by replacing the
subscript “D” with “S” which indicates the sense mode parameters. As being different
form the drive mode, an external actuation force is not required in the sense mode.
Instead, the operation of the sense mode relies on the self-induced Coriolis force

21
which is directly proportional to the mass and the velocity of the drive mode as stated
in Equation 1.1. While constructing the sense mode dynamics based on the Coriolis
coupling, one should be careful about that the proof mass is the only element subject
to the Coriolis force in a fully decoupled gyroscope. Therefore, the sense mode
dynamics can be expressed as
−2𝑚𝑃𝑀Ω𝑍(𝑡)(𝑡) −𝑚𝑃𝑀Ω(𝑡)𝑥(𝑡) = 𝑚𝑆(𝑡) + 𝑏𝑆(𝑡) + 𝑘𝑆𝑦(𝑡) 2.7
In Equation 2.7, 𝑚𝑃𝑀 and 𝑚𝑆 denote the proof mass and the total sense mass
including the proof mass and the mass of the sense electrodes, respectively. Let
assume a time-varying angular rate input and a time-varying displacement of drive
mode in the following form:
𝑥(𝑡) = 𝑋𝐷𝑐𝑜𝑠(𝑤𝐷𝑡) 2.8
Ω𝑧(𝑡) = Ω𝑧𝑐𝑜𝑠(𝑤𝑧𝑡) 2.9
where 𝑤𝑧 is the frequency of applied angular rotation. After inserting the Equation
2.8 and 2.9 into Equation 2.7 and following the necessary mathematical calculations,
the sense mode response can be obtained as separated its frequency components in
the following form:
𝑌(𝑤𝐷 +𝑤𝑧) =
𝑚𝑃𝑀𝑚𝑆
𝑋𝐷Ω𝑧 (𝑤𝐷 +𝑤𝑧2 )
(𝑤𝑠2 − (𝑤𝐷 +𝑤𝑧)
2) + 𝑗𝑤𝑆𝑄𝑆
(𝑤𝐷 +𝑤𝑧) 2.10-a
𝑌(𝑤𝐷 −𝑤𝑧) =
𝑚𝑃𝑀𝑚𝑆
𝑋𝐷Ω𝑧 (𝑤𝐷 −𝑤𝑧2 )
(𝑤𝑠2 − (𝑤𝐷 −𝑤𝑧)
2) + 𝑗𝑤𝑆𝑄𝑆
(𝑤𝐷 −𝑤𝑧) 2.10-b
According to Equation 2.10, the sense mode output of the gyroscope has two
frequency components as a response to a sinusoidal angular rate input. The sense
mode response can be analyzed for two special cases, regarding the separation
between the mechanical resonance frequencies of the drive mode and sense mode. If
the frequency of the angular rate input is zero and there is a frequency mismatch

22
between the drive and sense mode resonance frequencies, Equation 2.10 can be
simplified to
𝑌(𝑤𝐷 +𝑤𝑧) + 𝑌(𝑤𝐷 −𝑤𝑧) ≅2𝑋𝐷Ω𝑧𝑄𝑆
2𝑤𝐷∆𝑤 − 𝑗𝑤𝐷𝑤𝑆𝑄𝑆
𝑚𝑃𝑀
𝑚𝑆 2.11
where ∆𝑤 denotes the frequency difference between the corresponding resonance
mode frequencies. If the angular rate input is DC and the resonance frequencies of
the drive mode and sense mode is very close to each other, i.e. 𝑤𝑆 ≅ 𝑤𝐷, then
Equation 2.11 can be represented as
𝑌(𝑤𝐷 +𝑤𝑧) + 𝑌(𝑤𝐷 −𝑤𝑧) ≅2𝑋𝐷Ω𝑧𝑄𝑆𝑗𝑤𝐷
𝑚𝑃𝑀
𝑚𝑆 2.12
Equation 2.11 implies that the displacement of the sense mode is boosted by the
mechanical quality factor under the mode-matched condition. In other words, the
sensitivity of the gyroscope is maximized when the resonance frequencies of the
drive and sense modes are equal to each other. Under the mode-matched condition,
there is 90° phase difference between the drive mode displacement and sense mode
displacement. The mode-matched operation has some certain advantages but it gets
difficult to achieve the exact mode-matching condition as the quality factor of the
sense mode increases.
If the resonance frequencies of the drive and sense modes are highly separated from
each other, i.e., 𝑤𝐷 ≤ 𝑤𝑆, and the frequency of the angular rate input is zero,
Equation 2.11 can be simplified to
𝑌(𝑤𝐷 + 𝑤𝑧) + 𝑌(𝑤𝐷 −𝑤𝑧) ≅𝑋𝐷Ω𝑧
∆𝑤𝐷
𝑚𝑃𝑀
𝑚𝑆 2.13
When compared to the mode-matched operation, there is a significant decrease in the
corresponding sensitivity under the mismatched operation. There is no phase
difference between the drive and sense mode displacements under the mismatched
condition.

23
It is possible to decide whether the operation condition of gyroscope is mode-
matched or mismatch by looking at the denominator of Equation 2.11. As a rule of
thumb, if the frequency mismatch between the corresponding resonance frequencies
is smaller than 1/10 of the response bandwidth which is 𝑓𝑠
𝑄𝑆 , the operation mode of
the gyroscope can be considered as mode-matched. Similarly, if the frequency
mismatch between the corresponding resonance frequencies is larger than 1/10 of the
response bandwidth, the operation mode of the gyroscope can be considered as
mismatched. The detailed information about the sense mode dynamics of the MEMS
vibratory gyroscope can be found in [6].
2.2 Design of MEMS Vibratory Gyroscope and Model Parameters
Mechanical model parameters are should be identified to establish the governing
equations of the MEMS gyroscope analyzed in Section 2.1. Fundamentally, these
parameters are the spring constant, mass and damping factors, which are presented in
the subsections below.
2.2.1 Mechanical Spring Constant Estimation
The degrees-of-freedom of the movable particles in the vibratory gyroscopes is
identified by the mechanical springs. Moreover, mechanical spring constants are
ones of the important design parameters, determining the drive and sense mode
resonance frequencies. Three types of spring structures are utilized in the mechanical
structure of the gyroscope. These springs connect the drive, proof mass and sense
frames. The double-folded and half-folded spring structures are employed in the
drive mode since the linearity is the main concern in this mode due to the large
displacement in the order of µm. On the other side, the sense mode displacement can
only reach to a few angstroms so the linearity is not a problem for this mode. Instead,
the area of the springs is considered in the sense mode spring design; thus, the
clamped-guided-end springs are employed in the sense mode. The detailed analysis
on spring design and spring constant estimation can be found in [6].

24
2.2.2 Mass and Damping Factor Estimation
The mass of the movable parts can be calculated by using the following formula:
𝑚 = 𝑑𝑉 2.14
where 𝑑 denotes the density of the material and 𝑉 represents the volume that can be
directly calculated from the structure. However, a fraction of the spring masses
should be also added to this expression according to Rayleigh energy method to
estimate the effective masses for the resonance frequency calculation [6].
The calculation of the damping factor is not easy since it depends on many
parameters and requires a complicated analysis. Instead, the damping factor is
estimated by the resonance tests.
2.3 Electrostatic Actuation Using Parallel Plate Capacitor
A parallel plate capacitor which is comprised of two isolated conductors is a simple
and widely used configuration to generate electrostatic force for the actuation in the
micromachined structures. If there is potential difference between the parallel plates,
the energy is stored in the capacitor because of the charge accumulation. The stored
energy causes a pulling electrostatic force between the stationary and movable
conductors. The detailed analysis for the electrostatic actuation using the parallel
plate configuration can be found in [6].
There are two fundamental parallel plate structures utilized for the actuation
mechanism in the MEMS gyroscope studied in this thesis, namely varying-overlap
area type capacitor and varying-gap type capacitor. In the varying-overlap type
capacitor, the displacement occurs along the lateral direction by causing a change in
the overlap area of the parallel plates. For this configuration, the acting force on the
parallel plates can be expressed as
𝐹 =1
2𝛼𝑁휀0
𝐻0
𝐷0𝑉2 2.15
where 𝛼 is the correction factor for the fringing fields, 𝑁 represents the number of
the capacitor pairs 휀0 is the permittivity of the free air, 𝑉 is the voltage difference between

25
the parallel plates, 𝐻0 and 𝐷0 are the overlap height and gap spacing of the plates,
respectively. Equation 2.15 implies that the electrostatic force does not depend on the
position so the large displacement can be achieved without degrading the linearity
using the varying-overlap are type capacitors. This is why they are generally utilized
in drive mode actuation mechanism which requires large displacement to reduce the
mechanical noise in the system.
In the varying-gap type capacitors, the motion occurs along the y direction by
increasing the gap and decreasing the anti-gap between the parallel plates, or vice
versa. For this configuration, the acting force on the parallel plates can written as
𝐹 =1
2𝛼𝑁휀0
𝐻0𝐿0(𝐷0 − 𝑦)2
𝑉2 2.16
where 𝐿0 is the overlap length of the plates and y is the displacement due to the
electrostatic actuation. As seen in Equation 2.16, the generated electrostatic force
shows a nonlinear behavior in y direction. The sensitivity for the varying-gap type
capacitor is higher compared to the varying-overlap area type capacitor; however, the
linearity gets worse. For small displacements, the force can be assumed to be
constant by neglecting the displacement term in the denominator of Equation 2.16. In
the sense mode of the gyroscopes, the displacement due to the angular rate input is
not much more than a few angstroms which are much smaller than the capacitive
gaps. Rather than the large actuation displacement, the sensitivity is the important
parameter in the sense mode because it determines the resolution of the system.
Thus, the varying-gap type capacitors are used in the sense mode of the gyroscopes.
2.4 Capacitive Sensing
The capacitive sensing mechanism is used to convert the movement of the
mechanical structure to the electrical signal. In the gyroscope structure, there will be
two motions which should be sensed by the capacitive sensing mechanism: the drive-
mode oscillation which constitutes the basis of the self-resonance actuation of the
drive-mode and sense-mode displacements which gives information about the
angular rate inputs. In the capacitive sensing mechanism, firstly, the mechanical
displacement is converted to the current by the capacitors; then, the current is fed to

26
the interface circuit to obtain the voltage equivalent of the displacement. The general
expression of the current flowing through a capacitor is
𝐼𝑜𝑢𝑡 =𝑑𝑄
𝑑𝑡=𝑑(𝐶(𝑡)𝑉(𝑡))
𝑑𝑡= 𝐶
𝑑𝑉(𝑡)
𝑑𝑡+ 𝑉
𝑑𝐶(𝑡)
𝑑𝑡 2.17
For the actual gyroscope operation, 𝑉(𝑡) consists of the fixed proof mass voltage,
𝑉𝑃𝑀, which is the potential difference between the detection electrodes and movable
part and the time varying voltage which is caused by the displacement of the sensing
capacitors. Since the time varying voltage is much smaller than the constant proof
mass voltage in the real operation, the expression for the output current can be
written in the following ways assuming sinusoidal drive and sense displacement
𝐼𝑜𝑢𝑡(𝑡) ≅ 𝑉𝑃𝑀𝑑𝐶
𝑑𝑡= 𝑉𝑃𝑀
𝜕𝐶
𝜕𝑋
𝜕𝑋
𝜕𝑡(time domain) 2.18-a
𝐼𝑜𝑢𝑡(𝑗𝑤) ≅ 𝑉𝑃𝑀𝜕𝐶
𝜕𝑋𝑗𝑤𝑋(𝑗𝑤) (frequency domain) 2.18-b
2.5 Electrostatic Spring Effect
The drive and sense mode resonance frequencies are important in the operation of the
gyroscope and determined by the springs. However, the width of the springs cannot
be defined with a tolerance better than 10 % in a standard micromachining
technology. Therefore, the electrostatic spring effect of the varying-gap type sense
fingers is used to adjust the resonance frequency of the sense mode with respect to
drive mode resonance frequency. By differentiating the expression given in Equation
2.16 with respect to displacement y, the following expression is obtained in the unit
of 𝑁/𝑚 :
𝛿𝑘𝑒𝑙𝑒𝑐𝑡𝑟𝑜𝑠𝑡𝑎𝑡𝑖𝑐 =𝜕2𝐸
𝜕𝑦2=𝜕𝐹
𝜕𝑦= 𝛼휀0
𝐻0𝐿0(𝐷0 − 𝑦)3
𝑉2
2.19
Equation 2.19 states that the spring constant in the sense direction is softened due to
the applied voltage on the varying gap capacitors. Thus, the sense mode resonance
frequency can be adjusted by varying the DC voltage applied to the proof mass. It

27
should be noted that the electrostatic softening effect is not valid for the varying-
overlap area type capacitors because the derivative of the force expression in
Equation 2.15 with respect to the displacement term is zero. In practice, the
mechanical sense mode resonance frequency is intentionally designed to be larger
than the resonance frequency of the drive mode, then, it is adjusted by the
electrostatic tuning effect. The frequency of sense mode with the softening effect
then can be calculated as
𝑤𝑆 = √𝑘𝑆 − 𝛿𝑘𝑒𝑙𝑒𝑐𝑡𝑟𝑜𝑠𝑡𝑎𝑡𝑖𝑐
𝑚𝑆 2.20
In equation 2.20, the condition where 𝑘𝑆 = 𝛿𝑘𝑒𝑙𝑒𝑐𝑡𝑟𝑜𝑠𝑡𝑎𝑡𝑖𝑐 is critical for the
gyroscope operation because if the proof voltage exceeds the critical point, the
movable part of the capacitor collapses onto the stationary part. This critical voltage
is called pull-in voltage, it can be expressed in [42] as
𝑉𝑝𝑢𝑙𝑙𝑖𝑛 = √𝑘𝑆𝐷𝑔𝑎𝑝
3 𝐷𝑎𝑛𝑡𝑖𝑔𝑎𝑝3
𝛼휀0𝐻0𝐿0(𝐷𝑎𝑛𝑡𝑖𝑔𝑎𝑝3 +𝐷𝑔𝑎𝑝
3 ) 2.21
2.6 Quasi-static Acceleration Sensitivity
Static acceleration sensitivity is one of the important of the problems in MEMS
gyroscopes due to their application areas and the working principle of the sensors.
Most of high performance gyroscopes suffer from the effects of the static
acceleration at the gyroscope output. The quasi-static acceleration acting on the sense
axis of the gyroscope causes a shift in the vibration axis of the sense mode, changing
the average gap spacing of the varying-gap fingers and the sense mode dynamics. As
a result, a fluctuation in the output bias and a shift in the scale factor occur, which
straightly reduces the reliability of the sensor output.
During the gyroscope operation, the static acceleration acting along the sense axis of
the gyroscope affects the gyroscope operation in three ways. Firstly, the shift of the
sense mode vibration axis does not equally affect the amplitude of the differential
sense-mode channel outputs because of the nonlinearity in the capacitive detection.

28
Consequently, the positive and negative sense-mode channel outputs fluctuate,
causing a variation at the rate output in a differential reading scheme. Secondly, the
capacitive gap spacing of the force-feedback electrodes changes with the applied
static acceleration. As a result, the scale factor of the gyroscope varies as well as the
output bias. Furthermore, the static acceleration slightly alters the level of the
residual quadrature signal by disturbing the position of the quadrature cancellation
electrodes and sense mode springs. A portion of the quadrature error appears as the
rate offset because of the phase error coming from the electronics. Hence, any
change in the quadrature signal is reflected to the rate output.
2.6.1 Effect of Static Acceleration on the Sense-Mode Electrodes
In the gyroscope operation, the sense mode displacement which carries information
about the angular rate input or quadrature signal is picked up by the differential
sense-mode electrodes. In the capacitive sensing mechanism, firstly, the sense mode
output current is obtained by these electrodes, then; the obtained current is converted
to the voltage by the transimpedance amplifier in the front-end electronics. However,
the static acceleration acting along the sense axis of the gyroscope causes a change in
the amplitude of the differential sense-mode channel outputs due to the nonlinearity
in the capacitive detection.
Figure 2.2 depicts the simplified view of the sense-mode electrodes which detect the
sense-mode displacement. In the absence of the static acceleration, the sense-mode
frame is kept stationary with the aid of the force-feedback electronics, as shown
Figure 2.2-a. In this condition, the sense-mode channel output voltage can be
approximately expressed as
𝑉𝑆𝑃 ≅휀𝑁𝑆𝑃𝐻0𝐿0𝑉𝑃𝑀𝑍𝑝𝑟𝑒𝐴𝑖𝑛𝑠𝑡
𝑑𝑔𝑎𝑝2 2.22
where 𝑁𝑆𝑃 is the total number of the sense-mode electrodes, is the derivative of the
sense-mode displacement, i.e. the velocity of the sense-mode, 𝑉𝑃𝑀 is the DC voltage
applied to the proof mass, 𝑍𝑝𝑟𝑒 is the gain of the transimpedance amplifier (TIA),
and 𝐴𝑖𝑛𝑠𝑡 is the gain of the instrumentational amplifier which is used for the
differential reading.

29
(a) (b)
Figure 2.2: Conceptual view of the differential sense-mode electrodes under the
conditions of (a) zero and (b) static acceleration. The sense mode output current
increases in one side and decreases in the other under the static acceleration.
When a nonzero acceleration force acts on the movable sense frame as shown in
Figure 2.2-b, the average gap spacing between the differential sense-mode electrodes
decreases in one side and increases in the other. If the sense axis shifts ∆𝑑𝑔𝑎𝑝 due to
the static acceleration 𝑎, the following relation can be derived for the sense-mode-
channel output voltage:
𝑉𝑆𝑃′ ≅
휀𝑁𝑆𝑃𝐻0𝐿0𝑉𝑃𝑀𝑍𝑝𝑟𝑒𝐴𝑖𝑛𝑠𝑡
𝑑𝑔𝑎𝑝2+𝑁𝑆𝑃휀𝐻0𝐿0𝑉𝑃𝑀𝑍𝑝𝑟𝑒𝐴𝑖𝑛𝑠𝑡∆𝑑𝑔𝑎𝑝
2
𝑑𝑔𝑎𝑝4 2.23
In equation 2.23, the change of the gap spacing ∆𝑑𝑔𝑎𝑝 can be written in terms of the
sense mode resonance frequency 𝑤𝑠 and the static acceleration 𝑎 as follows:
∆𝑑𝑔𝑎𝑝 ≈𝑎
𝑤𝑠2 2.24
By combining Equation 2.23 and 2.24, the change in the sense mode channel output
signal,∆𝑉𝑆𝑃, because of the static acceleration can be expressed as

30
∆𝑉𝑆𝑃 ≈𝑁𝑆𝑃. 휀. 𝐻. 𝐿. . 𝑉𝑃𝑀. 𝑍𝑝𝑟𝑒 . 𝐴𝑖𝑛𝑠𝑡. 𝑎
2
𝑑𝑔𝑎𝑝4 . 𝑤𝑠4
2.25
However, the term ∆𝑉𝑆𝑃 is very small compared to the term𝑉𝑆𝑃 so the effect of the
static acceleration on the sense mode electrodes is negligible. Moreover, if there is no
angular rate input acting on the system, the sense-mode channel output voltage
consists of only the quadrature signal. In this case, even if the AC sense signal output
changes significantly due to the static acceleration, it does not affect the rate output
because the closed-loop quadrature cancellation system holds the amount of the
residual quadrature signal at a certain level, preventing the output bias from shifting.
2.6.2 Effect of Static Acceleration on the Force-feedback Electrodes
The function of the force-feedback electrodes is to stop the sense mode motion of the
gyroscope caused by the angular rate input. The shift of the sense mode axis due to
acceleration changes the force generated by the force-feedback electrodes, affecting
directly the scale factor of the rate output. Figure 2.3 shows the conceptual view of
the force-feedback electrodes. Under the stationary condition as shown in Figure 2.3-
a, the force generated by the force-feedback electrodes can be expressed as
𝐹𝐹𝐹 = 𝑉𝑃𝑀𝜕𝐶𝐹𝐹𝜕𝑦
𝑉𝐹𝐹 ≅2휀𝐻0𝐿0𝑉𝑃𝑀𝑉𝐹𝐹
𝑑𝑔𝑎𝑝2
2.26
where 𝜕𝐶𝐹𝐹/𝜕𝑦 represents the sensitivity of the force-feedback electrodes, 𝑉𝑃𝑀 and
𝑉𝐹𝐹 denote the proof mass DC voltage and the amplitude of the AC signal applied to
the force-feedback electrodes, respectively.

31
(a) (b)
Figure 2.3: Conceptual view of the force-feedback electrodes under the conditions of
(a) zero and (b) static acceleration.
If a nonzero static acceleration acts along the y-axis as depicted in Figure 2.3-b, the
movable sense frame shifts in the direction of the acceleration, changing the gap
spacing of the force-feedback electrodes. Under this condition, the electrostatic force
generated by the force-feedback electrodes can be written as
𝐹𝐹𝐹 ≅2휀𝐻0𝐿0𝑉𝑃𝑀𝑉𝐹𝐹
𝑑𝑔𝑎𝑝2+2휀𝐻0𝐿0𝑉𝑃𝑀𝑉𝐹𝐹∆𝑑𝑔𝑎𝑝
2
𝑑𝑔𝑎𝑝4
2.27
By combining Equation 2.24 and 2.27, the change in force generated by force-
feedback electrodes due to the static acceleration is found in terms of the sense mode
resonance frequency 𝑤𝑠 and the static acceleration 𝑎 as
∆𝐹𝐹𝐹 ≈2휀𝐻0𝐿0𝑉𝑃𝑀𝑉𝐹𝐹𝑎
2
𝑑𝑔𝑎𝑝4 𝑤𝑠4
2.28
Equation 2.28 implies that the force generation capability of the force-feedback
electrodes increases with the applied static acceleration independently from the
direction of the acceleration. This means that the same amount of the Coriolis
acceleration is stopped by applying the smaller voltage to the force-feedback
electrodes under the static acceleration, which directly causes the scale factor of the
rate output to change.
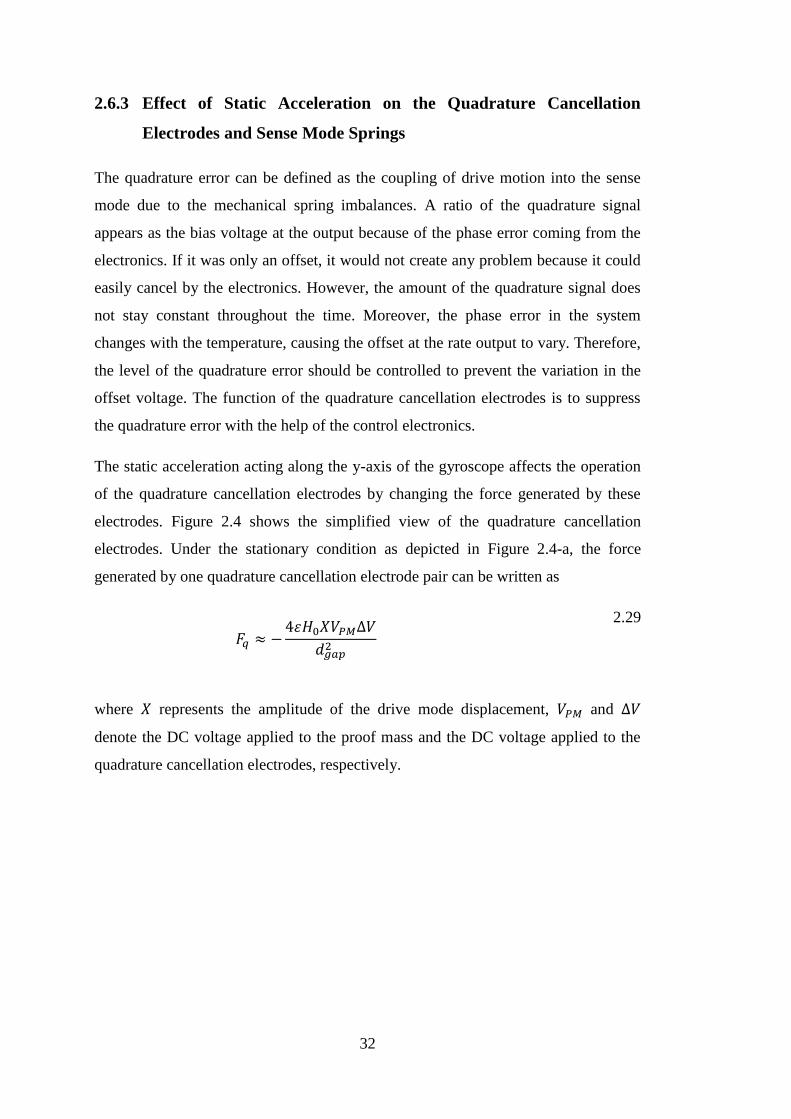
32
2.6.3 Effect of Static Acceleration on the Quadrature Cancellation
Electrodes and Sense Mode Springs
The quadrature error can be defined as the coupling of drive motion into the sense
mode due to the mechanical spring imbalances. A ratio of the quadrature signal
appears as the bias voltage at the output because of the phase error coming from the
electronics. If it was only an offset, it would not create any problem because it could
easily cancel by the electronics. However, the amount of the quadrature signal does
not stay constant throughout the time. Moreover, the phase error in the system
changes with the temperature, causing the offset at the rate output to vary. Therefore,
the level of the quadrature error should be controlled to prevent the variation in the
offset voltage. The function of the quadrature cancellation electrodes is to suppress
the quadrature error with the help of the control electronics.
The static acceleration acting along the y-axis of the gyroscope affects the operation
of the quadrature cancellation electrodes by changing the force generated by these
electrodes. Figure 2.4 shows the simplified view of the quadrature cancellation
electrodes. Under the stationary condition as depicted in Figure 2.4-a, the force
generated by one quadrature cancellation electrode pair can be written as
𝐹𝑞 ≈ −4휀𝐻0𝑋𝑉𝑃𝑀∆𝑉
𝑑𝑔𝑎𝑝2
2.29
where 𝑋 represents the amplitude of the drive mode displacement, 𝑉𝑃𝑀 and ∆𝑉
denote the DC voltage applied to the proof mass and the DC voltage applied to the
quadrature cancellation electrodes, respectively.

33
(a) (b)
Figure 2.4: Conceptual view of the quadrature cancellation electrodes under the
conditions of (a) zero and (b) static acceleration.
If the net force resulting from an applied quasi-static acceleration on the movable
sense frame is different than zero as seen in Figure 2.4-b, the following relation can
be derived for the force generated by one quadrature cancellation electrode pair:
𝐹𝑞 ≈ −4휀𝐻0𝑋𝑉𝑃𝑀∆𝑉
𝑑𝑔𝑎𝑝2+
4휀𝐿0𝐻0𝑉𝑃𝑀2 ∆𝑑𝑔𝑎𝑝
𝑑𝑔𝑎𝑝3 +
4휀𝐿0𝐻0∆𝑉2∆𝑑𝑔𝑎𝑝
𝑑𝑔𝑎𝑝3
−4휀𝐻0𝑋𝑉𝑃𝑀∆𝑉∆𝑑𝑔𝑎𝑝
2
𝑑𝑔𝑎𝑝4
2.30
Equation 2.30 shows that the force generated by the quadrature cancellation
electrodes to suppress the quadrature error decreases (or increases) with the static
acceleration acting along the positive y-axis (the negative y-axis). This means that
the voltage given to the quadrature cancellation electrodes should be increased (or
decrease) to suppress the same amount of the quadrature signal under a static
acceleration compared to the stationary case. By combining Equation 2.24 and
Equation 2.30, the change in force generated by the quadrature cancellation
electrodes, ∆𝐹𝑞 ,due to the static acceleration can be expressed as follows:
∆𝐹𝑞 ≈4휀𝐿0𝐻0𝑉𝑃𝑀
2 𝑎
𝑑𝑔𝑎𝑝3 𝑤𝑠
2+4휀𝐿0𝐻0∆𝑉
2𝑎
𝑑𝑔𝑎𝑝3 𝑤𝑠
2−4휀𝐻0𝑋𝑉𝑃𝑀∆𝑉𝑎
2
𝑑𝑔𝑎𝑝4 𝑤𝑠4
2.31

34
In Equation 2.3, the first term is more dominant compared to the other terms.
Moreover, the first term is linearly proportional with the acceleration. Thus, it is
possible to measure the acceleration acting along the sense axis by observing the
change in the quadrature cancellation controller output.
It is difficult to analytically determine the effect of the static acceleration on the
sense mode springs but the change of the position of the springs with acting
acceleration is supposed to be the main reason of the acceleration sensitivity. There
is a relation between the amount of the quadrature error and the g-sensitivity of the
gyroscope, which will be experimentally shown in Chapter 5. The main reason of the
quadrature error is the imperfection in the spring transmitting the drive force from
the drive frame to the sense frame [42]. As the gyroscope is subjected to the
acceleration, the positions of the drive frame and sense frame with respect to each
other may slightly change due to the effect of the accelerations on the springs.
Despite the closed loop quadrature cancellation controller, the level of the residual
quadrature signal change, resulting in a shift in the rate offset.
2.6.4 Design of Acceleration Cancellation Electrodes
In this thesis study, the acceleration cancellation electrodes are used to generate the
electrostatic force which counterbalances the acceleration force acting on the sense
mode without affecting the operation of the remaining part of the gyroscope. Figure
2.5 depicts the configuration of the acceleration cancellation electrodes.
Figure 2.5: Configuration of the acceleration cancellation electrodes.
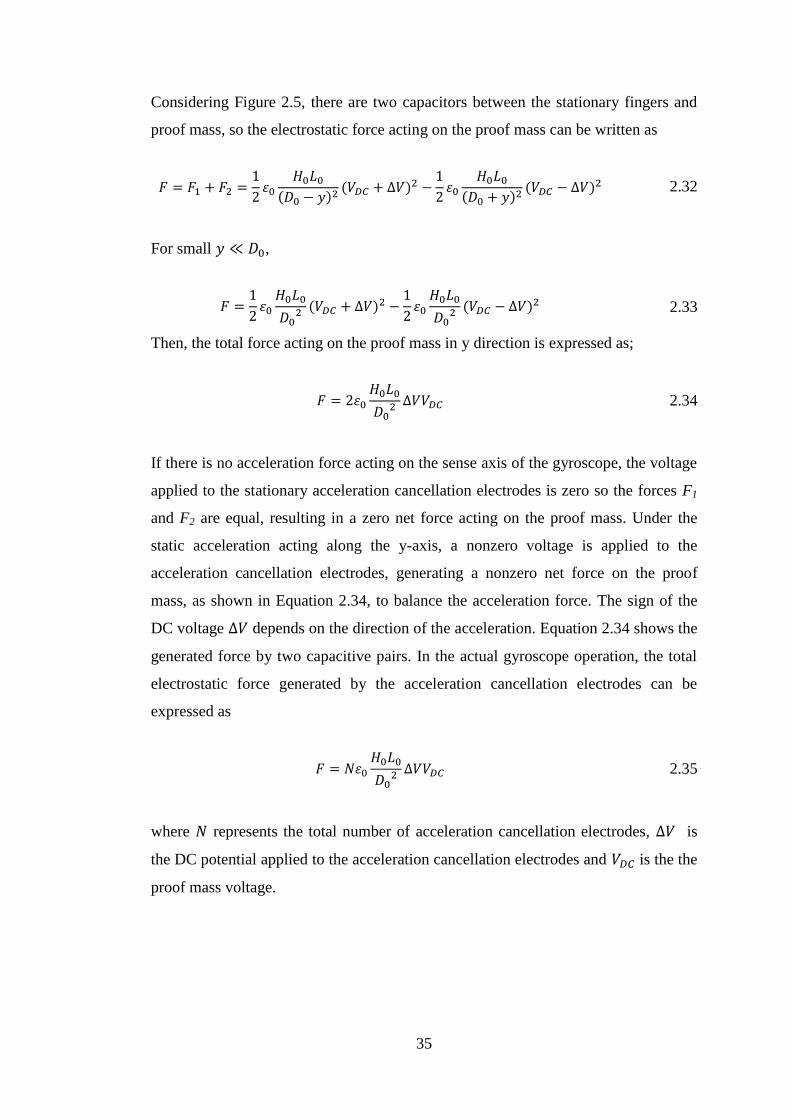
35
Considering Figure 2.5, there are two capacitors between the stationary fingers and
proof mass, so the electrostatic force acting on the proof mass can be written as
𝐹 = 𝐹1 + 𝐹2 =1
2휀0
𝐻0𝐿0(𝐷0 − 𝑦)2
(𝑉𝐷𝐶 + ∆𝑉)2 −1
2휀0
𝐻0𝐿0(𝐷0 + 𝑦)2
(𝑉𝐷𝐶 − ∆𝑉)2 2.32
For small 𝑦 ≪ 𝐷0,
𝐹 =1
2휀0𝐻0𝐿0
𝐷02 (𝑉𝐷𝐶 + ∆𝑉)2 −
1
2휀0𝐻0𝐿0
𝐷02 (𝑉𝐷𝐶 − ∆𝑉)2 2.33
Then, the total force acting on the proof mass in y direction is expressed as;
𝐹 = 2휀0𝐻0𝐿0
𝐷02 ∆𝑉𝑉𝐷𝐶 2.34
If there is no acceleration force acting on the sense axis of the gyroscope, the voltage
applied to the stationary acceleration cancellation electrodes is zero so the forces F1
and F2 are equal, resulting in a zero net force acting on the proof mass. Under the
static acceleration acting along the y-axis, a nonzero voltage is applied to the
acceleration cancellation electrodes, generating a nonzero net force on the proof
mass, as shown in Equation 2.34, to balance the acceleration force. The sign of the
DC voltage ∆𝑉 depends on the direction of the acceleration. Equation 2.34 shows the
generated force by two capacitive pairs. In the actual gyroscope operation, the total
electrostatic force generated by the acceleration cancellation electrodes can be
expressed as
𝐹 = 𝑁휀0𝐻0𝐿0
𝐷02 ∆𝑉𝑉𝐷𝐶 2.35
where 𝑁 represents the total number of acceleration cancellation electrodes, ∆𝑉 is
the DC potential applied to the acceleration cancellation electrodes and 𝑉𝐷𝐶 is the the
proof mass voltage.

36
2.7 Finite-Element Simulations
Finite-element method (FEM) is a numerical technique for analyzing the behavior of
the complex systems. In this method, the actual problem or mechanical system is
modeled in the software environment. Then, the complex system is investigated
analyzed using the constructed model. In this study, FEM simulations are conducted
to see the mode shapes and corresponding modal frequencies of the MEMS vibratory
gyroscope. Coventor, which is a simulation platform optimized for MEMS devices,
is used to perform the FEM simulations.
2.7.1 Modal Analysis
Modal analysis is used to determine the mode resonance frequencies of the analyzed
device. The drive and sense mode resonance frequencies are important for the
gyroscope design, and these frequencies can be determined approximately by the
hand calculation. However, it is quite difficult to calculate the resonance frequencies
of the higher order modes without using a simulation tool. Thus, the out of plane
modes which may deteriorate the operation of the gyroscope are identified by the
modal analysis. For a reliable gyroscope operation, the resonance frequencies of the
first two mode should be two times less than the frequency of the nearest undesired
mode.
Modal simulations have been conducted for the first 10 modes. Table 2.1 provides
the corresponding resonance frequencies of the first 10 modes the designed
gyroscope. First two ones are the drive and sense mode resonance frequencies, and
the other ones are the higher order parasitic mode frequencies which may affect the
operation of the gyroscope. Figure 2.6, Figure 2.7 and Figure 2.8 show the drive,
sense and undesired higher order mode shapes of the single-mass gyroscope,
respectively.

37
Table 2.1: Modal analysis results of the single-mass fully decoupled gyroscope
designed in this work.
Mode# Resonance Frequency (Hz) Generalized Mass (kg)
1 13733.5 1.137e-07
2 15899.9 1.011e-07
3 24569.9 7.893e-09
4 24938.1 8.932e-09
5 25906.0 1.351e-08
6 26707.1 6.582e-08
7 29661.6 2.583e-08
8 29826.3 1.180e-08
9 34198.6 2.539e-09
10 37487.5 1.724e-08
Figure 2.6: Mode shape for drive mode.

38
Figure 2.7: Mode shape for sense mode.
Figure 2.8: Mode shape for the closest undesired higher order mode at 24.6 kHz.

39
2.8 Summary
This chapter presents the mechanical model of the MEMS gyroscope studied in this
thesis. The model parameter calculation, capacitive actuation and sensing mechanism
for the MEMS gyroscope are briefly explained. The electrostatic spring effect on the
sense resonance frequency is also examined. Then, the effects of the static
acceleration on the operation of the sense, force-feedback and quadrature electrodes
are investigated in details. Moreover, the design of the acceleration cancellation
electrodes for the single-mass fully decoupled gyroscope is explained. Finally, the
FEM simulations are conducted to determine the drive and sense mode resonance
frequencies.

40

41
CHAPTER 3
3 CONTROL ELECTRONICS FOR MEMS
GYROSCOPES
This chapter presents the details of control electronics for MEMS gyroscopes studied
in this thesis. Section 3.1 explains the preamplifier stage that converts the output
current of the gyroscope to the voltage. Section 3.2 explains the closed loop drive
mode controller design. Section 3.3 introduces the closed loop rate sensing
mechanism. Section 3.4 provides the design of the closed loop quadrature
cancellation controller electronics. Section 3.5 presents the acceleration sensing
circuit and closed loop acceleration compensation electronics implemented in this
thesis. Section 3.6 gives a brief summary of the chapter.
3.1 Front-End Electronics
The output current of the gyroscope is converted to the voltage and amplified to a
desired signal level by a preamplifier and instrumentation amplifier. In the
preamplifier stage, transimpedance amplifier (TIA) is used because it is insensitive to
parasitic capacitances and contact resistances. It presents low input impedance to the
output of the sensor preventing the significant signal loss during the conversion from
current to voltage. Figure 3.1 shows the schematic of the transimpedance
implemented in this work.

42
Figure 3.1: Schematic of the transimpedance amplifier implemented in this study.
The input-output relation of the TIA can be expressed as,
|𝑉𝑜(𝑠)
𝐼𝑜(𝑠)| = 𝑍𝑝𝑟𝑒 =
𝑅𝑝𝑟𝑒
1 + 𝑠𝐶𝑝𝑟𝑒𝑅𝑝𝑟𝑒 3.1
In equation 3.1, the multiplication of 𝑠𝐶𝑝𝑟𝑒𝑅𝑝𝑟𝑒 determines whether the TIA is
resistive or capacitive type. If the multiplication of 𝑠𝐶𝑝𝑟𝑒𝑅𝑝𝑟𝑒 is much greater than 1,
the type of the preamplifier becomes capacitive. The capacitive type preamplifier is
preferred in the sense mode because it provides low noise interface enhancing a high
gain with a small resistance. In this case, the current coming from the sensor output
is converted to the voltage multiplied by1/𝑠𝐶𝑝𝑟𝑒.
If the multiplication of 𝑠𝐶𝑝𝑟𝑒𝑅𝑝𝑟𝑒 is much smaller than 1, then the type of the
preamplifier becomes resistive. Resistive type preamplifier is preferred in the drive
mode considering the system design considerations. In the resistive type
preamplifier, the function of the capacitor connected parallel to the resistor is to
compensate the parasitic effects coming from the sensor and op-amp, which
significantly improves the stability of the drive mode oscillation [43]. The
disadvantage of the resistive type preamplifier is that obtaining high gain is difficult
because the noise of the system increases with increasing resistance.

43
3.2 Drive Mode Controller Design for MEMS Gyroscope
In the gyroscope operation, the quadrature and Coriolis signals are proportional with
the drive displacement and its derivative, respectively. The stability of the drive
mode oscillation is crucial for the short and long term stabilities of the gyroscope
because any variation in the drive mode oscillation directly affects the scale factor
stability, noise and bias performances of the gyroscope. Therefore, the drive mode
displacement should be well controlled and kept constant over time for a reliable
gyroscope operation.
The operation of the drive mode loop is based on an amplitude controlled positive
feedback mechanism. The quality factor of the drive mode reaches to a few tens of
thousands in vacuum; thus, it easily enters the self-oscillation by locking its
resonance frequency with the help of the positive feedback mechanism. Then, the
amplitude of the drive oscillation is adjusted to a desired level by the amplitude
control mechanism.
Figure 3.2 shows the block diagram of the closed loop drive mode controller. In this
system, the drive signal is first picked from the output of the drive mode preamplifier
and demodulated with itself. A resistive type preamplifier is used in the drive mode
front-end electronics to minimize the phase error coming from the modulation and
demodulation. The output of the demodulator passes through a second-order low
pass filter to obtain the DC part of the demodulator signal which gives information
about the level of the drive displacement. The output of the low pass filter is
compared with a reference DC voltage to adjust the amplitude of the drive
displacement. In this step, a band gap reference is used as the reference voltage
because the output of the band gap reference is quite insensitive to environmental
variations; thus, in that way, the drive mode oscillation is kept constant over time.
Then, the error signal is fed to a PI controller which stabilizes the circuit by
diminishing the error signal. The DC output of the PI controller is modulated with
the drive pick signal. The modulated drive motor signal is a square wave because of
the switching type modulator. Since the drive mode system is a high-Q system in
vacuum, it behaves like a sharp band-pass filter. Thus, all other harmonics except the
first harmonic of the square wave is eliminated by the drive mode of the gyroscope.

44
Consequently, the amplitude controlled self-oscillation of the drive mode is achieved
at the resonance frequency.
Figure 3.2: Block diagram of the closed loop drive mode controller.
There are important design parameters that should be considered to ensure the
stability of the system while constructing the closed loop drive mode control circuit.
These parameters are basically settling time, phase margin, overshoot and steady-
state error. The settling time defines the response time of the system so it should be
decreased for a high performance gyroscope. Moreover, there should be minimum
60° phase margin in the system for a reliable and stable operation. The amount of the
overshoot is also critical in the closed loop drive mode controller design because the
drive mode displacement should not exceed the maximum allowable range which is
8 µm for this study; otherwise, it may damage the gyroscope permanently. The
steady-state error in the controller output should go to zero after the system is settled
to achieve the desired drive mode displacement, which is satisfied by an integral
based controller.
The open loop characteristic of the drive mode should be analyzed by the resonance
tests to obtain the sensor parameters such as the resonance frequency, quality factor
and gain before designing the closed loop drive mode controller. The resonance test
gives the input-output ratio in frequency domain of the drive mode. Figure 3.3 shows
the simplified view of the drive mode resonance block. The characteristic of the

45
drive mode can be explained in three blocks as seen in Figure 3.3. In the first stage,
the actuation voltage is converted to the actuation force by the drive motor
electrodes. Then, the actuation force provides the sustained displacement of the drive
pick electrodes. Finally, the displacement is converted to the current by the
capacitive sensing mechanism. The output of the sensor is the current, and this
current is transformed to the voltage by the front-end electronics.
Figure 3.3: Simplified view of the drive mode resonance test schematic.
The open loop transfer function of the drive mode of the gyroscope can be written as
the multiplication of the conversion blocks in the following way:
𝑉𝑜𝑢𝑡(𝑠)
𝑉𝑖𝑛(𝑠)=𝐹𝐷(𝑠)
𝑉𝑖𝑛(𝑠)
𝑋𝐷(𝑠)
𝐹𝐷(𝑠)
𝐼𝐷(𝑠)
𝑋𝐷(𝑠)
𝑉𝑜𝑢𝑡(𝑠)
𝐼𝐷(𝑠) 3.2
Inserting Equation 2.3, 2.15, 2.18 and 3.1 into Equation 3.2, the open loop transfer
function of the drive mode can be expressed in terms of the sensor parameters as
𝑉𝑜𝑢𝑡(𝑠)
𝑉𝑖𝑛(𝑠)= 𝑉𝑃𝑀
𝜕𝐶𝐷𝑀𝜕𝑥
1/𝑚𝐷
(𝑠2 +𝑤𝐷
𝑄𝐷𝑠 + 𝑤𝐷
2)𝑉𝑃𝑀
𝜕𝐶𝐷𝑃𝜕𝑥
𝑠𝑍𝑝𝑟𝑒𝐴𝑖𝑛𝑠𝑡 3.3
In Equation 3.3, the multiplication of drive motor 𝜕𝐶𝐷𝑀
𝜕𝑥 and drive pick
𝜕𝐶𝐷𝑃
𝜕𝑥
sensitivity can be found by equating the resonance gain of the drive mode to the right
side of the equation. The mass of the drive mode 𝑚𝐷 is found by the hand calculation

46
using the design parameter of the gyroscope. The proof mass voltage 𝑉𝑃𝑀, the
preamplifier gain 𝑍𝑝𝑟𝑒 and the instrumentation amplifier gain 𝐴𝑖𝑛𝑠𝑡 are known by the
design. The drive mode resonance gain 𝑤𝐷 and the drive mode quality factor 𝑄𝐷 are
obtained from the resonance test. After finding the multiplication of the 𝜕𝐶𝐷𝑀
𝜕𝑥 and
𝜕𝐶𝐷𝑃
𝜕𝑥, these terms can be calculated individually according to their ratio in the design.
Actually, the sensitivities of the drive motor and drive pick electrodes are adjusted to
be equal in this study.
In the drive mode controller, the amplitude of the drive pick signal is controlled to
set the drive displacement since the drive displacement is directly proportional with
the drive pick signal. As the drive mode displacement gets larger, the noise
performance of the gyroscope gets better because the mechanical noise of sensor
decreases. However, adjusting the drive mode displacement, the overshoot in the
controller output should be also considered for a safe gyroscope operation.
Moreover, the drive mode frequency variation with temperature is also critical while
adjusting the drive mode displacement. Since the drive pick signal stay constant
instead of the drive displacement in Equation 3.4, any change in the resonance
frequency directly affects the amplitude of the displacement. But, a few Hz
frequency shift is negligible because the resonance frequency of the studied
gyroscope is around 11 kHz.
𝑉𝐷𝑃(𝑗𝑤) = 𝑉𝑃𝑀𝜕𝐶𝐷𝑃𝜕𝑥
𝑗𝑤𝐷𝑋𝐷𝑍𝑝𝑟𝑒𝐴𝑖𝑛𝑠𝑡 3.4
The design parameters such as the settling time overshoot and phase margin of the
drive mode are adjusted by analyzing the open loop response of the drive mode
controller. The drive mode of the gyroscope has a second order model but this model
makes the analysis very complicated. Instead, the drive mode dynamics between the
modulator and demodulator is simplified to a first order system which is the
enveloped model of the modulated system as,
𝐻𝐷(𝑠) =𝐴𝐷
1 + 𝑠(2𝑄𝐷/𝑤𝐷) 3.5

47
where 𝐴𝐷 represents the drive mode resonance gain of the gyroscope with the
preamplifier stages, 𝑄𝐷 is the quality factor, and 𝑤𝐷 is the resonance frequency of the
drive mode.
The “Butterworth” type second order low pass filter with a multi-feedback topology
is employed in all controllers in this study. The cut-off frequency of the filter is set to
100Hz for the drive mode. The low pass filter gain is adjusted considering the drive
displacement. Under these conditions, the open loop transfer function of the drive
mode controller can be written as
𝐻𝑂𝐿(𝑠) =𝐴𝐷
1 + 𝑠(2𝑄𝐷/𝑤𝐷)𝐾𝐷𝑒𝑚𝑜𝑑𝐻𝐿𝑃𝐹(𝑠)
𝐾𝐼(1 + 𝑠𝐾𝑃/𝐾𝐼)
𝑠𝐾𝑀𝑜𝑑 3.6
where 𝐻𝐿𝑃𝐹(𝑠) is the transfer function the low pass filter, 𝐾𝑀𝑜𝑑 and 𝐾𝐷𝑒𝑚𝑜𝑑 are the
gain of the modulator and demodulator, respectively. Moreover, 𝐾𝐼 and 𝐾𝑃 are the
integral and proportional gain of the PI controller. In Equation 3.6, the pole coming
from the envelope model of the gyroscope deteriorates the stability of the system.
Thus, this pole is cancelled with the zero of the PI controller using the pole-zero
cancellation method explained in [44]. After the pole-zero cancellation, the open
loop transfer function of the drive mode becomes a third order system which has
totally three poles.
The open loop characteristic should be simulated to optimize the phase margin,
settling time and overshoot using the real sensor and controller parameters. The drive
mode model parameters of the sample gyroscope (Gyro 1207) which are obtained
through the resonance test are provided in Table 3.1.
Table 3.1: Drive mode resonance characteristics of the sample gyroscope (Gyro
1207) used during the design of the closed loop drive mode controller for 14 VPM .
Model Parameter (Drive Mode) Value
Resonance Frequency (fD) 10813 Hz
Resonance Gain (AD) 16.3dB (6.5)
Quality Factor (QD) 48000

48
The open loop transfer function in Equation 3.6 can be written using the real sensor
and controller parameters as,
𝐻𝑂𝐿(𝑠) =6.5
1 + 𝑠(1/0.71)∗2
𝜋∗
7.9 ∗ 394784
𝑠2 + 881.1𝑠4394784∗𝐾𝐼(1 + 𝑠𝐾𝑃/𝐾𝐼)
𝑠∗4
𝜋 3.7
As seen in Equation 3.7, the gain of the demodulator and low pass filter are adjusted
to 1 and 7.9, respectively, to achieve 780 mV peak-to-peak drive pick signal which
corresponds to 4 µm drive displacement for the sample gyroscope. The factors of 2/π
and 4/π are the RMS value of the rectified drive pick signal and the first harmonic of
the square wave drive motor signal, respectively. After a few iterations in MATLAB,
KP is optimized as 5.4 and KI is optimized as 3.8 to achieve the sufficient phase
margin, minimum settling time and minimum overshoot for the design. Figure 3.4
depicts the bode diagram of the drive mode open loop transfer function, showing that
the phase margin of the system is greater than 60°.
Figure 3.4: Bode diagram of the drive mode open loop transfer function.

49
The settling time and overshot of the closed loop drive mode system can be obtained
by analyzing the step response of the open loop transfer function in MATLAB.
Figure 3.5 depicts the step response of the closed loop drive mode controller. As seen
in Figure 3.5, the settling time of the system is around 16 msec without any
overshoot.
Figure 3.5: Step response of the closed loop drive mode controller.
The transient behavior of the closed loop drive control system is analyzed in
MATLAB SIMULINK by modeling the drive system using the second order sensor
model with the real sensor and controller values. Figure 3.6 shows the SIMULINK
model for the closed loop drive mode controller circuit. Figure 3.7 depicts the
transient behavior of the drive pick signal obtained using the SIMULINK model in
Figure 3.6. As seen in Figure 3.7, the settling time of the system is around 15 msec
which is consistent with the open loop analysis. Moreover, the peak to peak value of
the drive pick signal is 780mV as calculated for 4 µm drive displacement.

50
Figure 3.6: SIMULINK model of the closed loop drive mode control electronics for
the sample gyroscope.
Figure 3.7: Drive pick signal obtained using the realistic SIMULINK model of the
drive mode control electronics.

51
3.3 Design of Closed Loop Rate Sensing Mechanism
The purpose of the closed loop rate sensing system is to obtain the rate information
by preventing the sense mode displacement of the gyroscope caused by Coriolis
acceleration. In the open loop operation of the gyroscope, the bandwidth of the
system is restricted by the mechanical bandwidth which is around a few Hz.
Moreover, the scale factor may deviate due to the drift of the quality factor with time
and the change of the capacitive gap spacing with the angular rate input. To get over
the issues related with the open loop rate sensing mechanism, the closed loop rate
sensing mechanism which does not deteriorate the scale factor stability and
bandwidth is preferred to sense the induced Coriolis acceleration in the controller
electronics of the gyroscope.
Force-feedback electrodes are generally preferred in the closed loop gyroscope
operation to stop the movement of the proof mass caused by Coriolis force. The
proposed closed loop rate sensing mechanism keeps the sense mode of the gyroscope
stationary by generating the electrostatic force with the aid of the force-feedback
electrodes to balance the Coriolis force. The condition to stop the sense mode
displacement due to Coriolis acceleration is derived in [6] as
𝑉𝑃𝑀𝜕𝐶𝐹𝐹𝜕𝑦
𝑉𝐹𝐹 = 2𝑚𝑃𝑀𝛺𝑗𝑤𝐷𝑋𝐷 3.8-a
𝑉𝐹𝐹 =2𝑚𝑃𝑀𝛺𝑗𝑤𝐷𝑋𝐷
𝑉𝑃𝑀𝜕𝐶𝐹𝐹𝜕𝑦
3.8-b
In Equation 3.8, 𝜕𝐶𝐹𝐹/𝜕𝑦 represents the sensitivity of the force-feedback electrodes,
and 𝑉𝐹𝐹denotes the amplitude of the AC signal applied to the force-feedback
electrodes. As seen in Equation 3.8, the amplitude of 𝑉𝐹𝐹is directly proportional with
the applied rate, and it does not depend on the ambient conditions. Therefore, the
scale factor of the gyroscope output is more stable in the closed loop operation
compared to the open loop operation. Moreover, the bandwidth of system can be
controlled independently from the mechanical sensor parameters with the help of the
controller.

52
Figure 3.8: Block diagram of the closed loop sense mode controller for the mismatch
operation.
Figure 3.8 shows the block diagram of the closed loop controller for the sense mode.
In this system, the capacitive preamplifiers pick the sense mode signals caused by the
Coriolis force differentially. Then, the sense signals are demodulated with the drive
signal in the mismatch operation using the phase sensitive modulation and passes
through the low-pass filter. The low pass filter output is fed to the controller. This
controller generates a DC voltage proportional with the amplitude of the angular
rotation. The output of the controller is modulated with the drive signal, and the
modulated signals are differentially applied to the force-feedback electrodes in the
gyroscope. In this system, the rate information is extracted from the output of the
controller using a buffer or amplifier.
The open loop characteristic of the transfer function should be examined to optimize
the controller parameters before analyzing the closed loop behavior of the system.
The open loop transfer function of the sense mode can be expressed as,

53
𝐻𝑂𝐿(𝑠) =𝑉𝑆𝑃(𝑠)
𝑉𝐹𝐹(𝑠)𝐾𝐷𝑒𝑚𝑜𝑑𝐻𝐿𝑃𝐹(𝑠)
(𝐾𝑃𝑠 + 𝐾𝐼)
𝑠𝐾𝑀𝑜𝑑 3.9
In Equation 3.10,𝐾𝐷𝑒𝑚𝑜𝑑 represents the gain of the demodulator, 𝐾𝑀𝑜𝑑 denotes the
gain of the modulator, 𝐻𝐿𝑃𝐹(𝑠) is the transfer function of the low pass filter. Since
the gyroscope is operated in the mismatch condition, the second order model of the
sense mode cannot be simplified to the first order model in this case. Instead, the
sense mode dynamics is modeled as a constant gain stage under mismatch condition.
The transfer function of the sense mode can written as,
𝑉𝑆𝑃(𝑠)
𝑉𝐹𝐹(𝑠)= 𝑉𝑃𝑀
𝜕𝐶𝐹𝐹𝜕𝑦
1/𝑚𝑆
(𝑠2 +𝑤𝑆
𝑄𝑆𝑠 + 𝑤𝑆
2)𝑉𝑃𝑀
𝜕𝐶𝑆𝑃𝜕𝑦
𝑠𝑍𝑝𝑟𝑒𝐴𝑖𝑛𝑠𝑡 3.10
In Equation 3.10, 𝜕𝐶𝐹𝐹
𝜕𝑦 denotes the sensitivity of the forcefeedback electrodes and
∂CSP
∂y represensts the sensitivity of the sense pick electrodes. The multiplication of
these two terms can be extracted from the resonance tests. At the off resonance
condition, the 𝑉𝑆𝑃(𝑠)/𝑉𝐹𝐹(𝑠) can considered as a constant gain stage, and its gain is
calculated by inserting the drive mode resonance frequency instead of the frequency
term in Equation 3.10. Then using the real sensor and circuit parameters, the open
loop transfer function of the sense mode for the sample gyroscope can be written as,
𝐻𝑂𝐿(𝑠) = 0.68 ∗4
𝜋∗
6.56 ∗ 394784
𝑠2 + 881.1𝑠 + 394784∗(𝐾𝑃𝑠 + 𝐾𝐼)
𝑠∗4
𝜋 3.11
In Equation 3.11, the first 4
𝜋 denotes the rms value of the rectified sinus with a
demodulator gain of 2, the second 4
𝜋 represents the first harmonic of the square wave
force feedback signal. The low pas filter has a gain of 6.56 and a cut-off frequency of
100Hz. An integral controller is preferred instead of the PI controller because
introducing a zero to this system deteriorates the response of the low pass filter. After
a few iterations in MATLAB, KP is set to zero and KI is optimized as 18 to achieve

54
the sufficient phase margin, minimum settling time and minimum overshoot for the
design.
Figure 3.9 shows the bode plot of the open loop sense mode system. The system has
a phase margin of 69° which is sufficient for a reliable gyroscope operation. Figure
3.10 shows the step response of the closed loop sense mode system. The settling time
of the system is about 16 msec, which ensures that the bandwidth of the system is
wider than 60 Hz.
Figure 3.9: Bode diagram of the sense mode open loop transfer function.

55
Figure 3.10: Step response of the closed loop sense mode controller.
The transient behavior of the closed loop sense mode control system is analyzed in
MATLAB SIMULINK by modeling the sense system using the second order sensor
model with the real sensor and controller values. Figure 3.11 shows the SIMULINK
model of the closed loop sense mode controller circuit. In this model, the quadrature
cancellation loop and acceleration control loop are also integrated to the system to
take into account the effects of the other control loops on the force-feedback loop.
During the simulation, 1°/s angular rate input is applied to the gyroscope system.
Figure 3.12 shows the response of the gyroscope rate output to the applied angular
rate input, which corresponds to the scale factor of 2.1mV/°/s. Similarly, Figure 3.13
depicts the transient behavior of the sense pick signal as a response to the applied
angular rate input. The sense pick signal carries information about the sense mode
displacement. As the time passes, the amount of the sense pick signal diminishes
thanks to the closed loop sense mode controller, which shows the effectiveness of the
closed loop sense mode controller.

56
Figure 3.11: SIMULINK model of the closed loop sense mode control electronics for
the sample gyroscope.
Figure 3.12: Settling behavior of the gyroscope rate output in response to 1°/s
angular rate input.

57
Figure 3.13: Transient behavior of the sense pick signal in response to 1°/s angular
rate input.
Bandwidth is also a critical design parameter for the sense mode controller, and it
should be considered during the simulation. To measure the bandwidth of the closed
loop controller, a sinusoidal angular rate input, whose frequency varies between 0Hz
and 70 Hz in time, is applied to the gyroscope system as a Coriolis signal. Figure
3.14 shows the frequency response characteristic of the rate output as a response to
the varying frequency rate input. By using Figure 3.14, the bandwidth of the closed
loop sense mode control system is calculated to be 60 Hz which corresponds to 3dB
point on the graph.

58
Figure 3.14: Response of the gyroscope rate output to a time varying rate which has
amplitude of 1°/s.
3.4 Design of Quadrature Control Electronics
The operation of the quadrature control electronics relies on the phase sensitive
modulation, which is similar to control mechanism used in the force feedback loop.
Figure 3.15 depicts the block diagram of the quadrature control electronics. As
opposed to the force feedback control loop, the sense pick signal including the
quadrature signal is demodulated with the 90° phase shifted version of the drive pick
signal in the quadrature control electronics. Then, the demodulated signal passes
through the low pass filter. The low pass filter output is compared with a reference
voltage, which enables to adjust the amount of the quadrature signal because a level
controllable residual quadrature signal should always exist in the system for the
operation of the acceleration cancellation electronics. The resultant error signal is
given to the controller which produces a DC voltage that is applied to the quadrature
cancellation electrodes differentially.
3dB Point

59
Figure 3.15: Block diagram of the closed loop quadrature cancellation controller for
the mismatch operation.
The quadrature controller system utilizes the electrostatic forces which are produced
by the differential quadrature cancellation electrodes. These forces generate a
rotational torque on the proof mass to suppress the quadrature error. The electrostatic
force generated by the quadrature cancellation is derived in [42] as
𝐹𝑄 = 𝑛4𝑉𝑃𝑀휀𝑋𝐻0∆𝑉
𝐷02 3.12
where n is the number of the quadrature cancellation electrode set,∆𝑉 is the potential
applied to the quadrature electrodes, 𝐻0 and 𝐷0 are the height and gap spacing of the
quadrature electrodes, respectively.
The open loop characteristic of the system should be studied to determine the
appropriate controller values before analyzing the closed loop behavior of the
quadrature cancellation electrodes. The generated force by the quadrature
cancellation electrodes acts on the sense mode of the gyroscope so the open loop
transfer function of the system can be written as follow:
𝐻𝑂𝐿(𝑠) =𝑉𝑆𝑃(𝑠)
𝐹𝑄(𝑠)𝐾𝐷𝑒𝑚𝑜𝑑𝐻𝐿𝑃𝐹(𝑠)
𝐾𝐼(1 + 𝑠𝐾𝑃/𝐾𝐼)
𝑠𝐾𝑄𝑢𝑎𝑑 3.13

60
In Equation 3.13,𝐾𝐷𝑒𝑚𝑜𝑑 is the gain of the demodulator, 𝐻𝐿𝑃𝐹(𝑠) is the transfer
function of the low pass filter and 𝐾𝑄𝑢𝑎𝑑 is the gain of the quadrature configuration
which can be calculated by dividing 𝐹𝑄 by quadrature potential ∆𝑉 in Equation 3.12.
Since the gyroscope is operated in the mismatch condition, 𝑉𝑆𝑃(𝑠)/𝐹𝑄(𝑠) is
modeled as a constant gain stage using a similar approach as in the sense control
loop. Using the appropriate conversion mechanisms, the gyroscope model for the
quadrature loop can be expressed as
𝑉𝑆𝑃(𝑠)
𝐹𝑄(𝑠)=
1/𝑚𝑆
(𝑠2 +𝑤𝑆
𝑄𝑆𝑠 + 𝑤𝑆
2)𝑉𝑃𝑀
𝜕𝐶𝑆𝑃𝜕𝑦
𝑠𝑍𝑝𝑟𝑒𝐴𝑖𝑛𝑠𝑡 3.14
In Equation 3.13, ∂CSP
∂y represensts the sensitivity of the sense pick electrodes, and the
other parameters are known form the resonance tests. In Equation 3.13, the gain of
𝑉𝑆𝑃(𝑠)/𝐹𝑄(𝑠) is calculated by inserting the drive mode resonance frequency instead
of the frequency term in Equation 3.14. Then using the real sensor and circuit
parameters, the open loop transfer function of the quadrature cancellation loop for
the sample gyroscope can be written as,
𝐻𝑂𝐿(𝑠) = 4.5 ∗ 106 ∗2
𝜋∗
1 ∗ 394784
𝑠2 + 881.1𝑠 + 394784∗(𝐾𝑃𝑠 + 𝐾𝐼)
𝑠∗ 1.9 ∗ 10−7 3.15
Where 2
𝜋 denotes the rms value of the rectified sinus with a unity gain modulator. The
low pas filter has the cut-off frequency of 100Hz with the unity gain. Using a similar
approach with the sense mode controller design, an integral control is implemented
instead of the PI controller not to degrade the low pass characteristic of the system.
After a few iterations in MATLAB, KP is set to zero and KI is optimized as 52 to
achieve the sufficient phase margin, minimum settling time and minimum overshoot
for the design.
Figure 3.16 shows the bode plot of the open loop sense mode system. The system has
a phase margin of 70 which is sufficient for a reliable gyroscope operation. Figure
3.17 depicts the step response of the closed loop sense mode system. The system has
a settling time about 25 msec.

61
Figure 3.16: Bode diagram of the open loop quadrature control electronics.
Figure 3.17: Step response of the closed loop quadrature cancellation controller.

62
The transient behavior of the closed loop quadrature cancellation system is analyzed
in MATLAB SIMULINK by modeling the sense system using the second order
sensor model with the real sensor and controller values. Figure 3.18 depicts the
SIMULINK model for the closed loop quadrature cancellation circuit. In this model,
50 nN quadrature error is intentionally applied to the gyroscope system to observe
the closed loop behavior of the quadrature cancellation controller.
Figure 3.19 depicts the transient behavior of the sense pick signal in the presence of
the quadrature error. The sense pick signal carries information about the sense mode
displacement, which maximizes while system is reaching to steady-state, and then it
diminishes thanks to the closed loop quadrature cancellation controller.
Figure 3.20 shows the transient behavior of the output of the quadrature cancellation
electrodes which generates quadrature force to suppress the quadrature error. These
electrodes generate approximately 50 nN force out of phase with the quadrature
error, which suppresses the quadrature error exists in the system.
Figure 3.18: SIMULINK model of the closed loop quadrature cancellation control
electronics for the sample gyroscope.

63
Figure 3.19: Transient behavior of the sense pick signal in the presence of the
quadrature error and closed loop quadrature control electronics.
Figure 3.20: Applied quadrature force to suppress the quadrature error exists in the
system.

64
3.5 Design of Acceleration Sensing and Compensation Electronics
The proposed acceleration sensing and compensation methods rely on the utilization
of the amplitude difference information between the residual quadrature signals on
the differential sense-mode electrodes. In these methods, the amplitudes of the
sustained differential quadrature signals are compared to measure the linear
acceleration acting on the sense-axis of the gyroscope, which requires no external
accelerometer.
During the gyroscope operation, the sense mode frame is kept stationary with the aid
of the force feedback electronics in the absence of the external acceleration, as
depicted in Figure 2.4-a. However, it is seen from Figure 2.4-b that when the net
force resulting from an applied quasi-static acceleration on the movable sense frame
is different than zero, the capacitive gap spacing decreases on one side and increases
on the other, resulting in a shift at the sense-mode vibration axis. This shift causes a
variation at the amplitudes of the quadrature signals on the differential sense-mode
electrodes, i.e., the amplitude of the quadrature signal increases (or decreases) with a
decreasing (or increasing) capacitive gap under the condition of an applied static
acceleration condition compared to the case when there is no acceleration. By
comparing the amplitudes of the sustained differential residual quadrature signals,
the amplitude of the acceleration is measured.
This thesis study is conducted in three phases. In the first phase of the study, only the
acceleration sensing electronics is implemented to measure the acceleration acting on
the sense axis of the gyroscope. In this method, the acceleration cancellation
electronics is operated in open loop mode so no feedback is given to the gyroscope to
eliminate the effect of the acceleration during the operation. By finding an
experimental relation between the rate and acceleration outputs of the gyroscope in
response to the applied quasi-static acceleration, the effect of the static acceleration
on the gyroscope output is compensated by external calibration techniques. In the
second phase of the study, a feedback voltage is applied to the sense mode electrodes
by using the non-inverting inputs of the sense mode preamplifiers to stop the motion
caused by the static acceleration on the sense axis, in addition to the acceleration
sensing circuit. In this method, the sense mode electrodes are utilized for both
sensing and actuation purposes. In the third phase of the study, the dedicated

65
acceleration cancellation electrodes are employed to isolate the operation of the
acceleration control electronics from the remaining part of gyroscope system. In this
method, the acceleration force acting along the sense axis of the gyroscope is
counterbalanced in operation by generating an opposite force with the aid of the
dedicated electrodes.
3.5.1 Open Loop Acceleration Compensation Electronics
The operation principle of the acceleration sensing mechanism is mainly based on
the comparison of the amplitudes of the residual quadrature signals, directly picked
from the differential sense-mode electrodes. Figure 3.21 shows the block diagram of
the acceleration sensing electronics. In this method, the amplitudes of the sustained
residual quadrature signals on the differential sense mode electrodes are compared
using a summing amplifier. The output of the summing amplifier is then
demodulated with the drive channel output (DP), and the resulting rectified signal is
passed through a low pass filter (LPF) to get the amplitude information of the
acceleration. It should be noted that the amplitude of the sustained quadrature signals
of the gyroscope is adjusted to be a certain level to set the scale factor of the
acceleration output of the gyroscope to a known level and to prevent saturation at the
force-feedback electronics.
Figure 3.21: Block diagram of the acceleration sensing electronics for the mismatch
operation.
The main motivation behind the acceleration sensing and compensation method is to
sense the static acceleration acting on the sense-axis and eliminate the effect on the
acceleration on the gyroscope output using the experimental relation between the

66
acceleration and gyroscope output. Referring to Figure 3.21, the acceleration output
which is picked from the low pass filter output can be written as,
𝑉𝑎𝑐𝑐𝑒 = (𝐼𝑆𝑃+ + 𝐼𝑆𝑃−)𝑍𝑝𝑟𝑒𝐴𝑠𝑢𝑚𝑚𝑖𝑛𝑔
2
𝜋 3.16
where 𝐼𝑆𝑃+ and 𝐼𝑆𝑃− are the differential sense mode channel output currents, 2
𝜋
denotes the rms value of the rectified sinus with a unity gain modulator, and 𝑍𝑝𝑟𝑒
and 𝐴𝑠𝑢𝑚𝑚𝑖𝑛𝑔 are the gain of the preamplifier and summing amplifier stages,
respectively. Combining Equation 2.4, 2.18, 3.14 and 3.16, the acceleration output of
gyroscope can be indicated in terms of the applied acceleration and known
parameters for the small acceleration displacement as,
𝑉𝑎𝑐𝑐𝑒 ≅ 𝑉𝑞𝑢𝑎𝑑_𝑠𝑒𝑡𝐴𝑠𝑢𝑚𝑚𝑖𝑛𝑔
𝐴𝑖𝑛𝑠𝑡𝑟
2𝑎
𝐷𝑔𝑎𝑝𝑤𝑠2
3.17
where 𝑉𝑞𝑢𝑎𝑑_𝑠𝑒𝑡 is the offset voltage given to the input of the quadrature controller
op-amp, 𝐴𝑖𝑛𝑠𝑡𝑟 is the gain of the instrumentation amplifier used in the sense mode
electronics, 𝐷𝑔𝑎𝑝 is the gap spacing of the sense mode electrodes, 𝑤𝑠 is the sense
mode resonance frequency, and 𝑎 is the amplitude of the acceleration acting on the
sense axis of the gyroscope. Equation 3.17 implies that the acceleration output of the
gyroscope is linearly proportional with the amplitude of the static acceleration for the
small acceleration displacement.
Although the acceleration acting along the sense-axis affects the rate output of the
gyroscope in different ways as mentioned in Section 2.6, it is possible to extract a
relation between the rate output and acceleration experimentally. For small
amplitudes of acceleration, the change in the capacitive electrode gaps would also be
small. Thus, a linear relation can be assumed between the rate output variation of the
gyroscope and the applied acceleration. The same assumption is also valid for the
acceleration output, as shown in Equation 3.17. Under these assumptions, the rate
and acceleration outputs of the gyroscope can be represented as follows;
𝑉𝑟𝑎𝑡𝑒 ≅ 𝐴. 𝑎 + 𝐵. 𝛺 + 𝑉𝑟𝑎𝑡𝑒𝑜𝑓𝑓𝑠𝑒𝑡 3.18-a

67
𝑉𝑎𝑐𝑐𝑒 ≅ 𝐶. 𝑎 + 𝐷. 𝛺 + 𝑉𝑎𝑐𝑐𝑒. 𝑜𝑓𝑓𝑠𝑒𝑡 3.18-b
where “a” is the external acceleration and “Ω” is the input angular rate. A is the g-
sensitivity of the gyroscope, B is the gyro scale factor, C is the accelerometer scale
factor and D is the rate sensitivity of the accelerometer output. According to these
expressions, the rate and acceleration outputs are functions of both the angular rate
and the static acceleration. The reason of the change in the acceleration output with
the angular rate is the unavoidable phase error in the electronics. These acceleration
and rate constants for a specific gyroscope are determined by the static acceleration
and angular velocity tests. Then, the effect of the acceleration on the gyroscope
output is compensated [31].
In this method, there is no need for the controller design since the circuit is operated
in the open loop mode. However, the acceleration sensing electronics is modeled
using the real circuit and sensor parameters in MATLAB SIMULINK to analyze the
transient behavior of system in response to the applied static acceleration. As being
different from the previous simulations and system models, all control loops are
implemented together and operated simultaneously to be able to see the effect of the
acceleration on the gyroscope operation. Figure 3.22 shows the SIMULINK model of
the open loop acceleration sensing electronics with the other control loops.
Figure 3.22: SIMULINK model of the open loop acceleration sensing circuit with the
force-feedback and quadrature cancellation loops.
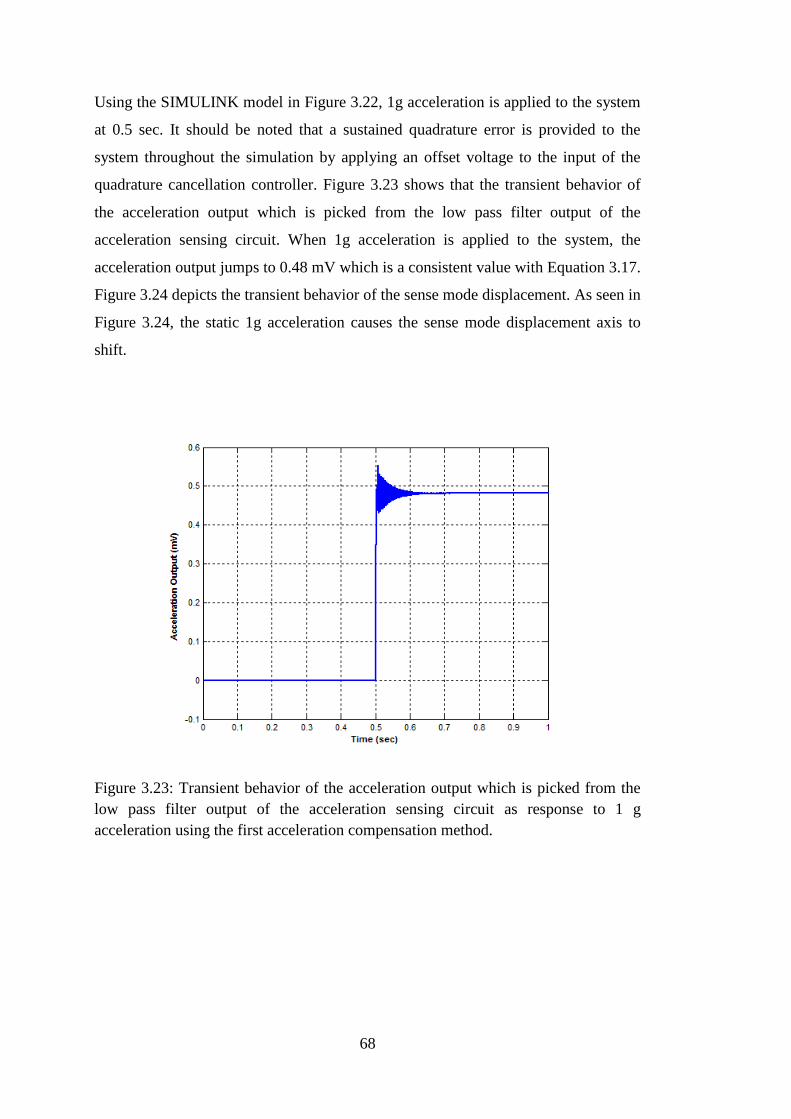
68
Using the SIMULINK model in Figure 3.22, 1g acceleration is applied to the system
at 0.5 sec. It should be noted that a sustained quadrature error is provided to the
system throughout the simulation by applying an offset voltage to the input of the
quadrature cancellation controller. Figure 3.23 shows that the transient behavior of
the acceleration output which is picked from the low pass filter output of the
acceleration sensing circuit. When 1g acceleration is applied to the system, the
acceleration output jumps to 0.48 mV which is a consistent value with Equation 3.17.
Figure 3.24 depicts the transient behavior of the sense mode displacement. As seen in
Figure 3.24, the static 1g acceleration causes the sense mode displacement axis to
shift.
Figure 3.23: Transient behavior of the acceleration output which is picked from the
low pass filter output of the acceleration sensing circuit as response to 1 g
acceleration using the first acceleration compensation method.

69
Figure 3.24: Transient behavior of the sense mode displacement which shifts when
the 1g acceleration is applied using the first acceleration compensation method.
3.5.2 Closed Loop Acceleration Cancellation Electronics Using Sense
Mode Electrodes
This method aims to eliminate the effect of the static acceleration on the gyroscope
output in operation by applying differential feedback voltages to the sense mode
electrodes using the non-inverting inputs of the preamplifiers. In this method, the
acceleration force acting on the sense axis is balanced by generating a DC force on
the sense mode electrodes. Figure 3.25 shows the block diagram of the closed loop
acceleration cancellation electronics which utilizes the sense mode electrodes for the
generation of the acceleration cancellation voltage for the mismatch operation. As
opposed to the open loop operation of the acceleration compensation circuit, the
output of the low pass filter is fed to the controller. The controller generates a DC
voltage applied to the sense mode electrodes via the non-inverting inputs of the sense
mode preamplifiers differentially.

70
Figure 3.25: Block diagram of the closed loop acceleration cancellation electronics
which utilizes the sense mode electrodes for the generation of the acceleration
cancellation voltage for the mismatch operation.
Although this method is an improved version of the open loop acceleration
compensation method, it still has certain drawbacks. First of all, the effect of the
acceleration cannot be completely suppressed during the gyroscope operation
because of the working principle of the acceleration sensing electronics. In this thesis
study, the acceleration is sensed by comparing the amplitudes of the sustained
quadrature signals on the sense mode electrodes as mentioned in Section 3.5.1.
However, the amplitude of these signals depends on both the gap spacing and DC
voltages of the electrodes. When the feedback voltage is applied to the sense mode
electrodes, the position of the sense axis and the potential difference on the sense
capacitances change together. Since two agents simultaneously try to make the same
error signal zero in this system, the controller settles before the force generated by
the sense mode electrodes equals to the acceleration force. Thus, it is mathematically
impossible to cancel the effect of the acceleration on the gyroscope output in
operation using this method. Moreover, changing the voltage of the non-inverting
inputs of the preamplifiers affect the operation of the all other control loops because
the operation of the all control circuits starts with the same sense pick signals.
Using a similar approach with the other controller designs, an integral control is
implemented instead of the PI controller not to degrade the low pass characteristic of

71
the system. In the controller design, KP is set to zero and KI is optimized as 10 to
achieve the system requirements.
The transient behavior of the closed loop acceleration cancellation system proposed
in this method is analyzed in MATLAB SIMULINK by modeling the sense system
using the second order sensor model with the real sensor and controller values.
Similar to the previous compensation method, all control loops are implemented
together and operated simultaneously to be able to see the effect of the acceleration
on the gyroscope operation. Figure 3.26 shows the SIMULINK model of the open
loop acceleration sensing electronics with the other control loops.
Figure 3.26: SIMULINK model of closed loop acceleration compensation circuit
which utilizes the sense mode electrodes for the generation of the acceleration
cancellation voltage.
Using the SIMULINK model in Figure 3.26, 1g acceleration is applied to the system
at 0.5 sec. Similar to the previous case, a sustained quadrature error is provided to the
system throughout the simulation by applying an offset voltage to the input of the
quadrature cancellation controller. Figure 3.27 shows that the transient behavior of
the acceleration output which is picked from acceleration controller output. When 1g
acceleration is applied to the system, the acceleration output jumps to 12 mV which

72
is a consistent with experimental value. Figure 3.28 shows the transient behavior of
the sense mode displacement. Although the closed loop acceleration controller tries
to pull the sense axis back in this method, it cannot eliminate the effect of the
acceleration due to the reasons mentioned above.
Figure 3.27: Transient behavior of the acceleration controller output as response to 1
g acceleration using the second acceleration compensation method.
Figure 3.28: Transient behavior of the sense mode displacement as response to 1 g
acceleration using the second acceleration compensation method.

73
3.5.3 Closed Loop Acceleration Cancellation Electronics Using
Acceleration Cancellation Electrodes
In this method, the effect of the acceleration on the gyroscope output is suppressed
by counterbalancing the acceleration force with the aid of the acceleration
cancellation electrodes. Figure 3.29 shows the block diagram of the closed loop
acceleration cancellation electronics which employs the dedicated electrodes for the
generation of the acceleration cancellation voltage for the mismatch operation. In this
method, the feedback voltage is applied to the dedicated electrodes instead of the
sense mode electrodes to overcome the problems mentioned in the previous method.
The utilization of the additional acceleration cancellation electrodes isolates the
operation of the acceleration cancellation circuit from the other control loops. The
related equations with this method are given in Section 2.6.4 in details.
Figure 3.29: Block diagram of the closed loop acceleration cancellation electronics
which employs the dedicated electrodes for the generation of the acceleration
cancellation voltage for the mismatch operation.
In the controller design, an integral control is implemented instead of the PI
controller not to degrade the low pass characteristic of the system, using a similar
approach with previous controller designs. For this method, KP is set to zero and KI is

74
optimized as 300 to achieve the sufficient phase margin, minimum settling time and
minimum overshoot for the operation.
The transient behavior of the closed loop acceleration cancellation system proposed
in this method is analyzed in MATLAB SIMULINK by modeling the sense system
using the second order sensor model with the real sensor and controller values.
Similar to the previous compensation methods, all control loops are implemented
together and operated simultaneously to be able to see the effect of the acceleration
on the gyroscope operation. Figure 3.30 shows the SIMULINK model of the open
loop acceleration sensing electronics with the other control loops.
Figure 3.30: SIMULINK model of closed loop acceleration compensation circuit
which employs the dedicated electrodes for the generation of the acceleration
cancellation voltage.
Using the SIMULINK model in Figure 3.30, 1g acceleration is applied to the system
at 0.5 sec. Similar to the previous case, a sustained quadrature error is provided to the
system throughout the simulation by applying an offset voltage to the input of the
quadrature cancellation controller. Figure 3.31 shows that the transient behavior of
the acceleration output which is picked from acceleration controller output. When 1g
acceleration is applied to the system, the acceleration output jumps to 240mV which

75
is a consistent value with Equation 2.25. Figure 3.32 depicts the transient behavior of
the sense mode displacement. In this method, the closed loop acceleration controller
completely eliminates the effect of the acceleration on the sense mode displacement.
Figure 3.31: Transient behavior of the acceleration controller output as response to 1
g acceleration using the third acceleration compensation method.
Figure 3.32: Transient behavior of the sense mode displacement for acceleration
compensation method. In this method, the closed loop controller completely
eliminates the effect of the static acceleration on the sense mode displacement.

76

77
CHAPTER 4
4 FABRICATION OF MEMS GYROSCOPES
The gyroscopes used in this study are fabricated through modified SOG (silicon-on-
glass) micromachining process and wafer-level hermetically encapsulated using SOI
cap wafers with vertical feedthroughs. SOG process is an attractive way of
fabricating MEMS sensors by anodically bonding of a silicon wafer to a glass wafer.
In the modified SOG process proposed in [32], first, the recesses and electrical
interconnects are formed on the glass wafers. Then, the formation of the device layer
is performed on the SOI wafer using deep reactive ion etching (DRIE). Finally, glass
wafer and SOI wafer are combined through the anodic bonding. The modified SOG
process has some certain advantages. Firstly, constructing device layer on an
insulating layer significantly decreases the parasitic capacitances. Moreover,
electrical interconnects can easily formed over glass substrates. Furthermore, the use
of SOI wafer provides uniform etch profile on the structure, higher production yield,
and lower proof mass voltage needed for the gyroscope operation.
SOI cap wafers are used for the wafer level vacuum packaging of the fabricated
sensor wafers. In the cap wafer process, first, via openings are formed on the handle
layer of SOI cap wafer. Then, vertical feedthroughs and sealing walls are
simultaneously constructed on the device layer of the wafer. Sealing of the sensor
wafer with the SOI cap wafer is achieved either through the anodic bonding process
or the eutectic bonding process. The process steps for both bonding processes are
same but the sequence of the steps is different. The main advantage of using vertical
feedthroughs in these encapsulation processes is that it does not require any complex
via-refill or trench- refill processes [33].

78
This chapter continues as follows, Section 4.1 provides the detailed information
about the modified SOG process used for the sensor wafer fabrication. Section 4.2
describes the wafer level hermetic encapsulation processes for both anodic bonding
version and eutectic bonding version. Section 4.3 presents the fabrication results.
Finally, Section 4.4 summarizes this chapter.
4.1 Fabrication of Sensor Wafer Using Modified SOG (M-SOG)
Process
The modified SOG process starts with an empty glass wafer to form anchors and
metallic interconnects. The first step is the anchor formation. The anchors are the
bonding regions on the glass wafer where will be connected to the device layer of the
SOI wafer during the anodic bonding. Chromium/Gold (Cr/Au) is used as masking
material instead of photoresist (PR) during the anchor formation process in the
hydrofluoric acid (HF) since the etch rate of HF to PR is very high. The anchor
formation begins with metal deposition. Cr/Au is deposited on the glass wafer
through the thermal evaporation process. Cr/Au is used instead of only Au because
Cr layer functions as adhesion layer between the glass wafer and Au layer. Next,
Cr/Au layer is patterned using wet etchants. Then, glass is etched in the pure HF
solution to construct the anchor structures. The etch rate of HF for the glass is highly
depend on the ambient temperature so etching process should be conducted by
measuring the depth of the anchors in a controlled manner. After the glass etch is
completed, Cr/Au is stripped in the wet etchants.
The second step of the glass wafer process is the formation of the electrical
interconnects. Cr/Au is deposited by the thermal evaporation. Then, Cr/Au is
patterned to form the pad metallization using wet chemical etchants. Finally, glass
wafer is cleaned in the piranha solution composing of H2SO4:H2O2 with ratio of 1:1
before the anodic bonding. This is the last step of the glass wafer process.
SOI wafer process also includes two main steps: shallow etch and structure
formation. The first step is the shallow edge process on the device layer of SOI
wafer. The purpose of this step is to prevent the sealing bonding region on the glass
wafer from attaching to the SOI wafer during first anodic bonding. The PR is also
removed by using the oxygen plasma in the DRIE. After the DRIE process, the

79
piranha cleaning is performed for the SOI wafer. The second process step of the SOI
wafer is the formation of sensor structure on the device layer using the DRIE. DRIE
provides anisotropic etching; thus, it is the best way for the formation of the device
structure having critical dimension. The PR is again removed by using the oxygen
plasma in the DRIE. After the DRIE process, the piranha cleaning is performed for
the SOI wafer to completely clean the polymer residuals on the wafer.
After the glass and SOI wafers are prepared, these wafers are bonded using the
anodic bonding technique presented in [45]. Before the anodic bonding process, the
native oxide layer on the silicon substrate should be removed for a good quality of
bonding. After the anodic bonding, the handle layer of the SOI wafer is removed by
the DRIE process. Finally, the device layer bonded to the glass wafer is released by
removing the buried oxide layer in the BHF solution. This is the last step of the
sensor wafer fabrication process. Figure 4.1- Figure 4.8 show the fabrication steps of
the sensor wafer based on the modified SOG process.
Figure 4.1: Empty glass wafer
Figure 4.2: Anchor formation

80
Figure 4.3: Formation of the electrical interconnects
Figure 4.4: Empty SOI wafer
Figure 4.5: Shallow etch on the device layer

81
Figure 4.6: Formation of the sensor structure
Figure 4.7: Anodic bonding of glass and SOI wafers
Figure 4.8: Release of the device structure after anodic bonding

82
4.2 Wafer Level Hermetic Encapsulation of MEMS Gyroscopes using
SOI Cap Wafers with Vertical Feedthroughs
Hermetic encapsulation of the sensor wafer is achieved using an SOI cap wafer, and
the electrical contacts on the sensor wafers are transferred to the outside world via
the vertical feedthroughs. SOI cap wafer is composed of highly doped device and
handle layers, and both sides of the wafer is deposited with the thermal oxide layer.
Fabrication process of the SOI cap wafer for the packaging is comprised of four
process masks. The process details of the SOI cap wafer process can be found in
[33], [46] and [47].
After completing the fabrication of the sensor wafer and SOI cap wafer, these wafers
are bonded for the vacuum packaging of the sensor wafer. The hermetic sealing of
the sensor wafer can be achieved using two different bonding methods: anodic
bonding technique or Au-Si eutectic bonding technique. The detailed information
about the wafer level hermetic encapsulation process using the anodic and Au-Si
eutectic bonding methods can be found in [33], [46] and [47]. Figure 4.9 - Figure
4.15 show the fabrication steps of SOI cap wafer and packaging process.
Figure 4.9: Empty SOI cap wafer
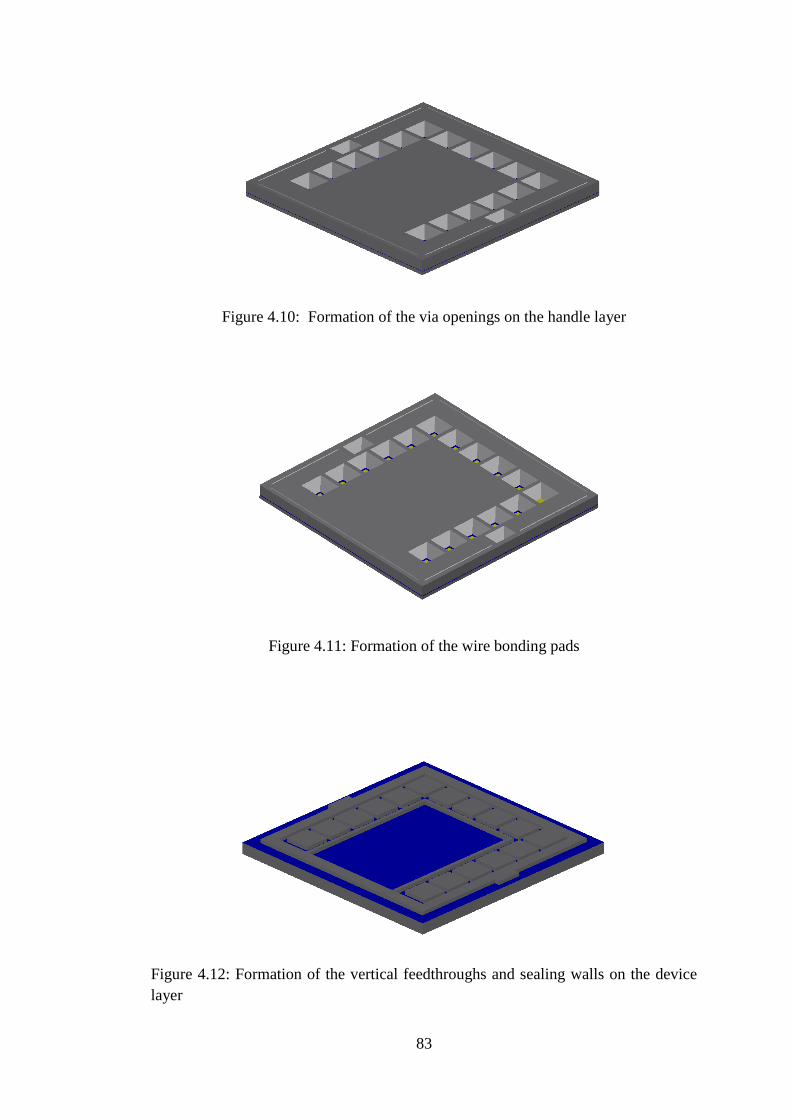
83
Figure 4.10: Formation of the via openings on the handle layer
Figure 4.11: Formation of the wire bonding pads
Figure 4.12: Formation of the vertical feedthroughs and sealing walls on the device
layer

84
Figure 4.13: Getter deposition
Figure 4.14: Anodic/Eutectic bonding of cap wafer and sensor wafer for packaging
Figure 4.15: Final view of the wafer level vacuum packaged sensor wafer

85
4.3 Fabrication Results
Despite the optimization of the process steps during the fabrication of the vacuum
packaged sensor wafer, the fabrication imperfections are unavoidable in the process.
The most important fabrication imperfection is the loss in the critical sensor
dimension. The lithography tolerances and the undercut during the DRIE process of
the structure mask cause a thinning in the widths of the springs and fingers. The
change in the spring dimensions causes a change in the mechanical resonance
frequencies of the gyroscope. Figure 4.16 depicts the SEM pictures of the double-
folded and half-folded springs used in the drive mode, and the clamped-guided-end
spring used in the sense mode after the fabrication of the sensor wafer.
(a)
(b)
(c)
Figure 4.16: SEM pictures of (a) double-folded, (b) half-folded, and (c) clamped
guided springs after the fabrication.

86
After the fabrication, the width of the drive and sense mode springs are measured to
be much narrower than the designed value as seen in Figure 4.16. But, the thinning
of the springs is estimated during the design stage of the gyroscope so the
mechanical resonance frequencies of the drive and sense modes are determined
considering the fabrication imperfections before the fabrication. Thus, the change in
the spring widths does not significantly affect the operation of the gyroscope.
Similarly, the gap spacing of the fingers gets wider after the fabrication. Particularly,
the change in the dimensions of the sense, quadrature and acceleration cancellation
electrodes affects the capabilities of the corresponding control loops. Figure 4.17
depicts the SEM pictures of the sense, quadrature and acceleration cancellation
electrodes after the fabrication.
(a)
(b)
(c)
Figure 4.17: SEM pictures of (a) sense, (b) quadrature, and (c) acceleration
cancellation electrodes after the fabrication.
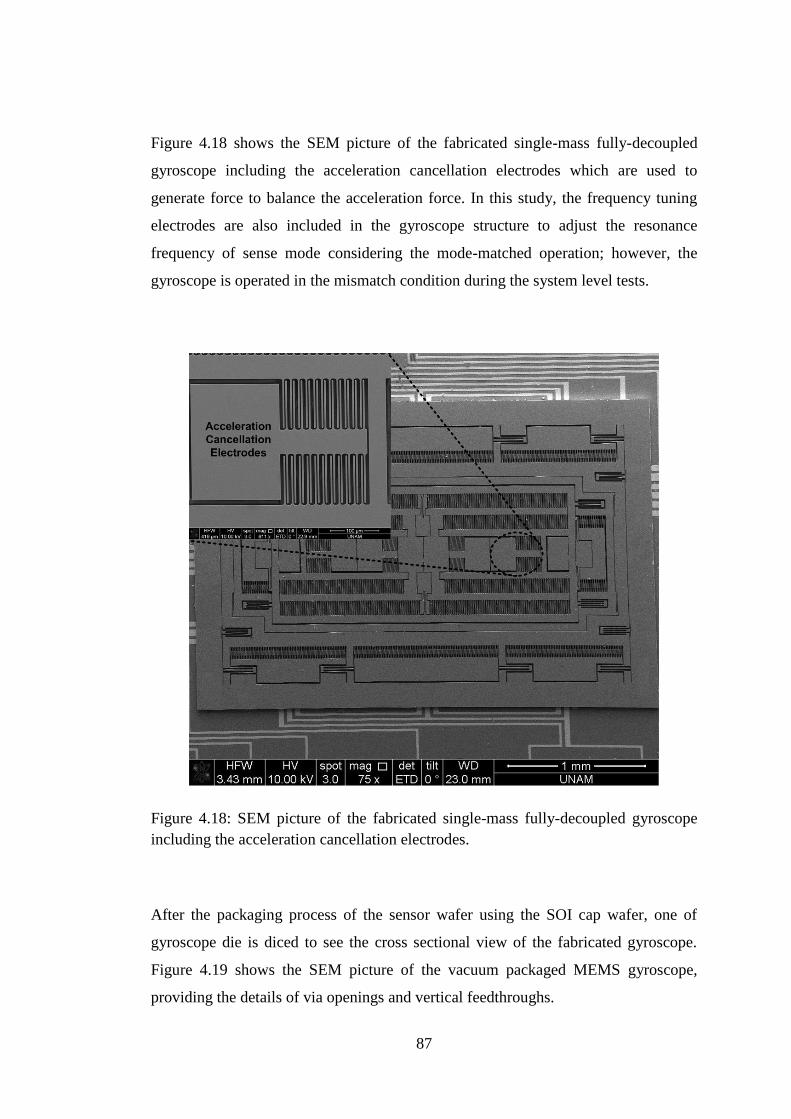
87
Figure 4.18 shows the SEM picture of the fabricated single-mass fully-decoupled
gyroscope including the acceleration cancellation electrodes which are used to
generate force to balance the acceleration force. In this study, the frequency tuning
electrodes are also included in the gyroscope structure to adjust the resonance
frequency of sense mode considering the mode-matched operation; however, the
gyroscope is operated in the mismatch condition during the system level tests.
Figure 4.18: SEM picture of the fabricated single-mass fully-decoupled gyroscope
including the acceleration cancellation electrodes.
After the packaging process of the sensor wafer using the SOI cap wafer, one of
gyroscope die is diced to see the cross sectional view of the fabricated gyroscope.
Figure 4.19 shows the SEM picture of the vacuum packaged MEMS gyroscope,
providing the details of via openings and vertical feedthroughs.

88
Figure 4.19: SEM picture of the cross sectional view of the packaged sensor.
4.4 Summary
This chapter first describes the fabrication steps of the sensor wafer based on the
modified SOG process. Then, the wafer level vacuum packaging processes of the
sensor wafer are presented with the detailed process steps for anodic and Au-Si
eutectic bonding methods. Finally, the fabrication results are discussed.
89
CHAPTER 5
5 TEST RESULTS
This chapter provides the test results of the studied gyroscope. Section 5.1 presents
the resonance characterization procedure for the MEMS gyroscopes. Section 5.2
demonstrates the test setup for system level tests of the studied gyroscopes. Section
5.3 gives the test data about the static acceleration tests. Section 5.4 presents test
results for the centrifugal acceleration tests. Section 5.5 provides the performance
test results of the studied gyroscopes. Finally, Section 5.6 summarizes this chapter.
5.1 Characterization and Test Procedure of Gyroscopes
After the MEMS gyroscopes are fabricated, the resonance tests are conducted by
randomly choosing the sensors from the different places of the wafer. If the drive and
sense modes of the gyroscopes are functional, the wafer is diced. The die level
gyroscopes are tested separately in the probe station. Figure 5.1 shows the test set-up
for the die level resonance tests. As seen in Figure 5.1, the electrical connection of
the sensor to the outside word is provided by using special probes in the probe
station. Then, the sensor is driven from the dynamic signal analyzer (DSA) which
gives an AC signal with a varying frequency around the resonance frequency of the
gyroscope. The output of the gyroscope is a current signal in response to the
actuation signal, and the output current is converted to the voltage by a preamplifier
op-amp. The output voltage is fed to the DSA, and the resonance characteristics of
the gyroscope are extracted by looking at the input-output ratio in the frequency
domain. These tests are conducted for both the drive and sense mode of the
gyroscope separately to obtain the sensor parameters such as the gain, resonance
frequency and quality factor. After the die level resonance tests, the gyroscopes
having the desired resonance characteristics are chosen to be used.

90
Figure 5.1: Resonance test set-up for the die level gyroscope test.
After the die level resonance test, the gyroscope is connected with the front-end
electronics on a special hybrid glass substrate. Figure 5.2 depicts a gyroscope
integrated with the front-end electronics inside a hybrid package. The front-end
electronics includes the drive and sense mode preamplifier stages, and
instrumentation amplifier. Since the output current of the gyroscope is very small,
the gyroscope and preamplifier stages should be in the same hybrid package to avoid
from the parasitic effects and noise. Before connecting the gyroscope to the package,
the functionality test of the front-end electronics is done to ensure that the circuit
works properly. If the gyroscope is fabricated using the wafer level vacuum
packaging process as mentioned in Chapter 4, there is no need for the vacuum
packaging of the hybrid package. However, if the gyroscope is not vacuum packaged
during the process, then, the package is vacuumed with the front-end electronics and
gyroscope using a technique called projection welding. In this thesis work, the
gyroscopes used in the first and second phases of the study are vacuum packaged

91
using the projection welder, and the gyroscopes used in the third phase of the study
are fabricated using the wafer-level vacuum packaging process.
Figure 5.2: Gyroscope integrated with the front-end electronics on the hybrid glass
substrate.
After the vacuum packaging of the gyroscopes is completed, the resonance tests are
repeated with the front-end electronics to extract the sensor parameters such as the
resonance frequency, gain and quality factors. These parameters are needed during
the design of the control electronics. Table 5.1 and Table 5.2 represents the drive and
sense mode resonance characteristics of the vacuum packaged gyroscopes with the
front-end electronics studied in this theses, respectively. The resonance test results
indicate that the vacuum condition of the gyroscopes fabricated with wafer level
vacuum packaging process is much better compared to the gyroscopes packaged with
the projection welding method.
Table 5.1: Drive mode resonance characteristics of the vacuum packaged gyroscopes
studied in this thesis.

92
Gyro
ID
Proof
Mass (V)
Res. Freq.
(Hz)
Res. Gain
(dB)
Quality
Factor
Packaging
Type
E02 10 12209 3.3 25200 Projection Welding
H02 10 12495 1.5 19320 Projection Welding
0803 14 10747 16.0 51100 Wafer Level-Anodic
1207 14 10813 16.3 48000 Wafer Level-Eutectic
Table 5.2: Sense mode resonance characteristics of the vacuum packaged gyroscopes
studied in this thesis.
Gyro
ID
Proof
Mass (V)
Res. Freq.
(Hz)
Res. Gain
(dB)
Quality
Factor
Packaging
Type
E02 10 12473 25.7 1480 Projection Welding
H02 10 12809 24.3 1120 Projection Welding
0803 14 10735 40.5 3070 Wafer Level-Anodic
1207 14 10594 38.8 3100 Wafer Level-Eutectic
5.2 System Level Test Setup for the Acceleration and Performance
Tests of the Studied MEMS Gyroscopes
After the characterization of the gyroscope mounted in a hybrid package, the sensor
module is connected with the drive, sense, quadrature cancellation and acceleration
cancellation modules on a test PCB to perform the system level tests. Figure 5.3
shows the test setup for the system level tests of the studied gyroscopes. Since the
main objective of this thesis study is to suppress the static acceleration sensitivity of
MEMS gyroscopes, special test setups are prepared for the acceleration tests. Two
basic acceleration tests performed in this study are the static acceleration test on the
rotation table and centrifugal acceleration test on the rate table.
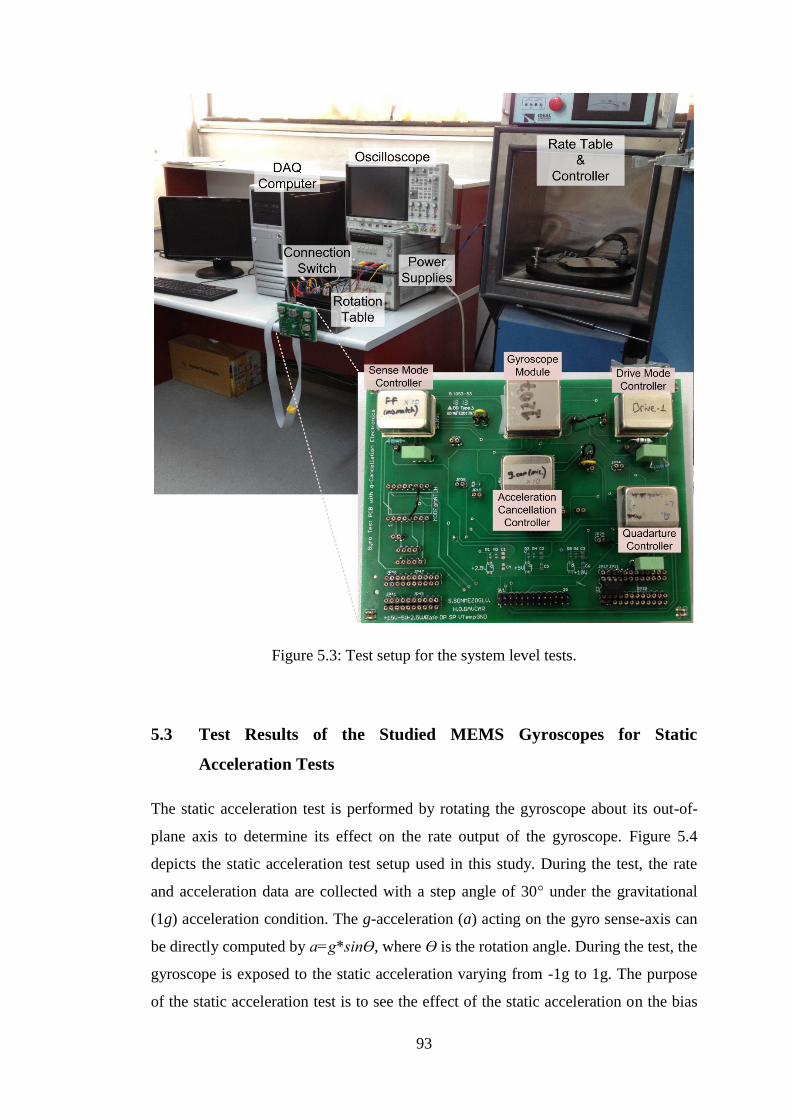
93
Figure 5.3: Test setup for the system level tests.
5.3 Test Results of the Studied MEMS Gyroscopes for Static
Acceleration Tests
The static acceleration test is performed by rotating the gyroscope about its out-of-
plane axis to determine its effect on the rate output of the gyroscope. Figure 5.4
depicts the static acceleration test setup used in this study. During the test, the rate
and acceleration data are collected with a step angle of 30° under the gravitational
(1g) acceleration condition. The g-acceleration (a) acting on the gyro sense-axis can
be directly computed by a=g*sinӨ, where Ө is the rotation angle. During the test, the
gyroscope is exposed to the static acceleration varying from -1g to 1g. The purpose
of the static acceleration test is to see the effect of the static acceleration on the bias

94
of the gyroscope output and to determine the efficiency of acceleration cancellation
methods explained in Section 3.5 for suppressing this effect.
(a) (b)
Figure 5.4: (a) Schematic and (b) actual views of test setup for the static acceleration
tests on the rotation table.
In the first phase of this study, the acceleration cancellation circuit is operated in
open loop mode using the gyroscope (E02) in the mismatched condition, as
mentioned in 3.5.1 (Method-1). It should be noted that the mismatch operation is
particularly preferred in thesis study to ensure that there is no additional phase error
exists between the drive and sense signals due to the mode of operation. During the
static acceleration test, the gyroscope is rotated with a step angle of 30° under the
gravitational (1g) acceleration condition as shown in Figure 5.4; as a result, the sense
axis of the gyroscope is subjected to the static acceleration varying form -1g to 1g as
a function of the rotation angle. For the proper operation of the acceleration sensing
circuit, there should exist a certain level residual quadrature signal in the sense mode
of the gyroscope. Otherwise, the resultant signal obtained by summing the out of
phase sense mode output signals cannot be distinguished from the noise. For this
reason, the set point of the quadrature cancellation controller is set to 500mV. In this
method, the rate output data and acceleration output data which is the output of the
acceleration sensing circuit are simultaneously collected during the test. The data are

95
collected for at least 10 seconds at each angle step. Then, the collected data are
processed to determine the average values of the rate output and acceleration output
for each rotation angle. After finding a linear relation between the rate output and
acceleration output according to the static acceleration test data, the rate output is
corrected in the software to compensate the effect of the static acceleration.
Figure 5.5 shows the measured rate output (blue one), compensated rate output (blue-
dashed one) and acceleration output (red one) as a function of the rotation angle for
the gyroscope (E02). In this test, the g-sensitivity of the gyroscope (E02) is measured
to be 2120°/hr/g before the acceleration compensation. Moreover, the acceleration
output linearly changes with the applied acceleration, and its scale factor is measured
to be 0.53mV/g, which is consistent with the value estimated from the theoretical
expression shown in Equation 3.17. Assuming both the rate output and acceleration
output linearly changes with the static acceleration, the necessary constants in
Equation 3.18 are determined using the static acceleration test data. Then, the
measured rate output is corrected to eliminate the effect of the acceleration in the
software. The g-sensitivity of the gyroscope (E02) is calculated to be 192°/hr/g after
the acceleration compensation. That is, the effect of the static acceleration on the rate
output of the studied gyroscope is suppressed by 91% with the use of the
compensation method proposed in this work.
The drawback of the first method is that it requires an additional computation process
in the software to compensate the rate output so it cannot reduce the acceleration
sensitivity of the gyroscope during the operation.

96
Figure 5.5: Measured (blue one) and compensated (blue-dashed one) rate outputs,
and acceleration output (red one) as a function of the rotation angle for the gyroscope
(E02) using the compensation Method-1.
In the second phase of the study, the acceleration cancellation circuit is operated in
closed loop mode using the gyroscope (H02) in the mismatched condition by
applying feedback voltage to the non-inverting inputs of the preamplifiers, as
mentioned in 3.5.2 (Method-2). The purpose of this method is to suppress the g-
sensitivity of the gyroscope output in operation by generating a counter force to the
acceleration force on the sense mode-electrodes. Static acceleration tests for this
method are conducted in two steps. Firstly, the rate output data of the gyroscope is
collected as a function of the rotation angle without connecting the acceleration
cancellation circuit to measure the raw g-sensitivity of the gyroscope. Then, the
acceleration cancellation circuit is integrated to the system, and rate output data and
acceleration controller output data are collected simultaneously. The acceleration
controller output is used to determine the amplitude of the applied acceleration.
During the test, the set point of the quadrature cancellation controller is set to 500mV
for the proper operation of the acceleration cancellation circuit
Figure 5.6 shows the uncompensated rate output (blue one), compensated rate output
(blue-dashed one) and acceleration controller output (red one) as a function of the
rotation angle for the gyroscope (H02). Before connecting the acceleration

97
cancellation circuit, the g-sensitivity of the gyroscope (H02) is measured to be
1216°/hr/g. After integrating the acceleration cancellation electronics to the
gyroscope system, the g-sensitivity of the gyroscope (H02) is determined to be
416°/hr/g. In other words, the effect of the static acceleration on the rate output of the
studied gyroscope is suppressed up to 3 times with the use of the acceleration
cancellation method proposed in this work. Actually, it is difficult to get a better
improvement in the g-sensitivity of the gyroscope using this method because it is
theoretically impossible to completely eliminate the effect of the g-sensitivity by this
technique as explained in Section 3.5.2 in details. However, the results are still
promising for the next step of the acceleration cancellation study. Moreover, the
acceleration controller output almost linearly changes with the applied acceleration,
and its scale factor is measured to be 13.1mV/g. Therefore, the acceleration acting on
the sense axis of the gyroscope can be determined by looking at the output of the
acceleration cancellation controller.
Figure 5.6: Rate outputs without (blue one) and with (blue-dashed one) acceleration
cancellation circuit, and acceleration controller output (red one) as a function of the
rotation angle for the gyroscope (H02) using the compensation Method-2.
In the third phase of the study, the mechanical structure of the gyroscope is modified
and the dedicated acceleration cancellation electrodes are added to the gyroscope. In

98
this method, the acceleration cancellation circuit is operated in closed loop mode
using the gyroscopes (0803) and (1207) in the mismatched condition. In this case, the
feedback voltage is applied to the acceleration cancellation electrodes instead of the
sense mode electrodes to isolate the operation of the acceleration cancellation circuit
from the remaining part of the gyroscope, as mentioned in Section 3.5.3 (Method-3).
The purpose of this method is to suppress the g-sensitivity of the gyroscope output in
operation by generating a counter force to the acceleration force on the dedicated
electrodes. Static acceleration tests are conducted in two steps as in the previous
method. Firstly, the rate output data of the gyroscope is collected as a function of the
rotation angle without connecting the acceleration cancellation circuit; then, the
acceleration cancellation circuit is integrated to the gyroscope system. During the
test, the set point of the quadrature cancellation controller is set to 500mV for the
proper operation of the acceleration cancellation circuit. These tests are separately
conducted for the gyroscopes (0803) and (1207).
Figure 5.7 and Figure 5.10 show the static acceleration test data of the gyroscopes
(0803) and (1207), respectively. Without the acceleration cancellation electronics,
the g-sensitivity of the gyroscope (0803) is measured to be 1121°/hr/g. After
integrating the acceleration cancellation electronics to the gyroscope system, the g-
sensitivity of the gyroscope (0803) is measured to be 91°/hr/g. This test result
indicates that there is a significant improvement in the g-sensitivity of the gyroscope
(0803) up to 12 times with the use of the acceleration cancellation method proposed
in this work. Similarly, the g-sensitivity of the gyroscope (1207) is reduced from
1072°/hr/g to 103°/hr/g. Moreover, the acceleration controller outputs of the
gyroscopes (0803) and (1207) almost linearly changes with the applied acceleration,
and their scale factor are measured to be 411mV/g and 305mV/g, respectively. In this
technique, the outputs of the acceleration cancellation controllers also give
information about the acceleration acting on the sense axis of the gyroscopes.
Finally, Table 5.3 summarizes the static acceleration test results of the gyroscopes
studied in this thesis.

99
Figure 5.7: Rate outputs without (blue one) and with (blue-dashed one) acceleration
cancellation circuit, and acceleration controller output (red one) as a function of the
rotation angle for the gyroscope (0803) using the compensation Method-3.
Figure 5.8: Rate outputs without (blue one) and with (blue-dashed one) acceleration
cancellation circuit, and acceleration controller output (red one) as a function of the
rotation angle for the gyroscope (1207) using the compensation Method-3.
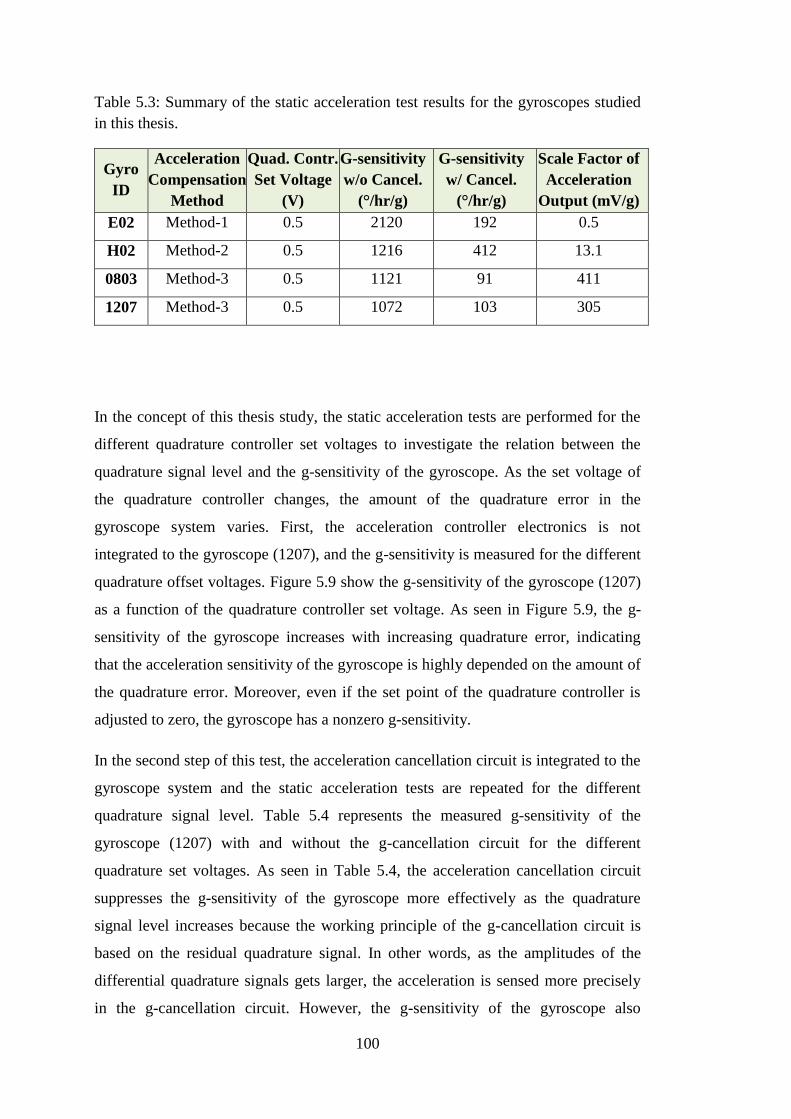
100
Table 5.3: Summary of the static acceleration test results for the gyroscopes studied
in this thesis.
Gyro
ID
Acceleration
Compensation
Method
Quad. Contr.
Set Voltage
(V)
G-sensitivity
w/o Cancel.
(°/hr/g)
G-sensitivity
w/ Cancel.
(°/hr/g)
Scale Factor of
Acceleration
Output (mV/g)
E02 Method-1 0.5 2120 192 0.5
H02 Method-2 0.5 1216 412 13.1
0803 Method-3 0.5 1121 91 411
1207 Method-3 0.5 1072 103 305
In the concept of this thesis study, the static acceleration tests are performed for the
different quadrature controller set voltages to investigate the relation between the
quadrature signal level and the g-sensitivity of the gyroscope. As the set voltage of
the quadrature controller changes, the amount of the quadrature error in the
gyroscope system varies. First, the acceleration controller electronics is not
integrated to the gyroscope (1207), and the g-sensitivity is measured for the different
quadrature offset voltages. Figure 5.9 show the g-sensitivity of the gyroscope (1207)
as a function of the quadrature controller set voltage. As seen in Figure 5.9, the g-
sensitivity of the gyroscope increases with increasing quadrature error, indicating
that the acceleration sensitivity of the gyroscope is highly depended on the amount of
the quadrature error. Moreover, even if the set point of the quadrature controller is
adjusted to zero, the gyroscope has a nonzero g-sensitivity.
In the second step of this test, the acceleration cancellation circuit is integrated to the
gyroscope system and the static acceleration tests are repeated for the different
quadrature signal level. Table 5.4 represents the measured g-sensitivity of the
gyroscope (1207) with and without the g-cancellation circuit for the different
quadrature set voltages. As seen in Table 5.4, the acceleration cancellation circuit
suppresses the g-sensitivity of the gyroscope more effectively as the quadrature
signal level increases because the working principle of the g-cancellation circuit is
based on the residual quadrature signal. In other words, as the amplitudes of the
differential quadrature signals gets larger, the acceleration is sensed more precisely
in the g-cancellation circuit. However, the g-sensitivity of the gyroscope also

101
increases with increasing quadrature error. Therefore, the acceleration cancellation
circuit should be operated at the minimum residual quadrature signal level possible
to obtain the minimum g-sensitivity for a specific gyroscope.
Figure 5.9: G-sensitivity of the gyroscope (1207) as a function of the quadrature
controller set voltage using Method-3.
Table 5.4: Measured g-sensitivity of the gyroscope (1207) with and without the
acceleration cancellation electronics for the different quadrature set voltages.
Quad.
Controller
Set Voltage
(mV)
Acceleration
Compensation
Method
G-sensitivity
w/o
g-cancellation
(°/hr/g)
G-sensitivity
with
g-cancellation
(°/hr/g)
Suppression
of
g-sensitivity
(%)
200 Method-3 456,3 61,8 86,4
400 Method-3 841,95 93,2 88,9
600 Method-3 1325,4 119,4 90,1

102
5.4 Test Results of the Studied MEMS Gyroscopes for Centrifugal
Acceleration Tests
In the centrifugal acceleration tests, the angular velocity is applied to the sensor in
two different positions on the rate table: centered and off-centered. Figure 5.10
shows (a) the schematic and (b) actual views of the test setup for the centrifugal
acceleration test. The sense-axis of the sensor is purely subjected to the Coriolis
force in the centered position, whereas both the centrifugal and Coriolis forces act on
this axis in the off-centered position. In the off-centered position, the sensor is placed
2 inches (5 cm) far away from the rotation axis. The centrifugal acceleration (a)
acting on the gyroscope is dependent on the angular rate (w) and radius (r) by a=w2r.
(a) (b)
Figure 5.10: (a) Schematic and (b) actual views of test setup for the centrifugal
acceleration tests on the rate table.
The purpose of the static acceleration test is to observe the effect of the acceleration
on the scale factor of the rate output and to verify the efficiency of the acceleration
cancellation electronics under the both the centrifugal and Coriolis acceleration. In
this study, the centrifugal acceleration test is performed using the gyroscope (1207)
under the mismatch operation. The set point of the quadrature cancellation controller
is set to 500mV for the proper operation of the acceleration cancellation circuit.
Firstly, the gyroscope is placed on the center of the rate table without integrating the
acceleration cancellation circuit, as shown in Figure 5.10. During the centrifugal

103
acceleration test, the rate is applied to the system in a range of the ±600°/sec. Under
this condition, the sense axis of the gyroscope is subjected to only the Coriolis force.
In the centered position, the nonlinearity in the scale factor of the rate output is
measured to be 0.34%. Then, the gyroscope is placed at 2 inches (5cm) far away
from the rotation axis, without connecting the acceleration cancellation circuit to the
system. In the off-centered position, the sense axis of the gyroscope is exposed to
maximum 0.5g acceleration for the rate signal in a range of the ±600°/sec. Under
this condition, the nonlinearity in the scale factor of the rate output is measured to be
0.53%. That is, the centrifugal acceleration makes the nonlinearity of the scale factor
worse compared to the result in the centered position. Finally, the acceleration
cancellation circuit is integrated to the system in the off-centered position, and the
same test is repeated. The nonlinearity in the scale factor of the rate output is
decreased to 0.36% with the acceleration cancellation electronics in the off-centered
position. Figure 5.11 shows the centrifugal acceleration test result for the gyroscope
(1207).
Figure 5.11: Rate output responses of the gyroscope (1207) to the angular rate in the
centered and off-centered position on the rate table using the acceleration
compensation Method-3.

104
The centrifugal acceleration test results show that the static acceleration gives rise to
a shift in the scale factor of the rate output. Although the centrifugal acceleration
causes the nonlinearity of the gyroscope output to change from 0.34% to 0.53%, the
g-cancellation circuit suppresses this effect by improving the nonlinearity up to
0.36% for the angular input range of ±600°/sec. The maximum acceleration acting on
the sense axis of the gyroscope is limited by the test setup conditions. If this test was
performed on a rate table having a larger radius, the effect of the centrifugal
acceleration on the rate output would be more significant.
5.5 Test Results of the Studied MEMS Gyroscopes for Performance
Tests
The Allan Variance tests are performed to determine the bias instability and angle
random walk (ARW) performances of the studied MEMS gyroscopes with and
without the acceleration control electronics. The purpose of these tests is to
determine whether the proposed g-compensation methods deteriorate the
performance of the gyroscopes or not. ARW indicates the input referred rate-
equivalent white noise, and bias instability shows the minimum detectable angular
rotation rate. Figure 5.12 depicts a typical Allan Variance graph. In this graph, the
minimum point of Allen deviation refers to the bias instability, and the intersection
point of the line with the slope of -0.5 and averaging time of 1 gives the angular
random walk.
Figure 5.12: A typical Allan Variance graph.

105
Before the Allan Variance tests, the scale factors of the gyroscopes are measured by
the scale factor tests on the rate table. Table 5.5 represents the scale factor of the
studied gyroscopes with and without the acceleration cancellation circuits. As seen in
Table 5.5, the first (E02) and third (0803 and 1207) methods have no effect on the
scale factor of the gyroscope, but the scale factor changes in the second (H02)
method.
Table 5.5: Scale factor measurement results of the studied single-mass gyroscopes
with and without the acceleration cancellation electronics for the mismatch
operation.
Gyro
ID
Acceleration
Compensation
Method
Drive
Disp.
(µm)
VPM
(V)
Scale Factor
w/o g-can
(mV °/sec)
Scale Factor
w/ g-can
(mV °/sec)
E02 Method-1 4.5 10.5 1.8 1.8
H02 Method-2 4.5 10.5 2.0 1.9
0803 Method-3 4 14.3 1.4 1.4
1207 Method-3 4 14.0 1.8 1.8
In the Allan Variance test, the zero-rate output data of the gyroscope is collected by
using the data acquisition card with the sampling frequency of 1 kHz for a certain
period. Then, the collected data is evaluated in “AlaVar 5.2” program by doing
necessary unit conversion according to the scale factor. Figure 5.13 shows the Allan
Variance graph of the gyroscope (1207) with and without the acceleration
cancellation circuit. The bias instability and ARW performances of the gyroscope
without the acceleration cancellation circuit are found as 1.9°/hr and 2°/hr√Hz,
respectively. When the acceleration cancellation circuit is connected, the bias
instability and ARW performances of the same gyroscope are calculated to be 1.8°/hr
and 1.9°/hr√Hz, respectively, which are very close to the previous case. Therefore,
the acceleration circuit proposed in Section 3.5.3 has no significant effect on the
gyroscope performances as expected.

106
The unit of ARW can also be converted to °/√hr by dividing the ARW in °/hr√Hz by
60, which is generally preferred in the literature. It should be also noted that the
portion of the Allan Variance plot where the sampling time (τ) smaller than 0.01 sec
should be ignored because the cut-off frequency of low pass filter in the force-
feedback loop is 100Hz.
Figure 5.13: Allan Variance graph of the gyroscope (1207) with and without the
acceleration cancellation circuit for the mismatch operation.
In this study, the Allan Variance plots are not given for all studied gyroscopes.
Instead, the bias instability and ARW performances of the gyroscopes with and
without the acceleration compensation methods are represented in Table 5.6.
According to the Table 5.6, the first (E02) and third (0803 and 1207) acceleration
compensation methods proposed in this work do not significantly affect the bias
instability and ARW performances of the gyroscope. However, the second
acceleration cancellation method which is implemented on the gyroscope (H02)
deteriorates the gyroscope performance.

107
Table 5.6: ARW and bias instability performances of the single-mass fully decoupled
MEMS gyroscopes studied in this thesis.
Gyro
ID
Acceleration
Compensation
Method
Drive
Disp.
(µm)
w/o G-Cancellation w/ G-Cancellation
ARW
(°/√hr)
Bias Ins.
( °/s)
ARW
(°/√hr)
Bias Ins.
(°/s)
E02 Method-1 4.5 0.040 2.3 0.038 2.2
H02 Method-2 4.5 0.032 2.2 0.055 4.1
0803 Method-3 4 0.034 2.0 0.035 2.1
1207 Method-3 4 0.031 1.8 0.032 1.9
In the proposed acceleration compensation methods, it is possible to obtain the
amplitude of the static acceleration acting along the sense axis of the gyroscopes as
mentioned in Section 3.5. Therefore, the low pass filter output of the acceleration
sensing circuit in the open loop operation and the acceleration cancellation controller
output in the closed loop operation can be used as an accelerometer in the
gyroscopes. In this study, the Allan Variance tests are performed for the acceleration
outputs of the gyroscope.
Figure 5.14 shows the Allan Variance graph of the acceleration controller output of
the gyroscope (1207) for 500mV quadrate offset. The bias instability and velocity
random walk (VRW) performances of the acceleration controller output are found as
1.1 mg and 1.2 mg/√Hz, respectively. The accelerometer performance of the
acceleration controller output gets better as the level of the quadrature signal
increases.
The Allan Variance plots of the acceleration outputs are not given for all studied
gyroscopes. Instead, the bias instability and VRW performances of the acceleration
outputs of the studied gyroscopes are represented in Table 5.7. Although these
performances are very good for the high-end applications, obtaining data about the
amplitude of the acceleration acting along the sense axis of the gyroscope
simultaneously in operation is one of the benefits of the proposed acceleration
compensation methods.

108
Figure 5.14: Allan Variance graph of the acceleration controller output of the
gyroscope (1207).
Table 5.7: ARW and bias instability performances of the acceleration outputs of the
single-mass fully decoupled MEMS gyroscopes studied in this thesis.
Gyro
ID
Acceleration
Compensation
Method
Quad. Set Voltage
(mV)
Bias Instability
(mg)
VRW
(mg/√Hz)
E02 Method-1 500 3.3 4.1
H02 Method-2 500 24.5 53.1
0803 Method-3 500 2.2 3.1
1207 Method-3 500 1.1 1.2
5.6 Summary
This chapter provides the acceleration and performance test results of the studied
MEMS gyroscopes. After the characterization of the vacuum packaged gyroscopes
mounted on a hybrid glass substrate with the front-end electronics, the drive, sense,

109
quadrature cancellation and acceleration cancellation controllers are connected to the
gyroscope on the test PCB to perform the system level tests.
To verify the efficiency of the proposed acceleration compensation methods, the
static and centrifugal acceleration tests are performed. In the static acceleration test,
the sense axis of the gyroscope is subjected to the acceleration varying from-1g to 1g
by rotating it about its out-of-plane axis on the rotation table. In the centrifugal
acceleration test, the gyroscope is exposed to both the Coriolis and centrifugal
accelerations on the rate table.
This thesis study is conducted in three phases, in which three different acceleration
compensation methods are verified. These methods are not completely different from
each other, but an improved version of the previous method is implemented at each
step. In the first phase of this study, the acceleration sensing circuit is implemented
in the open loop mode using the single-mass gyroscope (E02). In this method, the
acceleration acting on the sense axis of the gyroscope is measured by comparing the
amplitudes of the residual quadrature signals on the sense mode electrodes. During
the acceleration test, the rate and acceleration outputs of the gyroscope are
simultaneously collected. Then, assuming a linear relation between the rate output
and acceleration output, the effect of the acceleration on the rate output is
compensated in the software. By this technique, the sensitivity of the rate output to
the static acceleration is reduced from 2120°/hr/g to 192°/hr/g for the gyroscope
(E02).
In the second acceleration compensation method, the acceleration sensing circuit
proposed in the first method is operated in the closed loop mode by applying
feedback voltage to the sense mode electrodes from the non-inverting inputs of the
sense mode preamplifiers. The purpose of this method is to improve the g-sensitivity
of the gyroscope during the operation. This method is verified by using the
gyroscope (H02). By this technique, the sensitivity of the rate output of the
gyroscope (H02) to the static acceleration is reduced from 1216°/hr/g to 412°/hr/g.
Although changing the input voltage of the sense mode preamplifiers deteriorates the
operation of the force-feedback and quadrature cancellation controllers, the
acceleration test results are promising for the future study.
110
In the third acceleration compensation method, the dedicated acceleration
cancellation electrodes are utilized instead of the sense mode electrodes to overcome
the problems encountered in the second method. This method is verified by using the
gyroscopes (0803) and (1207). By this technique, the g-sensitivity of the gyroscope
(0803) is reduced from 1121°/hr/g to 91°/hr/g in operation. Similarly, the g-
sensitivity of the gyroscope (1207) is reduced from 1072°/hr/g to 103°/hr/g.
In this study, the static acceleration test is conducted for the different amount of
quadrature error using the gyroscope (1207) to understand the effect the quadrature
error on the g-sensitivity of the gyroscope. According to the test results, the g-
sensitivity of the gyroscope gets worse as the level of the quadrature signal rises.
However, the efficiency of the acceleration cancellation circuit also increases with
the increasing quadrature error. Therefore, the acceleration cancellation circuit
should be operated with the minimum quadrature signal to obtain the best g-
sensitivity performances for a gyroscope.
The centrifugal acceleration test is performed using the gyroscope (1207). It is
verified from the test results that the nonlinearity in the scale factor of the gyroscope
increases from 0.34% to 0.53% due to the centrifugal acceleration without the
acceleration cancellation circuit. The nonlinearity in the scale factor is reduced to
0.36% under the centrifugal acceleration when the acceleration cancellation circuit is
integrated to the system.
Finally, the effect of the proposed acceleration cancellation methods on the bias
instability and ARW performances of the studied gyroscopes are verified. According
to the performance test results, the first and third acceleration compensation methods
do not affect the bias and noise performances of the gyroscope; whereas, the second
method corrupts the operation of the gyroscope.

111
CHAPTER 6
6 CONCLUSIONS AND FUTURE WORK
This work presents the compensation methods for the quasi-static acceleration
sensitivity of MEMS gyroscopes and demonstrates the effectiveness of these
methods providing experimental data. In the first acceleration compensation method,
the amplitude of the static acceleration acting on the sense axis of the gyroscope is
measured by comparing the amplitudes of the sustained quadrature signals on the
differential sense mode electrodes. In this method, the acceleration sensing circuit is
operated in the open loop without using any controller. During the operation, the
acceleration and rate output data are simultaneously collected. Then, the measured
rate output is corrected by using the measured acceleration output data in the
software. This method requires the additional process of the collected data to
eliminate the effect of the acceleration from the rate output. In the second method,
the acceleration compensation circuit is operated in the closed loop mode to suppress
the effect of the acceleration during gyroscope operation. In addition to the circuit
proposed in the first method, an integral controller is implemented in the acceleration
compensation system, which the feedback voltage is applied to the sense mode
electrodes by using the non-inverting inputs of the sense mode preamplifiers. The
advantage of this method compared to the first one is that it does not require any
additional data process thanks to the closed loop controller. However, this method
cannot completely suppress the quasi-static acceleration of the gyroscope due to the
working principle of the acceleration sensing electronics. Moreover, changing the
voltage of the non-inverting inputs of the preamplifiers destroys the operation of the
all other control loops because the operation of the all control circuits starts with the
same sense pick signals. Finally, the third acceleration compensation method is
implemented, which the feedback voltages are applied to the dedicated acceleration

112
cancellation electrodes to suppress the g-sensitivity of the gyroscope. This method
requires the utilization of the dedicated electrodes in the mechanical design of the
gyroscope to balance the acceleration force. But, it overcomes the problem
encountered in the second acceleration compensation method. This study mainly
focuses on the third acceleration compensation method which gives the best result.
In this study, firstly, the governing equation for the drive mode, sense mode and
acceleration cancellation electrodes are derived. Moreover, the effect of the
acceleration on the gyroscope operation is analytically examined in details to
investigate the source of the acceleration sensitivity. Then, the single-mass fully
decoupled gyroscopes including the acceleration cancellation electrodes are
designed. FEM simulations are conducted to determine the mode shapes and the
corresponding resonance frequencies of the gyroscope. After that, the gyroscopes
are fabricated using modified SOG process and wafer level vacuum packaging
process. Then, the closed loop drive, force feedback, quadrature and acceleration
cancellation controllers are designed and verified using the SIMULINK design
software. Each controller packages and sensor package are prepared in the special
hybrid packages by creating a modular system, and all control packages are
connected with the gyroscope package on a PCB. Finally, the static acceleration,
centrifugal acceleration and performance tests are conducted to verify the
effectiveness of the proposed acceleration compensation methods.
Results and major achievements of this study are the followings:
1. There are various methods in the literature to minimize the acceleration
sensitivity of MEMS gyroscopes; however, these approaches aim to suppress
the high frequency acceleration or vibration sensitivity of the gyroscope
rather than the static acceleration sensitivity. Moreover, most of the
techniques in the literature are based on the mechanical design of the
gyroscope. This work proposes a novel acceleration sensing circuit which
utilizes the amplitude difference information between the residual quadrature
signals on the differential sense-mode electrodes to sense the static
acceleration acting on the sense axis of the gyroscope. In the improved
version of the acceleration sensing circuit, the static acceleration sensitivity of
the gyroscope is reduced in operation by applying feedback voltage to either

113
sense mode electrodes or additional acceleration cancellation electrodes, for
the first time in the literature.
2. Design of the single-mass fully-decoupled gyroscope including the
acceleration cancellation electrodes are accomplished to suppress the g-
sensitivity of the gyroscope without affecting the operation of the other
control loops. The acceleration cancellation electrodes generate a counter
force to balance the acceleration force acting on the sense axis. Therefore, it
prevents the shift of the sense mode axis due to the static acceleration. The
expression of the generated electrostatic force for the acceleration
cancellation electrodes and the scale factor of the acceleration cancellation
controller are derived. Furthermore, the mode shapes of the gyroscope and
the effect of the higher order modes are investigated by performing FEM
simulations.
3. The effect of the static acceleration on the gyroscope operation is analytically
examined. The expressions for the sense mode, quadrature cancellation and
force-feedback electrodes are derived including the effect of the static
acceleration. Moreover, the relation between the sense mode springs and g-
sensitivity is discussed.
4. Closed loop drive, force feedback, quadrature cancellation, and acceleration
cancellation controllers are designed. The closed loop controllers except the
acceleration controller are firstly optimized using the open loop
characteristics of the loops. In these analyses, the settling time, overshoot and
phase margin of the control systems are determined. Then, the closed loop
behaviors of the controllers are analyzed by constructing the appropriate
SIMULINK models. For each acceleration compensation method, a separate
SIMULINK model is designed. All control loops are implemented together to
analyze the acceleration compensation circuits. The consistency between the
simulation results and derived expressions is verified.
5. The fabrication of the single-mass fully-decoupled gyroscope is done using
the modified SOG process. Moreover, the gyroscopes are vacuum packaged

114
at the wafer level using the wafer level vacuum packaging process. The
gyroscopes are vacuum packaged both using the anodic bonding process and
eutectic bonding process. The gyroscopes are hermetically sealed and
vacuum condition inside the sensors is achieved by the wafer level process.
However, although all process steps are optimized during fabrication, wider
capacitive gaps and narrower spring widths are observed compared to the
design ones after the fabrication. This causes a shift in the designed resonance
frequencies and decreases the force generation capability of the drive,
quadrature cancellation and acceleration cancellation electrodes.
6. The tested gyroscopes are combined with the front-end electronics using the
hybrid packages. Then, the controller modules are integrated to the gyroscope
package on the test PCB. The control modules are prepared using the discrete
electronics components on the hybrid metal package for low noise
measurement. Firstly, the static acceleration tests are conducted using the
rotation table for three different acceleration compensation methods. In these
tests, the gyroscope system is tested with and without the acceleration
compensation circuits to verify the effectiveness of the proposed method.
According to static acceleration test results, the g-sensitivity of the gyroscope
E02 is suppressed up to 11 times with the use of the first compensation
method. Using the second acceleration compensation method, the g-
sensitivity of the gyroscope H02 is suppressed up to 3 times. Using the third
acceleration compensation method, the g-sensitivities of the gyroscope 0803
and 1207 are suppressed up to 12 times and 10 times, respectively. Moreover,
an experimental data is provided to show the relation between the g-
sensitivity and quadrature signal level using the gyroscope 1207. Finally, the
centrifugal acceleration test is conducted on the gyroscope 1207 with and
without the acceleration compensation circuit. By this test, the effect of the
centrifugal acceleration on the nonlinearity is observed, and the effectiveness
of the acceleration cancellation circuit is proven.
7. Allan variance tests are also performed to determine effects of the proposed
acceleration compensation methods on the noise performances of the

115
gyroscopes. It is experimentally shown that while the first and third
acceleration compensation methods have not a significant effect on the bias
instability and ARW performances of the gyroscopes, the second method
deteriorates these performance values. Moreover, the Allen Variance analysis
is done for the acceleration output of the tested gyroscopes which indicates
the amplitude of the static acceleration acting on the sense axis of the
gyroscope. These outputs can be also used as the accelerometer.
The major achievement of this study is to suppress of the quasi-static acceleration
sensitivity of the MEMS gyroscope instantly during the gyroscope operation by
using the control electronics rather than employing complex mechanical design. The
proposed acceleration compensation methods can be easily applied to any single-
mass or mechanically connected double-mass gyroscope without making any
significant change in the mechanical design. To further increase the reliability and
performance of the gyroscopes, the following research topics should be studied:
1. Vibration or high frequency acceleration sensitivity of the gyroscopes should
be minimized. This can be achieved by employing complex mechanical
designs which are immune to the vibration or shock. Moreover, special
suspended beams functioning as the mechanical low pass filter can be placed
under the gyroscope structure to eliminate the effect of the vibration.
2. Temperature compensation should be done for the gyroscope output to
achieve better gyro performances. The rate output of the gyroscope drifts
with temperature in time. If the temperature dependency of the gyroscope
output is decreased, the bias and noise performances of the gyroscope can be
improved.
3. The control electronics of the gyroscope should be implemented in the digital
domain. The digital control system provides flexibility in the controller
design. If the digital control system is implemented in a single chip, the
overall size of the control electronics significantly reduced.

116

117
REFERENCES
[1] S. Nasiri, M. Lim, and M. Housholder, “A Critical Review of the Market Status
and Industry Challenges of Producing Consumer Grade MEMS Gyroscopes,”
Available online: http://invensense.com/mems/whitepapers (accessed on 5
September 2014).
[2] E. Tatar, S. E. Alper, and T. Akin, “Effect of Quadrature Error Compensation and
Corresponding Effects on the Performance of Fully Decoupled MEMS Gyroscopes,”
IEEE/ASME Journal of Micro Electro Mechanical Systems, Vol. 21, No.3, pp. 656-
667, June 2012.
[3] S. Sonmezoglu, S. E. Alper, and T. Akin, “High Performance Automatic Mode
Matched MEMS Gyroscope with an Improved Thermal Stability of the Scale
Factor,” The 17th International Conference on Solid-State Sensors, Actuators and
Microsystems (TRANSDUCERS 2013), pp. 2519-2522, Barcelona, Spain, June 2013.
[4] H. Weinberg, “Gyro Mechanical Performance: The Most Important Parameter,”
Tech. art., Analog Devices, Sep. 2011.
[5] K. Azgin, “High Performance MEMS Gyroscopes,” M.Sc. Thesis, Middle East
Technical University, February 2007.
[6] S. E. Alper, “MEMS Gyroscopes for Tactical-Grade Inertial Measurement
Applications,” Ph.D. Dissertation, Middle East Technical University, September
2005.
[7] R. I. Shakoor, S. A. Bazaz, M. Burnie, Y. Lai, and M. M. Hasan,
“Electrothermally Actuated Resonant Rate Gyroscope Fabricated Using the
MetalMUMPs,” Journal of Microelectronics, Vol. 42, No.4, pp. 585-593, 2011.
[8] N. Yazdi, F. Ayazi, and K.Najafi, “Micromachined Inertial Sensors,” Proceedings
of the IEEE, Vol. 86, No. 8, pp.1640-1659, August 1998.
[9] IEEE Standard for Inertial Sensors Terminology, IEEE Std 528-2001, November
2001.
[10] S. Nasiri, “A Critical Review of MEMS Gyroscopes Technology and
Commercialization Status,” Available online: http://invensense.com/mems/whitepap
ers (accessed on 7 September 2014).

118
[11] C. Acar, and A. M. Shkel, “MEMS Vibratory Gyroscopes: Structural
Approaches to Improve Robustness,” Springer Publisher, 2009.
[12] P. Greiff, B. Boxenhorn, T. King, and L. Niles, ”Silicon Monolithic
Micromechanical Gyroscope,” 6th International Conference of Solid-State Sensors
and Actuators, pp. 966-968, San Francisco, CA, June 1991.
[13] J. Bernstein, S. Cho, A. T. King, A. Kourepenis, P. Maciel, and M. Weinberg,
“A Micromachined Comb-Drive Tuning Fork Rate Gyroscope,” Proc. of IEEE
Micro Mechanical Systems Workshop, pp. 143-148, Fort Lauderdale, FL, February
1993.
[14] M. W. Putty and K. Najafi, “A Micromachined Vibrating Ring Gyroscope,”
Solid-State Sensor and Actuator Workshop, Hilton Head Island, SC, USA, pp. 213-
220, Hilton Head Island, SC, USA, June 1994.
[15] A. Selvakumar and K. Najafi, “High Density Vertical Comb Array
Microactuators Fabricated Using a Novel Bulk/Poly-silicon Trench Refill
Technology,” Solid-State Sensor And Actuator Workshop, Hilton Head Island, pp.
138-141, SC, USA, 1994.
[16] I. D. Hopkin, “Vibrating Gyroscopes (Automotive Sensors),” IEEE Colloquium
on Automotive Sensors, pp. 1-4, Solihull, UK, September 1994.
[17] F. Ayazi and K. Najafi, “A HARPSS Polysilicon Vibrating Ring Gyroscope,”
Journal of Microelectromechanical Systems, Vol. 10, No. 2, pp. 169-179, June 2001.
[18] M. Lutz, W. Golderer, J. Gerstenmeier, J. Marek, B. Maihofer, S. Mahler, H.
Munzel, and U.Bischof, “A Precision Yaw Rate Sensor in Silicon Micromachining,”
I Tech. Dig. 9th Int. Conf. Solid-State Sensors and Actuators (Transducers’97), pp.
847-850, Chicago, IL, June 1997.
[19] R. Voss, K. Bauer, W. Ficker, T. Gleissner, W. Kupke, M. Rose, S. Sassen, J.
Schalk, H. Seidel,and E. Stenzel, “Silicon Angular Rate Sensor for Automotive
Applications with Piezoelectric Drive and Piezoresistive Read-out,” Tech. Dig. 9th
Int. Conf. Solid-State Sensors and Actuators (Transducers’97), pp. 847-850,
Chicago, IL, June 1997.

119
[20] D. Karnick, G. Ballas, L. Koland, M. Secord, T. Braman, and T. Kourepenis,
“Honeywell Gun-Hard Inertial Measurement Unit (IMU) Development,” Position
Location and Navigation Symposium, PLANS 2004, pp. 49 - 55, April 2004.
[21] K. Tanaka, Y. Mochida, S. Sugimoto, K. Moriya, T. Hasegawa, K. Atsuchi, and
K. Ohwada, “A Micromachined Vibrating Gyroscope,” Proceedings of the
International Conference on Micro Electro Mechanical Systems, pp. 278-281,
Netherlands, January 1995.
[22] H. Luo, X. Zhu, H. Lakdawala, L. R. Carley, and G. K. Fedder, ”A Copper
CMOS-MEMS Z-Axis Gyroscope,” Proceedings of the International Conference on
Micro Electro Mechanical Systems, pp. 631-634, Las Vegas, January 2001.
[23] J. A. Geen, S. J. Sherman, J. F. Chang, and S. R. Lewis, “Single-Chip Surface-
Micromachining Integrated Gyroscope with 50 deg/hour Root Allan Variance,”
IEEE International Conference on Solid-State Circuits, pp. 426-427, San Francisco,
CA, Feb. 2002.
[24] H. Xie and G. K. Fedder, “Fabrication, Characterization, and Analysis of a
DRIE CMOS-MEMS Gyroscope,” IEEE Sensors Journal, Vol. 3, No. 5, pp. 622-
631, 2003.
[25] C. Acar, and A. Shkel, “Inherently Robust Micromachined Gyroscopes with 2-
DOF Sense-Mode Oscillator,” Journal of Microelectromechanical Systems, Vol. 15,
No. 2, pp. 380-387, 2006.
[26] A. A. Trusov, A. R. Schofield, and A. M. Shkel, “New Architectural Design of a
Temperature Robust MEMS Gyroscope with Improved Gain-Bandwidth
Characteristics,” Hilton Head Work-shop in Solid State Sensors, Actuators, and
Microsystems, Jun. 1–5, 2008.
[27] M. F. Zaman, A. Sharma, Z. Hao, and F. Ayazi, “A Mode-Matched Silicon-
Yaw Tuning-Fork Gyroscope With Subdegree-Per-Hour Allan Deviation Bias
Instability,” Journal of Microelectromechanical Systems, Vol. 17, No. 6, pp.1526-
1536, December 2008.

120
[28] Ajit Sharma, Mohammad Faisal Zaman, and Farrokh Ayazi, “A Sub 0.2 ⁰ /hr
Bias Drift Micromechanical Gyroscope With Automatic CMOS Mode-Matching,”
IEEE Journal of Solid State Circuits, Vol. 44, No. 5, pp.1593-1608, May 2009.
[29] B. Chaumet, B. Leverrier, C. Rougeot, S. Bouyat, “A New Silicon Tuning
Fork Gyroscope for Aerospace Applications,” Symposium Gyro Technology, pp.
1.1-1.13, Karlsruhe, Germany, September 2009.
[30] S. Sonmezoglu, “A High Performance Automatic Mode-Matched MEMS
Gyroscopes,” M.Sc. Thesis, Middle East Technical University, September 2012.
[31] S. Sonmezoglu, H. D. Gavcar, K. Azgin, S. E. Alper, and T. Akin,
“Simultaneous Detection of Linear and Coriolis Accelerations on a Mode-Matched
MEMS Gyroscope,” The 27th
IEEE International Conference on Micro Electro
Mechanical Systems (MEMS 2014), pp. 32-35, San Francisco, U.S.A., January 2014.
[32] M. M. Torunbalci, E. Tatar, S. E. Alper, and T. Akin, “Comparison of Two
Alternative Silicon-on-Glass Microfabrication Processes for MEMS Inertial
Sensors,” Eurosensors XXV, Athens, Greece, September 2011.
[33] M. M. Torunbalci, S. E. Alper, and T. Akin, “Wafer Level Hermetic
Encapsulation of MEMS Inertial Sensors using SOI Cap Wafers with Vertical
Feedthroughs,” IEEE Int. Symposium on Inertial Sensors and Systems (ISISS’14), pp.
1-2, Laguna Beach, California, USA, February 2014.
[34] J. A. Geen, “Progress in Integrated Gyroscopes,” Proceedings position,
location, and navigation symposium (PLANS), pp.1-6, Monterey, 2004.
[35] M. F. Zaman, A. Sharma , F. Ayazi, “High Performance Matched-mode Tuning
Fork Gyroscope”, The 19th
IEEE International Conference on Micro Electro
Mechanical Systems (MEMS 2006), pp. 66-69, Istanbul, Turkey., January 2006.
[36] H. Weinberg, “Gyro Mechanical Performance: The Most Important Parameter,”
Tech. art., Analog Devices, Sep. 2011.
[37] A. R. Schofield, A. A. Trusov, and A.M. Shkel, “Multi-degree of Freedom
Tuning Fork Gyroscope Demonstrating Shock Rejection,” IEEE Sensors, pp.120-
123, Oct. 2007.

121
[38] K. Azgin, Y. Temiz, and T. Akin, “An SOI-MEMS Tuning Fork Gyroscope
with Linearly Coupled Drive Mechanism,” The 20th
IEEE International Conference
on Micro Electro Mechanical Systems (MEMS 2007), pp. 607-610, Kobe, Japan,
January 21-25, 2007.
[39] S. W. Yoon, S.W. Lee, and K. Najafi, “Vibration-Induced Errors in MEMS
Tuning Fork Gyroscopes,” Sensor and Actuators A: Physical, Vol. 180, pp. 32-34,
Jun. 2012.
[40] S. W. Yoon, “Vibration Isolation and Shock Protection for MEMS,” Ph.D.
Dissertation, Uni. of Michigan, 2009.
[41] Analog Devices, “ADXRS450 High Performance, Digital Output Gyroscope,”
Datasheet, 2011.
[42] E. Tatar, “Quadrature Error Compensation and Its Effects on the Performance of
Fully Decoupled MEMS Gyroscopes,” M.Sc. Thesis, Middle East Technical
University, September 2010.
[43] S. E. Alper, K. Sahin, and T. Akin, “An Anaysis to Improve Stability of Drive-
Mode Oscillations in Capacitive Vibratory MEMS Gyroscopes,” The 22nd
IEEE
International Conference on Micro Electro Mechanical Systems (MEMS 2009), pp.
817-820, Sorrento, Italy, Jan. 2009.
[44] B. Eminoglu, S. E. Alper, and T. Akin, “An Optimized Analog Drive-Mode
Controller for Vibratory MEMS Gyroscopes,” Eurosensors XXV, Athens, Greece,
September 2011.
[45] E. Tatar, M. M. Torunbalci, S. E. Alper, and T. Akin, “A Method and Electrical
Model for the Anodic Bonding of SOI and Glass Wafers,” The 25th
IEEE
International Conference on Micro Electro Mechanical Systems (MEMS 2012), pp.
68-71, Paris, France, Jan. 29-Feb.2, 2012.
[46] M. M. Torunbalci, S. E. Alper, and T. Akin, “A Method of Fabricating Vacuum
Packages with Vertical Feedthroughs in a Wafer Level Anodic Bonding
Process,” Eurosensors XXVIII, Brescia, Italy, September 2014.

122
[47] S. E. Alper, M. M. Torunbalci, and T. Akin, "Method of wafer level hermetic
packaging with vertical feedthroughs," PCT/TR2013/000298, September 2013.