Embed Size (px)
Citation preview

COMPENDIUM OF RESEARCH

New York

COMPENDIUM OF RESEARCH
New York

About the College BoardThe College Board is a mission-driven not-for-profit organization that connects students to college success and opportunity. Founded in 1900, the College Board was created to expand access to higher education. Today, the membership association is made up of over 6,000 of the world’s leading educational institutions and is dedicated to promoting excellence and equity in education. Each year, the College Board helps more than seven million students prepare for a successful transition to college through programs and services in college readiness and college success—including the SAT® and the Advanced Placement Program®. The organization also serves the education community through research and advocacy on behalf of students, educators, and schools. For further information, visit collegeboard.org.
© 2017 The College Board. College Board, Advanced Placement, Advanced Placement Program, AP, Pre-AP, SAT, SpringBoard, and the acorn logo are registered trademarks of the College Board. College Board Standards for College Success is a trademark owned by the College Board. PSAT/NMSQT is a registered trademark of the College Board and National Merit Scholarship Corporation. All other marks are the property of their respective owners. Visit the College Board on the web: collegeboard.org.

SpringBoard® is the College Board’s instructional program for grades 6–12 in English language arts and mathematics. It integrates instruction, assessment, and professional learning to create a pathway to college readiness for all students.
From its first appearance in the early 1990s (under its earlier name of Pacesetter) to the program’s latest updates—including the addition of a powerful, award-winning digital component—the core principles behind SpringBoard have remained the same. And, as this publication establishes, those principles and strategies have been validated by years of research.
In this collection of research reports and case studies, you’ll find both empirical and theoretical research, comprehensive longitudinal studies, and case studies from schools and districts all over the country that attest to the efficacy of the SpringBoard program.
Chapter 1 examines the effects of the SpringBoard English Language Arts and Mathematics curriculum on school-level AP®, SAT®, and PSAT/NMSQT® participation and performance. You will see that schools that purchased SpringBoard saw greater increases in AP, SAT, and PSAT/NMSQT performance.
In Chapter 2, you’ll see the results of a Florida study that show a link between the use of SpringBoard with higher levels of AP participation and performance.
Chapter 3 presents a summary of phase-1 results from a five-year study on the relationship between SpringBoard use and AP enrollment and performance. These preliminary results show that over a four-year period, high schools that purchased SpringBoard saw greater increases in AP participation and performance than comparable non-SpringBoard schools.
Chapter 4 reports the findings of a rigorous, comprehensive longitudinal evaluation of the program. The researchers conclude that SpringBoard was shown to have a significant benefit in increasing student achievement, particularly in reading.
Chapter 5 presents a study that found that high schools that purchased SpringBoard showed greater increases in the percentage of students taking AP Exams in both English and mathematics, compared to similar non-SpringBoard schools, especially among black and Hispanic students. The number of students who scored 3 or higher in these exams also increased.
Chapter 6 presents the results of a study that found that the use of SpringBoard ELA for three years is related to statistically significant increases in participation in AP English Language and AP English Literature exams, with no decrease in performance.
SpringBoard’s proven teaching and learning strategies give all learners the chance to do well in a rigorous curriculum, and further our shared goal of preparing all our students for success in college and careers.
Welcome to the SpringBoard Compendium of Research
1

Research HighlightsImproving AP Enrollment and PerformanceProviding more students access to AP and helping to prepare students to succeed in AP who otherwise would not have the opportunity to take an AP course.
à SpringBoard saw greater increases in AP and PSAT/NMSQT participation, growing 4%–8% more, with no loss in performance. In addition, black and Hispanic students in these SpringBoard schools saw greater increases in AP participation and performance, growing up to 7 percentage points more than similar students in comparable non-SpringBoard schools.1
à SpringBoard schools showed statistically significant gains in access to AP, their AP Literature and Language participation rate increasing 4.5 percentage points more than that of comparable non-SpringBoard schools, with no loss of performance.2
à Hispanic Students in SpringBoard schools showed statistically significant increases in access to AP, their AP Literature and Language participation rate increasing 4.7 percentage points more than that of comparable non-SpringBoard schools, with no loss of performance.3
Increased Access to APMaking AP success accessible to traditionally underserved populations.
à Florida High schools that purchased SpringBoard for three to five years had substantially more students enrolled in AP courses.4
à Florida High schools that purchased SpringBoard had a 109% and 52% gain in the number of black and Hispanic students, respectively, enrolled in AP courses.5
à AP English exam takers: 65.9% increase in SpringBoard schools vs. 1.4% increase in non-SpringBoard schools, with most of the increase shown for black and Hispanic students.6
à AP Math exam takers: 14.0% increase in SpringBoard schools vs. -18.2% decrease in non-SpringBoard schools.7
à Statistically significant increase in AP Exam takers overall (48% more), AP English Literature Exam takers (77% more), AP English Language Exam takers (54% more), with no differences in performance at the aggregate.8
1. See Chapter 1: The SpringBoard National Effectiveness Study
2. See Chapter 2: Florida SpringBoard Schools Efficacy Study
3. See Chapter 2: Florida SpringBoard Schools Efficacy Study
4. See Chapter 3: Can SpringBoard Improve AP Enrollment and Performance? Phase 1: Five-Year Trend Analysis
5. See Chapter 3: Can SpringBoard Improve AP Enrollment and Performance? Phase 1: Five-Year Trend Analysis
6. See Chapter 5: Relationship Between SpringBoard and Advanced Placement® Participation and Performance Among High School College-bound Students
7. See Chapter 5: Relationship Between SpringBoard and Advanced Placement Participation and Performance Among High School College-bound Students
8. See Chapter 6: The Impact of SpringBoard on AP Participation and Performance in Three Urban, Public High Schools
2 | Compendium of Research
Contents 4 Chapter 1: The SpringBoard National Effectiveness Study
40 Chapter 2: Florida SpringBoard Schools Efficacy Study
50 Chapter 3: Can SpringBoard Improve AP Enrollment and Performance? Phase 1: Five-Year Trend Analysis
56 Chapter 4: Westat Longitudinal Evaluation—Executive Summary Report
66 Chapter 5: Relationship Between SpringBoard and Advanced Placement Participation and Performance Among High School College-Bound Students
72 Chapter 6: The Impact of SpringBoard on AP Participation and Performance in Three Urban Public High Schools
3
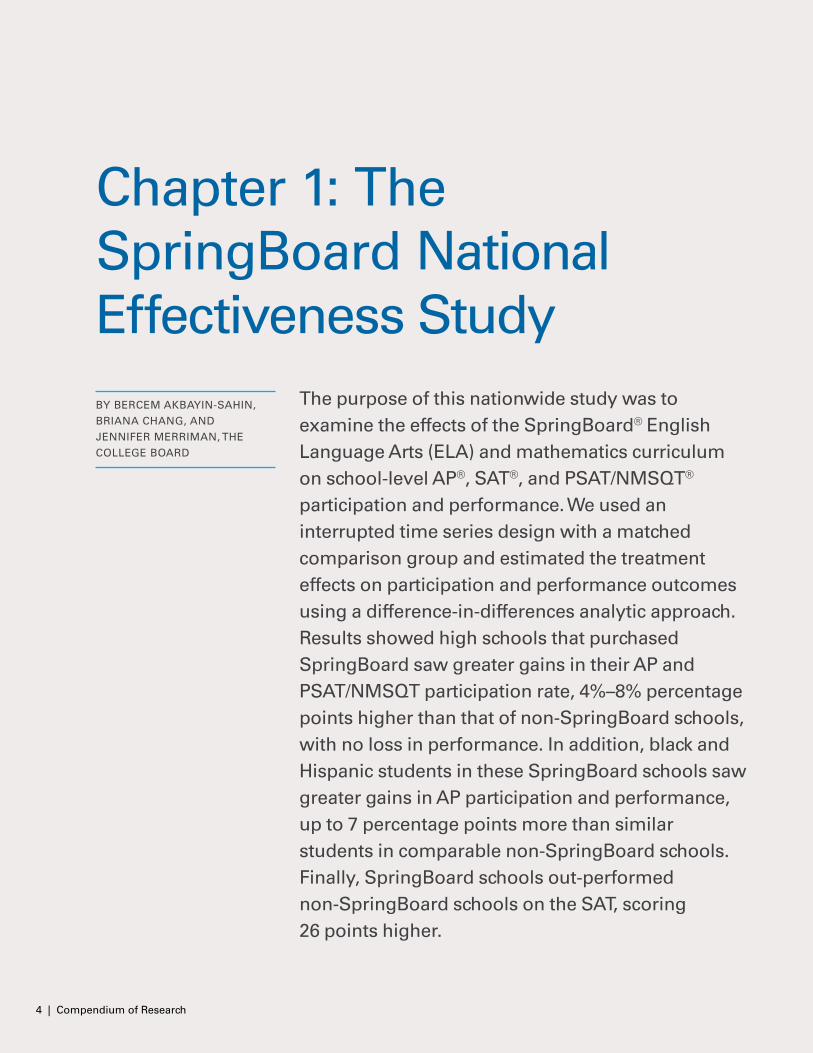
Chapter 1: The SpringBoard National Effectiveness StudyBY BERCEM AKBAYIN-SAHIN,
BRIANA CHANG, AND
JENNIFER MERRIMAN, THE
COLLEGE BOARD
The purpose of this nationwide study was to examine the effects of the SpringBoard® English Language Arts (ELA) and mathematics curriculum on school-level AP®, SAT®, and PSAT/NMSQT® participation and performance. We used an interrupted time series design with a matched comparison group and estimated the treatment effects on participation and performance outcomes using a difference-in-differences analytic approach. Results showed high schools that purchased SpringBoard saw greater gains in their AP and PSAT/NMSQT participation rate, 4%–8% percentage points higher than that of non-SpringBoard schools, with no loss in performance. In addition, black and Hispanic students in these SpringBoard schools saw greater gains in AP participation and performance, up to 7 percentage points more than similar students in comparable non-SpringBoard schools. Finally, SpringBoard schools out-performed non-SpringBoard schools on the SAT, scoring 26 points higher.
4 | Compendium of Research

CH
AP
TE
R 1: T
HE
SP
RIN
GB
OA
RD
NA
TIO
NA
L EFFE
CT
IVE
NE
SS
ST
UD
Y
In this design, there were three baseline years (from 2010 through 2012) when all schools did not use the SpringBoard program and three treatment years (from 2013 through 2015) when only SpringBoard schools had purchased the curriculum. The outcomes examined were school-level participation and performance for AP, SAT, and PSAT/NMSQT outcomes (PSAT/NMSQT for juniors, PSAT/NMSQT for sophomores). AP outcomes included participation and performance in (a) ELA and social science subjects1, (b) ELA subjects only2, and (c) math subjects3. AP participation rates are defined as the percentage of graduating seniors who took at least one AP Exam in the specified course cluster. AP performance rates were defined as the percentage of AP Exam takers scoring 3 or higher in at least one AP Exam. For AP ELA and social science subjects and AP ELA subjects only, we present results for all students in schools, as well as for two subgroups —black students and Hispanic students.
SAT and PSAT/NMSQT outcomes include participation and performance for section scores in (a) Critical Reading, (b) Writing, and (c) Math (SAT performance outcomes also include total SAT scores). Performance outcomes for SAT and PSAT/NMSQT were defined as school mean average scores for participating students. In this study, the DD analytic approach estimated the treatment effect of SpringBoard by examining whether SpringBoard schools deviate from their baseline mean by a greater amount than matched non-SpringBoard schools for each treatment year (Somers, Zhu, Jacob, & Bloom, 2013).
We sought to answer the following research questions:
1. Did students in SpringBoard schools show greater gains in AP, SAT, and PSAT/NMSQT participation and performance than students in matched non-SpringBoard schools?
2. Did black and Hispanic students in SpringBoard schools show greater gains in AP participation and performance than similar students in matched non-SpringBoard schools?
IntroductionSpringBoard® is the College Board’s instructional program for grades 6–12 in English Language Arts (ELA) and mathematics. It integrates instruction, assessment, and professional learning to create a pathway to college readiness for all students. Since its first appearance in the early 1990s, the number of schools using SpringBoard throughout the United States has gradually increased. Given the program’s widespread use, the goal of this study was to evaluate the effectiveness of the SpringBoard curriculum. A randomized controlled trial was not possible since the program expanded in response to interest from schools and districts (i.e., rather than by random assignment). When a randomized experiment is not feasible, program evaluation can proceed with a quasi-experimental research design. In quasi-experimental studies, it is often challenging to attribute the observed impact solely to the program. However, bias in the causal inference can be reduced by adding design elements and statistical controls (Shadish, Cook, & Campbell, 2002). To address this issue, we used an interrupted time series (ITS) design with a matched comparison group (“non-SpringBoard schools”) and estimated the treatment effects on school-level AP®, SAT®, and PSAT/NMSQT® participation and performance using a difference-in-differences (DD) analytic approach. Adding a comparison group reduced the plausibility of history and maturation, threats and using matching methods ensured that SpringBoard and matched non-SpringBoard schools did not differ from each other during baseline years on measured school characteristics. Using a DD approach also reduces the bias from constant, but unobserved, school characteristics (Angrist & Pischke, 2009; Lechner, 2010).
1. AP ELA and social science cluster included (1) AP English Language and Composition, (2) AP English Literature and Composition, (3) AP Art History, (4) AP European History, (5) AP World History, (6) AP U.S. History, (7) AP U.S. Government and Politics, and (8) AP Comparative Government and Politics.
2. AP ELA only cluster included (1) English Language and Composition and (2) English Literature and Composition. 3. AP math cluster included (1) AP Calculus AB, (2) AP Calculus BC, and (3) AP Statistics.
SpringBoard schools saw greater gains in AP participation
Schools that purchased SpringBoard saw their AP and PSAT/NMSQT participation rise 4%–8% percentage points higher than that of non-SpringBoard schools, with no loss in performance. In addition, black and Hispanic students in these SpringBoard schools saw greater gains in AP participation and performance, up to 7 percentage points more than similar students in comparable non-SpringBoard schools.
5
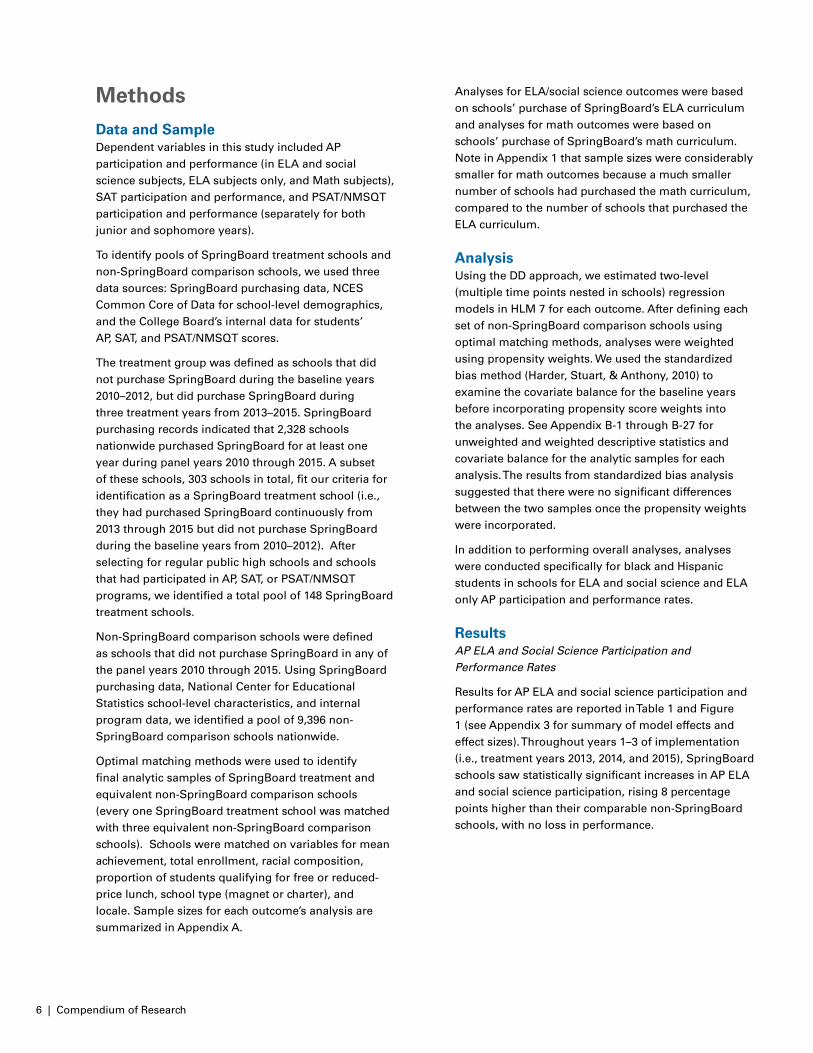
Analyses for ELA/social science outcomes were based on schools’ purchase of SpringBoard’s ELA curriculum and analyses for math outcomes were based on schools’ purchase of SpringBoard’s math curriculum. Note in Appendix 1 that sample sizes were considerably smaller for math outcomes because a much smaller number of schools had purchased the math curriculum, compared to the number of schools that purchased the ELA curriculum.
AnalysisUsing the DD approach, we estimated two-level (multiple time points nested in schools) regression models in HLM 7 for each outcome. After defining each set of non-SpringBoard comparison schools using optimal matching methods, analyses were weighted using propensity weights. We used the standardized bias method (Harder, Stuart, & Anthony, 2010) to examine the covariate balance for the baseline years before incorporating propensity score weights into the analyses. See Appendix B-1 through B-27 for unweighted and weighted descriptive statistics and covariate balance for the analytic samples for each analysis. The results from standardized bias analysis suggested that there were no significant differences between the two samples once the propensity weights were incorporated.
In addition to performing overall analyses, analyses were conducted specifically for black and Hispanic students in schools for ELA and social science and ELA only AP participation and performance rates.
ResultsAP ELA and Social Science Participation and Performance Rates
Results for AP ELA and social science participation and performance rates are reported in Table 1 and Figure 1 (see Appendix 3 for summary of model effects and effect sizes). Throughout years 1–3 of implementation (i.e., treatment years 2013, 2014, and 2015), SpringBoard schools saw statistically significant increases in AP ELA and social science participation, rising 8 percentage points higher than their comparable non-SpringBoard schools, with no loss in performance.
Methods
Data and SampleDependent variables in this study included AP participation and performance (in ELA and social science subjects, ELA subjects only, and Math subjects), SAT participation and performance, and PSAT/NMSQT participation and performance (separately for both junior and sophomore years).
To identify pools of SpringBoard treatment schools and non-SpringBoard comparison schools, we used three data sources: SpringBoard purchasing data, NCES Common Core of Data for school-level demographics, and the College Board’s internal data for students’ AP, SAT, and PSAT/NMSQT scores.
The treatment group was defined as schools that did not purchase SpringBoard during the baseline years 2010–2012, but did purchase SpringBoard during three treatment years from 2013–2015. SpringBoard purchasing records indicated that 2,328 schools nationwide purchased SpringBoard for at least one year during panel years 2010 through 2015. A subset of these schools, 303 schools in total, fit our criteria for identification as a SpringBoard treatment school (i.e., they had purchased SpringBoard continuously from 2013 through 2015 but did not purchase SpringBoard during the baseline years from 2010–2012). After selecting for regular public high schools and schools that had participated in AP, SAT, or PSAT/NMSQT programs, we identified a total pool of 148 SpringBoard treatment schools.
Non-SpringBoard comparison schools were defined as schools that did not purchase SpringBoard in any of the panel years 2010 through 2015. Using SpringBoard purchasing data, National Center for Educational Statistics school-level characteristics, and internal program data, we identified a pool of 9,396 non-SpringBoard comparison schools nationwide.
Optimal matching methods were used to identify final analytic samples of SpringBoard treatment and equivalent non-SpringBoard comparison schools (every one SpringBoard treatment school was matched with three equivalent non-SpringBoard comparison schools). Schools were matched on variables for mean achievement, total enrollment, racial composition, proportion of students qualifying for free or reduced-price lunch, school type (magnet or charter), and locale. Sample sizes for each outcome’s analysis are summarized in Appendix A.
6 | Compendium of Research

TABLE 1 AP ELA AND SOCIAL SCIENCE MEAN PARTICIPATION AND PERFORMANCE RATES BY YEAR FOR NON-SPRINGBOARD AND SPRINGBOARD SCHOOLS
Mean Participation Rate (%) Mean Performance Rate (%)
Year Non-SB(n = 360)
SB(n = 120)
Non-SB(n = 381)
SB(n = 127)
BASELINE
2010-12 24.8 23.7 36.1 35.8
TREATMENT
2013 24.2 29.3* 37.2 37.4
2014 24.9 31.0* 36.2 35.6
2015 26.4 33.0* 36.3 36.5
Note. SB = SpringBoard. * indicates statistically significant difference versus non-SB, p < .05
FIGURE 1 RESULTS FOR AP ELA AND SOCIAL SCIENCE PARTICIPATION AND PERFORMANCE
Note. SB = SpringBoard. * indicates statistically significant difference versus non-SpringBoard, p < .05
ELA and Social Science Participation Rates for All Students ELA Participation Rates for Participating Students
2010
SB
2011 2012 2013 2014 20150.0
0.1
0.2
0.3
0.4
0.5
0.6Non-SB
50%
45%
40%
35%
30%
25%
20%
2010
SB
2011 2012 2013 2014 20150.0
0.1
0.2
0.3
0.4
0.5
0.6Non-SB
50%
45%
40%
35%
30%
25%
20%
CH
AP
TE
R 1: T
HE
SP
RIN
GB
OA
RD
NA
TIO
NA
L EFFE
CT
IVE
NE
SS
ST
UD
Y
statistically significant increase in AP ELA
SpringBoard schools saw statistically significant increases in AP ELA and social science participation, rising 8 percentage points higher than their comparable non-SpringBoard schools, with no loss in performance.
7

Table 2 and Figure 2 display results from analyses of subgroups for schools’ black students and Hispanic students (see Appendix C for summary of model effects and effect sizes). Although there were no significant differences between SpringBoard and non-SpringBoard schools’ participation and performance for black students, Hispanic students in SpringBoard schools increased participation, with no loss in performance. In years 2 and 3 of implementation, SpringBoard schools’
Mean Rates for Black Students Mean Rates for Hispanic Students
Participation (%) Performance (%) Participation (%) Performance (%)
YearNon-SB SB Non-SB SB Non-SB SB Non-SB SB(n = 324) (n = 108) (n = 315) (n = 105) (n = 318) (n = 106) (n = 297) (n = 99)
BASELINE
2010-12 16.4 16.9 30.1 30.2 24.0 25.4 34.0 33.6
TREATMENT
2013 17.9 18.0 28.9 33.2 21.1 24.8 35.2 34.1
2014 18.6 21.0 27.5 30.3 24.0 29.6* 34.8 36.2
2015 20.6 22.7 25.7 29.6 25.3 31.4* 32.7 35.2
Note. SB = SpringBoard. * indicates statistically significant difference versus non-SpringBoard, p < .05
TABLE 2 AP ELA AND SOCIAL SCIENCE MEAN PARTICIPATION AND PERFORMANCE RATES BY YEAR FOR SCHOOLS’ BLACK AND HISPANIC STUDENTS
Hispanic students showed statistically significant increases in AP ELA and social science participation rates, gaining approximately 5 percentage points more than comparable non-SpringBoard schools’ Hispanic students.
8 | Compendium of Research

ELA and Social Science Participation Rates for Black Students
ELA and Social Science Participation Rates for Hispanic Students
ELA and Social Science Performance Rates for Participating Black Students
ELA and Social Science Performance Rates for Participating Hispanic Students
Note. * indicates statistically significant difference versus non- SpringBoard, p < .05
FIGURE 2 RESULTS FOR AP ELA AND SOCIAL SCIENCE PARTICIPATION AND PERFORMANCE FOR BLACK AND HISPANIC STUDENTS
2010
SB
2011 2012 2013 2014 20150.0
0.1
0.2
0.3
0.4
0.5
0.6Non-SB
60%
50%
40%
30%
20%
10%
0%
2010
SB
2011 2012 2013 2014 20150.0
0.1
0.2
0.3
0.4
0.5
0.6Non-SB
60%
50%
40%
30%
20%
10%
0%
2010
SB
2011 2012 2013 2014 20150.0
0.1
0.2
0.3
0.4
0.5
0.6Non-SB
60%
50%
40%
30%
20%
10%
0%
2010
SB
2011 2012 2013 2014 20150.0
0.1
0.2
0.3
0.4
0.5
0.6Non-SB
60%
50%
40%
30%
20%
10%
0%
CH
AP
TE
R 1: T
HE
SP
RIN
GB
OA
RD
NA
TIO
NA
L EFFE
CT
IVE
NE
SS
ST
UD
Y
9

Mean Participation Rate (%) Mean Performance Rate (%)
YearNon-SB SB Non-SB SB
(n = 372) (n = 124) (n = 354) (n = 118)
BASELINE
2010-12 18.8 18.8 39.8 39.4
TREATMENT
2013 19.0 21.3 41.0 41.0
2014 19.6 23.8* 39.3 37.1
2015 20.2 24.1* 40.0 38.8
Note. SB = SpringBoard. * indicates statistically significant difference versus non-SpringBoard, p < .05
AP ELA Participation and Performance ratesResults for AP ELA participation and performance are reported in Table 3 and Figure 3 (see Appendix C for summary of model effects and effect sizes). In years 2 and 3 of implementation, SpringBoard schools showed statistically significant increases in AP ELA participation rates, rising 4 percentage points higher than comparable non-SpringBoard schools, with no loss in performance rates.
TABLE 3 AP ELA ONLY MEAN PARTICIPATION AND PERFORMANCE RATES BY YEAR FOR NON-SPRINGBOARD AND SPRINGBOARD SCHOOLS
FIGURE 3 RESULTS FOR AP ELA PARTICIPATION AND PERFORMANCE
Note. SB = SpringBoard. * indicates statistically significant difference versus non-SpringBoard, p < .05
ELA Participation Rates for All Students ELA Performance Rates for Participating Students
2010
SB
2011 2012 2013 2014 20150.0
0.1
0.2
0.3
0.4
0.5
0.6Non-SB
50%
45%
40%
35%
30%
25%
20%
2010
SB
2011 2012 2013 2014 20150.0
0.1
0.2
0.3
0.4
0.5
0.6Non-SB
30%
25%
20%
15%
10%
5%
0%
10 | Compendium of Research

CH
AP
TE
R 1: T
HE
SP
RIN
GB
OA
RD
NA
TIO
NA
L EFFE
CT
IVE
NE
SS
ST
UD
Y
Mean Rates for Black Students Mean Rates for Hispanic Students
Participation (%) Performance (%) Participation (%) Performance (%)
YearNon-SB SB Non-SB SB Non-SB SB Non-SB SB(n = 318) (n = 106) (n = 297) (n = 99) (n = 315) (n = 105) (n = 267) (n = 99)
BASELINE
2010-12 13.0 12.9 30.2 30.1 18.0 19.0 35.9 35.6
TREATMENT
2013 13.5 13.7 29.2 32.8 16.1 16.8 35.7 34.0
2014 13.0 16.6* 26.6 30.8 18.4 23.3* 32.0 32.6
2015 15.2 16.9 28.8 29.2 19.2 23.6 30.7* 37.3
Note. SB = SpringBoard. * indicates statistically significant difference versus non-SpringBoard, p < .05
Mean Participation Rate (%) Mean Performance Rate (%)
YearNon-SB SB Non-SB SB
(n = 372) (n = 124) (n = 354) (n = 118)
BASELINE
2010-12 18.8 18.8 39.8 39.4
TREATMENT
2013 19.0 21.3 41.0 41.0
2014 19.6 23.8* 39.3 37.1
2015 20.2 24.1* 40.0 38.8
Note. SB = SpringBoard. * indicates statistically significant difference versus non-SpringBoard, p < .05
for black students increased with no accompanying loss in performance rates, participation rates and performance rates for Hispanic students increased. In year 3 of implementation, SpringBoard schools’ AP ELA performance rates for Hispanic students showed a statistically significant increase, with the percentage of Hispanic students scoring a 3 or greater on AP ELA exams rising 7 percentage points higher than comparable non-SpringBoard schools’ performance rate for Hispanic students.
Results from analyses of subgroups suggest these trends are similar for schools’ black students and Hispanic students (see Table 4 and Figure 4; see Appendix C for summary of model effects and effect sizes). In year 2 of implementation, SpringBoard schools’ black and Hispanic students showed statistically significant increases in AP ELA Participation, rising approximately 4 percentage points higher than participation for comparable non-SpringBoard schools’ black and Hispanic students. While participation rates
TABLE 4 AP ELA ONLY MEAN PARTICIPATION AND PERFORMANCE RATES BY YEAR FOR SCHOOLS’ BLACK AND HISPANIC STUDENTS
increase in AP participation rates
SpringBoard schools showed statistically significant increases in AP ELA participation rates, rising 4 percentage points higher than comparable non-SpringBoard schools, with no loss in performance rates.
11

FIGURE 4 RESULTS FOR AP ELA PARTICIPATION AND PERFORMANCE BY BLACK AND HISPANIC STUDENTS
ELA Participation Rates for Black Students
ELA Participation Rates for Hispanic Students
ELA Performance Rates for Participating Black Students
ELA Performance Rates for Participating Hispanic Students
Note. SB = SpringBoard * indicates statistically significant difference versus non-SpringBoard, p < .05
2010
SB
2011 2012 2013 2014 20150.0
0.1
0.2
0.3
0.4
0.5
0.6Non-SB
60%
50%
40%
30%
20%
10%
0%
2010
SB
2011 2012 2013 2014 20150.0
0.1
0.2
0.3
0.4
0.5
0.6Non-SB
60%
50%
40%
30%
20%
10%
0%
2010
SB
2011 2012 2013 2014 20150.0
0.1
0.2
0.3
0.4
0.5
0.6Non-SB
60%
50%
40%
30%
20%
10%
0%
2010
SB
2011 2012 2013 2014 20150.0
0.1
0.2
0.3
0.4
0.5
0.6Non-SB
60%
50%
40%
30%
20%
10%
0%
12 | Compendium of Research

Mean Participation Rate (%) Mean Performance Rate (%)
Year
Non-SB SB Non-SB SB
(n = 138) (n = 46) (n = 132) (n = 44)
BASELINE
2010-12 9.2 8.8 28.1 25.5
TREATMENT
2013 9.0 8.3 32.3 34.3
2014 9.5 10.2 35.6 38.1
2015 10.1 10.4 34.4 33.6
Note. * indicates statistically significant difference versus non-SpringBoard, p < .05
FIGURE 5 RESULTS FOR AP MATH PARTICIPATION AND PERFORMANCE
Note. SB = SpringBoard * indicates statistically significant difference versus non-SpringBoard, p < .05
AP Math Participation and Performance RatesResults for AP math participation and performance rates are reported in Table 5 and Figure 5. There were no statistically significant differences between the AP math participation and performances rates of SpringBoard schools versus those of comparable non-SpringBoard schools.
TABLE 5 AP MATH MEAN PARTICIPATION AND PERFORMANCE RATES BY YEAR FOR NON-SPRINGBOARD AND SPRINGBOARD SCHOOLS
CH
AP
TE
R 1: T
HE
SP
RIN
GB
OA
RD
NA
TIO
NA
L EFFE
CT
IVE
NE
SS
ST
UD
Y
Math Participation Rates for All Students Math Performance Rates for Participating Students
2010
SB
2011 2012 2013 2014 20150.0
0.1
0.2
0.3
0.4
0.5
0.6Non-SB
40%
35%
30%
25%
20%
15%
10%
2010
SB
2011 2012 2013 2014 20150.0
0.1
0.2
0.3
0.4
0.5
0.6Non-SB
30%
25%
20%
15%
10%
5%
0%
26 points higher in SAT scores
In year 3 of implementation, SpringBoard schools showed a statistically significant increase in total SAT scores, scoring 26 points higher than comparable non-SpringBoard schools.
13

SAT SAT Total
Participation (%) Performance
YearNon-SB SB Non-SB SB
(n = 420) (n = 140) (n = 420) (n = 140)
BASELINE
2010-12 47.9 39.1 1391.3 1388.9
TREATMENT
2013 45.1 42.8 1400.1 1383.4
2014 47.3 43.2 1402.1 1390.5
2015 51.5 42.6 1393.1 1416.2*
SAT Critical Reading SAT Writing SAT Math
Performance Performance Performance
YearNon-SB SB Non-SB SB Non-SB SB
(n = 393) (n = 131) (n = 393) (n = 131) (n = 165) (n = 55)
BASELINE
2010-12 466.7 466.9 449.2 449.9 464.4 465.3
TREATMENT
2013 467.2 464.2 448.9 446.9 465.5 462.1
2014 468.9 470.3 448.9 452.7 462.9 462.4
2015 468.3 478.5* 447.4 456.8* 460.3 471.6
Note. SB = SpringBoard. * indicates statistically significant difference versus non-SpringBoard, p < .05
comparable non-SpringBoard schools. These findings seem to be largely driven by gains in Critical Reading and Writing. In year 3 of implementation, SpringBoard schools showed a statistically significant increase in SAT Critical Reading scores, scoring 10 points higher than comparable non-SpringBoard schools. SpringBoard schools also showed a statistically significant increase in SAT Writing scores in year 3 of the implementation, scoring 9 points higher than comparable non-SpringBoard schools. Gains in SAT Math section scores for SpringBoard schools were not significant, compared to non-SpringBoard schools.
SAT Participation Rates and PerformanceResults are presented for SAT participation rates, SAT Total Score, SAT Critical Reading Score, SAT Writing Score, and SAT Math Score (see Table 6 and Figure 6; see Appendix D for summary of model effects and effect sizes). While participation rates for SpringBoard versus non-SpringBoard schools did not differ significantly, SpringBoard schools outperformed comparable non-SpringBoard schools in total SAT scores. In year 3 of implementation, SpringBoard schools showed a statistically significant increase in total SAT scores, scoring 26 points higher than
TABLE 6 SAT PARTICIPATION AND PERFORMANCE BY YEAR FOR NON-SPRINGBOARD AND SPRINGBOARD SCHOOLS
14 | Compendium of Research

SAT Participation Rates
SAT Critical Reading Score Performance
SAT Math Score Performance
SAT Total Score Performance
SAT Writing Score Performance
Note. SB = SpringBoard. * indicates statistically significant difference versus non-SpringBoard, p < .05
FIGURE 6 RESULTS FOR SAT PARTICIPATION AND PERFORMANCE
2010
SB
2011 2012 2013 2014 20150.0
0.1
0.2
0.3
0.4
0.5
0.6Non-SB
1475
1450
1425
1400
1375
1350
13252010
SB
2011 2012 2013 2014 20150.0
0.1
0.2
0.3
0.4
0.5
0.6Non-SB
60%
55%
50%
45%
40%
35%
30%
2010
SB
2011 2012 2013 2014 20150.0
0.1
0.2
0.3
0.4
0.5
0.6Non-SB
525
500
475
450
425
400
3752010
SB
2011 2012 2013 2014 20150.0
0.1
0.2
0.3
0.4
0.5
0.6Non-SB
525
500
475
450
425
400
375
2010
SB
2011 2012 2013 2014 20150.0
0.1
0.2
0.3
0.4
0.5
0.6Non-SB
525
500
475
450
425
400
375
CH
AP
TE
R 1: T
HE
SP
RIN
GB
OA
RD
NA
TIO
NA
L EFFE
CT
IVE
NE
SS
ST
UD
Y
15

PSAT/NMSQT Junior Year Participation Rates and PerformanceResults are presented for PSAT/NMSQT Junior Year participation rates, Critical Reading Scores, Writing Scores, and Math Scores (see Table 7 and Figure 7; see Appendix E for summary of model effects and effect sizes). Throughout years 1–3 of implementation, SpringBoard schools showed statistically significant increases in PSAT/NMSQT junior year participation rates, rising 8 percentage points higher than comparable non-SpringBoard schools, with no loss in performance. Despite gains in participation, there were no significant differences during treatment years between PSAT/NMSQT Critical Reading, Writing, and Math scores for SpringBoard versus non-SpringBoard juniors.
TABLE 7 PSAT/NMSQT JUNIOR YEAR PARTICIPATION AND PERFORMANCE BY YEAR FOR NON-SPRINGBOARD AND SPRINGBOARD SCHOOLS
PSAT/NMSQT Junior Year
PSAT/NMSQT Jr. Critical Reading
PSAT/NMSQT Jr. Writing
PSAT/NMSQT Jr. Math
Participation (%) Performance Performance Performance
YearNon-SB SB Non-SB SB Non-SB SB Non-SB SB
(n = 423) (n = 141) (n = 396) (n = 132) (n = 396) (n = 133) (n = 171) (n = 57)
BASELINE
2010-12 50.9 51.0 440.6 440.7 420.2 419.6 451.4 455.2
TREATMENT
2013 46.6 55.5* 448.2 446.7 421.2 420.9 451.5 445.1
2014 46.3 58.8* 449.0 446.4 431.5 428.4 454.5 444.8
2015 50.5 58.2* 442.7 448.9 423.3 425.5 455.6 450.6
Note. SB = SpringBoard * indicates statistically significant difference versus non-SpringBoard, p < .05
Significant increases in PSAT/NMSQT
SpringBoard schools showed statistically significant increases in PSAT/NMSQT junior year participation rates, rising 8 percentage points higher than comparable non-SpringBoard schools, with no loss in performance.
16 | Compendium of Research

PSAT/NMSQT Jr. Participation Rates
PSAT/NMSQT Jr. Writing Score Performance
PSAT/NMSQT Jr. Critical Reading Score Performance
PSAT/NMSQT Jr. Math Performance
Note. * indicates statistically significant difference versus non- SpringBoard, p < .05
FIGURE 7 RESULTS FOR PSAT/NMSQT JUNIOR YEAR PARTICIPATION AND PERFORMANCE
2010
SB
2011 2012 2013 2014 20150.0
0.1
0.2
0.3
0.4
0.5
0.6Non-SB
525
500
475
450
425
400
3752010
SB
2011 2012 2013 2014 20150.0
0.1
0.2
0.3
0.4
0.5
0.6Non-SB
65%
60%
55%
50%
45%
40%
35%
2010
SB
2011 2012 2013 2014 20150.0
0.1
0.2
0.3
0.4
0.5
0.6Non-SB
525
500
475
450
425
400
3752010
SB
2011 2012 2013 2014 20150.0
0.1
0.2
0.3
0.4
0.5
0.6Non-SB
525
500
475
450
425
400
375
CH
AP
TE
R 1: T
HE
SP
RIN
GB
OA
RD
NA
TIO
NA
L EFFE
CT
IVE
NE
SS
ST
UD
Y
17

PSAT/NMSQT 10 Sophomore Participation Rates and PerformanceResults are presented for PSAT/NMSQT sophomore year participation rates, Critical Reading Scores, Writing Scores, and Math Scores (see Table 8 and Figure 8; see Appendix F for summary of model effects and effect sizes). In year 2 of the intervention, SpringBoard schools showed a statistically significant increase in PSAT/NMSQT sophomore participation, rising 28 percentage points higher than comparable non-SpringBoard schools. This large relative growth rate for participation in SpringBoard schools is partially attributable to the sizable decline in participation rates for non-SpringBoard schools. During this time, there were also statistically significant declines in performance for SpringBoard schools’ Critical Reading and Writing Scores. Comparable non-SpringBoard schools’ scores in these areas rose 11 and 8 points higher, respectively, than SpringBoard schools. However, by year 3 of the intervention, these differences in participation and scores had diminished and were nonsignificant.
TABLE 8 PSAT/NMSQT SOPHOMORE YEAR PARTICIPATION AND PERFORMANCE BY YEAR FOR NON-SPRINGBOARD AND SPRINGBOARD SCHOOLS
PSAT/NMSQT Sophomore Year
PSAT/NMSQT Soph. Critical Reading
PSAT/NMSQT Soph. Writing
PSAT/NMSQT Soph. Math
Participation (%) Performance Performance Performance
YearNon-SB SB Non-SB SB Non-SB SB Non-SB SB
(n = 423) (n = 141) (n = 396) (n = 132) (n = 396) (n = 133) (n = 171) (n = 57)
BASELINE
2010-12 67.0 59.0 404.1 408.5 393.7 398.5 422.6 427.0
TREATMENT
2013 57.5 70.1 413.1 410.9 392.8 389.3 431.0 424.6
2014 49.7 70.0* 420.3 413.4* 396.1 392.6* 423.1 426.4
2015 51.0 62.3 417.7 417.0 401.1 402.4 422.3 430.4
Note. SB =SpringBoard. * indicates statistically significant difference versus non-SpringBoard, p < .05
18 | Compendium of Research

PSAT/NMSQT Sophomore Participation Rates
PSAT/NMSQT Sophomore Writing Score Performance
PSAT/NMSQT Sophomore Critical Reading Score Performance
PSAT/NMSQT Sophomore Math Score Performance
Note. SB = SpringBoard. * indicates statistically significant difference versus non-SpringBoard, p < .05
FIGURE 8 RESULTS FOR PSAT SOPHOMORE YEAR PARTICIPATION AND PERFORMANCE
2010
SB
2011 2012 2013 2014 20150.0
0.1
0.2
0.3
0.4
0.5
0.6Non-SB
525
500
475
450
425
400
3752010
SB
2011 2012 2013 2014 20150.0
0.1
0.2
0.3
0.4
0.5
0.6Non-SB
75%
70%
65%
60%
55%
50%
45%
2010
SB
2011 2012 2013 2014 20150.0
0.1
0.2
0.3
0.4
0.5
0.6Non-SB
525
500
475
450
425
400
3752010
SB
2011 2012 2013 2014 20150.0
0.1
0.2
0.3
0.4
0.5
0.6Non-SB
525
500
475
450
425
400
375
CH
AP
TE
R 1: T
HE
SP
RIN
GB
OA
RD
NA
TIO
NA
L EFFE
CT
IVE
NE
SS
ST
UD
Y
19

It is important to emphasize the fact that, because of lack of random assignment, cause-effect relationship is harder to establish. However, to address the threats to internal validity, we used one of the strongest quasi-experimental research designs, ITS with a comparison group, and implemented the DD method to eliminate the bias from constant, but unobserved, school characteristics. Moreover, matching and propensity score weights were used to achieve the baseline equivalence between the SpringBoard and non-SpringBoard schools. In the coming years, to improve the strength of the comparative ITS design, we plan to repeat this analysis with additional years of data from the SpringBoard schools. Finally, as new schools are purchasing SpringBoard, we plan to repeat the same analysis to examine whether similar results hold with different samples of SpringBoard schools.
ReferencesAngrist, J. D., & Pischke, J. S. (2010). Mostly harmless econometrics: An empiricist’s companion. Princeton: Princeton University Press.
Harder, V.S., Stuart, E. A., Anthony, J.C. (2009). Propensity score techniques and the assessment of measured covariate balance to test casual associations in psychological research. Psychological Methods, 15(3), 234–239.
Lechner, M. (2010). The estimation of causal effects by difference-in-difference methods. Foundations and Trends in Econometrics, 4(3), 165–224.
Shadish, W. R., Cook, T. D., & Campbell, D. T. (2002). Experimental and quasi-experimental designs for generalized causal inference. Belmont, CA: Wadsworth, Cengage Learning.
Somers, M.-A., Zhu, P., Jacob, R., & Bloom, H. (2013). The Validity and Precision of the Comparative Interrupted Time Series Design and the Difference-in-Difference Design in Educational Evaluation. MDRC Working Paper on Research Methodology. New York.
Summary and LimitationsThe purpose of this study was to compare SpringBoard schools and non-SpringBoard schools to examine (1) overall participation and performance in AP, SAT, and PSAT/NMSQT and (2) AP participation and performance specifically for black and Hispanic students. Overall, findings from these analyses demonstrate that SpringBoard schools increased participation in AP ELA/social science programs for subjects, as well as the PSAT/NMSQT. We also observed a similar increase in access to AP ELA and social science and ELA only subjects for black and Hispanic students in SpringBoard schools.
It is encouraging that SpringBoard schools outperformed their non-SpringBoard counterparts in SAT performance. Furthermore, though a greater proportion of students in SpringBoard schools are participating in the specified AP subjects and PSAT/NMSQT, we largely observed no loss in performance. This suggests that SpringBoard schools were able to increase access to AP and PSAT/NMSQT with no loss of performance. For black and Hispanic students, access to AP was significantly increased. And what is more promising is that Hispanic students in SpringBoard schools actually outperformed similar students from non-SpringBoard schools, specifically on AP ELA exams.
As with any study, these findings must be interpreted in light of the limitations of the analysis. First, designation as a SpringBoard school was based on purchasing data only; that is, we know that the schools purchased the SpringBoard curriculum but we have no data on the fidelity of implementation. Heterogeneity of implementation may mute the effects of SpringBoard. Second, although this study used nationwide school-level data, the results may not necessarily generalize to the population of schools at large. This is because schools purchasing SpringBoard might be in some ways different than the general population of schools. Third, our sample sizes were limited by our definition of SpringBoard treatment schools (i.e., they had to have not purchased and purchased the curriculum during defined years) and were particularly small for math outcomes, given that schools less frequently purchased the math curriculum in general. SpringBoard Outperformed on SAT
SpringBoard schools outperformed their non-SpringBoard counterparts in SAT performance.
20 | Compendium of Research

Total n for Analytic Sample by Condition
Overall Black Students Hispanic StudentsOutcome Non-SB SB Non-SB SB Non-SB SB
AP
ELA and Social Science
Participation Rate 381 127 324 108 318 106
Performance Rate 360 120 315 105 303 101
ELA only
Participation Rate 372 124 318 106 315 105
Performance Rate 354 118 297 99 297 99
Math
Participation Rate 138 46 — — — —
Performance Rate 132 44 — — — —
SAT
Participation Rate 420 140 — — — —
Performance
Total Score 420 140 — — — —
Critical Reading 393 131 — — — —
Writing 393 131 — — — —
Math 165 55 — — — —
PSAT/NMSQT JUNIOR YEAR
Participation Rate 423 141 — — — —
Performance
Critical Reading 402 134 — — — —
Writing 402 134 — — — —
Math 171 57 — — — —
PSAT/NMSQT SOPHOMORE YEAR
Participation Rate 417 139 — — — —
Performance
Critical Reading 396 132 — — — —
Writing 396 132 — — — —
Math 165 55 — — — —
APPENDIX A SCHOOL SAMPLE SIZES FOR FINAL ANALYSES
CH
AP
TE
R 1: T
HE
SP
RIN
GB
OA
RD
NA
TIO
NA
L EFFE
CT
IVE
NE
SS
ST
UD
Y
Increases Among Hispanic Students
Hispanic students in SpringBoard schools actually outperformed similar students from non-SpringBoard schools specifically on AP ELA exams.
21

Unweighted Weighted
Mean Mean
Non-SB SB
Pooled S.D.
Std. Bias Non-SB SB
Pooled S.D.
Std. Bias
ELA AND SS PERFORMANCE RATE .36 .39 .25 .12 .37 .36 .35 -.03
TOTAL ENROLLMENT 1348 1398 877 .06 1362 1361 1214 .00
RACIAL COMPOSITION Asian .06 .06 .11 .00 .06 .06 .15 .00 Black .24 .26 .29 .07 .25 .26 .39 .03 Hispanic .25 .21 .26 -.15 .24 .24 .39 .00 White .41 .42 .33 .03 .41 .39 .46 -.04 Other .05 .05 .10 .00 .05 .04 .14 -.07FRPL .53 .51 .21 -.10 .53 .53 .30 .00
SCHOOL TYPEA
Magnet School .10 .15 .31 .16 .11 .10 .44 -.02
Charter School .01 .01 .09 .00 .01 .02 .16 .06
LOCALEA
City .36 .30 .48 -.13 .35 .36 .68 .01 Suburb .26 .31 .44 .11 .27 .27 .63 .00 Town .07 .09 .26 .08 .07 .07 .37 .00 Rural .31 .30 .46 -.02 .31 .30 .65 -.02
Note. SB = SpringBoard. * indicates statistically significant difference versus non-SB, p < .05A Variables are binary indicators, means represent proportions in the sample.
Unweighted Weighted
Mean Mean
Non-SB SBPooled
S.D.Std. Bias Non-SB SB
Pooled S.D.
Std. Bias
ELA AND SS PARTICIPATION RATE .26 .24 .50 -.04 .25 .24 .56 -.02
TOTAL ENROLLMENT 1322 1354 847 .04 1328 1306 1171 -.02
RACIAL COMPOSITION
Asian .06 .06 .10 .00 .06 .06 .14 .00 Black .22 .26 .28 .14 .24 .25 .38 .03 Hispanic .25 .21 .27 -.15 .24 .25 .39 .03 White .42 .42 .33 .00 .42 .39 .47 -.06 Other .04 .05 .09 .11 .04 .04 .12 .00
FRPL .54 .52 .21 -.10 .54 .55 .30 .03
SCHOOL TYPEA
Magnet School .08 .14* .29 .21 .09 .09 .41 .00
Charter School .01 .02 .12 .08 .01 .02 .18 .06
LOCALEA
City .41 .31 .49 -.20 .39 .42 .69 .04 Suburb .22 .29 .43 .16 .24 .24 .61 .00 Town .05 .09 .24 .17 .06 .06 .33 .00 Rural .31 .31 .46 .00 .31 .29 .65 -.03
Note. SB = SpringBoard. * indicates statistically significant difference versus non-SB, p < .05A Variables are binary indicators, means represent proportions in the sample.
APPENDIX B-1 UNWEIGHTED AND WEIGHTED DESCRIPTIVE STATISTICS AND COVARIATE BALANCE FOR AP ELA AND SOCIAL SCIENCE PARTICIPATION (NON-SB SCHOOLS N = 381, SB SCHOOLS N = 127)
APPENDIX B-2 UNWEIGHTED AND WEIGHTED DESCRIPTIVE STATISTICS AND COVARIATE BALANCE FOR AP ELA AND SOCIAL SCIENCE PERFORMANCE (NON-SB SCHOOLS N = 360, SB SCHOOLS N = 120)
22 | Compendium of Research

Unweighted Weighted
Mean Mean
Non-SB SB
Pooled S.D. Std. Bias Non-SB SB
Pooled S.D.
Std. Bias
ELA AND SS PERFORMANCE RATE—BLACK STUDENTS .31 .31 .25 -.02 .31 .31 .37 .01
TOTAL ENROLLMENT 1481 1497 720 .02 1479 1433 1057 -.04
RACIAL COMPOSITION
Asian .05 .05 .08 .00 .05 .05 .12 .00 Black .28 .31 .25 .12 .29 .29 .35 .00 Hispanic .26 .23 .24 -.13 .25 .26 .36 .03 White .38 .38 .27 .00 .38 .37 .39 -.03 Other .03 .03 .03 .00 .03 .03 .04 .00FRPL .53 .53 .21 .00 .53 .53 .31 .00
SCHOOL TYPEA
Magnet School .10 .17 .33 .21 .12 .11 .45 -.02 Charter School .01 .01 .10 .00 .01 .01 .14 .00
LOCALEA
City .44 .36 .49 -.16 .42 .44 .70 .03 Suburb .27 .31 .45 .09 .28 .26 .63 -.03 Town .03 .04 .19 .05 .04 .03 .26 -.04 Rural .26 .29 .44 .07 .26 .26 .63 .00
Note. SB = SpringBoard. * indicates statistically significant difference versus non-SB, p < .05 A Variables are binary indicators, means represent proportions in the sample.
Unweighted Weighted
Mean Mean
Non-SB SB
Pooled S.D.
Std. Bias Non-SB SB
Pooled S.D.
Std. Bias
ELA AND SS PARTICIPATION RATE—BLACK STUDENTS .16 .17 .12 .13 .16 .16 .17 .02
TOTAL ENROLLMENT 1470 1471 725 .00 1466 1426 1055 -.04
RACIAL COMPOSITION
Asian .05 .05 .07 .00 .05 .05 .11 .00 Black .27 .31 .27 .15 .28 .29 .37 .03 Hispanic .26 .23 .24 -.13 .26 .26 .36 .00 White .39 .39 .29 .00 .39 .36 .41 -.07 Other .03 .03 .03 .00 .03 .03 .05 .00FRPL .54 .53 .22 -.05 .54 .55 .31 .03
SCHOOL TYPEA
Magnet School .10 .17 .32 .22 .12 .12 .46 .00 Charter School .00 .01 .07 .14 .01 .01 .11 .00
LOCALEA
City .46 .36 .50 -.20 .44 .45 .70 .01 Suburb .30 .31 .46 .02 .30 .29 .65 -.02 Town .01 .05* .14 .29 .02 .02 .20 .00 Rural .23 .29 .43 .14 .24 .24 .61 .00
Note. SB = SpringBoard. * indicates statistically significant difference versus non-SB, p < .05 A Variables are binary indicators, means represent proportions in the sample.
APPENDIX B-3 UNWEIGHTED AND WEIGHTED DESCRIPTIVE STATISTICS AND COVARIATE BALANCE FOR AP ELA AND SOCIAL SCIENCE PARTICIPATION—BLACK STUDENTS (NON-SB SCHOOLS N = 324, SB SCHOOLS N = 108)
APPENDIX B-4 UNWEIGHTED AND WEIGHTED DESCRIPTIVE STATISTICS AND COVARIATE BALANCE FOR AP ELA AND SOCIAL SCIENCE PERFORMANCE—BLACK STUDENTS (NON-SB SCHOOLS N = 315, SB SCHOOLS N = 105)
CH
AP
TE
R 1: T
HE
SP
RIN
GB
OA
RD
NA
TIO
NA
L EFFE
CT
IVE
NE
SS
ST
UD
Y
23

Unweighted Weighted
Mean Mean
Non-SB SB
Pooled S.D.
Std. Bias Non-SB SB
Pooled S.D.
Std. Bias
ELA AND SS PERFORMANCE RATE—HISPANIC STUDENTS .35 .36 .27 .04 .35 .35 .38 -.01
TOTAL ENROLLMENT 1465 1534 704 .10 1479 1468 1009 -.01
RACIAL COMPOSITION
Asian .04 .04 .06 .00 .04 .04 .08 .00 Black .27 .30 .26 .12 .28 .29 .36 .03 Hispanic .25 .26 .23 .04 .25 .24 .34 -.03 White .40 .36 .29 -.14 .39 .39 .41 .00 Other .03 .03 .04 .00 .03 .03 .07 .00FRPL .53 .53 .22 .00 .53 .53 .31 .00
SCHOOL TYPEA
Magnet School .11 .18 .33 .21 .12 .12 .47 .00 Charter School .01 .02 .11 .09 .01 .01 .16 .00
LOCALEA
City .40 .37 .49 -.06 .39 .39 .69 .00 Suburb .26 .32 .45 .13 .28 .28 .63 .00 Town .06 .05 .23 -.04 .05 .05 .32 .00 Rural .28 .27 .45 -.02 .28 .28 .63 .00
Note. SB = SpringBoard. * indicates statistically significant difference versus non-SB, p < .05 A Variables are binary indicators, means represent proportions in the sample.
Unweighted Weighted
Mean Mean
Non-SB SBPooled
S.D.Std. Bias Non-SB SB
Pooled S.D.
Std. Bias
ELA AND SS PARTICIPATION RATE—HISPANIC STUDENTS .18 .19 .15 .07 .18 .19 .21 .02
TOTAL ENROLLMENT 1418 1513 761 .12 1443 1432 1072 -.01
RACIAL COMPOSITION
Asian .04 .05 .08 .13 .04 .04 .10 .00 Black .26 .28 .27 .07 .27 .29 .37 .05 Hispanic .29 .26 .27 -.11 .28 .29 .39 .03 White .38 .36 .30 -.07 .37 .35 .42 -.05 Other .03 .04 .06 .17 .03 .03 .08 .00FRPL .55 .52 .21 -.14 .54 .55 .30 .03
SCHOOL TYPEA
Magnet School .12 .17* .34 .15 .14 .13 .48 -.02 Charter School .01 .02 .12 .08 .01 .02 .18 .06
LOCALEA
City .44 .35 .49 -.18 .42 .43 .70 .01 Suburb .23 .33* .43 .23 .25 .26 .62 .02 Town .02 .05 .16 .19 .02 .02 .21 .00 Rural .31 .27 .46 -.09 .30 .28 .64 -.03
Note. SB = SpringBoard. * indicates statistically significant difference versus non-SB, p < .05 A Variables are binary indicators, means represent proportions in the sample.
APPENDIX B-5 UNWEIGHTED AND WEIGHTED DESCRIPTIVE STATISTICS AND COVARIATE BALANCE FOR AP ELA AND SOCIAL SCIENCE PARTICIPATION—HISPANIC STUDENTS (NON-SB SCHOOLS N = 315, SB SCHOOLS N = 105)
APPENDIX B-6 UNWEIGHTED AND WEIGHTED DESCRIPTIVE STATISTICS AND COVARIATE BALANCE FOR AP ELA AND SOCIAL SCIENCE PERFORMANCE— HISPANIC STUDENTS (NON-SB SCHOOLS N = 303, SB SCHOOLS N = 101)
24 | Compendium of Research

Unweighted Weighted
Mean Mean
Non-SB SB
Pooled S.D.
Std. Bias Non-SB SB
Pooled S.D. Std. Bias
ELA PERFORMANCE RATE .40 .43 .27 .11 .41 .40 .38 -.03
TOTAL ENROLLMENT 1389 1415 885 .03 1404 1408 1243 .00
RACIAL COMPOSITION
Asian .05 .06 .10 .10 .06 .06 .14 .00 Black .25 .26 .29 .03 .26 .26 .39 .00 Hispanic .22 .21 .25 -.04 .22 .22 .36 .00 White .43 .42 .33 -.03 .43 .42 .46 -.02 Other .04 .05 .09 .11 .04 .04 .12 .00FRPL .53 .51 .21 -.10 .52 .52 .30 .00
SCHOOL TYPEA
Magnet School .10 .15 .32 .16 .12 .11 .45 -.02 Charter School .00 .01 .07 .14 .00 .00 .10 .00
LOCALEA
City .36 .30 .48 -.13 .35 .35 .68 .00 Suburb .27 .31 .45 .09 .28 .29 .64 .02 Town .06 .08 .24 .08 .06 .06 .34 .00 Rural .31 .31 .46 .00 .31 .30 .65 -.02
Note. SB = SpringBoard. * indicates statistically significant difference versus non-SB, p < .05 A Variables are binary indicators, means represent proportions in the sample.
Unweighted Weighted
Mean Mean
Non-SB SB
Pooled S.D.
Std. Bias Non-SB SB
Pooled S.D.
Std. Bias
ELA PARTICIPATION RATE .19 .19 .28 .00 .19 .18 .33 -.03
TOTAL ENROLLMENT 1404 1373 851 -.04 1400 1388 1185 -.01
RACIAL COMPOSITION
Asian .05 .06 .09 .11 .05 .05 .13 .00 Black .22 .26 .27 .15 .23 .25 .37 .05 Hispanic .27 .22* .27 -.19 .26 .27 .40 .03 White .42 .41 .33 -.03 .41 .39 .46 -.04 Other .04 .05 .08 .13 .04 .04 .11 .00FRPL .54 .52 .21 -.10 .54 .55 .31 .03
SCHOOL TYPEA
Magnet School .10 .15 .31 .16 .11 .11 .44 .00 Charter School .01 .02 .12 .08 .02 .02 .19 .00
LOCALEA
City .41 .31 .49 -.20 .38 .40 .69 .03 Suburb .25 .30 .44 .11 .26 .27 .63 .02 Town .04 .08 .22 .18 .05 .04 .30 -.03 Rural .31 .31 .46 .00 .30 .29 .65 -.02
Note. SB = SpringBoard. * indicates statistically significant difference versus non-SB, p < .05 A Variables are binary indicators, means represent proportions in the sample.
Unweighted Weighted
Mean Mean
Non-SB SB
Pooled S.D.
Std. Bias Non-SB SB
Pooled S.D.
Std. Bias
ELA AND SS PERFORMANCE RATE—HISPANIC STUDENTS .35 .36 .27 .04 .35 .35 .38 -.01
TOTAL ENROLLMENT 1465 1534 704 .10 1479 1468 1009 -.01
RACIAL COMPOSITION
Asian .04 .04 .06 .00 .04 .04 .08 .00 Black .27 .30 .26 .12 .28 .29 .36 .03 Hispanic .25 .26 .23 .04 .25 .24 .34 -.03 White .40 .36 .29 -.14 .39 .39 .41 .00 Other .03 .03 .04 .00 .03 .03 .07 .00FRPL .53 .53 .22 .00 .53 .53 .31 .00
SCHOOL TYPEA
Magnet School .11 .18 .33 .21 .12 .12 .47 .00 Charter School .01 .02 .11 .09 .01 .01 .16 .00
LOCALEA
City .40 .37 .49 -.06 .39 .39 .69 .00 Suburb .26 .32 .45 .13 .28 .28 .63 .00 Town .06 .05 .23 -.04 .05 .05 .32 .00 Rural .28 .27 .45 -.02 .28 .28 .63 .00
Note. SB = SpringBoard. * indicates statistically significant difference versus non-SB, p < .05 A Variables are binary indicators, means represent proportions in the sample.
APPENDIX B-7 UNWEIGHTED AND WEIGHTED DESCRIPTIVE STATISTICS AND COVARIATE BALANCE FOR AP ELA PARTICIPATION (NON-SB COMPARISON SCHOOLS N = 372, SB TREATMENT SCHOOLS N = 124)
APPENDIX B-8 UNWEIGHTED AND WEIGHTED DESCRIPTIVE STATISTICS AND COVARIATE BALANCE FOR AP ELA PERFORMANCE (NON-SB SCHOOLS N = 354, SB SCHOOLS N = 118)
CH
AP
TE
R 1: T
HE
SP
RIN
GB
OA
RD
NA
TIO
NA
L EFFE
CT
IVE
NE
SS
ST
UD
Y
25

Unweighted Weighted
Mean Mean
Non-SB SBPooled
S.D.Std. Bias Non-SB SB
Pooled S.D. Std. Bias
ELA PERFORMANCE RATE—BLACK STUDENTS .31 .31 .26 -.01 .31 .30 .38 -.01
TOTAL ENROLLMENT 1610 1523 780 -.11 1582 1555 1114 -.02
RACIAL COMPOSITION
Asian .04 .05 .07 .14 .05 .05 .10 .00 Black .28 .32 .23 .17 .29 .29 .33 .00 Hispanic .26 .24 .23 -.09 .26 .26 .35 .00 White .38 .36 .25 -.08 .38 .37 .37 -.03 Other .03 .03 .03 .00 .03 .03 .04 .00FRPL .53 .54 .21 .05 .53 .53 .30 .00
SCHOOL TYPEA
Magnet School .09 .18* .31 .29 .11 .10 .44 -.02 Charter School .00 .01 .05 .20 .00 .00 .05 .00
LOCALEA
City .43 .38 .49 -.10 .42 .42 .70 .00 Suburb .26 .31 .44 .11 .27 .25 .62 -.03 Town .03 .03 .16 .00 .03 .03 .23 .00 Rural .29 .27 .45 -.04 .29 .30 .64 .02
Note. SB = SpringBoard. * indicates statistically significant difference versus non-SB, p < .05 A Variables are binary indicators, means represent proportions in the sample.
APPENDIX B-9 UNWEIGHTED AND WEIGHTED DESCRIPTIVE STATISTICS AND COVARIATE BALANCE FOR AP ELA PARTICIPATION—BLACK STUDENTS (NON-SB SCHOOLS N = 318, SB SCHOOLS N = 106)
APPENDIX B-10 UNWEIGHTED AND WEIGHTED DESCRIPTIVE STATISTICS AND COVARIATE BALANCE FOR AP ELA PERFORMANCE—BLACK STUDENTS (NON-SB SCHOOLS N = 297, SB SCHOOLS N = 99)
Unweighted Weighted
Mean Mean
Non-SB SBPooled
S.D.Std. Bias Non-SB SB
Pooled S.D.
Std. Bias
ELA PARTICIPATION RATE—BLACK STUDENTS .13 .13 .11 .03 .13 .13 .16 .03
TOTAL ENROLLMENT 1490 1494 711 .01 1491 1441 1036 -.05
RACIAL COMPOSITION
Asian .04 .05 .07 .14 .04 .04 .10 .00 Black .27 .30 .27 .11 .28 .30 .37 .05 Hispanic .28 .23 .25 -.20 .26 .28 .37 .05 White .39 .39 .29 .00 .38 .36 .42 -.05 Other .02 .03 .03 .33 .02 .02 .04 .00FRPL .54 .53 .22 -.05 .53 .55 .31 .06
SCHOOL TYPEA
Magnet School .09 .17* .32 .25 .11 .11 .44 .00 Charter School .00 .01 .05 .20 .00 .00 .05 .00
LOCALEA
City .48 .36* .50 -.24 .45 .47 .71 .03 Suburb .28 .31 .45 .07 .29 .28 .64 -.02 Town .01 .04* .12 .25 .01 .01 .17 .00 Rural .24 .29 .43 .12 .25 .24 .61 -.02
Note. SB = SpringBoard. * indicates statistically significant difference versus non-SB, p < .05 A Variables are binary indicators, means represent proportions in the sample.
26 | Compendium of Research

CH
AP
TE
R 1: T
HE
SP
RIN
GB
OA
RD
NA
TIO
NA
L EFFE
CT
IVE
NE
SS
ST
UD
Y
Unweighted Weighted
Mean Mean
Non-SB SBPooled
S.D.Std. Bias Non-SB SB
Pooled S.D. Std. Bias
ELA PERFORMANCE RATE—BLACK STUDENTS .31 .31 .26 -.01 .31 .30 .38 -.01
TOTAL ENROLLMENT 1610 1523 780 -.11 1582 1555 1114 -.02
RACIAL COMPOSITION
Asian .04 .05 .07 .14 .05 .05 .10 .00 Black .28 .32 .23 .17 .29 .29 .33 .00 Hispanic .26 .24 .23 -.09 .26 .26 .35 .00 White .38 .36 .25 -.08 .38 .37 .37 -.03 Other .03 .03 .03 .00 .03 .03 .04 .00FRPL .53 .54 .21 .05 .53 .53 .30 .00
SCHOOL TYPEA
Magnet School .09 .18* .31 .29 .11 .10 .44 -.02 Charter School .00 .01 .05 .20 .00 .00 .05 .00
LOCALEA
City .43 .38 .49 -.10 .42 .42 .70 .00 Suburb .26 .31 .44 .11 .27 .25 .62 -.03 Town .03 .03 .16 .00 .03 .03 .23 .00 Rural .29 .27 .45 -.04 .29 .30 .64 .02
Note. SB = SpringBoard. * indicates statistically significant difference versus non-SB, p < .05 A Variables are binary indicators, means represent proportions in the sample.
APPENDIX B-11 UNWEIGHTED AND WEIGHTED DESCRIPTIVE STATISTICS AND COVARIATE BALANCE FOR AP ELA PARTICIPATION—HISPANIC STUDENTS (NON-SB SCHOOLS N = 315, SB SCHOOLS N = 105)
Unweighted Weighted
Mean Mean
Non-SB SBPooled
S.D.Std. Bias Non-SB SB
Pooled S.D.
Std. Bias
ELA PARTICIPATION RATE—HISPANIC STUDENTS .18 .19 .15 .07 .18 .19 .21 .02
TOTAL ENROLLMENT 1418 1513 761 .12 1443 1432 1072 -.01
RACIAL COMPOSITION
Asian .04 .05 .08 .13 .04 .04 .10 .00 Black .26 .28 .27 .07 .27 .29 .37 .05 Hispanic .29 .26 .27 -.11 .28 .29 .39 .03 White .38 .36 .30 -.07 .37 .35 .42 -.05 Other .03 .04 .06 .17 .03 .03 .08 .00FRPL .55 .52 .21 -.14 .54 .55 .30 .03
SCHOOL TYPEA
Magnet School .12 .17 .34 .15 .14 .13 .48 -.02 Charter School .01 .02 .12 .08 .01 .02 .18 .06
LOCALEA
City .44 .35 .49 -.18 .42 .43 .70 .01 Suburb .23 .33* .43 .23 .25 .26 .62 .02 Town .02 .05 .16 .19 .02 .02 .21 .00 Rural .31 .27 .46 -.09 .30 .28 .64 -.03
Note. SB = SpringBoard. * indicates statistically significant difference versus non-SB, p < .05 A Variables are binary indicators, means represent proportions in the sample.
Unweighted Weighted
Mean Mean
Non-SB SBPooled
S.D.Std. Bias Non-SB SB
Pooled S.D.
Std. Bias
ELA PERFORMANCE RATE—HISPANIC STUDENTS .36 .39 .28 .08 .37 .37 .41 .00
TOTAL ENROLLMENT 1517 1549 735 .04 1527 1537 1056 .01
RACIAL COMPOSITION w
Asian .04 .05 .06 .17 .04 .04 .08 .00 Black .28 .30 .25 .08 .29 .29 .35 .00 Hispanic .28 .26 .24 -.08 .27 .27 .35 .00 White .37 .36 .27 -.04 .37 .36 .39 -.03 Other .03 .03 .04 .00 .03 .03 .06 .00FRPL .54 .53 .21 -.05 .54 .54 .30 .00
SCHOOL TYPEA
Magnet School .12 .18 .35 .17 .14 .14 .49 .00 Charter School .00 .02 .09 .22 .01 .01 .12 .00
LOCALEA
City .34 .37 .48 .06 .35 .36 .68 .01 Suburb .32 .32 .47 .00 .32 .32 .66 .00 Town .05 .04 .21 -.05 .04 .04 .28 .00 Rural .29 .26 .45 -.07 .28 .28 .64 .00
Note. SB = SpringBoard. * indicates statistically significant difference versus non-SB, p < .05 A Variables are binary indicators, means represent proportions in the sample.
APPENDIX B-12 UNWEIGHTED AND WEIGHTED DESCRIPTIVE STATISTICS AND COVARIATE BALANCE FOR AP ELA PERFORMANCE—HISPANIC STUDENTS (NON-SB SCHOOLS N = 297, SB SCHOOLS N = 99)
27

APPENDIX B-13 UNWEIGHTED AND WEIGHTED DESCRIPTIVE STATISTICS AND COVARIATE BALANCE FOR AP MATH PARTICIPATION (NON-SB SCHOOLS N = 138, SB SCHOOLS N = 46)
Unweighted Weighted
Mean Mean
Non-SB SBPooled
S.D.Std. Bias Non-SB SB
Pooled S.D. Std. Bias
MATH PARTICIPATION RATE .09 .09 .08 .00 .09 .09 .10 .00
TOTAL ENROLLMENT 1343 1394 941 .05 1367 1404 1274 .03
RACIAL COMPOSITION
Asian .03 .06 .09 .33 .04 .04 .12 .00 Black .12 .19* .17 .41 .14 .12 .23 -.09 Hispanic .39 .29* .29 -.34 .38 .48 .50 .20 White .39 .40 .27 .04 .39 .31 .42 -.19 Other .06 .06 .12 .00 .06 .05 .16 -.06FRPL .49 .51 .19 .11 .50 .51 .27 .04
SCHOOL TYPEA
Magnet School .07 .09 .26 .08 .07 .05 .34 -.06 Charter School — — — — — — — —
LOCALEA
City .22 .20 .41 -.05 .22 .24 .61 .03 Suburb .18 .30 .41 .29 .21 .21 .59 .00 Town .14 .13 .34 -.03 .14 .11 .48 -.06 Rural .46 .37 .50 -.18 .44 .44 .72 .00
Note. SB = SpringBoard. * indicates statistically significant difference versus non-SB, p < .05 A Variables are binary indicators, means represent proportions in the sample.
Unweighted Weighted
Mean Mean
Non-SB SBPooled
S.D.Std. Bias Non-SB SB
Pooled S.D. Std. Bias
MATH PERFORMANCE RATE .30 .27 .23 -.13 .29 .24 .32 -.16
TOTAL ENROLLMENT 1575 1429 849 -.17 1544 1541 1205 .00
RACIAL COMPOSITION
Asian .06 .06 .13 .00 .06 .07 .19 .05 Black .12 .18* .15 .40 .13 .11 .21 -.10 Hispanic .40 .30 .31 -.32 .39 .49 .50 .20 White .35 .40 .26 .19 .36 .28 .41 -.20 Other .06 .05 .13 -.08 .06 .05 .17 -.06FRPL .48 .50 .19 .11 .49 .51 .27 .07
SCHOOL TYPEA
Magnet School .08 .09 .27 .04 .08 .05 .36 -.08 Charter School — — — — — — — —
LOCALEA
City .28 .18 .44 -.23 .26 .31 .66 .08 Suburb .27 .32 .45 .11 .27 .24 .64 -.05 Town .11 .14 .32 .09 .11 .08 .43 -.07 Rural .35 .36 .48 .02 .36 .37 .70 .01
Note. SB = SpringBoard. * indicates statistically significant difference versus non-SB, p < .05 A Variables are binary indicators, means represent proportions in the sample.
APPENDIX B-14 UNWEIGHTED AND WEIGHTED DESCRIPTIVE STATISTICS AND COVARIATE BALANCE FOR AP MATH PERFORMANCE (NON-SB SCHOOLS N = 132, SB SCHOOLS N = 44)
28 | Compendium of Research

Unweighted Weighted
Mean Mean
Non-SB SBPooled
S.D.Std. Bias Non-SB SB
Pooled S.D.
Std. Bias
SAT SCORE 140.10 138.50 19.60 -.08 139.62 138.78 27.75 -.03
TOTAL ENROLLMENT 1309 1288 797 -.03 1303 1247 1127 -.05
RACIAL COMPOSITION
Asian .05 .05 .10 .00 .05 .05 .14 .00 Black .24 .26 .29 .07 .25 .26 .40 .03 Hispanic .27 .22 .28 -.18 .25 .26 .40 .03 White .39 .41 .32 .06 .40 .38 .46 -.04 Other .04 .05 .11 .09 .05 .04 .15 -.07FRPL .54 .52 .22 -.09 .53 .54 .31 .03
SCHOOL TYPEA
Magnet School .07 .13* .28 .21 .09 .09 .41 .00 Charter School .00 .02* .07 .29 .00 .01 .07 .14
LOCALEA
City .42 .32* .49 -.20 .39 .40 .69 .01 Suburb .24 .28 .43 .09 .25 .26 .62 .02 Town .08 .09 .27 .04 .08 .08 .38 .00 Rural .26 .31 .45 .11 .27 .27 .63 .00
Note. SB = SpringBoard. * indicates statistically significant difference versus non-SB, p < .05 A Variables are binary indicators, means represent proportions in the sample.
APPENDIX B-15 UNWEIGHTED AND WEIGHTED DESCRIPTIVE STATISTICS AND COVARIATE BALANCE FOR SAT PARTICIPATION (NON-SB SCHOOLS N = 420, SB SCHOOLS N = 140)
APPENDIX B-16 UNWEIGHTED AND WEIGHTED DESCRIPTIVE STATISTICS AND COVARIATE BALANCE FOR SAT PERFORMANCE (NON-SB SCHOOLS N = 420, SB SCHOOLS N = 140)
Unweighted Weighted
Mean Mean
Non-SB SBPooled
S.D.Std. Bias Non-SB SB
Pooled S.D.
Std. Bias
SAT PARTICIPATION RATE .38 .51* .28 .46 .48 .40 .53 -.15
TOTAL ENROLLMENT 1342 1288 826 -.07 1286 1355 1198 .06
RACIAL COMPOSITION
Asian .05 .05 .10 .00 .05 .05 .14 .00 Black .21 .26 .28 .18 .22 .23 .39 .03 Hispanic .28 .22* .28 -.21 .25 .31 .42 .14 White .40 .41 .32 .03 .42 .37 .47 -.11 Other .05 .05 .11 .00 .05 .04 .16 -.06FRPL .54 .52 .22 -.09 .53 .54 .30 .03
SCHOOL TYPEA
Magnet School .07 .13* .28 .21 .09 .08 .40 -.03 Charter School .00 .02* .07 .29 .00 .01 .07 .14
LOCALEA
City .41 .32 .49 -.18 .37 .43 .71 .08 Suburb .23 .28 .43 .12 .24 .23 .61 -.02 Town .07 .09 .27 .07 .07 .06 .36 -.03 Rural .29 .31 .46 .04 .32 .28 .66 -.06
Note. SB = SpringBoard. * indicates statistically significant difference versus non-SB, p < .05 A Variables are binary indicators, means represent proportions in the sample.
CH
AP
TE
R 1: T
HE
SP
RIN
GB
OA
RD
NA
TIO
NA
L EFFE
CT
IVE
NE
SS
ST
UD
Y
29

Unweighted Weighted
Mean Mean
Non-SB SBPooled
S.D.Std. Bias Non-SB SB
Pooled S.D. Std. Bias
SAT CRITICAL READING SCORE 47.15 46.22 6.84 -.14 46.89 46.58 9.58 -.03
TOTAL ENROLLMENT 1330 1313 816 -.02 1329 1298 1153 -.03
RACIAL COMPOSITION
Asian .05 .06 .10 .10 .06 .06 .14 .00 Black .24 .27 .29 .10 .25 .26 .40 .03 Hispanic .27 .22 .28 -.18 .26 .26 .40 .00 White .39 .40 .32 .03 .39 .37 .45 -.04 Other .04 .05 .10 .10 .04 .04 .13 .00FRPL .55 .52 .21 -.14 .54 .55 .30 .03
SCHOOL TYPEA
Magnet School .09 .14 .31 .16 .11 .12 .45 .02 Charter School .00 .02* .06 .33 .00 .00 .06 .00
LOCALEA
City .40 .33 .49 -.14 .38 .39 .69 .01 Suburb .26 .29 .44 .07 .28 .30 .64 .03 Town .07 .09 .27 .07 .07 .06 .36 -.03 Rural .26 .29 .44 .07 .27 .26 .62 -.02
Note. SB = SpringBoard. * indicates statistically significant difference versus non-SB, p < .05 A Variables are binary indicators, means represent proportions in the sample.
Unweighted Weighted
Mean Mean
Non-SB SBPooled
S.D.Std. Bias Non-SB SB
Pooled S.D. Std. Bias
SAT WRITING SCORE 45.23 44.80 6.40 -.07 45.09 44.75 8.98 -.04
TOTAL ENROLLMENT 1292 1313 799 .03 1298 1268 1134 -.03
RACIAL COMPOSITION
Asian .06 .06 .10 .00 .06 .06 .15 .00 Black .23 .27 .29 .14 .25 .26 .40 .03 Hispanic .27 .22 .27 -.19 .26 .27 .40 .03 White .39 .40 .32 .03 .39 .36 .45 -.07 Other .05 .05 .11 .00 .05 .04 .15 -.07FRPL .55 .52 .21 -.14 .54 .55 .30 .03
SCHOOL TYPEA
Magnet School .09 .14 .30 .17 .11 .11 .44 .00 Charter School .00 .02* .06 .33 .00 .00 .06 .00
LOCALEA
City .41 .33 .49 -.16 .39 .40 .69 .01 Suburb .25 .29 .44 .09 .27 .29 .63 .03 Town .07 .09 .26 .08 .07 .07 .36 .00 Rural .27 .29 .45 .04 .27 .25 .62 -.03
Note. SB = SpringBoard. * indicates statistically significant difference versus non-SB, p < .05 A Variables are binary indicators, means represent proportions in the sample.
APPENDIX B-18 UNWEIGHTED AND WEIGHTED DESCRIPTIVE STATISTICS AND COVARIATE BALANCE FOR SAT WRITING PERFORMANCE (NON-SB SCHOOLS N = 393, SB SCHOOLS N = 131)
APPENDIX B-17 UNWEIGHTED AND WEIGHTED DESCRIPTIVE STATISTICS AND COVARIATE BALANCE FOR SAT CRITICAL READING PERFORMANCE (NON-SB SCHOOLS N = 393, SB SCHOOLS N = 131)
30 | Compendium of Research

Unweighted Weighted
Mean Mean
Non-SB SBPooled
S.D.Std. Bias Non-SB SB
Pooled S.D.
Std. Bias
SAT MATH SCORE 46.61 46.35 4.98 -.05 46.46 46.18 7.25 -.04
TOTAL ENROLLMENT 963 1245* 854 .33 1045 1136 1156 .08
RACIAL COMPOSITION
Asian .05 .08 .14 .21 .06 .07 .20 .05 Black .15 .20 .23 .22 .17 .19 .34 .06 Hispanic .36 .30 .31 -.19 .34 .36 .47 .04 White .35 .34 .30 -.03 .34 .30 .43 -.09 Other .09 .09 .21 .00 .09 .07 .26 -.08FRPL .58 .54 .20 -.20 .57 .57 .28 .00
SCHOOL TYPEA
Magnet School .05 .07 .24 .08 .06 .06 .33 .00 Charter School .01 .02 .12 .08 .01 .01 .16 .00
LOCALEA
City .22 .25 .42 .07 .23 .26 .61 .05 Suburb .15 .29* .39 .36 .19 .22 .57 .05 Town .10 .15 .32 .16 .11 .10 .43 -.02 Rural .53 .31* .50 -.44 .47 .42 .70 -.07
Note. SB = SpringBoard. * indicates statistically significant difference versus non-SB, p < .05 A Variables are binary indicators, means represent proportions in the sample.
Unweighted Weighted
Mean Mean
Non-SB SBPooled
S.D.Std. Bias Non-SB SB
Pooled S.D. Std. Bias
PSAT/NMSQT PARTICIPATION— JUNIOR YEAR
.52 .50 .55 -.04 .52 .53 .69 .01
TOTAL ENROLLMENT 1334 1286 911 -.05 1333 1321 1312 -.01
RACIAL COMPOSITION
Asian .05 .05 .08 .00 .05 .05 .12 .00 Black .21 .27* .28 .21 .23 .25 .39 .05 Hispanic .28 .22* .29 -.21 .27 .27 .41 .00 White .41 .41 .32 .00 .41 .39 .46 -.04 Other .04 .04 .10 .00 .04 .04 .13 .00FRPL .53 .52 .22 -.05 .53 .53 .31 .00
SCHOOL TYPEA
Magnet School .06 .13* .27 .26 .08 .08 .38 .00 Charter School .01 .02 .10 .10 .01 .01 .15 .00
LOCALEA
City .42 .33 .49 -.18 .40 .40 .69 .00 Suburb .24 .28 .44 .09 .26 .26 .62 .00 Town .05 .09 .24 .17 .06 .06 .33 .00 Rural .28 .30 .45 .04 .29 .28 .64 -.02
Note. SB = SpringBoard. * indicates statistically significant difference versus non-SB, p < .05 A Variables are binary indicators, means represent proportions in the sample.
CH
AP
TE
R 1: T
HE
SP
RIN
GB
OA
RD
NA
TIO
NA
L EFFE
CT
IVE
NE
SS
ST
UD
Y
APPENDIX B-20 UNWEIGHTED AND WEIGHTED DESCRIPTIVE STATISTICS AND COVARIATE BALANCE FOR PSAT/NMSQT JUNIOR YEAR PARTICIPATION (NON-SB SCHOOLS N = 423, SB SCHOOLS N = 141)
APPENDIX B-19 UNWEIGHTED AND WEIGHTED DESCRIPTIVE STATISTICS AND COVARIATE BALANCE FOR SAT MATH PERFORMANCE (NON-SB SCHOOLS N = 165, SB SCHOOLS N = 55)
31

Unweighted Weighted
Mean Mean
Non-SB SBPooled
S.D.Std. Bias Non-SB SB
Pooled S.D.
Std. Bias
PSAT/NMSQT WRITING SCORE—JUNIORS 42.01 42.56 5.63 .10 42.07 41.76 8.22 -.04
TOTAL ENROLLMENT 1265 1304 964 .04 1273 1268 1285 .00
RACIAL COMPOSITION
Asian .04 .05 .08 .13 .05 .04 .12 -.08 Black .24 .27 .30 .10 .26 .27 .41 .02 Hispanic .25 .22 .28 -.11 .24 .24 .40 .00 White .42 .41 .34 -.03 .41 .40 .48 -.02 Other .04 .04 .08 .00 .04 .04 .11 .00FRPL .55 .52 .21 -.14 .55 .55 .30 .00
SCHOOL TYPEA
Magnet School .05 .13* .26 .31 .07 .07 .36 .00 Charter School .01 .01 .12 .00 .02 .02 .19 .00
LOCALEA
City .41 .33 .49 -.16 .39 .39 .69 .00 Suburb .22 .29 .43 .16 .24 .24 .60 .00 Town .05 .08 .24 .13 .06 .06 .33 .00 Rural .32 .30 .47 -.04 .31 .31 .66 .00
Note. SB = SpringBoard. * indicates statistically significant difference versus non-SB, p < .05 A Variables are binary indicators, means represent proportions in the sample.
APPENDIX B-21 UNWEIGHTED AND WEIGHTED DESCRIPTIVE STATISTICS AND COVARIATE BALANCE FOR PSAT/NMSQT JUNIOR YEAR CRITICAL READING PERFORMANCE (NON-SB SCHOOLS N = 402, SB SCHOOLS N = 134)
Unweighted Weighted
Mean Mean
Non-SB SBPooled
S.D.Std. Bias Non-SB SB
Pooled S.D. Std. Bias
PSAT/NMSQT CRITICAL READING SCORE—JUNIORS 44.15 44.19 6.14 .01 44.13 43.97 8.88 -.02
TOTAL ENROLLMENT 1281 1304 885 .03 1296 1324 1251 .02
RACIAL COMPOSITION
Asian .05 .05 .09 .00 .05 .05 .13 .00 Black .23 .27 .28 .14 .25 .26 .40 .03 Hispanic .25 .22 .27 -.11 .24 .24 .38 .00 White .43 .41 .33 -.06 .42 .41 .47 -.02 Other .04 .04 .09 .00 .04 .04 .12 .00FRPL .54 .52 .21 -.10 .54 .54 .29 .00
SCHOOL TYPEA
Magnet School .08 .13 .30 .17 .10 .10 .43 .00 Charter School .00 .01 .09 .11 .01 .01 .13 .00
LOCALEA
City .39 .33 .48 -.13 .37 .36 .68 -.01 Suburb .24 .29 .43 .12 .25 .27 .62 .03 Town .05 .08 .23 .13 .06 .05 .32 -.03 Rural .33 .30 .47 -.06 .32 .31 .66 -.02
Note. SB = SpringBoard. * indicates statistically significant difference versus non-SB, p < .05 A Variables are binary indicators, means represent proportions in the sample.
APPENDIX B-22 UNWEIGHTED AND WEIGHTED DESCRIPTIVE STATISTICS AND COVARIATE BALANCE FOR PSAT/NMSQT JUNIOR YEAR WRITING PERFORMANCE (NON-SB SCHOOLS N = 402, SB SCHOOLS N = 134)
32 | Compendium of Research

Unweighted Weighted
Mean Mean
Non-SB SB Pooled S.D.
Std. Bias
Non-SB SB Pooled S.D.
Std. Bias
PSAT/NMSQT PARTICIPATION— SOPHOMORE YEAR .53 .66* .51 .25 .69 .62 1.08 -.06
TOTAL ENROLLMENT 1302 1290 839 -.01 1281 1280 1167 .00
RACIAL COMPOSITION
Asian .05 .05 .09 .00 .06 .05 .13 -.08 Black .25 .27 .30 .07 .25 .26 .41 .02 Hispanic .27 .22 .28 -.18 .25 .26 .39 .03 White .39 .41 .32 .06 .40 .39 .46 -.02 Other .04 .04 .09 .00 .04 .04 .12 .00FRPL .56 .52 .22 -.18 .54 .55 .31 .03
SCHOOL TYPEA
Magnet School .06 .13* .27 .26 .08 .08 .39 .00 Charter School .00 .02* .08 .25 .02 .01 .17 -.06
LOCALEA
City .42 .32* .49 -.20 .38 .38 .69 .00 Suburb .23 .29 .43 .14 .26 .26 .62 .00 Town .06 .08 .25 .08 .08 .06 .36 -.06 Rural .29 .31 .46 .04 .28 .30 .64 .03
Note. SB = SpringBoard. * indicates statistically significant difference versus non-SB, p < .05 A Variables are binary indicators, means represent proportions in the sample.
APPENDIX B-23 UNWEIGHTED AND WEIGHTED DESCRIPTIVE STATISTICS AND COVARIATE BALANCE FOR PSAT/NMSQT JUNIOR YEAR WRITING PERFORMANCE (NON-SB SCHOOLS N = 402, SB SCHOOLS N = 134)
APPENDIX B-24 UNWEIGHTED AND WEIGHTED DESCRIPTIVE STATISTICS AND COVARIATE BALANCE FOR PSAT/NMSQT SOPHOMORE YEAR MATH PERFORMANCE (NON-SB SCHOOLS N = 171, SB SCHOOLS N = 57)
Unweighted Weighted
Mean Mean
Non-SB SBPooled
S.D.Std. Bias Non-SB SB
Pooled S.D.
Std. Bias
PSAT/NMSQT MATH SCORE—JUNIORS 45.36 44.83 5.71 -.09 45.10 45.21 8.37 .01
TOTAL ENROLLMENT 1086 1239 791 .19 1130 1135 1088 .00
RACIAL COMPOSITION
Asian .06 .07 .15 .07 .06 .06 .20 .00 Black .15 .22 .24 .29 .17 .19 .34 .06 Hispanic .34 .30 .34 -.12 .33 .34 .48 .02 White .39 .35 .35 -.11 .37 .34 .48 -.06 Other .06 .06 .13 .00 .06 .06 .18 .00FRPL .58 .55 .20 -.15 .58 .58 .28 .00
SCHOOL TYPEA
Magnet School .04 .07 .21 .14 .05 .05 .30 .00 Charter School .01 .02 .09 .11 .01 .02 .17 .06
LOCALEA
City .30 .28 .46 -.04 .30 .31 .65 .02 Suburb .20 .28 .42 .19 .23 .28 .61 .08 Town .11 .12 .32 .03 .11 .10 .43 -.02 Rural .38 .32 .48 -.13 .36 .31 .66 -.08
Note. SB = SpringBoard. * indicates statistically significant difference versus non-SB, p < .05 A Variables are binary indicators, means represent proportions in the sample.
CH
AP
TE
R 1: T
HE
SP
RIN
GB
OA
RD
NA
TIO
NA
L EFFE
CT
IVE
NE
SS
ST
UD
Y
33

Unweighted Weighted
Mean Mean
Non-SB SBPooled
S.D.Std. Bias Non-SB SB
Pooled S.D.
Std. Bias
PSAT/NMSQT WRITING SCORE—SOPHOMORES 39.60 39.12 5.77 -.08 39.48 39.94 8.62 .05
TOTAL ENROLLMENT 1200 1303 806 .13 1222 1196 1120 -.02
RACIAL COMPOSITION
Asian .05 .05 .10 .00 .05 .05 .14 .00 Black .27 .27 .31 .00 .28 .28 .42 .00 Hispanic .24 .22 .27 -.07 .23 .23 .38 .00 White .40 .40 .33 .00 .39 .40 .48 .02 Other .04 .04 .09 .00 .04 .04 .12 .00FRPL .56 .52 .21 -.19 .55 .56 .30 .03
SCHOOL TYPEA
Magnet School .09 .14 .30 .17 .10 .10 .43 .00 Charter School .00 .02 .08 .25 .01 .01 .11 .00
LOCALEA
City .36 .33 .48 -.06 .36 .35 .68 -.01 Suburb .24 .29 .44 .11 .25 .27 .63 .03 Town .07 .08 .25 .04 .07 .07 .36 .00 Rural .33 .31 .47 -.04 .32 .32 .66 .00
Note. SB = SpringBoard. * indicates statistically significant difference versus non-SB, p < .05 A Variables are binary indicators, means represent proportions in the sample.
APPENDIX B-25 UNWEIGHTED AND WEIGHTED DESCRIPTIVE STATISTICS AND COVARIATE BALANCE FOR PSAT/NMSQT JUNIOR YEAR CRITICAL READING PERFORMANCE (NON-SB SCHOOLS N = 396, SB SCHOOLS N = 132)
APPENDIX B-26 UNWEIGHTED AND WEIGHTED DESCRIPTIVE STATISTICS AND COVARIATE BALANCE FOR PSAT/NMSQT SOPHOMORE YEAR WRITING PERFORMANCE (NON-SB SCHOOLS N = 396, SB SCHOOLS N = 132)
Unweighted Weighted
Mean Mean
Non-SB SBPooled
S.D.Std. Bias Non-SB SB
Pooled S.D. Std. Bias
PSAT/NMSQT CRITICAL READING SCORE—JUNIORS 40.67 40.09 6.46 -.09 40.53 40.80 9.44 .03
TOTAL ENROLLMENT 1209 1303 831 .11 1235 1223 1153 -.01
RACIAL COMPOSITION
Asian .04 .05 .08 .13 .04 .04 .12 .00 Black .25 .27 .29 .07 .26 .28 .41 .05 Hispanic .28 .22 .28 -.21 .26 .26 .40 .00 White .39 .40 .32 .03 .39 .39 .47 .00 Other .04 .04 .09 .00 .04 .03 .11 -.09FRPL .57 .52* .21 -.24 .56 .57 .30 .03
SCHOOL TYPEA
Magnet School .09 .14 .30 .17 .11 .10 .43 -.02 Charter School .00 .02* .06 .33 .00 .00 .06 .00
LOCALEA
City .37 .33 .48 -.08 .36 .37 .68 .01 Suburb .20 .29* .42 .21 .23 .25 .60 .03 Town .06 .08 .25 .08 .06 .05 .33 -.03 Rural .36 .31 .48 -.10 .35 .33 .67 -.03
Note. SB = SpringBoard. * indicates statistically significant difference versus non-SB, p < .05 A Variables are binary indicators, means represent proportions in the sample.
34 | Compendium of Research

CH
AP
TE
R 1: T
HE
SP
RIN
GB
OA
RD
NA
TIO
NA
L EFFE
CT
IVE
NE
SS
ST
UD
Y
Unweighted Weighted
Mean Mean
Non-SB SBPooled
S.D.Std. Bias Non-SB SB
Pooled S.D.
Std. Bias
PSAT/NMSQT MATH SCORE— SOPHOMORES 42.71 41.15 5.98 -.26 42.27 42.52 8.67 .03
TOTAL ENROLLMENT 1125 1268 863 .17 1170 1216 1192 .04
RACIAL COMPOSITION
Asian .05 .07 .13 .15 .06 .06 .19 .00 Black .16 .21 .23 .22 .17 .17 .32 .00 Hispanic .35 .30 .32 -.16 .34 .37 .49 .06 White .37 .34 .32 -.09 .36 .34 .46 -.04 Other .07 .07 .14 .00 .07 .06 .18 -.06FRPL .58 .55 .20 -.15 .57 .57 .28 .00
SCHOOL TYPEA
Magnet School .04 .07 .22 .14 .05 .05 .31 .00 Charter School — — — — — — — —
LOCALEA
City .24 .25 .43 .02 .25 .22 .60 -.05 Suburb .19 .29 .41 .24 .22 .27 .61 .08 Town .12 .11 .32 -.03 .11 .08 .42 -.07 Rural .45 .35 .50 -.20 .43 .42 .70 -.01
Note. SB = SpringBoard. * indicates statistically significant difference versus non-SB, p < .05 A Variables are binary indicators, means represent proportions in the sample.
APPENDIX B-27 UNWEIGHTED AND WEIGHTED DESCRIPTIVE STATISTICS AND COVARIATE BALANCE FOR PSAT/NMSQT SOPHOMORE YEAR MATH PERFORMANCE (NON-SB SCHOOLS N = 165, SB SCHOOLS N = 55)
35

APPENDIX C SUMMARY OF DIFFERENCE-IN-DIFFERENCES MODEL PARAMETERS AND EFFECT SIZES FOR AP ANALYSES
Overall Black Students Hispanic StudentsOutcome b SE t d b SE t d b SE t d 1
ELA AND SS - PARTICIPATION
Baseline -1.056 2.848 -0.371 -0.03 0.511 1.303 0.392 0.05 1.369 1.877 0.729 0.11
Year 1 6.179* 2.622 2.356 0.24 -0.408 1.347 -0.303 -0.15 2.271 2.130 1.067 0.53
Year 2 7.183* 2.688 2.672 0.27 1.896 1.602 1.184 0.26 4.227* 1.922 2.199 0.75
Year 3 7.685* 2.781 2.764 0.29 1.642 1.646 0.998 0.19 4.781* 2.338 2.045 0.53
ELA AND SS - PERFORMANCE
Baseline -0.238 1.774 -0.134 -0.02 0.058 2.095 0.028 0.00 -0.434 2.304 -0.188 -0.03
Year 1 0.437 1.154 0.378 0.09 4.297 3.006 1.430 0.67 -0.676 3.053 -0.221 -0.22
Year 2 -0.403 1.345 -0.299 -0.06 2.769 3.294 0.841 0.26 1.818 3.005 0.605 0.34
Year 3 0.412 1.494 0.276 0.05 3.823 3.075 1.243 0.59 2.905 2.820 1.030 0.54
ELA ONLY - PARTICIPATION
Baseline 0.001 1.892 0.000 0.00 -0.071 1.151 -0.062 -0.01 0.980 1.626 0.603 0.09
Year 1 2.324 1.617 1.437 0.20 0.188 1.218 0.154 0.09 -0.338 1.657 -0.204 -0.09
Year 2 4.247* 1.891 2.246 0.35 3.637* 1.760 2.066 0.40 3.942* 1.815 2.172 0.60
Year 3 3.860* 1.915 2.016 0.33 1.823 1.607 1.134 0.22 3.389 2.127 1.593 0.35
ELA ONLY - PERFORMANCE
Baseline -0.452 1.847 -0.245 -0.03 -0.075 2.380 -0.032 -0.01 -0.354 2.527 -0.140 -0.02
Year 1 0.445 1.389 0.320 0.07 3.716 3.131 1.187 0.41 -1.341 3.004 -0.446 -0.45
Year 2 -1.761 1.540 -1.144 -0.23 4.208 3.086 1.364 0.52 1.014 2.967 0.342 0.30
Year 3 -0.823 1.662 -0.495 -0.08 0.479 4.081 0.117 0.03 6.950* 3.222 2.157 1.08
MATH - PARTICIPATION
Baseline -0.378 1.088 -0.347 -0.06 — — — — — — — —
Year 1 -0.275 0.666 -0.413 -0.12 — — — — — — — —
Year 2 1.075 1.007 1.068 0.27 — — — — — — — —
Year 3 0.608 1.071 0.568 0.14 — — — — — — — —
MATH - PERFORMANCE
Baseline -2.640 3.256 -0.811 -0.17 — — — — — — — —
Year 1 4.570 6.571 0.695 0.26 — — — — — — — —
Year 2 5.171 5.333 0.970 0.32 — — — — — — — —
Year 3 1.931 4.983 0.387 0.11 — — — — — — — —
Note. SS = social science. * indicates statistically significant effect, p < .05
1. Effect sizes were computed by dividing the observed DD effect with its respective standard deviation from the random effects.
36 | Compendium of Research

APPENDIX D SUMMARY OF DIFFERENCE-IN-DIFFERENCES MODEL PARAMETERS AND EFFECT SIZES FOR SAT ANALYSES
Outcome b SE t d 2
PARTICIPATION RATE
Baseline -8.787 7.370 -1.192 -0.25
Year 1 6.398 4.068 1.573 0.46
Year 2 4.715 2.700 1.747 0.37
Year 3 -0.049 2.586 -0.019 0.00
Performance
TOTAL SCORE
Baseline -2.44 11.37 -0.214 -0.03
Year 1 -14.30 10.72 -1.335 -0.20
Year 2 -9.19 10.87 -0.846 -0.13
Year 3 25.51* 10.74 2.376 0.45
CRITICAL READING
Baseline 0.255 4.256 0.060 0.01
Year 1 -3.308 4.493 -0.736 -0.16
Year 2 1.208 3.906 0.309 0.07
Year 3 9.944* 3.994 2.490 0.56
WRITING
Baseline 0.646 4.033 0.16 0.02
Year 1 -2.685 3.846 -0.698 -0.18
Year 2 3.195 3.314 0.964 0.26
Year 3 8.771* 3.090 2.838 0.68
MATH
Baseline 0.888 5.463 0.162 0.03
Year 1 -4.283 3.761 -1.139 -0.32
Year 2 -1.427 4.645 -0.307 -0.08
Year 3 10.346 5.907 1.751 0.39
Note. * indicates statistically significant effect, p < .05
2. Effect sizes were computed by dividing the observed DD effect with its respective standard deviation from the random effects.
CH
AP
TE
R 1: T
HE
SP
RIN
GB
OA
RD
NA
TIO
NA
L EFFE
CT
IVE
NE
SS
ST
UD
Y
37

Outcome b SE t d 3
PARTICIPATION RATE
Baseline 0.092 3.881 0.024 0.00
Year 1 8.868* 3.442 2.577 0.48
Year 2 12.445* 3.194 3.896 0.71
Year 3 7.679* 3.674 2.090 0.43
Performance
CRITICAL READING
Baseline 0.144 4.031 0.036 0.00
Year 1 -1.726 3.551 -0.486 -0.09
Year 2 -2.692 3.546 -0.759 -0.13
Year 3 6.026 3.634 1.658 0.25
WRITING
Baseline -0.624 3.599 -0.173 -0.02
Year 1 0.250 3.193 0.078 0.01
Year 2 -2.536 3.140 -0.807 -0.13
Year 3 2.793 3.400 0.822 0.12
MATH
Baseline 3.828 6.925 0.553 0.11
Year 1 -10.200 8.814 -1.157 -0.31
Year 2 -13.485 7.787 -1.732 -0.46
Year 3 -8.761 8.042 -1.089 -0.29
Note. * indicates statistically significant effect, p < .05
3. Effect sizes were computed by dividing the observed DD effect with its respective standard deviation from the random effects.
APPENDIX E SUMMARY OF DIFFERENCE-IN-DIFFERENCES MODEL PARAMETERS AND EFFECT SIZES FOR PSAT/NMSQT JUNIOR YEAR ANALYSES
38 | Compendium of Research

APPENDIX F SUMMARY OF DIFFERENCE-IN-DIFFERENCES MODEL PARAMETERS AND EFFECT SIZES FOR PSAT/NMSQT SOPHOMORE YEAR ANALYSES
Outcome b SE t d 4
PARTICIPATION RATE
Baseline -7.914 13.064 -0.606 -0.14
Year 1 20.477 14.315 1.430 0.49
Year 2 28.187* 14.112 1.997 0.64
Year 3 19.250 14.340 1.342 0.42
Performance
CRITICAL READING
Baseline 4.427 5.872 0.754 0.12
Year 1 -6.637 4.224 -1.571 -0.68
Year 2 -11.375* 4.421 -2.573 -0.70
Year 3 -5.124 5.683 -0.902 -0.23
WRITING
Baseline 4.862 4.964 0.979 0.14
Year 1 -8.403 4.329 -1.941 -0.60
Year 2 -8.380* 4.040 -2.075 -0.49
Year 3 -3.559 5.919 -0.601 -0.11
MATH
Baseline 4.456 7.277 0.612 0.12
Year 1 -10.830 6.324 -1.713 -0.78
Year 2 -1.148 6.943 -0.165 -0.07 Year 3 3.591 6.996 0.513 0.17
Note. * indicates statistically significant effect, p < .05
4. Effect sizes were computed by dividing the observed DD effect with its respective standard deviation from the random effects.
CH
AP
TE
R 1: T
HE
SP
RIN
GB
OA
RD
NA
TIO
NA
L EFFE
CT
IVE
NE
SS
ST
UD
Y
39

Chapter 2: Florida SpringBoard Schools Efficacy StudyBY SUNNY NIU, PRINCETON
UNIVERSITY; JUN LI, FORDHAM
UNIVERSITY; AND JENNIFER
MERRIMAN AND HAIFA MATOS-
ELEFONTE, THE COLLEGE
BOARD
In this study, we compare Spring Board® schools that had continuously used the SpringBoard English Language Arts (ELA) curriculum for at least three years with comparable non-SpringBoard schools. For high schools, the outcomes examined were school-level AP® participation and performance for (a) all AP subjects, (b) ELA and social science AP subjects, and (c) ELA-only subjects. AP performance was defined as the percentage of students among graduating seniors scoring 3 or higher in at least one AP Exam. We report comparison results for all students in schools, and for three subgroups—black, Hispanic, and first-generation college-going students. For middle schools, the outcome examined was school-level FCAT reading scores among eighth graders.
40 | Compendium of Research

AP participation and performance were statistically significantly higher for first-generation students in SpringBoard schools than in non-SpringBoard schools. Note that students self-reported their own race/ethnicity and also first-generation status when they registered for the AP Exams. Also, students may be first-generation as well as fall into one of the racial/ethnic subgroups.
ELA and Social Science AP. Figure 2 reports differences in AP participation and performance in 11 ELA and social science subjects. As was seen in the results for all AP subjects, AP participation and performance on ELA and social science among 12th graders improved both for SpringBoard schools and comparable non-SpringBoard schools from 2008 to 2012, statistically so for first-generation students in SB schools.
ELA Only AP. Figure 3 reports differences in AP participation and performance in ELA subjects only. Results indicate statistically significant increases for SpringBoard schools, compared to non-SB schools for all students as well as Hispanic and first-generation students. First-generation students also showed significantly more improvement in AP ELA performance in SpringBoard schools, compared to first generation students in non-SpringBoard schools.
High Schools
Data and Methods Based on SpringBoard (SB) purchasing records through 2012, there were a total of 138 SB schools in Florida, 42 of which had used the SpringBoard ELA curriculum for at least three years counting back from 2012. A total of 204 non-SpringBoard schools were identified to serve as comparison schools based on high school characteristics including urbanicity, Title 1 and magnet school status, enrollment size, percentage of students receiving free or reduced-price lunch, race/ethnicity composition, and ninth-grade FCAT reading and math scores in the 2007-08 academic year. These 204 non-SpringBoard schools had statistically similar characteristics as the 42 SpringBoard schools (see Table 1). Difference in differences calculations were made for each comparison of SpringBoard and non-SpringBoard schools.
Results All AP. Figure 1 reports differences in participation and performance in all AP subjects for high school senior cohorts from 2008 to 2012 between 42 SpringBoard schools and 204 comparable non-SpringBoard schools. From 2008 to 2012, AP participation and performance among 12th graders improved both for SpringBoard schools and comparable non-SpringBoard schools.
Non-SB SB 3+ yr. Difference
n 204 42 p value
URBANICITY
Urban 20 29 0.19
Suburb 48 50 0.82
Town 10 5 0.17
Rural 22 17 0.43
TITLE I SCHOOL
Yes 55 55 0.94
MAGNET SCHOOL
Yes 27 26 0.87
ENROLLMENT
Size 1,892 1,986 0.48
POVERTY STATUS
% Free/Reduced Price Lunch 40 37 0.36
RACE/ETHNICITY COMPOSITION
% White 47 43 0.35
% Black 25 25 0.9
% Hispanic 23 26 0.49
% Asian 2 3 0.06
PRIOR ACHIEVEMENT
FCAT Reading (9th graders) 1,912 1,905 0.67
TABLE 1 HIGH SCHOOL CHARACTERISTICS (2007-08 ACADEMIC YEAR)
CH
AP
TE
R 2: FLO
RID
A S
PR
ING
BO
AR
D S
CH
OO
LS E
FFICA
CY
ST
UD
Y
41

2006
SB
2007 2008 2009 2010 2011 20120.0
0.1
0.2
0.3
0.4
0.5
0.6Non-SB
60%
50%
40%
30%
20%
10%
0%
2006
SB
2007 2008 2009 2010 2011 20120.0
0.1
0.2
0.3
0.4
0.5
0.6Non-SB
60%
50%
40%
30%
20%
10%
0%
2006
SB
2007 2008 2009 2010 2011 20120.0
0.1
0.2
0.3
0.4
0.5
0.6Non-SB
60%
50%
40%
30%
20%
10%
0%
2006
SB
2007 2008 2009 2010 2011 20120.0
0.1
0.2
0.3
0.4
0.5
0.6Non-SB
60%
50%
40%
30%
20%
10%
0%
FIGURE 1 AP PARTICIPATION AND PERFORMANCE
AP Participation
AP Participation
AP Performance (% 12th graders with at least one 3 or higher)
AP Performance (% 12th graders with at least one 3 or higher)
Difference in participation growth 2008 to 2012, SpringBoard versus non‐SpringBoard = 3.8%
Difference in participation growth 2008 to 2012, SpringBoard versus non-SpringBoard = 4.3%
Difference in performance growth 2008 to 2012, SpringBoard versus non-SpringBoard = 1.7%
Difference in performance growth 2008 to 2012, SpringBoard versus non-SpringBoard = 0.2%
ALL
BLACK (for schools with at least one black student 2006–2012)
Note: * p < 0.05In calculating AP participation and performance for 2011‐12 cohort, 12th‐grader counts in 2010‐11 were used. In calculating AP participation among first‐generation college‐going students, total 12th‐grader counts were used. In calculating AP participation among black and Hispanic college‐going students, total 12th‐grader black and Hispanic counts were used.
2006 2007 2008 2009 2010 2011 2012 N
SB 34.5% 34.6% 37.5% 40.7% 47.1% 49.8% 52.5% 42
non-SB 25.2% 26.3% 28.2% 33.0% 35.9% 37.6% 204
2006 2007 2008 2009 2010 2011 2012 N
SB 18.9% 18.9% 21.6% 23.8% 30.7% 30.7% 35.8% 40
non-SB 14.5% 15.0% 16.2% 19.6% 22.9% 24.1% 26.1% 153
2006 2007 2008 2009 2010 2011 2012 N
SB 19.0% 18.8% 19.7% 21.0% 22.8% 24.0% 26.2% 42
non-SB 11.4% 11.9% 12.2% 13.3% 14.9% 16.0% 16.9% 204
2006 2007 2008 2009 2010 2011 2012 N
SB 6.3% 5.9% 6.4% 6.6% 8.9% 8.7% 9.8% 40
non-SB 4.1% 4.3% 4.7% 5.5% 6.7% 7.5% 7.9% 153
42 | Compendium of Research

2006
SB
2007 2008 2009 2010 2011 20120.0
0.1
0.2
0.3
0.4
0.5
0.6Non-SB
60%
50%
40%
30%
20%
10%
0%
2006
SB
2007 2008 2009 2010 2011 20120.0
0.1
0.2
0.3
0.4
0.5
0.6Non-SB
60%
50%
40%
30%
20%
10%
0%
2006
SB
2007 2008 2009 2010 2011 20120.0
0.1
0.2
0.3
0.4
0.5
0.6Non-SB
60%
50%
40%
30%
20%
10%
0%
2006
SB
2007 2008 2009 2010 2011 20120.0
0.1
0.2
0.3
0.4
0.5
0.6Non-SB
60%
50%
40%
30%
20%
10%
0%
AP Participation
AP Participation
AP Performance (% 12th graders with at least one 3 or higher)
AP Performance (% 12th graders with at least one 3 or higher)
Difference in participation growth 2008 to 2012, SpringBoard versus non-SpringBoard = 2.9%
Difference in participation growth 2008 to 2012, SpringBoard versus non-SpringBoard = 2.1%*
Difference in performance growth 2008 to 2012, SpringBoard versus non-SpringBoard = -0.2%
Difference in performance growth 2008 to 2012, SpringBoard versus non-SpringBoard = 0.9%*
HISPANIC
FIRST-GENERATION COLLEGE-GOING STUDENT
2006 2007 2008 2009 2010 2011 2012 N
SB 38.1% 37.2% 42.1% 44.8% 51.9% 47.7% 53.6% 41
non-SB 33.2% 34.7% 35.1% 35.5% 41.0% 39.1% 43.7% 169
2006 2007 2008 2009 2010 2011 2012 N
SB 3.8% 4.0% 4.7% 4.8% 6.6% 8.5% 9.2% 42
non-SB 2.9% 3.2% 3.3% 3.8% 4.8% 5.7% 5.7% 204
2006 2007 2008 2009 2010 2011 2012 N
SB 24.5% 23.3% 26.2% 26.3% 28.8% 25.8% 29.6% 41
non-SB 20.5% 20.0% 19.6% 20.2% 21.7% 20.4% 23.2% 169
2006 2007 2008 2009 2010 2011 2012 N
SB 1.7% 1.9% 2.1% 2.0% 2.7% 3.7% 4.2% 42
non-SB 1.1% 1.2% 1.3% 1.6% 2.0% 2.5% 2.5% 204
CH
AP
TE
R 2: FLO
RID
A S
PR
ING
BO
AR
D S
CH
OO
LS E
FFICA
CY
ST
UD
Y
43

2006
SB
2007 2008 2009 2010 2011 20120.0
0.1
0.2
0.3
0.4
0.5
0.6Non-SB
60%
50%
40%
30%
20%
10%
0%
2006
SB
2007 2008 2009 2010 2011 20120.0
0.1
0.2
0.3
0.4
0.5
0.6Non-SB
60%
50%
40%
30%
20%
10%
0%
2006
SB
2007 2008 2009 2010 2011 20120.0
0.1
0.2
0.3
0.4
0.5
0.6Non-SB
60%
50%
40%
30%
20%
10%
0%
2006
SB
2007 2008 2009 2010 2011 20120.0
0.1
0.2
0.3
0.4
0.5
0.6Non-SB
60%
50%
40%
30%
20%
10%
0%
FIGURE 2 AP ELA AND SOCIAL SCIENCES PARTICIPATION AND PERFORMANCE
AP Participation
AP Participation
AP Performance (% 12th graders with at least one 3 or higher)
AP Performance (% 12th graders with at least one 3 or higher)
ALL
BLACK (for schools with at least one black student 2006–2012)
Note: * p < 0.05In calculating AP participation and performance for 2011‐12 cohort, 12th‐grader counts in 2010‐11 were used. In calculating AP participation among first‐generation college‐going students, total 12th‐grader counts were used. In calculating AP participation among black and Hispanic college‐going students, total 12th‐grader black and Hispanic counts were used.
Difference in participation growth 2008 to 2012, SpringBoard versus non-SpringBoard = 3.8%
Difference in participation growth 2008 to 2012, SpringBoard versus non-SpringBoard = 4.3%
Difference in performance growth 2008 to 2012, SpringBoard versus non-SpringBoard = 1.7%
Difference in performance growth 2008 to 2012, SpringBoard versus non-SpringBoard = 0.2%
2006 2007 2008 2009 2010 2011 2012 N
SB 27.4% 27.8% 30.5% 33.2% 39.2% 41.3% 43.4% 42
non-SB 18.4% 19.9% 21.2% 22.7% 26.7% 28.6% 30.2% 204
2006 2007 2008 2009 2010 2011 2012 N
SB 18.9% 18.9% 21.6% 23.8% 30.7% 30.7% 35.8% 40
non-SB 14.5% 15.0% 16.2% 19.6% 22.9% 24.1% 26.1% 153
2006 2007 2008 2009 2010 2011 2012 N
SB 13.0% 12.8% 13.8% 15.0% 16.5% 17.2% 19.4% 42
non-SB 7.6% 8.1% 8.5% 9.5% 10.6% 11.4% 12.3% 204
2006 2007 2008 2009 2010 2011 2012 N
SB 4.8% 4.2% 5.0% 5.3% 7.3% 6.9% 7.8% 40
non-SB 3.1% 3.3% 3.7% 4.5% 5.3% 6.0% 6.3% 153
44 | Compendium of Research

CH
AP
TE
R 2: FLO
RID
A S
PR
ING
BO
AR
D S
CH
OO
LS E
FFICA
CY
ST
UD
Y
2006
SB
2007 2008 2009 2010 2011 20120.0
0.1
0.2
0.3
0.4
0.5
0.6Non-SB
60%
50%
40%
30%
20%
10%
0%
2006
SB
2007 2008 2009 2010 2011 20120.0
0.1
0.2
0.3
0.4
0.5
0.6Non-SB
60%
50%
40%
30%
20%
10%
0%
2006
SB
2007 2008 2009 2010 2011 20120.0
0.1
0.2
0.3
0.4
0.5
0.6Non-SB
60%
50%
40%
30%
20%
10%
0%
2006
SB
2007 2008 2009 2010 2011 20120.0
0.1
0.2
0.3
0.4
0.5
0.6Non-SB
60%
50%
40%
30%
20%
10%
0%
AP Participation
AP Participation
AP Performance (% 12th graders with at least one 3 or higher)
AP Performance (% 12th graders with at least one 3 or higher)
HISPANIC
FIRST-GENERATION COLLEGE-GOING STUDENT
Difference in participation growth 2008 to 2012, SpringBoard versus non-SpringBoard = 4.7%
Difference in participation growth 2008 to 2012, SpringBoard versus non-SpringBoard = 1.6%*
Difference in performance growth 2008 to 2012, SpringBoard versus non-SpringBoard = 1.1%
Difference in performance growth 2008 to 2012, SpringBoard versus non-SpringBoard = 0.6%*
2006 2007 2008 2009 2010 2011 2012 N
SB 24.5% 24.9% 27.7% 31.5% 38.1% 35.0% 41.0% 41
non-SB 20.6% 22.4% 23.2% 24.6% 28.5% 28.2% 31.8% 169
2006 2007 2008 2009 2010 2011 2012 N
SB 2.9% 3.2% 3.9% 4.0% 5.6% 7.0% 7.6% 42
non-SB 2.2% 2.5% 2.7% 3.1% 3.9% 4.7% 4.7% 204
2006 2007 2008 2009 2010 2011 2012 N
SB 9.7% 10.1% 12.0% 12.7% 14.7% 13.1% 16.6% 41
non-SB 9.1% 8.8% 9.4% 10.5% 10.8% 10.9% 12.9% 169
2006 2007 2008 2009 2010 2011 2012 N
SB 1.0% 1.1% 1.2% 1.3% 1.6% 2.2% 2.6% 42
non-SB 0.7% 0.8% 0.9% 1.1% 1.3% 1.6% 1.6% 204
45

2006
SB
2007 2008 2009 2010 2011 20120.0
0.1
0.2
0.3
0.4
0.5
0.6Non-SB
60%
50%
40%
30%
20%
10%
0%
2006
SB
2007 2008 2009 2010 2011 20120.0
0.1
0.2
0.3
0.4
0.5
0.6Non-SB
60%
50%
40%
30%
20%
10%
0%
2006
SB
2007 2008 2009 2010 2011 20120.0
0.1
0.2
0.3
0.4
0.5
0.6Non-SB
60%
50%
40%
30%
20%
10%
0%
2006
SB
2007 2008 2009 2010 2011 20120.0
0.1
0.2
0.3
0.4
0.5
0.6Non-SB
60%
50%
40%
30%
20%
10%
0%
FIGURE 3 AP ELA PARTICIPATION AND PERFORMANCE
AP Participation
AP Participation
AP Performance (% 12th graders with at least one 3 or higher)
AP Performance (% 12th graders with at least one 3 or higher)
ALL
BLACK (for schools with at least one black student 2006–2012)
Difference in participation growth 2008 to 2012, SpringBoard versus non-SpringBoard = 4.5%
Difference in participation growth 2008 to 2012, SpringBoard versus non-SpringBoard = 3.3%
Difference in performance growth 2008 to 2012, SpringBoard versus non-SpringBoard = 1.4%
Difference in performance growth 2008 to 2012, SpringBoard versus non-SpringBoard = 0.3%
Access to AP statistically significant increases in access to AP, rising 4.5 percentage points higher in AP English Literature and Language participation, with no loss of performance
2006 2007 2008 2009 2010 2011 2012 N
SB 18.2% 17.4% 19.3% 21.4% 26.5% 27.7% 28.6% 42
non-SB 12.2% 12.9% 13.5% 14.2% 16.7% 17.6% 18.2% 204
2006 2007 2008 2009 2010 2011 2012 N
SB 9.8% 8.9% 10.9% 12.5% 17.2% 16.8% 18.6% 40
non-SB 7.5% 7.5% 8.5% 9.7% 11.6% 11.8% 13.0% 153
2006 2007 2008 2009 2010 2011 2012 N
SB 8.9% 8.4% 9.5% 10.2% 11.6% 12.0% 13.2% 42
non-SB 5.2% 5.4% 5.8% 6.2% 7.1% 7.6% 8.1% 204
2006 2007 2008 2009 2010 2011 2012 N
SB 2.5% 2.2% 2.9% 3.3% 4.6% 4.8% 4.7% 40
non-SB 2.0% 1.9% 2.4% 2.7% 3.5% 3.8% 3.9% 153
46 | Compendium of Research

2006
SB
2007 2008 2009 2010 2011 20120.0
0.1
0.2
0.3
0.4
0.5
0.6Non-SB
60%
50%
40%
30%
20%
10%
0%
2006
SB
2007 2008 2009 2010 2011 20120.0
0.1
0.2
0.3
0.4
0.5
0.6Non-SB
60%
50%
40%
30%
20%
10%
0%
2006
SB
2007 2008 2009 2010 2011 20120.0
0.1
0.2
0.3
0.4
0.5
0.6Non-SB
60%
50%
40%
30%
20%
10%
0%
2006
SB
2007 2008 2009 2010 2011 20120.0
0.1
0.2
0.3
0.4
0.5
0.6Non-SB
60%
50%
40%
30%
20%
10%
0%
AP Participation
AP Participation
AP Performance (% 12th graders with at least one 3 or higher)
AP Performance (% 12th graders with at least one 3 or higher)
HISPANIC
FIRST-GENERATION COLLEGE-GOING STUDENT
Difference in participation growth 2008 to 2012, SpringBoard versus non-SpringBoard = 4.7%
Difference in participation growth 2008 to 2012, SpringBoard versus non-SpringBoard = 1.5%
Difference in performance growth 2008 to 2012, SpringBoard versus non-SpringBoard = 1.2%
Difference in performance growth 2008 to 2012, SpringBoard versus non-SpringBoard = 0.5%
Increases Among Hispanic Students
statistically significant gains in access to AP, rising 4.7 percentage points higher in AP English Literature and Language participation, with no loss of performance.
2006 2007 2008 2009 2010 2011 2012 N
SB 14.7% 15.1% 16.4% 19.8% 25.6% 22.5% 25.9% 41
non-SB 13.7% 14.4% 14.5% 14.8% 17.2% 16.3% 19.2% 169
2006 2007 2008 2009 2010 2011 2012 N
SB 1.8% 2.0% 2.3% 2.4% 3.8% 4.9% 5.0% 42
non-SB 1.5% 1.6% 1.7% 2.0% 2.5% 3.0% 2.9% 204
2006 2007 2008 2009 2010 2011 2012 N
SB 6.5% 6.1% 7.9% 8.6% 10.3% 8.4% 10.8% 41
non-SB 6.5% 6.0% 6.5% 6.7% 6.8% 6.9% 8.2% 169
2006 2007 2008 2009 2010 2011 2012 N
SB 0.7% 0.7% 0.7% 0.8% 1.1% 1.3% 1.7% 42
non-SB 0.4% 0.5% 0.6% 0.7% 0.8% 1.1% 1.0% 204
CH
AP
TE
R 2: FLO
RID
A S
PR
ING
BO
AR
D S
CH
OO
LS E
FFICA
CY
ST
UD
Y
47

Middle Schools
Data and MethodsBased on SpringBoard (SB) purchasing records, by 2012 there were a total of 320 SB middle schools in Florida, and 29 SB schools had used the SB ELA curriculum for at least three years counting back from 2010. Because the FCAT 2.0 test was used for 2011 and 2012 cohorts and the FCAT 2.0 test differs from FCAT both in content and scale, the 2011 and 2012 cohorts were dropped. Three years of continuous purchase of the SB ELA curriculum was counted back from 2010.
Based on middle school characteristics, including urbanicity, Title 1 and magnet school status, enrollment size, percentage of students receiving free or reduced-price lunch, race/ethnicity composition, and sixth-grader FCAT reading and math scores in the 2007-08
academic year, 109 non-SB schools were identified to serve as comparison schools. These matched non-SB schools had statistically similar characteristics as SB schools (see Table 2). Difference in difference calculations were made for each comparison of SB and non-SB schools.
Results Figure 4 reports differences in FCAT reading mean scores for eighth graders from 2006 to 2010 from SB and matched non-SB schools. From 2006 to 2010, FCAT reading and math scores among eighth graders improved both for SB schools and matched non-SB schools; however, there were no statistically significant differences between SB and non-SB schools in FCAT score growth over time.
Non-SB SB 3+ yr. Difference
n 109 29 p value
URBANICITY
Urban 40 31 0.36
Suburb 41 52 0.32
Town 6 3 0.55
Rural 12 14 0.79
TITLE I SCHOOL
Yes 95 86 0.18
MAGNET SCHOOL
Yes 20 28 0.39
ENROLLMENT
Size 1,010 1,086 0.22
POVERTY STATUS
% Free/Reduced-Price Lunch 59 58 0.75
RACE/ETHNICITY COMPOSITION
% White 33 39 0.26
% Black 38 34 0.44
% Hispanic 23 22 0.95
% Asian 2 2 0.03
PRIOR ACHIEVEMENT
FCAT Reading (9th graders) 1,647 1,654 0.69
TABLE 2 MIDDLE SCHOOL
CHARACTERISTICS
(2007-08 ACADEMIC
YEAR)
48 | Compendium of Research

Summary Compared to non-SB schools with similar characteristics, SB schools that had continuously used the SB ELA curriculum for at least three years showed significant growth in AP participation and performance for first-generation students when examining all AP subjects, ELA and social science subjects, and ELA only. In addition, SB schools had significantly higher AP ELA participation for all students and for Hispanic students. There were no differences found between SB and non-SB middle schools in growth in FCAT reading scores.
2006
SB
2007 2008 2009 20100.0
0.1
0.2
0.3
0.4
0.5
0.6Non-SB
60%
50%
40%
30%
20%
10%
0%2006
SB
2007 2008 2009 20101720
1740
1760
1780
1800
1820
1840
1860
1880
1900
1920Non-SB
FIGURE 4 FCAT READING AND MATH SCORES OF 8TH GRADERS
Mean Score Percentage Category 3+
FCAT READING
Note: * p < 0.05Regular schools with outcome data for 2006–2010
CH
AP
TE
R 2: FLO
RID
A S
PR
ING
BO
AR
D S
CH
OO
LS E
FFICA
CY
ST
UD
Y
Difference in performance growth 2007 to 2010, SB vs. Non-SB = 11 Difference in performance growth 2007 to 2010, SB vs. Non-SB = 1.7%
2006 2007 2008 2009 2010 2011 2012 N
SB 1797 1813 1858 1862 1864 29 52.5% 42
Non-SB 1805 1819 1847 1853 1860 109 37.6% 204
2006 2007 2008 2009 2010 2011 2012 N
SB 40.2% 42.0% 48.1% 47.7% 49.2% 29 26.2% 42
Non-SB 40.2% 42.5% 45.1% 45.6% 48.0% 109 16.9% 204
49

Chapter 3: Can SpringBoard Improve AP Enrollment and Performance? Phase 1: Five-Year Trend Analysis
BY HAIFA MATOS-ELEFONTE,
THE COLLEGE BOARD, AND
JUN LI, FORDHAM UNIVERSITY
This research examines the relationship of using SpringBoard® in high school and AP® enrollment and performance.
Results: à Over a four-year period, the high schools that purchased SpringBoard for three to five years had substantially more students enrolled in AP courses and also had more students scoring higher than students in high schools that purchased SpringBoard for one to two years and the state overall. (Table 3)
à Over the same four-year period, high schools that purchased SpringBoard had a 109% and 52% gain in the number of black and Hispanic students, respectively, enrolled in AP courses. Students from high schools not purchasing SpringBoard had a 37% gain each for black and Hispanic students enrolled in AP courses. (Table 2)
à Over the same four-year period, high schools that purchased SpringBoard had a 34% and 30% gain in the number of black and Hispanic students, respectively, scoring a 3 on at least one AP Exam. Students from high schools not purchasing SpringBoard had a 27% and 26% gain for black and Hispanic students, respectively, scoring a 3 on at least one AP Exam.
109% and 52% gains
in the number of black and Hispanic students, respectively, enrolled in AP courses
50 | Compendium of Research

important to note that the results shown in this report are in no way causal, they merely depict relationships that have emerged within the data. Research currently under way is examining using more rigorous controls to understand the impact of SpringBoard on students’ educational outcomes.
This research summary focuses on the implementation of SpringBoard in Florida high schools and SpringBoard’s relationship to AP expansion. The full research will include both SAT and AP trends, and the analyses will compare SpringBoard schools and districts to comparable schools and districts. R&D is currently working to develop appropriate methodologies for determining comparable schools/districts. In the meantime, comparisons to non-SpringBoard schools, and the overall state, when appropriate, are provided in this summary.
In July 2009, the Research Services team of the College Board’s Research and Development (R&D) department embarked upon phase 1 of a longitudinal evaluation investigating the impact of SpringBoard on the academic achievement of students. Specifically, researchers have been interested in examining Advanced Placement® (AP) and SAT® participation and performance trends of the graduating cohorts of students who have attended high schools1 that have purchased2 the SpringBoard curricula. The purpose of phase 1 of the longitudinal study is to describe the relationships between SAT and AP participation and performance among high schools and districts that have purchased SpringBoard in the state of Florida.3 It is only upon fully understanding these relationships that researchers can move forward with more sophisticated analyses to gauge the impact of SpringBoard on educational outcomes. As such, it is
FIGURE 1 FLORIDA SPRINGBOARD HIGH SCHOOLS VS. FLORIDA NON-SPRINGBOARD HIGH SCHOOLS
SB
0
10
20
30
40
50
60
70
80Non-SB
% 1-Year Difference 2006-07 to 2007-08
% 4-Year Difference 2004-05 to 2007-08
16.3
6.9
45.2
30.3
SB
0
10
20
30
40
50
60
70
80Non-SB
% 1-Year Difference 2006-07 to 2007-08
% 4-Year Difference 2004-05 to 2007-08
24.2
10.3
68
40.2
SB
0
10
20
30
40
50
60
70
80Non-SB
% 1-Year Difference 2006-07 to 2007-08
% 4-Year Difference 2004-05 to 2007-08
11.38
23.5 25.7
SB
0
10
20
30
40
50
60
70
80Non-SB
% 1-Year Difference 2006-07 to 2007-08
% 4-Year Difference 2004-05 to 2007-08
15.312
36.1 34
Number of Students Taking at Least One AP Exam
Number of Exams
Number of Students Scoring a 3 or Higher on at Least One AP Exam
Number of Exams Scored 3 or Higher
CH
AP
TE
R 3: C
AN
SP
RIN
GB
OA
RD
IMP
RO
VE
AP
EN
RO
LLME
NT
AN
D P
ER
FOR
MA
NC
E? P
HA
SE
1: FIVE
-YE
AR
TR
EN
D A
NA
LYS
IS
51

growth in AP participation and performance than others. Figure 2 (below) depicts the one-year and four-year change in AP participation and performance by ethnicity.
When examining the growth in the number of students taking at least one AP Exam, the data below show that all ethnic subgroups within SpringBoard schools have experienced greater growth since 2006-07 than their non-SpringBoard peers, with black students and students categorized as “other” showing the greatest growth (both showing a 27.5% increase). Similar results are found when examining the growth in exam takers since 2004-05, where all ethnic subgroups (with the exception of American Indians) in SpringBoard schools have experienced greater increases in exam takers than those groups in non-SpringBoard schools. Performance trends are also similar to those found when examining AP Exam participation. When examining the number of students scoring a 3 or higher on at least one AP Exam, most ethnic subgroups have experienced greater increases since both 2006-07 and 2004-05. However, since 2006-07, black and white students in non-SpringBoard schools have seen a greater increase in the number of students obtaining a score of 3 or higher on an AP Exam. Also worth noting is that since 2004-05, white students and students categorized as “other” in non-SpringBoard high schools have experienced a greater increase in students obtaining a score of 3 or higher on an AP Exam than their counterparts in SpringBoard high schools. These trends are not alarming because researchers typically notice decreases in performance with drastic increases in participation.
Examining Growth in AP Participation and Performance by Implementation YearsAs was noted in the introduction, some high schools in Florida have been purchasing SpringBoard since 2004-05, while others began purchasing the curricula in 2008-09. Researchers would expect to see differences in the growth in AP participation and performance among those schools that have purchased SpringBoard for three or more years versus those that have purchased SpringBoard for less than two years. Figure 3 (on page 55) depicts participation and performance trends by number of years purchasing SpringBoard.
An analysis of SpringBoard implementation by examining number of years purchasing SpringBoard shows that when it comes to AP participation (number of students enrolled in at least one AP course), SpringBoard schools that have purchased SpringBoard for three or more years show greater increases in
Please also note that this January 2010 analysis does not include the 2008-09 AP cohort, as these data were embargoed until The 6th Annual AP Report to the Nation was released in February 2010.
ResultsIn order to identify SpringBoard schools, researchers examined several sources, including the SpringBoard database for 2008-09 data and the SpringBoard contracts/price quotes for each school district in Florida for the years 2005-08. Upon reviewing these files, researchers were able to identify 106 SpringBoard high schools4 representing 12 school districts in the state of Florida. Of these 106 SpringBoard schools, 5% have purchased SpringBoard for the past five years, 14% have purchased SpringBoard for four years, 22% for three years, 24% for two years, and 35% have purchased SpringBoard for only one year. Given that the majority of SpringBoard high schools have only purchased SpringBoard for two years or less, it is important to note that implementation effects may not present themselves in the data because it usually takes three or more years after the introduction of a program for implementation effects to present themselves in the data.
AP Trends: SpringBoard in Florida High SchoolsGrowth in Number of Students Enrolled in AP Courses, Number of Students Scoring 3 or Higher, Number of Exams, Number of Exams Scored 3 or Higher
Since 2005, there has been tremendous growth in students enrolled in AP courses. This growth was particularly salient within Florida public schools, where researchers examined AP growth in SpringBoard versus non-SpringBoard high schools by reviewing the percentage change from last year and from four years ago for both of these populations. Figure 1 (on previous page) highlights one-year and four-year growth in AP participation and performance from 2005 to 2008.
As can be seen by Figure 1, SpringBoard high schools have experienced more growth in AP participation and performance than non-SpringBoard high schools since 2006-07. Similar trends emerge when looking at the growth since 2004-05, with the exception of the growth in the number of students scoring a 3 or higher on at least one AP Exam. Since 2004-05, non-SpringBoard high schools have seen slightly higher growth than their SpringBoard counterparts in AP performance.
Researchers were also interested in determining whether certain subgroups in SpringBoard versus non-SpringBoard high schools were experiencing more
52 | Compendium of Research

FIGURE 2 FLORIDA SPRINGBOARD HIGH SCHOOLS VS. FLORIDA NON-SPRINGBOARD HIGH SCHOOLS BY ETHNICITY
AMERICAN INDIAN
BLACK
WHITE
ASIAN
HISPANIC
OTHER
SB
0102030405060708090
100110
Non-SB
% 1-Year Difference 2006-07 to 2007-08
% 4-Year Difference 2004-05 to 2007-08
2012.8
45.955.9
SB
0102030405060708090
100110
Non-SB
% 1-Year Difference 2006-07 to 2007-08
% 4-Year Difference 2004-05 to 2007-08
27.5
7.4
109.1
37.1
SB
0102030405060708090
100110
Non-SB
% 1-Year Difference 2006-07 to 2007-08
% 4-Year Difference 2004-05 to 2007-08
11.46.7
27 25.2
SB
0102030405060708090
100110
Non-SB
% 1-Year Difference 2006-07 to 2007-08
% 4-Year Difference 2004-05 to 2007-08
12.93.0
46.6
22.1
SB
0102030405060708090
100110
Non-SB
% 1-Year Difference 2006-07 to 2007-08
% 4-Year Difference 2004-05 to 2007-08
25.1
8.2
52.4
37.3
SB
0102030405060708090
100110
Non-SB
% 1-Year Difference 2006-07 to 2007-08
% 4-Year Difference 2004-05 to 2007-08
27.5
13.2
75.2
60.9
Number of Students Taking at Least One AP Exam
Number of Students Taking at Least One AP Exam
Number of Students Taking at Least One AP Exam
Number of Students Taking at Least One AP Exam
Number of Students Taking at Least One AP Exam
Number of Students Taking at Least One AP Exam
CH
AP
TE
R 3: C
AN
SP
RIN
GB
OA
RD
IMP
RO
VE
AP
EN
RO
LLME
NT
AN
D P
ER
FOR
MA
NC
E? P
HA
SE
1: FIVE
-YE
AR
TR
EN
D A
NA
LYS
IS
53

FIGURE 2 FLORIDA SPRINGBOARD HIGH SCHOOLS VS. FLORIDA NON-SPRINGBOARD HIGH SCHOOLS BY ETHNICITY
AMERICAN INDIAN
BLACK
WHITE
ASIAN
HISPANIC
OTHER
SB
0102030405060708090
100110
Non-SB
% 1-Year Difference 2006-07 to 2007-08
% 4-Year Difference 2004-05 to 2007-08
50
12.9
5042.9
SB
0102030405060708090
100110
Non-SB
% 1-Year Difference 2006-07 to 2007-08
% 4-Year Difference 2004-05 to 2007-08
8.5 5.8
32.822.4
SB
0102030405060708090
100110
Non-SB
% 1-Year Difference 2006-07 to 2007-08
% 4-Year Difference 2004-05 to 2007-08
9.2 9.917.7
24.4
SB
0102030405060708090
100110
Non-SB
% 1-Year Difference 2006-07 to 2007-08
% 4-Year Difference 2004-05 to 2007-08
8.5 5.8
32.8
22.4
SB
0102030405060708090
100110
Non-SB
% 1-Year Difference 2006-07 to 2007-08
% 4-Year Difference 2004-05 to 2007-08
19.2
5.5
30.1 26.3
SB
0102030405060708090
100110
Non-SB
% 1-Year Difference 2006-07 to 2007-08
% 4-Year Difference 2004-05 to 2007-08
24.216.8
31
58.9
Number of Exams Scored 3 or Higher on at Least One AP Exam
Number of Exams Scored 3 or Higher on at Least One AP Exam
Number of Exams Scored 3 or Higher on at Least One AP Exam
Number of Exams Scored 3 or Higher on at Least One AP Exam
Number of Exams Scored 3 or Higher on at Least One AP Exam
Number of Exams Scored 3 or Higher on at Least One AP Exam
54 | Compendium of Research

1. Only high schools were included at this time, as Research and Development does not have the capability to link individual students to specific middle schools.
2. In lieu of SpringBoard implementation data, researchers flagged schools as SpringBoard schools if they have purchased SpringBoard over the last five years.
3. Researchers initially focused on Florida because of requests from several Florida districts for data on their SpringBoard schools. Also, data collection has proven to be an arduous task that will require more time and effort in order to expand this study to the national level.
4. Additionally, there were 194 SpringBoard middle schools identified in Florida. These middle schools were not included in the analyses because researchers did not have student-level data from these schools.
CH
AP
TE
R 3: C
AN
SP
RIN
GB
OA
RD
IMP
RO
VE
AP
EN
RO
LLME
NT
AN
D P
ER
FOR
MA
NC
E? P
HA
SE
1: FIVE
-YE
AR
TR
EN
D A
NA
LYS
IS
participation (from 2006-07 and 2004-05) than those high schools that have purchased SpringBoard for less than three years. Interestingly, SpringBoard high schools that have purchased the curricula for less than three years have seen greater increases since 2006-07 in exam takers than all Florida public schools (12.3% vs. 9.3%, respectively). However, since 2004-05, high schools purchasing SpringBoard for less than three years have experienced slightly lower increases in participation than all Florida public schools (31.2% vs. 34.0%). The same trends hold true when examining increases in the number of students scoring a 3 or higher on at least one AP Exam.
DiscussionThe results displayed within this report show some positive trends among high schools that have implemented SpringBoard. In many of the analyses, the high schools identified as having purchased SpringBoard have seen greater increases in AP participation and performance than non-SpringBoard high schools. These trends are also salient when examining the data by ethnic subgroups and number of years implementing SpringBoard. It is important to reiterate, however, that these data are merely descriptive in nature, and no causal inferences should be made based on these analyses. Researchers were not privy to more detailed implementation data (e.g., which students were exposed to SpringBoard, how teachers were using the curricula, how teachers were trained to use the curricula, etc.). Therefore a degree of caution should be used when sharing these results with others, particularly constituencies external to the College Board.
FIGURE 3 FLORIDA SPRINGBOARD HIGH SCHOOLS BY NUMBER OF YEARS PURCHASING SPRINGBOARD
SB 3, 4, 5 years
0
10
20
30
40
50
60
70
80SB 1, 2 years
% 1-Year Difference 2006-07 to 2007-08
% 4-Year Difference 2004-05 to 2007-08
All Florida Public Schools
21.0
12.3 9.3
64.3
31.2 34.0
SB 3, 4, 5 years
0
10
20
30
40
50
60
70
80SB 1, 2 years
% 1-Year Difference 2006-07 to 2007-08
% 4-Year Difference 2004-05 to 2007-08
All Florida Public Schools
12.4 10.6 8.8
30.4
19.025.1
Number of Students Taking at Least One AP Exam Number of Exams Scoring 3 or Higher on at Least One AP Exam
For so many of our students down here in South Texas, the mentality is “I can’t” even before they begin the learning process. Through SpringBoard, our students are realizing—independently—that they truly can. SpringBoard has helped students get to the point where they realize their own abilities and begin to value themselves as learners and individuals. Our students are empowering themselves. That, to me, is immeasurable. What more can a teacher ask for?
KELLY MEDINA, AP English Teacher McAllen Independent School District, McAllen, TX
Access to AP
Florida High schools that purchased SpringBoard for three to five years had substantially more students enrolled in AP courses.
55

Chapter 4: Westat Longitudinal EvaluationExecutive Summary Report
BY HAIFA MATOS-ELEFONTE,
THE COLLEGE BOARD, AND JUN
LI, FORDHAM UNIVERSITY
The following Executive Summary presents the findings from a comprehensive longitudinal evaluation of the College Board’s SpringBoard®
program that was conducted by the Westat organization. The design includes three major components: A systemwide teacher survey comparing SpringBoard and non-SpringBoard teachers and designed to assess implementation patterns, case studies of selected SpringBoard districts and schools, and a preliminary analysis of student achievement related to SpringBoard participation in selected districts. This report presents the results from the survey and student achievement research components.
56 | Compendium of Research

Characteristics of the SpringBoard® programThe recently developed SpringBoard program takes advantage of years of research in cognitive science to support the design of an instructional program in mathematics and English language arts that engages all students in challenging learning experiences. The SpringBoard instructional system combines rigorous course work with assessment and professional development. Each course centers on classroom-tested Model Instructional Units that prepare students for AP®
and college-level work.
Instructional Materials for Teachers and Students: Rigorous content, aligned to standards, carefully articulated in a scope and sequence that builds knowledge and skills incrementally from 6th grade through 12th grade in both English language arts and mathematics. The content is mapped to the College Board Standards for College Success™ and state standards, with the goal to prepare students, upon completion of the six-year sequence, to have the level of knowledge, skills, and abilities necessary for success in college and Advanced Placement® courses. Embedded in each lesson, and at the discretion of the teacher, are numerous opportunities to introduce, model, and then practice and evaluate the application of research-based strategies in reading, writing, oral proficiency, collaboration, and problem solving.
Assessments: Standardized formative assessments with scoring rubrics are embedded in each lesson. In addition, teachers have numerous opportunities to review student work, monitor student talk and observe cognitive organization in action. Online diagnostic assessments composed of high-quality test items, written specifically for SpringBoard by the College Board’s Test Development Group, can be found sequenced within the online table of contents for each level and course. The diagnostic assessment reports offer explanations for each incorrect response.
Professional Development: Includes administrators’ workshops and toolkits, required summer institutes for first-year teachers, advanced training, and an online professional learning community. Premium training services are also available.
SpringBoard Online: Includes instructional resources, customizable online assessments, and correlations to state standards and most textbook programs. It is also the home of the program’s online professional learning community.
Overview of the EvaluationThe SpringBoard longitudinal evaluation is designed to determine the efficacy of the program. The following are evaluation questions being addressed:
1. Are teachers in SpringBoard classrooms more likely than teachers in non-SpringBoard classrooms to exhibit high expectations for all students? Do the SpringBoard teachers feel better prepared to assist their students?
2. Do students in SpringBoard classrooms demonstrate higher rates of achievement than what could be expected were they not in SpringBoard classrooms? Do students in SpringBoard classrooms demonstrate higher rates of achievement than comparable students in non-SpringBoard classrooms?
3. What student, teacher, classroom, school, and/or district characteristics and program implementation patterns are most likely to be associated with favorable versus nonfavorable outcomes?
The first year of the evaluation was a planning year. This report covers the evaluation activities conducted during the second year of the evaluation, from September 2006 through January 2008.
The following sections describe the methodology and results from the three major research activities during this period: A systemwide teacher survey, case study site visits in seven SpringBoard districts, and student achievement analyses using annual test score data from a subset of SpringBoard districts. The report covers the teacher survey, the student achievement analyses and the findings associated with them, in the sections to follow.
Systemwide Teacher Survey
Sample PopulationThe survey sample had two components: teachers who participated in SpringBoard, and teachers from comparable schools that did not participate in SpringBoard. Both sets of teachers were selected in two steps: first by selecting samples of schools, and next by selecting teachers within those schools. The sampling frame for the SpringBoard sample consisted of a list of 6,333 teachers in 479 schools who participated in the SpringBoard training program in 2005 and/or 2006. From this list, 100 middle schools and 106 high schools were selected through stratified sampling, using enrollment size, poverty level, and urbanicity to define the strata.
CH
AP
TE
R 4: W
ES
TAT
LON
GIT
UD
ION
AL E
VA
LUA
TIO
N
57

FIGURE 1 PERCENTAGE OF TEACHERS WHO AGREED OR STRONGLY AGREED WITH STATEMENTS ABOUT STUDENTS
SB Comparison
0 10 20 30 40 50 60 70 80 90 100
I feel able to help all the students who are included in my classes.
The teachers at my school believe all students can achieve the state standards.
Teachers at my school regularly stay after school to attend staff meetings, plan or work with students.
79
91
85
72
67
85
A total of 948 SpringBoard teachers were selected, roughly evenly split between middle schools and high schools, and between English and mathematics. The comparison school frame consisted of all schools that had not participated in SpringBoard but were in districts with SpringBoard schools. This resulted in a frame with 584 high schools and 1,076 middle schools.
Of the final eligible sample of 780 SpringBoard teachers, 357 responded, resulting in a response rate of 38 percent. Among the comparison teachers, the original sample of 846 was reduced to 736 eligible teachers; 241 responded, resulting in a response rate of 28 percent. The overall response rate across both groups combined was 33 percent.
Survey InstrumentThe teacher questionnaire had two major sections and several subsections. Both SpringBoard teachers and non-SpringBoard teachers completed Part I. In this section, teachers were asked to agree or disagree with 28 attitude and opinion statements concerning conditions in their school. Both groups also answered demographic and experience questions. Only SpringBoard teachers received Part II, which consisted of four sections: general questions and statements about the implementation of SpringBoard; specific English Language Arts (ELA) related questions; specific mathematics-related questions; and questions about materials, training, and support.
Survey Findings SpringBoard Teachers Compared to Non-SpringBoard TeachersSpringBoard teachers were very similar to non-SpringBoard teachers in their responses to questions about their school and their colleagues.
Over 90 percent of the respondents from both groups indicated that they agreed or strongly agreed that their fellow teachers …
à Set high standards for themselves
à Have subject matter knowledge
à Use strategies for high student achievement
Over 80 percent of the teachers agreed or strongly agreed with the following positive statements about their schools:
à My school is a good place to work.
à I would recommend this school to parents seeking a place for their child.
à A climate of mutual respect exists among the staff at my school.
à I have confidence in my principal as the instructional leader of the school.
à My school’s administrators provide me with support when I need it.
There were differences between the SpringBoard and comparison teachers, however, when they were asked to indicate their agreement with statements about students.
58 | Compendium of Research

SB Comparison
0 10 20 30 40 50 60 70 80 90 100
FIGURE 2 PERCENTAGE OF TEACHERS WHO AGREED OR STRONGLY AGREED WITH STATEMENTS ABOUT PROFESSIONAL DEVELOPMENT
I receive appropriate follow-up to help me apply professional development concepts.
The district’s (school’s) professional development activities cover the areas where I most desire assistance.
The professional development program in my school provides me with the skills and knowledge I need to raise
student achievement for all students.
Although more than 90 percent of both groups agreed that the teachers in their school set high standards for students, as Figure 1 illustrates, SpringBoard teachers were 5 percent or more likely than non-SpringBoard teachers to agree or strongly agree with the following statements:
à Teachers at my school regularly stay after school to attend staff meetings, plan, or work with students.
à The teachers at my school believe all students can achieve the state standards.
à I feel able to help all the students who are included in my classes.
The two groups also differed when they were asked about instructional resources and professional development. Comparison teachers were more likely than SpringBoard teachers to indicate that they had the resources they needed to meet the needs of their students, including, in particular, the appropriate assessments and the required computer capabilities.
In the area of professional development, over 90 percent of the teachers in both groups agreed or strongly agreed that they were provided with opportunities to participate in professional development. The SpringBoard teachers, however, were about 10 percent more likely to agree that …
à The professional development program in my school provides me with the skills and knowledge I need to raise student achievement for all students.
à The district’s (school’s) professional development activities cover the areas where I most desire assistance.
à I receive appropriate follow-up to help me apply professional development concepts.
The percentages are presented in Figure 2 on this page.
Survey Findings SpringBoard ImplementationAcross the many survey items in Part II, the section offered only to SpringBoard teachers, several consistent findings emerged.
Program Effectiveness and Quality à Teachers largely considered SpringBoard to be very or somewhat effective for a wide variety of students. Among teachers who worked with special populations, 80 percent or more saw SpringBoard as effective with high-achieving students, average students, students from low-income families, inner-city students, and suburban students. More than 70 percent of all of the English language arts teachers saw SpringBoard as effective with English learners and special education students.
à Teachers felt that the SpringBoard materials are age appropriate (84 percent), are flexible (85 percent), are culturally appropriate (82 percent), and involve higher-order thinking skills (92 percent).
à More than half of the ELA teachers saw improvement in students’ reading comprehension (63 percent) and writing skills (56 percent) that they attributed to SpringBoard.
à Teachers widely agreed (95 percent) that the SpringBoard training offered by the CollegeBoard was sufficient to enable them to use the Model Instructional Units and strategies effectively, although only 58 percent agreed that the training for the online component was sufficient.
CH
AP
TE
R 4: W
ES
TAT
LON
GIT
UD
ION
AL E
VA
LUA
TIO
N
59

à Teachers were in agreement that SpringBoard teaching strategies are effective (87 percent) and that SpringBoard had changed the mix of strategies they used. Some indicated they also used the strategies in content areas other than English and mathematics.
Needs improvement:
à Among the ELA teachers, 86 percent considered it a minor to serious problem that SpringBoard ELA did not contain vocabulary, and 90 percent indicated it was a minor to serious problem that the curriculum did not address grammar. Seventy-four percent also considered it a problem that SpringBoard did not provide the ancillary materials (DVDs, novels, CDs) that the lessons required.
à About 50 percent of the responding SpringBoard mathematics teachers considered it at least a minor problem that SpringBoard did not contain the following: suggestions for “direct instruction” outside of the Model Instructional Units, reference to monitored practice, self-reflection for students involving specific mathematical content, and separate embedded assessments that assess transfer of learning to new contexts.
Patterns of Use à The English language arts program was most often used as the core instructional program (50 percent ELA compared to 4 percent math), while the mathematics program was primarily used as a supplement to the main text (37 percent ELA compared to 83 percent math).
à Teachers tended to use SpringBoard assessments on an occasional basis. The teachers were more likely to use the embedded assessments than the diagnostic assessments. Both the diagnostic and embedded assessments were used most often as feedback to students (46 percent used diagnostic, while 69 percent used embedded). Few teachers used the diagnostic assessments to determine grades (20 percent), but more than half used the embedded assessments summatively for grading (57 percent).
Program Alignment and District Support à A majority indicated that SpringBoard was aligned with the district curriculum (78 percent), the state standards (83 percent), and the state testing program (68 percent). In areas where the alignment was less clear, this became a factor in selectively purchasing one content area or another.
à About half of the teachers were provided time to meet to discuss SpringBoard, although about two-fifths had access to an instructional coach.
à More than half of the teachers (53 percent) disagreed that their school had enough computers for a whole class to use the SpringBoard online component at one time, and an even larger majority (65 percent) disagreed that it was easy to arrange a time to use the school’s computers.
SpringBoard has been the single most significant influence on my professional development as a teacher. It’s helped me to structure a student-centered classroom in which my students internalize strategies for making meaning from texts and constructing meaning in texts. Through SpringBoard, I’ve supported my students in the development of critical thinking, reading, and writing skills that will help them succeed in college and beyond.
PAUL DE MARET, AP Teacher, Poudre School District Fort Collins, CO
60 | Compendium of Research

Preliminary Analyses of the Student Achievement Impact of SpringBoard
Sample PopulationA subset of 13 districts was selected from the total population of SpringBoard participants based on the available information about implementation and in order to provide a regional cross section of the SpringBoard community. Westat requested student achievement data from the selected districts with mixed success. Some of the selected districts were not able to provide student-level data because of privacy restrictions or limitations in their programming resources.
Eventually nine districts in six states did provide data, covering 580 schools and 441,419 students in reading, and 571 schools and 427,134 students in mathematics.
The analyses discussed in this summary are from the largest state sample available. Four districts in the state of Florida submitted student-level achievement data from the state assessment (FCAT) and from both participating and comparison students. The reading data from Florida included 419,709 students and 1,370,654 test scores over seven years. The reading test scores represented 134,426 SpringBoard observations and 1,236,228 non-SpringBoard comparison observations, and the mathematics test scores represented 113,944 SpringBoard observations and 1,240,298 non-SpringBoard observations.
The FCAT data provided several advantages from an analytical perspective. As with the other states, Florida students have unique identification numbers that allow them to be followed across multiple years. The statewide annual testing system has been quite stable for more than 10 years. Also, unlike two of the districts in the study, the Florida test provides a developmental-scale score that can be used across grade levels in order to assess gain in achievement. The Florida districts are large, providing a large amount of data to analyze. Because there were multiple districts in a single state, the impact of SpringBoard could be examined across a wider variety of school and student characteristics, making the results more robust. The FCAT developmental-scale score ranges from 0 to 3000 and covers grades 3 through 10. The FCAT standard deviation for each grade level varies, but averages about 300 points per grade level.
The Florida sample collectively covered grades 3 through 12 and the years from 2001 through 2007, though the specific data that were available varied across districts and students. The year that schools started participating in the SpringBoard program ranged from 2004-05 to 2006-07; for every school/district, at least two years of data were available before SpringBoard participation began.
MethodologyThe data were analyzed using a repeated-measures, multilevel modeling approach in which the growth in students’ test scores for any given year is predicted based on their gender, race, free/reduced-price lunch participation and participation in SpringBoard, plus a variable to measure trends over time, and two variables measuring school characteristics (percentage eligible for free/reduced-price lunch, and percentage who are minorities). The demographic and school level variables act as covariates in controlling for differences between the SpringBoard and non-SpringBoard students. The major variable of interest becomes participation in SpringBoard and its ability to explain differences in student achievement after some other differences in the groups have been accounted for.
A variety of statistical models have been tested, and the various types of models have been generally consistent in their results. Some analyses were run across all students within each district/state. Alternatively, to test whether SpringBoard may affect some students differently than others, students were separated into four groups or quartiles based on their initial performance in the data set—their earliest test scores—and then the SpringBoard and non-SpringBoard students within that performance group were compared in terms of their growth in achievement over a year or multiple years in the program.
Findings Results for SpringBoard English Language ArtsFollowing are the results of the analysis as measured by the FCAT Reading Developmental-Scale Scores.
According to the analysis, the average growth in this population (not counting SpringBoard-related changes) is different for students at different levels of performance. Low performers in the bottom quartile on average grow the most in a year, or 90.5 developmental-scale score units. Students in the top quartile grow less, about 27.6 scale score units. Some of the differences in growth rates can be attributed to regression to the mean. There might also be a ceiling effect in which the highest-scoring students had less room for growth.
CH
AP
TE
R 4: W
ES
TAT
LON
GIT
UD
ION
AL E
VA
LUA
TIO
N
61

The table also shows the additional benefit that a student gets from participation in SpringBoard. Students at all levels benefit significantly, with the estimated effect from 25.5 to 37.3 scale score units, or from 2.5 months to more than a year of additional growth per year, that is attributable to SpringBoard. If a student participates for more than one year, the benefit is additive. In other words, a student who stays in SpringBoard for three years can be expected to grow about the same extra amount each year, which could add up to an additional three years of achievement—or a total of six years of growth in three years. These statistics are based on comparing SpringBoard-related growth with the average growth rates, which vary depending on the achievement category. Students who leave the program also continue to benefit from their exposure to SpringBoard; besides the extra growth they achieved while participating in SpringBoard, they (for three of the four quartiles) continued to grow more rapidly after leaving SpringBoard.
Results for SpringBoard MathematicsFollowing are the results of the analysis as measured by the FCAT Mathematics Developmental-Scale Scores.
Fewer students were available for the math analyses in Florida. One district of the four Florida districts was not using SpringBoard math, and two of the others were using it either at the middle or high school level. SpringBoard math is most often used as a supplemental—not core—program. Only 4 percent of the SpringBoard teachers responding to the survey indicated that SpringBoard mathematics was the core curriculum.
Again, the average scale score increase in this population is different for students at different levels of performance. Low performers in the two bottom quartiles on average grow the most in a year, with developmental-scale score units of 89.9 and 90.1. Students in the top quartile grow less, about 38.7 scale score units.
The table also shows the additional benefit that a student gets from participation in SpringBoard mathematics. Students at all levels benefit significantly, with the estimated effect being from 4.4 to 19.4 scale score units, or from .4 to 4.5 months of additional growth per year, that is attributable to SpringBoard. If a student participates for more than one year, the benefit is additive. In other words, a student who stays
VariableBottom quartile
Second quartile
Third quartile
Top quartile
Average scale score increase per year for this population
90.5** 44.7** 33.8** 27.6**
Impact of SpringBoard
Additional scale score growth that is due to exposure to SpringBoard for one year. This may be multiplied by the number of years a student is in SpringBoard.
25.5** 31.5** 31.5** 37.3**
Standard error 1.0 0.8 0.8 1.0
Additional scale score growth in a school’s first year of SpringBoard. This may be added to the one-year total above for the first year a school is in SpringBoard.
12.2** 4.8** 7.3** 13.5**
Standard error 1.6 1.3 1.3 1.7
Additional scale score growth for SpringBoard participants after leaving SpringBoard.
8.3 29.7** 34.4** 60.8**
Standard error 4.5 3.6 3.7 4.7
**p < 0.01
TABLE 1 THE IMPACT OF SPRINGBOARD ON STUDENT ACHIEVEMENT IN READING IN FOUR DISTRICTS IN FLORIDA
62 | Compendium of Research

in SpringBoard for three years can be expected to grow about the same extra amount each year. Students who leave the program also continue to benefit from their exposure to SpringBoard, not only retaining the SpringBoard growth they showed while participating, but in the case of students who are already high performers, continuing to grow more rapidly after leaving SpringBoard.
Summary and DiscussionIn a rigorous longitudinal comparison study using more than one million observations from school districts in Florida, SpringBoard was shown to have a significant benefit in increasing student achievement, particularly in reading. The achievement improvements increase for every year that a student stays in SpringBoard, and some benefit persists even if a student is no longer in the SpringBoard programs. The effect of SpringBoard English Language Arts, according to the preliminary data, can be as much as two years of achievement for every year of SpringBoard.
Improved achievement was observed for students in SpringBoard Mathematics as well, but at a lower effect size. Two potential explanations for the difference may be found in the different structure of the two programs
and the differing patterns of use—SpringBoard Mathematics had fewer lessons and activities and is more often used as a supplemental, not core, curriculum. Alternatively, SpringBoard Mathematics may have been less effective, or may have involved fewer changes from what teachers were already doing prior to participating in SpringBoard.
Also, in interpreting these results, it is important to note that the data do not include student-level indications of exposure to SpringBoard beyond the documentation that SpringBoard is being implemented at that grade level in a school. It may be true that SpringBoard is being implemented selectively within the grade or school with lower-performing students who are not receiving SpringBoard or are receiving a reduced implementation model. More specific implementation information is being collected for the final report.
In a survey of SpringBoard and comparison teachers, participants in the SpringBoard program were very similar to the comparison group, but they were more likely to say that the professional development they received would help them raise student achievement. SpringBoard teachers were also largely positive about the program itself and the quality and effectiveness
VariableBottom quartile
Second quartile
Third quartile
Top quartile
Average scale score increase per year for this population
89.9** 90.1** 68.1** 38.7**
Impact of SpringBoard
Additional scale score growth that is due to exposure to SpringBoard for one year. This may be multiplied by the number of years a student is in SpringBoard.
4.4** 5.1** 8.1** 19.4**
Standard error 1.3 0.5 0.5 0.7
Additional scale score growth in a school’s first year of SpringBoard. This may be added to the one-year total above for the first year a school is in SpringBoard.
-9.0** 0.8 0.4 8.4**
Standard error 2.1 0.9 0.9 1.2
Additional scale score growth for SpringBoard participants after leaving SpringBoard
3.7 4.8 2.3 20.9**
Standard error 5.4 2.5 2.4 3.1
**p < 0.01
TABLE 2 THE IMPACT OF SPRINGBOARD ON STUDENT ACHIEVEMENT IN MATH IN DISTRICTS IN FLORIDA
CH
AP
TE
R 4: W
ES
TAT
LON
GIT
UD
ION
AL E
VA
LUA
TIO
N
63

of its components: the rigorous lessons and units and professional development experiences. Teachers also indicated that aspects of the SpringBoard program needed improvement: They called for the inclusion of vocabulary and grammar in ELA and the expansion of mathematics to make the program more comprehensive. In response to the suggestions from SpringBoard participants and formative research from the field, the SpringBoard program is currently revising the materials as well as the assessments in order to further improve the effectiveness of the program.
Jane Delgado is a research scientist at the College Board. She builds organizational capacity for rigorous evaluation and research while garnering knowledge in large-scale data collection and survey development. She previously held the position of executive director of the Life Lab Science Program at the University of California at Santa Cruz. Delgado earned a B.A. in psychology from the University of California at Berkeley and a Ph.D. in social (organizational) psychology from the University of California at Santa Cruz.
Westat is an employee-owned corporation providing research services to agencies of the U.S. Government, as well as businesses, foundations, and state and local governments. In addition to its capabilities as a leading statistical survey research organization, Westat has developed skills and experience in custom research and program evaluation studies across a broad range of subject areas. Westat also has the technical expertise in survey and analytical methods, computer systems technology, biomedical science, and clinical trials to sustain a leadership position in all our research endeavors. Demonstrating technical and managerial excellence since 1963, Westat has emerged as one of the foremost contract research organizations in the United States.
SpringBoard inspired me to believe that a student-centered classroom infused with rigorous standards and dynamic teaching and learning strategies could transform my teaching! As a SpringBoard teacher, I taught students with learning disabilities, students who were intellectually gifted, students who were highly motivated, and students for whom apathy had become a way of life. SpringBoard provided a common framework I could use to ensure that all of my students were well prepared.
JOELY NEGEDLY, Secondary Reading & Language Arts Department, Volusia County Schools, FL
64 | Compendium of Research

CH
AP
TE
R 4: W
ES
TAT
LON
GIT
UD
ION
AL E
VA
LUA
TIO
N
Chapter 5: Relationship Between SpringBoard and Advanced Placement Participation and Performance Among High School College-Bound Students
JUN LI, FORDHAM UNIVERSITY,
AND HAIFA MATOS-ELEFONTE,
THE COLLEGE BOARD
The SpringBoard® curriculum incorporates research-based learning strategies into an instructional program (Delgado, 2000). SpringBoard provides rigorous English and mathematics lessons for all students in grades 6–12, and was developed in alignment with the College Board College Readiness Standards (College Board, 2010). The English Language Arts (ELA) component provides rigor with learning strategies and scaffolding activities that develop students’ critical thinking capabilities. The Mathematics activities add context and meaning to mathematical concepts and facts. From basic number systems and operations to complex data collection and analysis, SpringBoard mathematics sharpens students’ problem-solving skills and adds valuable context to a math curriculum (College Board, 2010).
14.0% increase in AP Math exam takers.
65.9% increase in AP English exam takers.
66 | Compendium of Research

Currently, SpringBoard is being implemented in 37 states across the United States, and about 600,000 students are in classrooms using the SpringBoard curricula (College Board, 2010). The purpose of SpringBoard is to offer Pre-AP® instructional models for both teachers and student success. Thus, the program seeks to increase the number of students who are prepared for Advanced Placement® (AP®) Exams and subsequent college success. Therefore, the current study explores the relationship between SpringBoard implementation and AP participation and performance of high school college-bound students.
Methods
Participants One school district purchasing Springboard for three years was identified. Four schools in the district purchased the SpringBoard program English Language Arts components and Mathematics in the 2007-08 academic year. The participants in this study were from the 2009 College-bound seniors cohort. These students were in their junior year when the district purchased the SpringBoard program, thus two years of outcome data were available for these students. The data set used was the College Board matched cohort data, which includes all College Board tests (i.e., AP, PSAT/NMSQT, and SAT) that students have taken throughout their high school experience.
Selection of Comparable Schools Bausmith and colleagues (Bausmith, France, Matos-Elefonte, & Li, 2011) developed an index to identify comparable schools that incorporates PSAT/NMSQT, SAT, and AP participation and performance measures. By using their methodology, comparable schools were selected, two for each SpringBoard school. In this report, we have four SpringBoard schools and eight comparable schools.
AnalysisAnalyses conducted for this study were descriptive in nature. The comparison was made between students in SpringBoard schools and comparable schools on the percentages of change in AP participation and performance before and after the purchase of SpringBoard. Thus, the years of interest for this study are the 2006-07 school year (one year prior to purchasing SpringBoard) and the 2008-09 school year (the second year after the purchase of SpringBoard).
Results English Language ArtsBetween the 2006-07 and 2008-09 academic years, after the purchase of the SpringBoard program, there was a 65.9% increase in the number of SpringBoard school students taking AP English exams while there was a 1.4% increase in the comparable school students taking AP English exams (Figure 1). The increase in the number
FIGURE 1 CHANGE IN THE NUMBER OF AP ENGLISH EXAM TAKERS AND AP ENGLISH EXAM TAKERS WHO SCORED 3+ AFTER THE PURCHASE OF SPRINGBOARD (OVERALL)
0
20
40
60
80
100
120
140
160
180
200
AP English AP English 3+
SpringBoard Schools
Comparison Schools
65.9
1.4
50.6
30.3
CH
AP
TE
R 5: R
ELA
TIO
NS
HIP
BE
TW
EE
N S
PR
ING
BO
AR
D A
ND
AD
VA
NC
ED
PLA
CE
ME
NT
PAR
TIC
IPAT
ION
AN
D P
ER
FOR
MA
NC
E A
MO
NG
HIG
H S
CH
OO
L CO
LLEG
E-B
OU
ND
ST
UD
EN
TS
67

FIGURE 3 CHANGE IN THE NUMBER OF AP STUDENTS WHO SCORED 3 OR ABOVE IN AP ENGLISH BY ETHNICITY AFTER THE PURCHASE OF SPRINGBOARD
FIGURE 2 CHANGE IN THE NUMBER OF AP ENGLISH EXAM TAKERS AFTER THE PURCHASE OF SPRINGBOARD (BY ETHNICITY)
0
20
40
60
80
100
120
140
160
180
200
SpringBoard Schools
Comparison Schools
N/A N/A
Asian Black Hispanic White
130
87.2
34.8
5.5
Asian Black Hispanic White
SpringBoard Schools
Comparison Schools
-50
-25
0
25
50
75
100
125
150
175
200
112.5
8.2
200
26.7
176.7
52.2
29.6
-20.1
Note: Performance data omitted when fewer than five graduates took an AP Exam.
68 | Compendium of Research

FIGURE 4 CHANGE IN THE NUMBER OF AP MATH EXAM TAKERS AND AP MATH EXAM TAKERS WHO SCORED 3+ AFTER THE PURCHASE OF SPRINGBOARD (OVERALL)
SpringBoard Schools
Comparison Schools
-50
-25
0
25
50
75
100
125
150
175
200
14
-18.2-11.9
-16.7
AP Math AP Math 3+
of students taking AP English seems to be a function of the increase in exam takers from underrepresented groups (Figure 2). After the purchase of the SpringBoard program, SpringBoard schools showed a higher increase in the number of students taking AP English exams among all ethnic groups while comparable schools were experiencing comparatively lower increases or even decreases (in the case of white students) in the number of AP Exam takers (Figure 2). This increase is especially salient for black and Hispanic students taking AP English exams in SpringBoard schools.
Between the 2006-07 and 2008-09 academic years, after the purchase of SpringBoard, there was a 50.6% increase in the number of SpringBoard school students taking AP English exams and scoring 3 or higher while there was 30.3% increase in the comparable school students taking AP English exams and scoring 3 or higher (Figure 1). SpringBoard schools showed a higher increase in the number of students taking AP and obtaining a score of 3 or higher among Hispanic and white students while their counterparts in comparable schools displayed comparatively lower increases in the number of AP English exam takers who scored 3 or higher (Figure 3). Results are especially noticeable for Hispanic students.
MathematicsBetween the 2006-07 and 2008-09 academic years, after the purchase of Springboard, there was a 14.0% increase in the number of SpringBoard school students taking AP Mathematics exams while there was an 18.2% decrease in the comparable school students taking AP Mathematics exams (Figure 4). When disaggregating the results by ethnicity, an increase in the number of SpringBoard school students taking AP Mathematics exams was found in Asian, Hispanic, and white students, while little increase or even decrease in the number of comparable school students taking AP Math exams in these ethnic groups (Figure 5) was found. In the case of black students, there was a 44.4% decrease in AP Exam taking in SpringBoard schools while there was a 100% increase in comparable schools (Figure 5). However, the overall number of black students in the four SpringBoard schools taking AP Mathematics exams was more than the total number of their counterparts in eight comparable schools. For this reason, inferences about percent change for this group should be limited.
CH
AP
TE
R 5: R
ELA
TIO
NS
HIP
BE
TW
EE
N S
PR
ING
BO
AR
D A
ND
AD
VA
NC
ED
PLA
CE
ME
NT
PAR
TIC
IPAT
ION
AN
D P
ER
FOR
MA
NC
E A
MO
NG
HIG
H S
CH
OO
L CO
LLEG
E-B
OU
ND
ST
UD
EN
TS
69

Between the 2006-07 and 2008-09 academic years, after the purchase of SpringBoard program, there was an 11.9% decrease in the number of SpringBoard school students taking AP Mathematics exams and scoring 3 or above while there was a 16.7% decrease in the comparable school students taking AP Exams and scoring 3 or above (Figure 4). SpringBoard schools showed a higher increase in the number of students taking AP and scoring 3 or above among Hispanic students, while Hispanic students in comparable schools were experiencing decreases in the number of AP Exam takers scoring 3 or above (Figure 6). SpringBoard schools showed a smaller decrease in the case of white students who scored 3 or above in AP Math exams than their comparable school counterparts.
ConclusionsThe current study explored the relationship between the SpringBoard program and AP participation and performance among high school college-bound students. A comparison was made between students in schools that purchased SpringBoard and comparable
schools. Findings suggest that compared to students in similar, non-SpringBoard schools, students in SpringBoard schools showed greater increases in the percentage of students taking AP Exams in both English and Mathematics. After the purchase of the SpringBoard program, more SpringBoard school students took AP English and AP Mathematics exams. This was especially the case among black and Hispanic students.
With the increase in the number of AP Exam takers in SpringBoard schools, the number of students who scored 3 or above in AP English and AP Mathematics exams also increased across the years. After the purchase of the SpringBoard program, even with the increase of Hispanic AP Exam takers in the SpringBoard schools, more Hispanic students scored 3 or above in AP English and AP Mathematics exams, compared to similar, non-SpringBoard school students.
FIGURE 5 CHANGE IN THE NUMBER OF AP MATH EXAM TAKERS AFTER THE PURCHASE OF SPRINGBOARD (BY ETHNICITY)
Asian Black Hispanic White
SpringBoard Schools
Comparison Schools
-50
-25
0
25
50
75
100
125
150
175
200
80
11.1
-44.4
100
66.7
26.5
7
-26.3
70 | Compendium of Research

A few limitations of this study should be noted. Since this study focused on four schools within one school district, the resulting sample size was small. Additionally, for this particular cohort of students, there were only two years of data available since the purchase of the SpringBoard program. It is expected that with additional years of implementation of the SpringBoard program, even stronger results might be seen once teachers become acclimated to the instructional materials.
Future analyses will control for changes in enrollment and determine whether observed differences are statistically significant. Additionally, with the availability of more data for SpringBoard school students, research efforts will focus on the impact of SpringBoard on other college readiness assessments such as the SAT, PSAT/NMSQT, and state tests. Longitudinally, we may also look at modeling growth trends on these assessments to see if there are differences among students in the SpringBoard schools versus the comparable schools.
References Bausmith, J., France, M., Matos-Elefonte, H., & Li, J. (May, 2011) The development of a comparable schools methodology. Paper presented at the meeting of the EERS, Galloway, NJ.
College Board. 2010. SpringBoard overview brochure. Retrieved on October 2010 from http://media.collegeboard.com/digitalServices/pdf/springboard/springboard_overview_brochure.pdf
Delgado. J. (2000). Engaging strategies for all students: The SpringBoard example. College Board Research Report No: 23. New York: The College Board.
CH
AP
TE
R 5: R
ELA
TIO
NS
HIP
BE
TW
EE
N S
PR
ING
BO
AR
D A
ND
AD
VA
NC
ED
PLA
CE
ME
NT
PAR
TIC
IPAT
ION
AN
D P
ER
FOR
MA
NC
E A
MO
NG
HIG
H S
CH
OO
L CO
LLEG
E-B
OU
ND
ST
UD
EN
TS
FIGURE 6 CHANGE IN THE NUMBER OF AP STUDENTS WHO SCORED 3 OR ABOVE IN AP MATH BY ETHNICITY AFTER THE PURCHASE OF SPRINGBOARD
Asian Black Hispanic White
SpringBoard Schools
Comparison Schools
-50
-25
0
25
50
75
100
125
150
175
200
57.1
57.1N/A N/A
-11.1 -13.6
-28.1
Note: Performance data omitted when fewer than five graduates took an AP Exam.
71

Chapter 6: The Impact of SpringBoard on AP Participation and Performance in Three Urban Public High Schools
JENNIFER MERRIMAN
BAUSMITH, THE COLLEGE
BOARD, AND MEGAN FRANCE,
SANTA CLARA UNIVERSITY
All students in grades 9 through 12 in three urban, public high schools began receiving SpringBoard®
English Language Arts (ELA) instruction in the 2007-08 academic year. SpringBoard is the official Pre-AP® program designed to uniquely map AP® and college expectations back to sixth grade and chart a road map for college success from middle school through high school. Providing instructional materials, assessments, and professional development, SpringBoard focuses on English Language Arts and Mathematics for all students in grades 6 through 12. Thus, the purpose of this study was to evaluate the impact of SpringBoard ELA on AP participation and performance using a quasi-experimental design.
77% and 54% increases
in AP English Literature Exam takers and AP English Language Exam takers, respectively, with no differences in performance.
72 | Compendium of Research

The purpose of this study was to evaluate the impact of SpringBoard on AP participation and performance in three urban, public high schools. Students in the graduating cohort of 2010 were provided SpringBoard English Language Arts (ELA) instruction for three years (sophomore, junior, and senior year). A comparison group of similar students who were not instructed in SpringBoard ELA were identified using propensity score matching to ensure that each group had similar background characteristics prior to SpringBoard implementation (i.e., prior achievement, gender, and race/ethnicity). Overall, results indicate a statistically significant higher number of AP Exam takers overall (48% more), AP English Literature and Composition Exam takers (77% more), and AP English Language and Composition Exam takers (54% more) in the SpringBoard cohort than in the similar, non-SpringBoard cohort, with no differences in performance. Thus, SpringBoard appears to have expanded access to AP participation without the typical drop in average performance. The results are especially encouraging for Hispanic students in the SpringBoard schools for whom AP access was expanded and performance also improved, compared to students from non-SpringBoard schools—31% more Hispanic students in the SpringBoard schools scored 3 or higher on at least one AP Exam than comparable students in the non-SpringBoard schools. Taken together, these results suggest that exposure to instruction in SpringBoard has positive effects on AP participation and performance.
Data and Methods Data for this study were drawn from the College Board’s 2010 matched cohort database. In 2010, students who were in 10th grade the year that SpringBoard was implemented would be expected to graduate. As most students take AP in either their junior or senior year, we expected to see impacts on AP participation for this cohort of students. The matched cohort data files contain College Board historical assessment records for all students who are expected to graduate high school in a given year. In other words, for the 2010 matched cohort file, all students who were expected to graduate in the spring of 2010 and ever took a PSAT/NMSQT®, SAT®, or AP assessment are in the data file. Because statistical adjustments to reduce selection bias are most effective when comparison cases are from a focal local population (i.e., within the same state as the intervention cases) (Cook, Shadish, & Wong, 2008), we extracted all students who attended schools
in the state for our analysis sample which resulted in a sample size of n = 207,468, of which 1,006 students were from the three SpringBoard schools.1
Similar, non-SpringBoard students were identified using propensity score matching methods based on a number of achievement and demographic characteristics: gender, ethnicity, and sophomore and junior PSAT/NMSQT scores. In order to create the matched sample, the measures for the above characteristics were entered into a logistic regression model with the outcome variable being whether a student attended a SpringBoard high school or not. From the results of this analysis, a propensity score was calculated for each student. In other words, based on the given characteristics of a student, the calculated score represents a student’s propensity to have been exposed to SpringBoard. Students were then matched according to this score using a SAS greedy matching algorithm, with non-SpringBoard students matched one by one to SpringBoard students.
Paired t-tests were conducted comparing SpringBoard students to non-SpringBoard students along a number of outcome variables related to AP participation and performance. Significance of the impacts are reported for p < .05*. Effect sizes are also shown where the Cohen’s d effect size of 0.2 to 0.3 is considered a “small” effect, around 0.5 a “medium” effect, and greater than 0.8, a “large” effect (Cohen, 1988).
ResultsStudents’ AP participation and performance outcomes were compared between the two groups (SpringBoard and similar non-SpringBoard students) using paired t-tests. Specifically, we examined differences in:
à the number of students who took at least one AP Exam (any subject),
à the number of students who scored 3 or higher on at least one AP Exam (any subject),
à the number of students who took at least one AP English Literature Exam,
à the number of students who took at least one AP English Language Exam,
à the number of students who scored 3 or higher on at least one AP English Literature Exam,
à the number of students who scored 3 or higher on at least one AP English Language Exam.
CH
AP
TE
R 6: T
HE
IMPA
CT
OF S
PR
ING
BO
AR
D O
N A
P PA
RT
ICIPA
TIO
N A
ND
PE
RFO
RM
AN
CE
IN T
HR
EE
UR
BA
N, P
UB
LIC H
IGH
SC
HO
OLS
1. We recognize that using the College Board’s matched cohort data files necessarily excludes all students who never took a College Board assessment and that there may be differences between our sample and the full universe of high school students in Florida. 73

As can be seen in Table 1, statistically significantly more SpringBoard students took at least one AP Exam (48% more), at least one English Literature AP Exam (77% more), or at least one English Language AP Exam (54% more), compared to similar non-SpringBoard students. Despite these increases in access, SpringBoard students had slightly more AP scores of 3 or higher than non-SpringBoard students, though this difference was not statistically significant. There were no differences in performance on AP English Literature or AP English Language Exams.
Figure 2 presents AP participation and performance trends by racial/ethnic groups. The three most common subgroups in the two groups (SpringBoard and non-SpringBoard) were Hispanic (280 and 275, respectively), black (109 and 117, respectively), and white (84 and 83, respectively). Of the SpringBoard students, each subgroup has higher AP participation rates than their comparable non-SpringBoard students, with Hispanic students having 37% more AP participation, white students having 54% more AP participation, and black students having nearly double the AP participation. Although the number of students scoring 3 or higher was comparable across SpringBoard and non-SpringBoard schools for white and black students, 31% more Hispanic students in the SpringBoard schools scored 3 or higher on at least one AP Exam than comparable students in the non-SpringBoard group.
ConclusionsStudents in SpringBoard high schools who were exposed to three years of SpringBoard instruction in ELA had higher AP participation rates than did similar non-SpringBoard students. In addition, the average percent of students scoring 3 or higher on at least one AP Exam did not differ across the groups. Thus, SpringBoard appears to have expanded access to AP participation without the typical drop in average performance. The results are especially encouraging for Hispanic students in the SpringBoard schools for whom AP access was expanded, and performance also improved, compared to students in the non-SpringBoard group. Taken together, these results suggest that exposure to instruction in SpringBoard has positive effects on AP participation and performance.
ReferencesCohen, J. (1988). Statistical Power Analysis for the Behavioral Sciences (2nd ed.). Mahwah, NJ: Lawrence Erlbaum Associates.
Cook, T. D., Shadish, W. R., & Wong, V. C. (2008). Three conditions under which experimental and observational studies produce comparable causal estimates: New findings from within-study comparisons. Journal of Policy Analysis and Management, 27 (4), 724–750.
SpringBoard (n = 506) (Mean 1 = yes, 0 = no)
Non-SpringBoard (n = 506) (Mean 1 = yes, 0 = no)
Statistical Significance
AP EXAM TAKER (ANY SUBJECT)
n = 221 (0.4368)
n = 149 (0.2945)
t = -4.75, p <.0001* Cohen’s d = .30
AP SCORE 3+ (ANY SUBJECT)
n = 73 (.1443)
n = 68 (.1344)
t = -.45, n.s.
ENGLISH LIT AP EXAM TAKER
n = 78 (0.1542)
n = 44 (0.087)
t = -3.3, p <.001* Cohen’s d = .21
ENGLISH LANG AP EXAM TAKER
n = 79 (0.1561)
n = 36 (0.0711)
t = -4.29, p <.0001* Cohen’s d = .27
AP ENGLISH LIT SCORE 3+
n = 9 (0.0178)
n = 10 (0.0198)
t = .23, p = n.s
AP ENGLISH LANG SCORE 3+
n = 10 (0.0198)
n = 8 (0.0158)
t = -0.48, p = n.s
TABLE 1 FREQUENCIES OF STUDENTS TAKING AP EXAMS AND SCORING 3 OR HIGHER ON THOSE EXAMS
74 | Compendium of Research

CH
AP
TE
R 6: T
HE
IMPA
CT
OF S
PR
ING
BO
AR
D O
N A
P PA
RT
ICIPA
TIO
N A
ND
PE
RFO
RM
AN
CE
IN T
HR
EE
UR
BA
N, P
UB
LIC H
IGH
SC
HO
OLS
FIGURE 2 FREQUENCIES OF STUDENTS BY RACE/ETHNICITY TAKING AP EXAMS AND SCORING 3 OR HIGHER ON THOSE EXAMS
There were fewer than five Asian students total in either group so these frequencies are not reported.
WHITE
BLACK
HISPANIC
SB Non-SB
Total Students in Cohort
AP Exam Taker AP Score 3+ English Lit AP Exam Taker
AP English Lit Score 3+
English Lang AP Exam Taker
AP English Lang Score 3+
0
50
100
150
200
250
300
84 83
3724
9 13 195 4 3
174 5 3
SB Non-SB
Total Students in Cohort
AP Exam Taker AP Score 3+ English Lit AP Exam Taker
AP English Lit Score 3+
English Lang AP Exam Taker
AP English Lang Score 3+
0
50
100
150
200
250
300 280 275
133
97
5945 43
265 5
4522
5 2
SB Non-SB
Total Students in Cohort
AP Exam Taker AP Score 3+ English Lit AP Exam Taker
AP English Lit Score 3+
English Lang AP Exam Taker
AP English Lang Score 3+
0
50
100
150
200
250
300
109 117
4322
3 5 14 120 1
15 8 0 2
75

“ SpringBoard has proven year after year to be the instructional framework instrumental to fulfilling our vision. Since implementation, the number of students taking Advanced Placement classes has increased, and our reading and writing scores in our state assessment have improved.”
ELA Curriculum CoordinatorBellevue School District
Bellevue, WA
“ SpringBoard has changed the way I teach. The strategies embedded within the activities have turned my lessons from teacher-centered to student-centered. It is so inspiring to watch my students become so engaged with the mathematics that they are unaware of the time that has passed. I hear more often than not, “It’s time to go already?”
High School Mathematics TeacherMiami-Dade County Public Schools
Miami, FL
To learn more about SpringBoard, call 877-999-7723
collegeboard.org/springboard
00419-071 160071134