Embed Size (px)
Citation preview

OECD
Compendium of Enterprise Statistics in Ukraine 2018

│ 1
ORGANISATION FOR ECONOMIC CO-OPERATION AND DEVELOPMENT
The OECD is a unique forum where governments work together to address the economic, social
and environmental challenges of globalisation. The OECD is also at the forefront of efforts to
understand and to help governments respond to new developments and concerns, such as corporate
governance, the information economy and the challenges of an ageing population. The
Organisation provides a setting where governments can compare policy experiences, seek answers
to common problems, identify good practice and work to co-ordinate domestic and international
policies. The OECD member countries are: Australia, Austria, Belgium, Canada, Chile, the Czech
Republic, Denmark, Estonia, Finland, France, Germany, Greece, Hungary, Iceland, Ireland, Israel,
Italy, Japan, Korea, Latvia, Lithuania, Luxembourg, Mexico, the Netherlands, New Zealand,
Norway, Poland, Portugal, the Slovak Republic, Slovenia, Spain, Sweden, Switzerland, Turkey,
the United Kingdom and the United States. The European Union takes part in the work of the
OECD.
www.oecd.org
OECD EURASIA COMPETITIVENESS PROGRAMME
The OECD Eurasia Competitiveness Programme, launched in 2008, helps accelerate economic
reforms and improve the business climate to achieve sustainable economic growth and employment
in two regions: Central Asia (Afghanistan, Kazakhstan, Kyrgyzstan, Mongolia, Tajikistan,
Turkmenistan and Uzbekistan), and Eastern Europe and South Caucasus (Armenia, Azerbaijan,
Belarus, Georgia, the Republic of Moldova and Ukraine). The Programme contributes to the OECD
outreach strategy implemented by the Global Relations Secretariat.
www.oecd.org/globalrelations/eurasia.htm
EU4BUSINESS
The EU4Business Initiative covers all EU support for small and medium-sized enterprises (SMEs)
in the region of the Eastern Partnership which brings together the EU, its member states and six
partner countries: Armenia, Azerbaijan, Belarus, Georgia, Moldova and Ukraine.
www.eu4business.eu

2 │
Table of Contents
Foreword ................................................................................................................................................ 4
Acknowledgements ................................................................................................................................ 5
Measuring the SME sector in Ukraine ................................................................................................ 7
About legal definitions of SMEs and definitions for statistical purposes ........................................ 7
Reader’s Guide .................................................................................................................................... 10
Statistical units ................................................................................................................................... 10 Size class breakdown ......................................................................................................................... 10 Monetary variables ............................................................................................................................ 11 Country codes .................................................................................................................................... 11 Economic activity sectors .................................................................................................................. 11 Definitions ......................................................................................................................................... 12
Overview of the business sector in Ukraine ...................................................................................... 14
Number of enterprises, employment, turnover and value added by size class, business economy
excluding financial intermediation .................................................................................................... 14 Employment, turnover and value added share of SMEs, by industry ................................................ 15 Enterprise, employment and turnover share of the city of Kiev, by enterprise type .......................... 15
Key Indicators ...................................................................................................................................... 16
1. Number of enterprises ..................................................................................................................... 16
1.1. Number of enterprises in business economy by size and activity sector, 2017 .......................... 16 1.2. Recent trends of the number of enterprises, business economy.................................................. 16 1.3. Structure of the business economy, recent years ........................................................................ 17 1.4. Share of enterprises by size, business economy excluding financial intermediation, Ukraine
and selected OECD countries ............................................................................................................ 18
2. SME employment ............................................................................................................................ 19
2.1. Number of persons employed by sector and enterprise size, 2017 vs. 2016 .............................. 19 2.2. Number of persons employed, by size class, business economy ................................................ 19 2.3. Number of persons employed, by size class, business economy, Ukraine and selected OECD countries ........................................................................................................................................... 20
3. SME turnover .................................................................................................................................. 21
3.1. Turnover by enterprise size and industry .................................................................................... 21 3.2. Turnover by size class, industry, Ukraine and selected OECD countries ................................... 21 3.3. Turnover by size class, wholesale and retail trade, comparison with OECD and other
countries ............................................................................................................................................. 22
4. SME value added ............................................................................................................................. 23
4.1. Value added by size class, total economy ................................................................................... 23 4.2. Share of value added, by size class and activity sector ............................................................... 23 4.3. Value added by size class, Ukraine and selected OECD countries ............................................. 24
│ 3
5. Labour productivity of SMEs ......................................................................................................... 25
5.1. Labour productivity, by activity sector ....................................................................................... 25 5.2. Labour productivity in industry, by size class, Ukraine and selected OECD countries ............. 25 5.3. Labour productivity in ICT, Ukraine and selected OECD countries .......................................... 26 5.4. Labour productivity in professional services industries, Ukraine and selected OECD
countries ............................................................................................................................................. 26
6. Entrepreneurial dynamism............................................................................................................. 27
6.1. Enterprise birth and death rates, by activity sector, 2015 ........................................................... 27 6.2. Enterprise birth and death rates, industry, Ukraine and selected OECD countries ..................... 27 6.3. Enterprise birth rates, by size, Ukraine and selected OECD countries ....................................... 28 6.4. Enterprise death rates, by size, Ukraine and selected OECD countries ...................................... 28
7. Regional statistics on enterprises ................................................................................................... 29
7.1. Share of enterprises by region, including individual enterprises ................................................ 29 7.2. Share of enterprises by region, legal entities .............................................................................. 29 7.3. Number enterprises by region, by legal form ............................................................................. 30 7.4. Share of legal entities by region .................................................................................................. 30 7.5. Number of persons employed, by region, including individual enterprises ............................... 31 7.6. Number of persons employed, by region, legal entities .............................................................. 31 7.7. Turnover by region, legal entities ............................................................................................... 32
8. SME and corporate financing ........................................................................................................ 33
8.1. Outstanding business loans growth, all companies ..................................................................... 34 8.2. SME outstanding loans as a share of total outstanding loans, 2017 ........................................... 34 8.3. New business loans growth, all companies ................................................................................. 35 8.4. SME interest rate and interest rate spreads between loans to large firms and to SMEs. ............ 36 8.5. Outstanding SME loans by maturity ........................................................................................... 36 8.6. Outstanding loans by company size ............................................................................................ 37 8.7. Loans to all companies, by currency ........................................................................................... 37 8.8. Loans to all companies, by type of currency and by company size ............................................ 38 8.9. Total loans by sector ................................................................................................................... 39
References ............................................................................................................................................ 40

4 │
Foreword
This Compendium presents a snapshot of Ukraine’s SME sector, based on official business
statistics produced by the State Statistical Service of Ukraine (Ukrstat,
www.ukrstat.gov.ua).
The need to enhance the availability of and accessibility to official SME statistics was
highlighted by the 2015 Small Business Act for Europe (SBA) assessment as a main
priority for improving the design, monitoring and evaluation of SME policies in Ukraine
(SME Policy Index: Eastern Partner Countries 2016, OECD et al., 2015). Building on these
findings, the Ministry of Economic Development and Trade (MoEDT) of Ukraine
requested the OECD’s assistance to improve the country’s capacity to collect, analyse and
disseminate official business statistics, in particular statistics needed to measure SME
performance and, as relevant, suitable for international comparisons.
The work was carried out jointly by the Global Relations Secretariat and Statistics and Data
Directorate of the OECD in the framework of the multi-country project EU4Business:
From Policies to Action, conducted by the OECD in the Eastern Partnership with the
financial support of the European Union within the EU4Business initiative.
The OECD organised two statistical workshops in Kyiv (on 13 March 2018 and 3 October
2018) discussing the production of structural and demographic business statistics, the
linking of business data from different datasets, the dissemination of statistical information,
and the international comparability of business statistics produced by Ukrstat. Also,
throughout the project Ukrstat shared relevant business statistics with the OECD and the
two parties discussed the technical details of data exchange formats that could allow the
inclusion of Ukrainian business statistics in the OECD Structural and Demographic
Business Statistics (SDBS) database.
Throughout the project, and in order to review information needs and data availability, the
OECD held a series of meetings with officials and experts in government agencies and
other interested parties, including: the Ministry of Economic Development and Trade
(MoEDT); the State Statistical Service of Ukraine; SME Development Office (SMEDO);
the EU Delegation to Ukraine, representatives of the European Commission and the
EU4Business project.

│ 5
Acknowledgements
This publication was prepared by the OECD Statistics and Data Directorate. The chapter
presenting data on financing was prepared by the OECD Centre for Entrepreneurship,
SMEs, Regions and Cities.
The OECD is grateful to the State Statistical Service of Ukraine (Ukrstat) for their
cooperation, in particular:
Ms. Irina Zhuk, Deputy Chair of the State Statistics Service of Ukraine;
Ms. Tetyana Zakharova, Head of Division of Structural surveys, Department of Structural
Statistics and Financial indicators of Enterprises;
Ms. Olena Timofeeva, Deputy Director of the Department - Head of the Division of
Statistical Classifications, Department of Statistical Infrastructure;
Ms. Olga Ponomarenko, Head of Division of Statistical Registers, Department of statistical
infrastructure;
Ms. Nadiia Myhailiuk, Head of Transport and Communications Statistics Division,
Department of Statistics of Services;
Ms. Larysa Matronych, Head of Division for Statistics of Foreign Trade of Goods,
Department of Trade Statistics;
as well as their teams and all departments involved in the production of structural and
demographic business statistics.
Statistics on SME financing were provided by the National Bank of Ukraine (NBU), by
Mr. Yuriy Polovniov, Head of Statistics and Reporting Department; Mr. Kostyantyn
Korotkov, Head of the Department of reporting of deposit-taking corporations and interest
rate statistics of the Financial Sector Statistics Division of the Department of Statistics and
Reporting; Ms. Anna Liubymova, Chief Economist, Office for European Integration and
International Programs.
We are grateful to the Government of Ukraine for guidance on policy priorities and data
needs, expressly to:
Mr. Dmytro Shevchuk, General Director of the Directorate of public policies, Cabinet of
Ministers of Ukraine,
Mr. Denis Gutenko, Director of the Department for Entrepreneurship Development and
Regulatory Policy, Ministry of Economic Development and Trade (MoEDT);
Mr. Andriy Slabinskiy, Head of SME Policy Coordination and SME Support Infrastructure
Unit, SME Development Office (SMEDO);
Mr. Olexander Palazov, Deputy Director of Department of Entrepreneurship Development
and Regulatory Policy, Head of Directorate of Entrepreneurship, MoEDT;
Mr. Daniil Menshykov, Deputy Head of Directorate of Entrepreneurship – Head of
Division of Entrepreneurship Development, Department of Entrepreneurship Development
and Regulatory Policy, MoEDT;
Mr. Andrii Remizov, Chief Specialist of Division of Entrepreneurship Development,
Directorate of Entrepreneurship, Department of Entrepreneurship Development and
Regulatory Policy, MoEDT.

6 │
Special thanks go to Ms. Olena Kravchenko, Advisor on SME Statistics and Monitoring
SMEDO, for her collaboration with data processing and analysis.

│ 7
Measuring the SME sector in Ukraine
The State Statistics Service of Ukraine (Ukrstat) produces a rich collection of business
statistics. In order to satisfy the demand from different stakeholders, several sets of business
statistics are compiled, providing breakdowns of data that are typically not produced in
other countries. For example, this is the case of structural business statistics identifying
SMEs on the basis of both the number of employees and turnover.
The OECD Statistics and Data Directorate conducted a review of SME data in Ukraine,
encompassing statistics provided to the OECD by the State Statistics Service of Ukraine as
well as data published on the website of the State Statistics Service of Ukraine and in the
statistical publication “Activity of Large, Middle-Size, Small and Micro-entrepreneurship
entities, 2017”. The review was meant to:
i. Identify relevant variables for the analysis of the SME sector not yet compiled
ii. Suggest action for improving the dissemination of business statistics;
iii. Draw attention to issues of international comparability of data.
About legal definitions of SMEs and definitions for statistical purposes
The State Statistics Service of Ukraine compiles and publishes several sets of business
statistics, following different approaches for the identification of enterprises of different
sizes (for instance, SMEs versus large enterprises) or characteristics (for instance,
individual entrepreneurs versus legal entities). In that context Ukrstat produces a set of
enterprise statistics that reflects the Ukrainian definition of SMEs for legal purposes, which
rests on thresholds for both employment and turnover.
Across OECD countries, the common practice adopted is to distinguish between legal
definitions of SMEs that are used for administrative purposes and a statistical definition of
SME for the purpose of the production of official business statistics.
From a legal perspective, requirements to qualify as SMEs in order to obtain government
support and/or exemptions typically include:
‒ size threshold(s) with respect to specific dimensions (e.g. employment, turnover,
total assets),
‒ resources of the enterprise, i.e. independent or owned by, linked to or partnered
with other enterprises.
For instance, in the European Union the official definition of SMEs is based on three
criteria that combine employment, asset and turnover thresholds. In addition, an SME
should satisfy a requirement of independence from other entities. For statistical purposes
however, the EU recommendation indicates the size of employment for identifyig a firm as
micro, small, medium or large.1
1 EC Recommendation of 6 May 2003 concerning the definition of micro, small and medium-sized
enterprises, C(2003) 1422; and The new SME definition, User guide and model declaration.
European Commission. EN NB-60-04-773-EN-C 92-894-7909-4.

8 │
From a statistical perspective, the implementation of multiple criteria for the compilation
of SME statistics adds complexity to data production and reduces the scope for
international comparisons (e.g. as typically countries would adopt a different mix of
criteria).
For statistical purposes, where data coverage, consistency over time and international
comparability are key, it is therefore preferable to apply only one criterion for identifying
the size of an enterprise, with the recommended criterion being employment. In fact, as
concerns the use of “turnover” to define a firm’s size, it should be noted that any change in
financial thresholds would jeopardise the consistency of data series over time. In the case
of Ukraine, this problem is exacerbated by the fact that financial thresholds are currently
expressed in Euros and not in the national currency. Also, international comparisons are
difficult when financial thresholds are applied in national statistics, in particular due to
varying inflation rates and exchange rates in each country.

│ 9
Preliminary recommendations on development of data on SMEs and entrepreneurship
The State Statistics Service of Ukraine produces a comprehensive set of structural business statistics,
is advancing in the development of business demography statistics, and already started preparatory
work to link business registers and trade statistics. The review of currently available statistics on
small and medium sized enterprises and entrepreneurship identified suggested areas for further
improvements; these include:
A. Data breakdowns
a. For structural business statistics tabulated according to the number of persons employed
only, it is recommended to produce additional variables besides number of enterprises,
number of persons employed, turnover and value added; when possible, these statistics
should be presented also broken down by regions.
b. Provide additional breakdown for business demography statistics, e.g. the 1-9 size class
should be split into two classes, 1-4 and 5-9 employees, to distinguish very small units.
B. Compilation of data for new variables
a. For business demography, produce indicators of high-growth enterprises and employer
enterprises.
b. Develop data on trade activities by enterprise characteristics.
c. Produce regional statistics also based on establishment as statistical unit, to improve the
measurement of regional distribution of employment and economic activity.
C. Data dissemination
a. Implement international best practice principles for data dissemination (see
Recommendation of the OECD Council on Good Statistical Practice, 2015 and the
European Statistics Code of Practice, 2017).
b. Further improve data users’ awareness of, and access to, online tools and sources already
available.
Concerning data on SME and entrepreneurship financing, it is recommended that Ukraine join the
OECD Financing SMEs and Entrepreneurs Scoreboard to benefit from the sharing of good
measurement practices. The following specific actions are recommended to the National Bank of
Ukraine, and other government administrations as relevant:
c. Collect, if available, historical data for SME lending volumes, maturities and currencies.
d. Collect from lending institutions a regional breakdown for credit statistics.
e. Clarify the interpretation of credit statistics for “individual entrepreneurs”.
f. Collect data from courts on bankruptcies and from lending institutions on non-performing
loans for both large enterprises and SMEs.
g. Create a survey on SMEs’ credit conditions, based on good practices from other countries.
h. Publish data on government programmes for SMEs, such as the number of beneficiaries,
a more detailed breakdown of the budget, and, if possible, its impact.
i. Further improve data users’ awareness of the website of the National Bank of Ukraine.

10 │
Reader’s Guide
The Compendium of SME statistics of Ukraine presents a selection of key indicators of the
structure and performance of the Ukrainian business sector. It is compiled based on
statistics produced by the State Statistics Service of Ukraine (www.ukrstat.gov.ua); for
international comparisons data are drawn from the OECD Structural and Demographic
Business Statistics database (http://dx.doi.org/10.1787/sdbs-data-en).
Statistical units
Ukrstat uses the legal unit as statistical unit for the production of business statistics.
Statistics based on legal units may however overstate the number of enterprises compared
to the business population resulting from the use of the concept of “enterprise”, defined as
follows: “the enterprise is the smallest combination of legal units that is an organisational
unit producing goods or services, which benefits from a certain degree of autonomy in
decision-making, especially for the allocation of its current resources. An enterprise
carries out one or more activities at one or more locations. An enterprise may be a sole
legal unit” (Eurostat-OECD Manual on Business Demography Statistics, 2007).
The enterprise counts cover active enterprises defined as those who have employment
and/or turnover during the reference year.
Business employment is measured by Ukrstat both with the number of employees and the
total number of persons employed.
What proportion of employees and self-employed in a firm?
Evidence across countries shows that the number of self-employed (for instance,
unpaid family workers) accounts for a low share of total employment in large firms,
while their number reaches significant proportions in micro-enterprises.
The magnitude of these differences varies however across countries and economic
activities. For example, in 2016 in the Czech Republic the number of persons
employed in micro firms operating in the manufacturing sector was around three
times the number of employees; in the United Kingdom, it was only about 6%
higher.
Size class breakdown
Data are presented in this Compendium according to the following employment size
breakdown:
- micro enterprises (1 to 9 persons employed, including individual enterprises), small
(10 to 49 persons employed), medium (50 to 249 persons employed) and large
enterprises (250 and more persons employed).

│ 11
Monetary variables
Monetary variables are presented in current prices in national currencies, or converted to
USD at average annual exchange rates.
Country codes
The figures in this publication use ISO codes (ISO3) for country names as listed below.
AUT Austria ISR Israel
BEL Belgium ITA Italy
BGR Bulgaria LTU Lithuania
CHE Switzerland LUX Luxembourg
CZE Czech Republic LVA Latvia
DEU Germany NLD Netherlands
DNK Denmark NOR Norway
ESP Spain NZL New Zealand
EST Estonia POL Poland
FIN Finland PRT Portugal
FRA France ROU Romania
GBR United Kingdom SVK Slovak Republic
GRC Greece SVN Slovenia
HRV Croatia SWE Sweden
HUN Hungary TUR Turkey
ISL Iceland UKR Ukraine
Economic activity sectors
Data for Ukraine in this Compendium generally cover the business economy, namely, ISIC
rev.4 section B to N, the sector S95, excluding the sector K - financial intermediation
services. Data do not include the agriculture sector.
Also, as indicated by the data source “State Statistics Service of Ukraine”, data do not cover
banks and budget organizations, the temporarily occupied territories of the Autonomous
Republic of Crimea, the city of Sevastopol and part of the anti-terrorist operation zone.
Regional data are available for the total economy, including financial intermediation
services, except for turnover, for which data by regions do not cover banks.

12 │
International Standard of Industrial Classifications (ISIC) Revision 4
A (01-03) Agriculture, forestry and fishing
B (05-09) Mining and quarrying
C (10-33) Manufacturing
D (35) Electricity, gas, steam and air conditioning supply
E (36-39) Water supply; sewerage, waste management and remediation activities
F (41-43) Construction
G (45-47) Wholesale and retail trade; repair of motor vehicles and motorcycles
H (49-53) Transportation and storage
I (55-56) Accommodation and food service activities
J (58-63) Information and communication
K (64-66) Financial and insurance activities
L (68) Real estate activities
M (69-75) Professional, scientific and technical activities
N (77-82) Administrative and support service activities
O (84) Public administration and defence; compulsory social security
P (85) Education
Q (86-88) Human health and social work activities
R (90-93) Arts, entertainment and recreation
S (94-96) Other service activities
S95 Repair of computers and personal and household goods
T (97-98) Activities of households as employers; undifferentiated goods- and services-producing activities of households for own use
U (99) Activities of extraterritorial organizations and bodies
B-E (05-39) Industry, except construction
A-U (01-99) Total economy
Definitions
The following sources are used for definitions:
O UNECE (2015), Guidelines on Statistical Business Registers,
https://www.unece.org/fileadmin/DAM/stats/publications/2015/ECE_CES_39_W
EB.pdf.
O OECD (2010), Structural and Demographic Business Statistics, OECD Publishing,
Paris, http://dx.doi.org/10.1787/9789264072886-en.
O OECD (2007), Eurostat/OECD Manual on Business Demography Statistics”,
OECD Publishing, Paris, http://www.oecd.org/std/39974460.pdf .

│ 13
Active enterprise: An enterprise that had either turnover or employment at any time during
the reference period.
Employees: persons who work for an employer and who have a contract of employment
and receive compensation in the form of wages, salaries, fees, gratuities, piecework pay or
remuneration in kind.
Employer enterprise: An enterprise that had employees at any time during the reference
period.
Non-employer enterprise: An enterprise with no employees during the reference period.
Enterprise birth: The creation of a combination of production factors with the restriction
that no other enterprises are involved in the event. Births do not include entries into the
population due to mergers, break-ups, split-off or restructuring of a set of enterprises, or
simply due to a change of activity.
Enterprise birth rate: The rate corresponds to the number of enterprise births as a
percentage of the population of active enterprises.
Enterprise death: The dissolution of a combination of production factors with the
restriction that no other enterprises are involved in the event. Deaths do not include exits
from the population due to mergers, take-overs, break-ups or restructuring of a set of
enterprises, or due to a change of activity.
An enterprise is included in the count of deaths only if it is not reactivated within two years.
Similarly, a reactivation within two years is not counted as a birth.
Enterprise death rate: The rate corresponds to the number of enterprise deaths as a
percentage of the population of active enterprises.
Labour productivity: It is measured in this document as the ratio of value added to
employment.
Persons employed: the total number of persons who work in the observation unit (inclusive
of working proprietors and unpaid family workers, and partners working regularly in the
unit).
Turnover: The total value of invoices by the observation unit during the reference period
corresponding to market sales of goods or services supplied to third parties.
Value added: The difference between production and any intermediate consumption,
where production is measured at factor cost or basic prices.
Wages and salaries: all payments in cash or in kind payable to persons counted on the
payroll by way of remuneration for work done during the reference period.

14 │
Overview of the business sector in Ukraine
The overwhelming majority of Ukrainian firms in the business sector are small and medium-sized
enterprises (SMEs), similar to most countries across the world. In 2017, enterprises with less than
250 persons employed represented more than 99% of all enterprises in the business economy,
accounted for 61% of the total business employment and 54% of total turnover and 47% of value
added of the business sector.
96% of Ukrainian business enterprises are micro-enterprises, i.e. enterprises with less than ten
persons employed. Also, 83% of enterprises in the business sector are individual enterprises.
Number of enterprises, employment, turnover and value added by size class, business
economy excluding financial intermediation Percentage, 2017
Source: State Statistics Service of Ukraine.
89% of all enterprises operate in the services sector, accounting for about 45% of employment and
generating 56% of the value added. Close to half of the value added in business services are
generated in wholesale and retail trade sector.
In general, in all the economies, larger enterprises are more productive than smaller firms. This is
especially true in industrial sectors where large capital investments are required. Labour
productivity of large enterprises in Ukraine generally follows this pattern. Nevertheless, in the
construction industry, dominated by smaller enterprises, the productivity of small firms is similar
to that of large enterprises.
0
10
20
30
40
50
60
70
80
90
100
No. of enterprises No. of persons employed Turnover Value added at factor costs
1-9 10-49 50-249 250+

│ 15
Employment, turnover and value added share of SMEs, by industry Percentage, 2017
Note: SMEs are defined as enterprises with 1 to 249 persons employed.
Source: State Statistics Service of Ukraine.
In 2017, 14% of enterprises in total economy were located in the capital city Kiev, employing 24%
of the workforce. Also, 11% of all individual enterprises were in Kiev, and 25% of all legal entities.
The latter employed 30% of the workforce and generated 40% of the turnover in the total economy
of Ukraine.
Enterprise, employment and turnover share of the city of Kiev, by enterprise type Percentage, total economy, 2017
Note: The number of enterprises and the number of persons employed include data on banks. Legal entities
include all legal forms other than individual enterprises (natural person - entrepreneurs).
Source: State Statistics Service of Ukraine.
0
10
20
30
40
50
60
70
80
90
Employment Turnover Value added
at factor
costs
Employment Turnover Value added
at factor
costs
Employment Turnover Value added
at factor
costs
Industry Construction Services of business economy, excl.
financial intermediation
SMEs
Large enterprises
0
5
10
15
20
25
30
35
40
45
Legal entities Individual enterprises
No. of enterprises No. of persons employed Turnover

16 │
Key Indicators
1. Number of enterprises
1.1. Number of enterprises in business economy by size and activity sector, 2017
ISIC rev.4 Industry 1-9 10-49 50-249 250+ Total
B+C+D+E Industry, except construction
106 965 11 903 3 724 1 284 123 876
F Construction 44 534 4 943 694 90 50 261
G Wholesale and retail trade
818 268 17 013 2 078 438 837 797
H Transportation 90 615 4 036 933 231 95 815
I Accommodation 54 216 3 074 244 44 57 578
J Information 144 547 2 029 276 57 146 909
L Real estate 87 125 3 092 317 19 90 553
M Professional services
118 238 2 755 481 72 121 546
N Administrative services
42 408 3 280 753 112 46 553
B-N_x_K Business economy except financial and insurance activities
1 506 916 52 125 9 500 2 347 1 570 888
Source: State Statistics Service of Ukraine.
1.2. Recent trends of the number of enterprises, business economy
Employment size
2013 2014 2015 2016 2017
1-9 1 444 100 1 646 691 1 687 910 1 586 480 1 506 916
10-49 66 122 53 825 45 632 48 258 52 125
50-249 11 774 10 070 9 497 9 412 9 500
250+ 2 965 2 564 2 384 2 316 2 347
Total 1 524 961 1 713 150 1 745 423 1 646 466 1 570 888
Source: State Statistics Service of Ukraine.

│ 17
1.3. Structure of the business economy, recent years Percentage of all enterprises
Source: State Statistics Service of Ukraine.
0
10
20
30
40
50
60
70
80
90
100
2013 2014 2015 2016 2017
1-9 10-49 50-249 250+
94
95
96
97
98
99
100
2013 2014 2015 2016 2017
Magnified1-9 10-49 50-249 250+

18 │
1.4. Share of enterprises by size, business economy excluding financial intermediation,
Ukraine and selected OECD countries Percentage of all enterprises, 2016
Magnified
Source: State Statistics Service of Ukraine and OECD Structural and Demographic Business Statistics database.
0
10
20
30
40
50
60
70
80
90
1001-9 10-49 50-249 250+
75
80
85
90
95
1001-9 10-49 50-249 250+

│ 19
2. SME employment
2.1. Number of persons employed by sector and enterprise size, 2017 vs. 2016 2016 2017
SIC Activity sector SMEs Large SMEs Large
B+C+D+E Industry, except construction 832.7 1 518.8 864.7 1 469.5
F Construction 240.7 43.2 249.8 43.9
G Wholesale and retail trade 1 793.3 389.0 1 801.6 421.5
H Transportation 325.1 587.3 316.4 584.3
I Accommodation 180.8 27.1 194.4 29.8
J Information 217.6 65.2 235.1 68.0
L Real estate 227.0 8.5 222.8 9.9
M Professional services 268.2 43.5 264.8 40.5
N Administrative services 202.5 84.7 208.4 72.4
B-N_x_K Business economy except financial and insurance activities
4 287.9 2 767.3 4 358.0 2 739.8
A_S Total economy 5 093.5 3 014.8 5 187.2 2 953.8
Note: SMEs are defined as enterprises with 1 to 249 persons employed.
2.2. Number of persons employed, by size class, business economy Percentage
Source: State Statistics Service of Ukraine.
0
10
20
30
40
50
60
70
80
90
100
2013 2014 2015 2016 2017
1-9 10-49 50-249 250+

20 │
2.3. Number of persons employed, by size class, business economy, Ukraine and selected OECD countries Percentage, 2016
Source: State Statistics Service of Ukraine and OECD Structural and Demographic Business Statistics database.
0
10
20
30
40
50
60
70
80
90
100
UKR FRA DEU ROU FIN CHE POL NOR NZL ESP ITA LVA
1-9 10-49 50-249 250+

│ 21
3. SME turnover
3.1. Turnover by enterprise size and industry Million UAH
ISIC rev.4 Activity sector 1-9 10-49 50-249 250+ Total
B+C+D+E Industry, except construction 132 347 202 916 598 526 1 928 520 2 862 309
F Construction 58 178 78 755 61 363 38 202 236 497
G Wholesale and retail trade 766 177 754 315 806 502 1 024 192 3 351 186
H Transportation 63 274 57 187 81 860 276 693 479 014
I Accommodation 19 547 8 725 7 340 13 353 48 965
J Information 100 214 28 429 31 116 57 044 216 804
L Real estate 62 928 35 311 13 029 9 914 121 182
M Professional services 66 850 30 800 26 837 201 824 326 311
N Administrative services 29 198 18 404 18 587 14 869 81 057
B-N_x_K Business economy except financial and insurance activities
1 298 714 1 214 842 1 645 159 3 564 611 7 723 325
A_S Total economy 1 418 227 1 364 981 1 823 737 3 705 327 8 312 272
Source: State Statistics Service of Ukraine
3.2. Turnover by size class, industry, Ukraine and selected OECD countries Percentage, 2016
Source: State Statistics Service of Ukraine and OECD Structural and Demographic Business Statistics database.
0
10
20
30
40
50
60
70
80
90
100
UKR DEU POL FRA ROU NOR NLD FIN ESP ITA PRT
1-9 10-49 50-249 250+

22 │
3.3. Turnover by size class, wholesale and retail trade, comparison with OECD and other
countries Percentage, 2016
Source: State Statistics Service of Ukraine and OECD Structural and Demographic Business Statistics database.
0
10
20
30
40
50
60
70
80
90
1001-9 10-49 50-249 250+

│ 23
4. SME value added
4.1. Value added by size class, total economy Million UAH, 2017
ISIC rev.4 Activity sector 1-9 10-49 50-249 250+ Total
B+C+D+E Industry, except construction 45 169 50 156 139 103 592 185 826 614
F Construction 17 273 20 182 14 920 9 471 61 847
G Wholesale and retail trade 101 365 104 193 123 598 175 075 504 230
H Transportation 24 041 19 071 43 726 137 891 224 729
I Accommodation 5 066 2 730 4 287 3 118 15 201
J Information 33 631 12 480 20 798 38 648 105 557
L Real estate 38 076 22 311 8 027 6 347 74 761
M Professional services 29 063 14 706 15 073 82 730 141 572
N Administrative services 13 663 8 783 10 971 10 093 43 510
B-N_x_K Business economy except financial and insurance activities
307 348 254 612 380 503 1 055 558 1 998 021
A_S Total economy 373 661 323 300 457 681 1 102 656 2 257 297
Source: State Statistics Service of Ukraine.
4.2. Share of value added, by size class and activity sector Percentage, 2017
Source: State Statistics Service of Ukraine.
0
10
20
30
40
50
60
70
80
90
1001-9 10-49 50-249 250+

24 │
4.3. Value added by size class, Ukraine and selected OECD countries Percentage, 2016
Note: Data for Ukraine and Turkey refer to 2017.
Source: State Statistics Service of Ukraine and OECD Structural and Demographic Business Statistics database.
0
10
20
30
40
50
60
70
80
90
1001-9 10-49 50-249 250+

│ 25
5. Labour productivity of SMEs
5.1. Labour productivity, by activity sector Thousand UAH
Note: Labour productivity is measured as value added per person employed. SMEs are defined as enterprises
with 1 to 249 persons employed.
Source: State Statistics Service of Ukraine.
5.2. Labour productivity in industry, by size class, Ukraine and selected OECD countries
Thousand USD, 2016
Note: Labour productivity is measured as value added per person employed. Data for Ukraine and Turkey refer
to 2017.
Source: State Statistics Service of Ukraine and OECD Structural and Demographic Business Statistics database.
0
50
100
150
200
250
300
350
400
450
Industry, except construction Construction Services of the business economy
except activities of holding
companies
SMEs Large firms
0
20
40
60
80
100
120
140
160
UKR TUR POL PRT ESP ITA FRA GBR FIN SWE
1_9 10_49 50_249 250+

26 │
5.3. Labour productivity in ICT, Ukraine and selected OECD countries Thousand USD, 2016
Note: Labour productivity is measured as value added per person employed. Data for Ukraine and Turkey refer
to 2017. SMEs are defined as enterprises with 1 to 249 persons employed.
Source: State Statistics Service of Ukraine and OECD Structural and Demographic Business Statistics database.
5.4. Labour productivity in professional services industries,
Ukraine and selected OECD countries Thousand USD, 2016
Note: Labour productivity is measured as value added per person employed. Data for Ukraine and Turkey refer
to 2017. SMEs are defined as enterprises with 1 to 249 persons employed.
Source: State Statistics Service of Ukraine and OECD Structural and Demographic Business Statistics database.
0
50
100
150
200
250
300
UKR LVA POL HUN LTU TUR SVK CZE PRT SVN ESP ITA DEU AUT FRA SWE CHE
SMEs Large
0
50
100
150
200
250
300
UKR TUR HUN LTU POL SVK PRT CZE SVN ESP ITA DEU FRA SWE CHE
SMEs Large

│ 27
6. Entrepreneurial dynamism
6.1. Enterprise birth and death rates, by activity sector, 2015 Number of enterprise births as percentage of active enterprises
Source: State Statistics Service of Ukraine.
6.2. Enterprise birth and death rates, industry, Ukraine and selected OECD countries Number of enterprise births as percentage of active enterprises, 2015
Source: State Statistics Service of Ukraine and OECD Structural and Demographic Business Statistics database.
0
2
4
6
8
10
12
14
16
18
20Birth rate Death rate
0
2
4
6
8
10
12
14
16
18Enterprise birth rate Enterprise death rate

28 │
6.3. Enterprise birth rates, by size, Ukraine and selected OECD countries Number of enterprise births as percentage of active enterprises, 2015
Source: State Statistics Service of Ukraine and OECD Structural and Demographic Business Statistics database.
6.4. Enterprise death rates, by size, Ukraine and selected OECD countries Number of enterprise deaths as percentage of active enterprises, 2015
Source: State Statistics Service of Ukraine and OECD Structural and Demographic Business Statistics database.
0
5
10
15
20
25
30
UK
R
NL
D
AU
T
BE
L
CZ
E
DE
U
GR
C
FR
A
SV
K
SV
N
ITA
CH
E
SW
E
BG
R
TU
R
KO
R
LTU
HU
N
GB
R
PO
L
Totaleconomy
Business economy
Non-employers Micro enterprises Total
0
5
10
15
20
25
UK
R
BE
L
NL
D
DE
U
FR
A
SW
E
AU
T
CZ
E
SV
K
ITA
GR
C
SV
N
LTU
PO
L
HU
N
GB
R
Total economy Business economy
Micro enterprises Total Non-employers

│ 29
7. Regional statistics on enterprises
7.1. Share of enterprises by region, including individual enterprises Percentage, total economy, including banks 2017
Source: State Statistics Service of Ukraine.
7.2. Share of enterprises by region, legal entities Percentage, total economy, including banks 2017
Source: State Statistics Service of Ukraine.
City of Kyiv, 13.7
Kharkiv , 8.5
Dnipropetrovsk, 7.9
Odesa, 7.1
Lv iv, 6.1
Kyiv , 5.3
Zaporizhzhya, 4.3Vinnytsya, 3.8
Donetsk, 3.4
Poltava, 3.4
Khmelnytskiy , 3.2
Mykolay iv , 3.0
Cherkasy, 2.9
Zakarpattya, 2.9
Ivano-Frankivsk, 2.8
Zhytomyr, 2.8
Kherson, 2.5
Cherniv tsi, 2.4
Volyn, 2.3Sumy, 2.2
Chernihiv, 2.2Rivne, 2.1
Kirovograd, 2.0 Ternopil, 2.0 Luhansk, 1.2
city of Kyiv , 25.2
Kharkiv , 6.7
Dnipropetrovsk, 8.2
Odesa, 7.1
Lviv , 5.3Kyiv , 5.7Zaporizhzhya, 4.3
Vinnytsya, 2.7
Donetsk, 3.1
Poltava, 3.0
Khmelnytskiy, 2.1
Mykolay iv , 3.2
Cherkasy, 2.6
Zakarpattya, 1.7
Ivano-Frankivsk, 2.3
Zhytomyr, 1.9
Kherson, 2.4
Cherniv tsi, 1.2 Volyn, 1.7
Sumy, 1.7
Chernihiv , 1.7
Rivne, 1.6
Kirovograd, 2.3 Ternopil, 1.4 Luhansk, 1.0

30 │
7.3. Number enterprises by region, by legal form Total economy, including banks 2017
Source: State Statistics Service of Ukraine.
7.4. Share of legal entities by region Percentage, total economy, including banks 2017
Source: State Statistics Service of Ukraine.
0
20 000
40 000
60 000
80 000
100 000
120 000
140 000
160 000
180 000ci
ty o
f Kyi
v
Kha
rkiv
Dni
prop
etro
vsk
Ode
sa
Lviv
Kyi
v
Zap
oriz
hzh
ya
Vin
nyts
ya
Don
etsk
Pol
tava
Khm
eln
ytsk
iy
Myk
olay
iv
Che
rkas
y
Zak
arpa
ttya
Ivan
o-F
rank
ivsk
Zhy
tom
yr
Khe
rson
Che
rniv
tsi
Vol
yn
Sum
y
Che
rnih
iv
Riv
ne
Kiro
vogr
ad
Ter
nopi
l
Luha
nsk
Legal entities Individual entrepreneurs
0
5
10
15
20
25
30
35Share of legal entities (%)

│ 31
7.5. Number of persons employed, by region, including individual enterprises Percentage, total economy, including banks, 2017
Source: State Statistics Service of Ukraine.
7.6. Number of persons employed, by region, legal entities Percentage, total economy, including banks, 2017
Source: State Statistics Service of Ukraine.
City of Kyiv, 24.0
Dnipropetrovsk, 9.7
Kharkiv ,
6.8Lviv,
5.5
Odesa, 5.2
Kyiv
, 5.1Zaporizhzhya, 4.4
Donetsk, 4.2
Poltava, 3.7
Vinnytsya, 2.9
Cherkasy, 2.5
Zhytomyr, 2.3
Khmelnytskiy, 2.3
Mykolayiv, 2.2
Sumy, 2.1
Ivano-Frankivsk, 2.0
Volyn,
2.0
Chernihiv, 1.9
Zakarpattya, 1.8 Rivne, 1.8
Kirovograd, 1.7
Kherson, 1.7 Ternopil,
1.6
Luhansk, 1.5 Chernivtsi, 1.3
City of Kyiv , 29.6
Dnipropetrovsk, 10.3
Kharkiv , 6.0Kyiv,
5.1
Lviv , 5.1
Odesa, 4.7
Donetsk, 4.5
Zaporizhzhya, 4.4
Poltava, 3.7
Vinnytsya, 2.4
Cherkasy, 2.2
Mykolay iv, 2.0
Zhytomyr, 2.0
Sumy, 1.9
Khmelnytskiy , 1.8 Volyn, 1.7
Chernihiv, 1.7
Luhansk, 1.6
Kirovograd, 1.6
Ivano-Frankivsk, 1.5 Rivne, 1.4
Kherson, 1.4 Zakarpattya, 1.4
Ternopil, 1.2 Cherniv tsi, 0.8
32 │
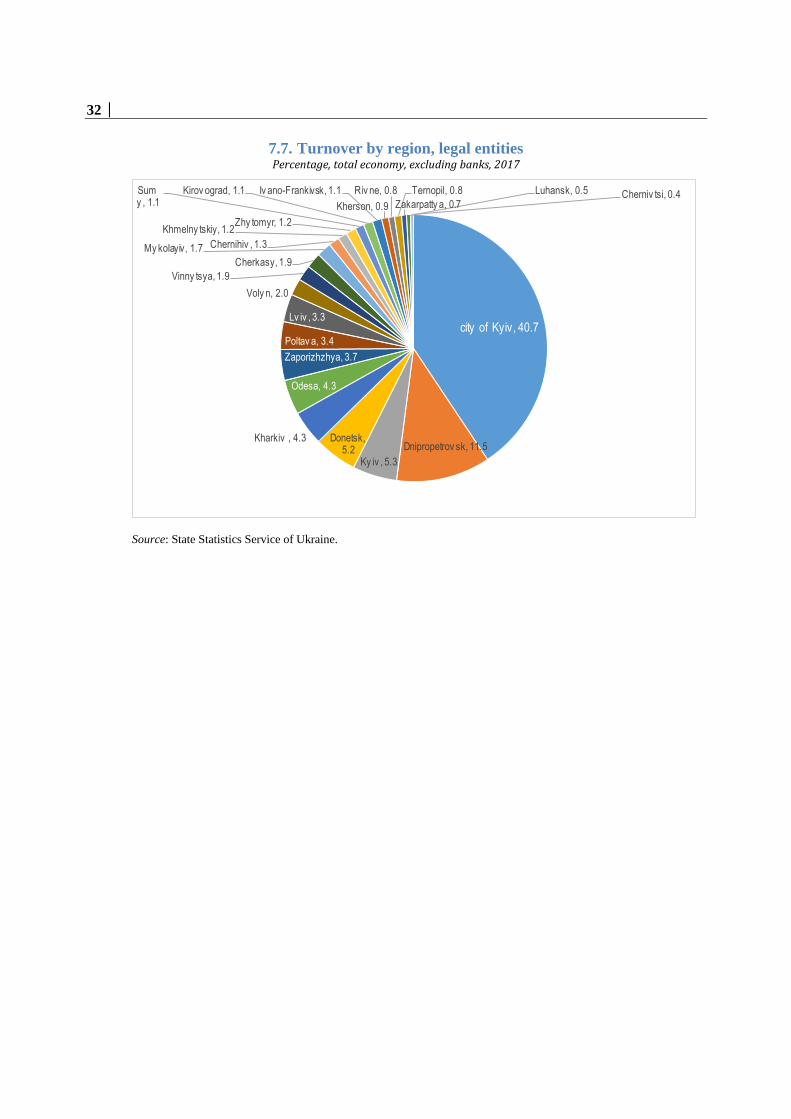
7.7. Turnover by region, legal entities Percentage, total economy, excluding banks, 2017
Source: State Statistics Service of Ukraine.
city of Kyiv, 40.7
Dnipropetrov sk, 11.5
Ky iv , 5.3
Donetsk, 5.2
Kharkiv , 4.3
Odesa, 4.3
Zaporizhzhya, 3.7
Poltav a, 3.4
Lv iv , 3.3
Voly n, 2.0
Vinny tsya, 1.9
Cherkasy, 1.9
My kolayiv, 1.7 Chernihiv , 1.3
Khmelny tskiy, 1.2Zhy tomyr, 1.2
Sumy , 1.1
Kirov ograd, 1.1 Iv ano-Frankivsk, 1.1
Kherson, 0.9
Riv ne, 0.8 Ternopil, 0.8
Zakarpatty a, 0.7
Luhansk, 0.5 Cherniv tsi, 0.4

│ 33
8. SME and corporate financing
Outstanding business loans (stock of loans) were heavily affected by three years of
(2013-15) recession, four years (2014-17) of annual inflation figures over 10% and
by large exchange rate fluctuations. The inflation-adjusted loan figures show a
decrease of -17.4% in 2017, more than any other country participating in the OECD
Financing Scoreboard. 2013 was the last year during which outstanding business
loans increased in Ukraine.
Adjusted for inflation, new business loan decreased by -20.3% in 2017, after an
increase of 1.8% in 2016.
The share of SME loans over total outstanding business loans reached 52.4% in
2017, a higher share than in most countries participating in the OECD Financing
Scoreboard (and especially high compared to other middle income countries).
51% of outstanding business loans were long-term loans (with a maturity superior
to a year) in 2018, below the Scoreboard average of 77.6%, suggesting that either
demand or supply for long-term loans is subdued.
53.7% of all outstanding business loans were denominated in Hryvnia, followed by
the US dollar and the Euro. The Agriculture, forestry and fishing and the Wholesale
and retail trade sectors were among the sectors borrowing mainly in local currency
in 2018. On the contrary, companies operating in the Mining and quarrying, as well
as in the Electricity, gas, steam and air conditioning industries were borrowing
mainly in foreign currencies. In general, the smaller the company, the more likely
they are to borrow in local currency.
Interest rates for SME loans reached 16.0% in 2017 (well above the Scoreboard
median of 3.80%), following the rapid increase of the National Bank of Ukraine’s
interest rate between 2013 and 2015 in order to tackle inflation. On average, interest
rates were higher for loans denominated in Hryvnia.
The interest rate spread between loans to SMEs and large enterprises reached 2.50
percentage points in 2017. This relatively high spread could be explained by an
elevated default rate of SMEs, or by a potential concentration of SMEs in sectors
that were heavily affected by the recession.

34 │
8.1. Outstanding business loans growth, all companies Year-on-year growth in percent, 2017
8.2. SME outstanding loans as a share of total outstanding loans, 2017 Percentage
Note: Definitions differ across countries. Detailed information on sources and definitions is available in the full country
profiles. Data are adjusted for inflation using the OECD GDP deflator. For non-OECD countries, the deflator was
extracted from the World Bank World Development Indicators.
Source: Data compiled from the individual country profiles of Financing SMEs and Entrepreneurs 2019 and from the
National Bank of Ukraine
-20
-15
-10
-5
0
5
10
15
20
25
2017 2016
-40
-30
-20
-10
0
10
20
30
40
2008 2009 2010 2011 2012 2013 2015 2015 2016 2017
Outstanding business loans growth rate in Ukraine
0
10
20
30
40
50
60
70
80
90
100

│ 35
8.3. New business loans growth, all companies Year-on-year growth in percent, 2017
Note: Definitions differ across countries. Detailed information on sources and definitions is available in the full country
profiles. Data are adjusted for inflation using the OECD GDP deflator. For non-OECD countries, the deflator was
extracted from the World Bank World Development Indicators.
Source: Data compiled from the individual country profiles of Financing SMEs and Entrepreneurs 2019 and from the
National Bank of Ukraine
-35
-25
-15
-5
5
15
25
35
2017 2016
-40
-30
-20
-10
0
10
20
30
2008 2009 2010 2011 2012 2013 2015 2015 2016 2017
New business loans growth rate in Ukraine

36 │
8.4. SME interest rate and interest rate spreads between loans to large firms and to SMEs. Percentage (first figure) and percentage points (second figure), 2017
Note: Definitions differ across countries. Detailed information on sources and definitions is available in the full
country profiles. The data refer to nominal interest rates.
Source: Data compiled from the individual country profiles of Financing SMEs and Entrepreneurs 2019 and
from the National Bank of Ukraine
8.5. Outstanding SME loans by maturity As a share, 12 months average to the end of October 2018
Source: Data compiled from the National Bank of Ukraine.
0
5
10
15
20
25
30SME interest rate
0
1
2
3
4
5
6
7Interest rate spread16 15
up to 1 year
49%over 1 year and
up to 5 years31%
over 5 years
20%

│ 37
8.6. Outstanding loans by company size As a share of total loans, 12 month average as of the end of October 2018
Source: Data compiled from the National Bank of Ukraine
8.7. Loans to all companies, by currency As a share of total loans, 12 month average as of the end of October 2018
Source: Data compiled from the National Bank of Ukraine
Large companies
41%
Medium-sized
enterprises28%
Small enterprises
14%
Individual
entrepreneurs17%
Hryvnia55%
US dollar38%
Euro7%
Russian ruble0.06%
other0.03%
Other0.09%

38 │
8.8. Loans to all companies, by type of currency and by company size As a share of total loans, 12 month average as of the end of October 2018
Source: Data compiled from the National Bank of Ukraine
45.87%
54.13%
Large enterprises
national currency foreign currency
52.54%
47.46%
Medium-sized enterprises
national currency foreign currency
51.45%
48.55%
Small enterprises
national currency foreign currency
75.34%
24.66%
Micro enterprises
national currency foreign currency

│ 39
8.9. Total loans by sector
millions of hryvnias Percentage of
total outstanding loans
Share of loans in local
currency
Share of long term
loans*
Total 890,169.02 100.00% 53.25% 19.76%
Agriculture, forestry and fishing 71,337.37 8.01% 76.14% 24.33%
Mining and quarrying 9,609.13 1.08% 17.86% 7.88%
Manufacturing 225,552.87 25.34% 27.36% 16.47%
Electricity, gas, steam and air conditioning supply
59,706.55 6.71% 19.81% 33.77%
Water supply; sewerage, waste management and remediation activities
2,932.51 0.33% 43.15% 0.21%
Construction 43,374.37 4.87% 67.34% 47.56%
Wholesale and retail trade; repair of motor vehicles and motorcycles
296,529.83 33.31% 77.05% 8.82%
Transportation and storage 40,215.55 4.52% 35.98% 15.66%
Accommodation and food service activities 2,579.45 0.29% 55.02% 12.40%
Information and communication 8,354.46 0.94% 91.21% 3.80%
Real estate activities 70,455.39 7.91% 44.12% 57.24%
Professional, scientific and technical activities
47,265.27 5.31% 47.52% 10.32%
Administrative and support service activities
10,117.35 1.14% 72.88% 8.76%
Education 18.16 0.00% 90.52% 19.00%
Human health and social work activities 1,384.21 0.16% 41.77% 46.41%
Arts, entertainment and recreation 302.61 0.03% 28.03% 2.94%
Other service activities 433.94 0.05% 86.59% 6.78%
Note: *With maturities of more than 5 years.
Source: Data compiled from the National Bank of Ukraine.

40 │
References
Ukrstat (2018), Activities Of Large, Medium, Small And Micro-Enterepreneurship Entities
2017, http://www.ukrstat.gov.ua/druk/publicat/kat_u/2018/zb/11/zb_dsp_2017.pdf.
OECD Structural and Demographic Business Statistics database, November 2018,
http://dx.doi.org/10.1787/sdbs-data-en.
OECD (2010), Structural and Demographic Business Statistics, OECD Publishing, Paris,
http://dx.doi.org/10.1787/9789264072886-en.
OECD (2007), Eurostat/OECD Manual on Business Demography Statistics”, OECD
Publishing, Paris, http://www.oecd.org/std/39974460.pdf .
UNECE (2015), Guidelines on Statistical Business Registers,
https://www.unece.org/fileadmin/DAM/stats/publications/2015/ECE_CES_39_WEB.pdf .
OECD Entrepreneurship at a Glance, several editions, https://www.oecd-
ilibrary.org/industry-and-services/entrepreneurship-at-a-glance_22266941 .
OECD (2018), Entrepreneurship at a Glance Highlights
2018, https://www.oecd.org/sdd/business-stats/EAG-2018-Highlights.pdf .
OECD (2018), Financing SMEs and Entrepreneurs 2018: An OECD Scoreboard, OECD
Publishing, Paris, http://dx.doi.org/10.1787/fin_sme_ent-2018-en.