Embed Size (px)
Citation preview

Comparisons of areas fished by the Japanese and U.S. purse seine fleets in the central-western Pacific
Atilio L. Coan Jr. National Marine Fisheries Service
Southwest Fisheries Science Center La Jolla, CA 92038
Naozumi Miyabe
National Research Institute of Far Seas Fisheries Shimizu, Japan
June 1999
Working document for the 12th Standing Committee on Tuna and Billfish, Papeete, Tahiti, June 16-23, 1999.

1
Comparisons of areas fished by the Japanese and U.S. purse seine fleets in the central-western Pacific
Atilio L. Coan Jr.
National Marine Fisheries Service Southwest Fisheries Science Center
La Jolla, CA 92038
Naozumi Miyabe National Research Institute of Far Seas Fisheries
Shimizu, Japan
INTRODUCTION
Skipjack, (Katsuwonus pelamis), yellowfin (Thunnus albacares) and bigeye (T. obesus) tuna are caught throughout the central-western Pacific by distant-water purse seiners from Japan, Korea, Taiwan and the U.S. Most of this catch is sold to canneries and canned as light meat tuna. The canneries usually pay a different price for purse seine landings of skipjack and yellowfin tuna; however, yellowfin and bigeye tuna usually command the same price, except for large fish in the Japanese market. Therefore, because of this pricing differential and because yellowfin and bigeye tuna are difficult to distinguish, especially at smaller sizes, yellowfin and bigeye tunas are usually unloaded together and recorded as yellowfin tuna landings. Vessel captains also seldom differentiate between the two species in logbook records. The combination of bigeye tuna and yellowfin tuna landings has led to an underestimate of the bigeye tuna catch, an overestimate of the yellowfin tuna catch and a difficult situation for scientists who are trying to assess the status of these stocks.
In order to estimate the quantities of bigeye tuna that have been recorded as yellowfin tuna in the U.S.
purse seine landings, scientists from the National Marine Fisheries Service (NMFS) developed a species composition sampling program. The program was started in 1988, when a South Pacific Regional Tuna Treaty (SPTT) was negotiated between 16 island nations and the U.S. As part of the Treaty, port sampling was established in Pago Pago, American Samoa to collect logbook and landing information, measure catches and determine species composition of the catch. Japan started collecting species composition samples in 1994. However, the program is relatively new and sample sizes are low.
In 1997, at the 10th meeting of the Standing Committee of Tunas and Billfish of the Secretariat of the
Pacific Community, scientists decided that estimates of the bigeye tuna catch from all purse seine fleets were necessary. Procedures were developed to separate the bigeye tuna from yellowfin tuna landings based on the NMFS species composition sampling. For the period before and including 1988, NMFS species composition samples from 1989-1995 would be combined and used. For the period, 1989-1995, the NMFS species composition sample for each year would be used and, for the post 1995 period, NMFS species composition from 1989-1995 would again be used to correct catches of other fleets. Concerns related to biases of this procedure was expressed at the 11th SCTB and scientists from Japan and the U.S. were asked to investigate differences between the two fisheries, especially in regards to biases introduced if different areas are fished by the fleets.

3
The purpose of this paper is to investigate differences in areas fished by the U.S. and Japanese purse seine fleets in the central-western Pacific. Differences in areas fished by the two fleets are shown and the related appropriateness of using NMFS species composition samples to separate bigeye tuna from yellowfin tuna catches of the Japanese purse seine fleet is discussed. Catch and effort data from both fleets for the period 1981 to 1998, and NMFS species composition samples for 1989 to 1998, were used. Data for 1998 were still considered preliminary.
DATA AND METHODS
NMFS species composition samples were summarized by area strata (1°, 5°, 10°, 20°). Species composition samples were analyzed with an analysis of variance model to determine if the proportion of bigeye tuna in the reported yellowfin catch was significantly different between area strata. Area strata with NMFS species composition samples were compared to areas fished by the Japanese fleet to assess sampling coverage. Logbook data from both the U.S. and Japanese purse seine fisheries were summarized by number of sets and area strata. Comparisons between areas fished were done graphically and in tables by observing the percentages of area strata fished individually and by both fleets.
U.S. Purse Seine Fishery
The U.S. purse seine fleet in the central-western Pacific, during the period 1980 to 1998, varied
between 14 and 62 vessels (SPC 1998). Maximum vessel participation occurred in 1983. Since the SPTT, the number of vessels has been limited at 50 to 55 and the actual number of vessels fishing has varied between 31 and 49. The vessels were large purse seiners between 900 t and 1,800 t carrying capacity. The vessels were home ported in Tinian, Northern Marianas or in Pago Pago, American Samoa. However, as of 1996, most of the vessels home ported in American Samoa (Coan et. al. 1997). Nearly 90% of the catch was delivered to canneries in American Samoa. The rest was sent to other canneries in the Pacific region, Puerto Rico, or Europe. Logbook data were collected from 100% of the fleet for the period 1989 to 1998.
Logbook data, for 1981 to 1998, indicate that the U.S. fleet concentrated mainly on free-swimming
school fish sets until 1995. Starting in 1996 and continuing through 1998, the fleet switched to approximately 60% floating object sets (log and FADs) and 40% free-swimming school sets (Figure 1). Log sets dominated floating object sets until 1996 and 1997 when FAD sets were more dominant. The U.S. fleet fishes throughout the year. However, sets usually peak in June and September (Figure 2).
NMFS port sampling for species composition occurred in 1988 to 1998. Species composition
sampling is accomplished during size measurements. While drawing 50 fish for a length-frequency sample, if a species other than the targeted species for measurement is encountered, a 100 fish species composition sample is drawn. If no other species is encountered after drawing 50 fish for the length-frequency measurement, then the species composition is considered pure. Each fish in the 100 fish species composition sample is identified to species and measured for fork length. The number of samples, both mixed (samples containing yellowfin and bigeye tunas) and pure (samples of pure yellowfin or bigeye tuna), varied between 369 in 1998 and 621 in 1992 (Table 1). Samples were mainly from log and free-swimming school sets until 1996 when a large number of samples were also taken from FAD sets. Sampling coverage, the number of 1° squares with at least 1 species composition sample as a percent of the number

4
of 1° squares fished for yellowfin tuna, ranged from 32% in 1997 to 51% in 1989. As expected, sampling coverage increases with increases in area size. For 20° squares, sampling coverage was 100% for most years.
Japanese Purse Seine Fishery
The Japanese purse seine fleet in the central-western Pacific consists of a coastal element and a
distant-water/offshore element. The distant-water/offshore element during the period 1980 to 1998 varied between 16 and 39 vessels (SCTB 1998). Maximum vessel participation occurred in 1988, 1994 and 1995. The coastal element varied between 59 vessels in 1983 and 20 vessels in 1995. The vessels were large purse seiners between 135 t and 350 t gross registered tons and approximately 900 t carrying capacity. The vessels unloaded their catch in one of three major ports, Yaizu, Makurazaki or Yamagawa, Japan. About 30% of the catch was delivered to canneries in recent years. The rest was sent to the Sashimi market and for skipjack tuna to the Katsuobushi market. Logbook data were collected from nearly 100% of the distant-water/offshore fleet since the late 1970s.
Logbook data, for 1981 to 1998, indicated that the Japanese fleet concentrated approximately 60% of
its sets on log sets and 40 percent on school sets during the period 1983 to 1988 and from 1989 to 1998 the percentages were almost equal between log and school sets (Figure 1). The percentage of sets made on FADs was very low until 1997 and 1998 when the occurrence of these sets was approximately 5%. The Japanese fleet fishes throughout the year. However, sets usually peak in March, April and October (Figure 2).
During the period 1994 to 1998, the Japanese fleet was sampled for species composition through two
programs, on-board sampling by fishermen and port sampling. On-board sampling may not have accurately reflected the species composition as it was difficult to obtain a random sample of the catch. The annual number of samples was moderate, around 200 to 300 for on-board sampling and less than 50 for port sampling.
COMPARISONS
Species Composition
The proportion of bigeye tuna in NMFS species composition samples, between area strata, were significantly different (Table 2). The analysis of variance model showed the most significant effect was between 1° and 5° area strata. As the size of the area strata increased to 10° and 20°, the effect of area on the difference in bigeye tuna proportions decreased. Latitude effects were more significant than longitude effects for 1° and 5° area strata. Longitude effects became more significant than latitude effects for 10° and 20° area strata.
The percentages of area strata fished by the Japanese fleet that were sampled for species composition by NMFS varied between 8% and 63%, for 1° area strata (Table 3). As expected, the percentages improved (54% to 100%) with increased area strata size. The lowest percentage (1° area strata) was in 1993 and the highest in 1982. Higher percentages were obtained for the 1981 to 1988 and 1996 to 1997

5
periods, when species composition samples for 1989 to 1995 were used and thus more areas sampled. Many of the 1° area strata with NMFS species composition samples were not fished by the Japanese fleet (Figure 3). This is especially true if the composite of all species composition samples taken during 1989 to 1995 were compared to any year fished by the Japanese before 1989. Areas Fished
When 1° area strata with sets were compared, very few of the strata fished by the U.S. fleet were also
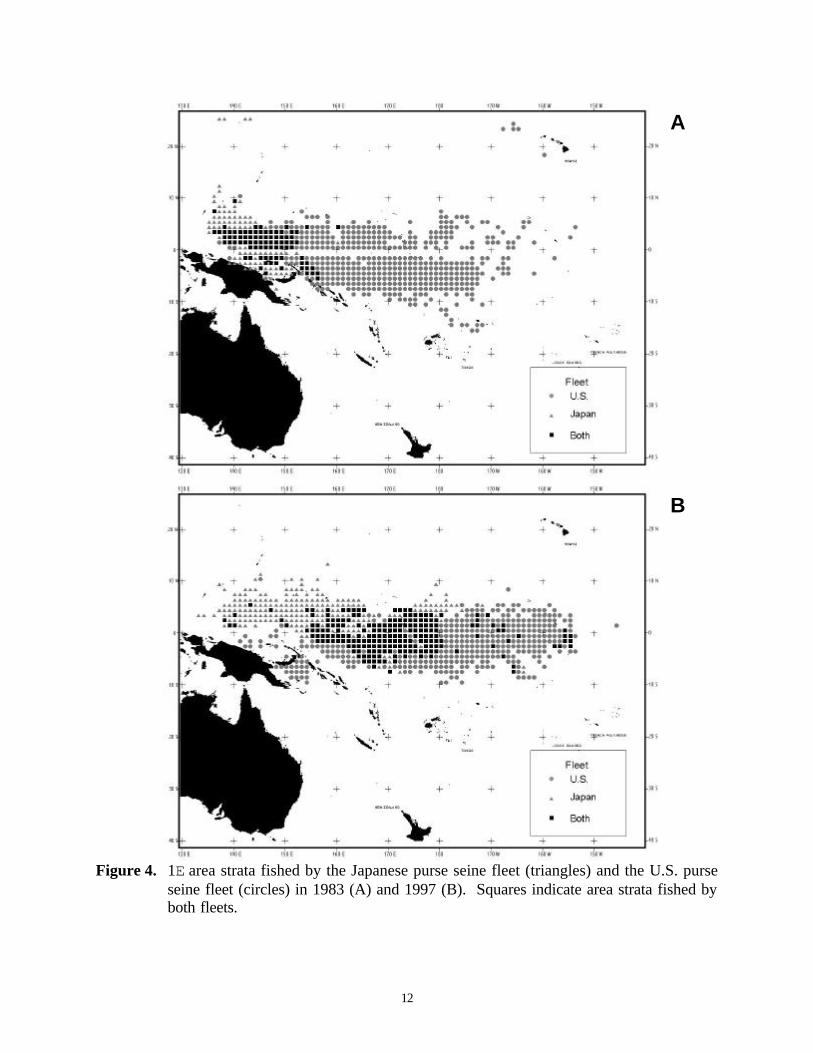
fished by the Japanese fleet (Table 4). The percent of strata fished by both fleets varied from 13% in 1983 to 40% in 1981. The number of strata fished by the U.S. varied between 179 and 555, for Japan between 169 and 417 and the number of strata fished by both fleets between 85 and 207. A closer look at the area strata fished by each country showed that the U.S. fleet fished area strata further to the east and Japanese fleet area strata further west and north (Figure 4). This was especially true during the early 1980s.
If 5° area strata with sets were compared, the percent of strata fished by both fleets varied from 21%
in 1983 to 63% in 1981 (Table 4). The number of strata fished by the U.S. varied between 27 and 63, for Japan between 17 and 47 and the number of strata fished by both fleets between 14 and 33.
If 10° area strata with sets were compared, the percent of strata fished by both fleets varied from 26%
in 1983 to 79% in 1997 (Table 4). The number of strata fished by the U.S. varied between 12 and 24, for Japan between 7 and 20 and the number of strata fished by both fleets between 6 and 15.
If 20° area strata with sets were compared, the percent of strata fished by both fleets varied from 38%
in 1983 to 90% in 1997 (Table 4). The number of strata fished by the U.S. varied between 6 and 11, for Japan between 3 and 11 and the number of strata fished by both fleets between 3 and 9.
CONCLUSIONS AND RECOMMENDATIONS
Statistically significant differences in the proportion of bigeye tuna in yellowfin tuna catches exist
between area strata sampled by NMFS. While the significance of this difference decreases with increased area strata size, the decrease is not enough to warrant safe substitution of composition samples between area strata. The Japanese fleet fished many 1° area strata that were not sampled for species composition by the NMFS. Also, many NMFS composition samples were taken in areas not fished by the Japanese fleet. Therefore any substitution of samples may lead to biases.
In general, the U.S. and Japanese purse seine fleets fished different area strata during the period 1981
to 1998. The differences between area strata fished by the two fleets was quite evident when considering 1° strata, and as expected, became less evident as area size increased to 20° strata. However, the percent of strata fished by both fleets topped 70% only in two years, 1997 and 1998, and was less than 65% for all other years and area strata. A closer look at the 1° area strata fished by the two fleets showed that, in general, the U.S. fleet fished areas farther east, the Japanese fleet areas farther west and north and both fleets fished areas between 5°N and 10°S and 160°E and 175°W (Figure 4).
Based on these results, it appears that substitution of species composition samples between fleets could
lead to inaccurate estimates of the actual bigeye tuna catch and, in turn, the actual yellowfin tuna catch.

6
However, since the NMFS species composition samples are the only data available for estimating the bigeye tuna catch from the purse seine fleets and removing this catch from the yellowfin tuna catch, the authors recommend the following.
1) Continue to maintain two sets of tables, one for adjusted yellowfin and bigeye tuna purse seine
catch and one for reported unadjusted yellowfin and bigeye tuna purse seine catch. These two sets of data will allow for corrections in the future, if a better procedure is found. The adjusted bigeye and yellowfin tuna catch should be used in analyses to place a range around the results based on the uncertainty of the yellowfin or bigeye tuna catch.
2) Use only NMFS species composition samples from areas fished by both fleets. For this example,
species composition samples taken from the eastern areas would not be used to obtain the Japanese purse seine bigeye tuna catch and to adjust the yellowfin tuna catch.
3) Encourage species composition sampling of all purse seine catches. Special emphasis could be
targeted at areas not sampled by NMFS. Analyze these samples for consistent differences in proportions of bigeye tuna in areas and adjust, if necessary, previous estimates of bigeye and yellowfin tuna catch.
LITERATURE CITED
Anonymous. Report of the Eleventh Meeting of the Standing Committee on Tuna and Billfish, 28 May
– 6 June 1998, Honolulu, Hawaii. Oceanic Fisheries Programme, South Pacific Commission, Noumea, New Caledonia. 108 pp.
Coan, A.L., G. Sakagawa, D. Prescott, and G. Yamasaki. 1997. The 1996 U.S. purse seine fishery
for tropical tunas in the central-western Pacific Ocean. Mar. Fish. Rev. 59(3):34-40.

Tab
le 1
. N
umbe
r of
Nat
iona
l M
arin
e Fi
sher
ies
Serv
ices
spe
cies
com
posi
tion
sam
ples
tak
en i
n di
ffer
ent
type
s of
set
s an
d ar
ea s
trat
a (1E,
5E,
10E
, 20E)
fro
m c
atch
es o
f U
.S.
purs
e se
iner
s in
the
cen
tral-
wes
tern
Pac
ific
198
9 to
199
8.
Spec
ies
com
posi
tion
sam
ples
inc
lude
mix
ed (
both
yel
low
fin
and
bige
ye t
una)
and
pur
e (y
ello
wfi
n or
big
eye
tuna
onl
y) s
ampl
es.
FAD
s ar
e fi
sh
aggr
egat
ing
devi
ces,
mai
nly
floa
ting
raft
s. N
umbe
r of
squ
ares
fis
hed
are
num
ber
of s
quar
es w
ith s
ets
on y
ello
wfi
n tu
na.
N
UM
BE
R O
F S
PE
CIE
S
CO
MP
OS
ITIO
N S
AM
PL
ES
(M
IXE
D
AN
D P
UR
E)
N
UM
BE
R
OF
1°°
AR
EA
S
N
UM
BE
R
OF
5°°
AR
EA
S
N
UM
BE
R
OF
10°°
AR
EA
S
N
UM
BE
R
OF
20°°
AR
EA
S
YE
AR
A
LL
LOG
FA
D
SC
H
OTH
S
AM
PL
ED
FIS
HE
D
SA
MP
LE
D
FIS
HE
D
SA
MP
LE
D
FIS
HE
D
SA
MP
LE
D
FIS
HE
D
19
89
57
6
245
1
4
258
59
116
22
7
29
34
10
12
6
6
1990
487
20
6
1
267
13
145
31
7
27
34
12
13
7
7
1991
508
17
2
0
319
17
132
26
3
29
33
10
11
6
6
1992
621
40
3
2
191
25
159
31
9
24
33
9
12
6
6
1993
560
33
6
1
186
37
131
30
0
23
31
11
12
6
6
1994
462
19
1
1
265
5
147
39
3
28
40
11
16
7
8
1995
489
25
3
5
218
13
121
31
8
29
38
12
14
6
7
1996
440
85
278
6
7
10
13
7
402
33
51
14
16
7
8
19
97
53
4
163
19
6
129
46
159
49
7
31
46
14
16
8
9
1998
369
15
4
107
8
5
23
12
9
338
21
34
9
15
7
7
6

Tab
le 2
. R
esul
ts o
f an
anal
ysis
of v
aria
nce
mod
el to
ass
ess
the
diff
eren
ces
betw
een
prop
ortio
ns o
f big
eye
tuna
from
Nat
iona
l Mar
ine
Fish
erie
s Se
rvic
e sp
ecie
s com
posi
tion
sam
ples
take
n of
U.S
. cen
tral-w
este
rn P
acifi
c pu
rse
sein
e ca
tche
s in
1989
to 1
998,
by
area
stra
ta (1E,
5E,
10E,
20E
). P
roba
bilit
y cl
ose
to z
ero
indi
cate
s si
gnifi
cant
diff
eren
ces
in e
ffec
ts.
Tab
le 3
. N
umbe
r of a
rea
stra
ta (1E,
5E,
10E
, 20E
) sam
pled
for s
peci
es c
ompo
sitio
n by
the
Nat
iona
l Mar
ine
Fish
erie
s Ser
vice
(NM
FS sa
mpl
ed),
num
ber o
f are
a st
rata
fish
ed b
y th
e Ja
pane
se p
urse
sein
e fle
et (J
apan
fish
ed) a
nd n
umbe
r of N
MFS
sam
pled
are
a st
rata
that
wer
e fis
hed
by th
e Ja
pane
se fl
eet (
Japa
n sa
mpl
ed).
Spe
cies
com
posi
tion
sam
ples
for t
he p
erio
d 19
89 to
199
5 w
ere
used
for 1
981
to 1
988
and
for
the
Japa
nese
flee
t in
1996
to 1
998.
7
1°5°
10°
20°
LATI
TUD
E0.
0005
70.
0028
50.
2677
30.
9172
3LO
NG
ITU
DE
0.09
320
0.10
104
0.13
530
0.00
003
AR
EA
0.03
499
0.02
288
0.50
823
0.71
874
PR
OB
AB
ILIT
YE
FF
EC
TS
U.S
.U
.S.
U.S
.U
.S.
SA
MP
LE
DF
ISH
ED
S
AM
PL
ED
PE
RC
EN
TS
AM
PL
ED
FIS
HE
D
SA
MP
LE
DP
ER
CE
NT
SA
MP
LE
DF
ISH
ED
S
AM
PL
ED
PE
RC
EN
TS
AM
PL
ED
FIS
HE
D
SA
MP
LE
DP
ER
CE
NT
1981
540
186
99
53.2
358
2221
95.4
519
8 7
87.5
010
65
83.3
319
8254
018
711
863
.10
5817
1482
.35
1910
770
.00
10 7
685
.71
1983
540
169
87
51.4
858
1713
76.4
719
10 6
60.0
010
74
57.1
419
8454
019
4 7
639
.18
5817
1482
.35
19 7
571
.43
10 3
310
0.00
1985
540
240
113
47.0
858
2521
84.0
019
9 6
66.6
710
54
80.0
019
8654
028
612
443
.36
5826
1973
.08
19 9
666
.67
10 5
480
.00
1987
540
304
142
46.7
158
3224
75.0
019
12 8
66.6
710
65
83.3
319
8854
028
2 9
834
.75
5826
1765
.38
1911
654
.55
10 6
583
.33
1989
116
260
22
8.46
2823
1252
.17
1010
660
.00
6 7
571
.43
1990
145
252
22
8.73
2629
1241
.38
1213
861
.54
7 8
562
.50
1991
132
288
43
14.9
329
3116
51.6
110
14 6
42.8
6 6
116
54.5
519
9215
927
6 4
315
.58
2438
1436
.84
918
844
.44
610
660
.00
1993
131
315
25
7.94
2347
1429
.79
1120
945
.00
610
660
.00
1994
147
356
41
11.5
228
3515
42.8
611
13 7
53.8
5 7
75
71.4
319
9512
131
1 3
711
.90
2835
1645
.71
1215
853
.33
6 8
562
.50
1996
540
333
133
39.9
458
3726
70.2
719
14 9
64.2
910
86
75.0
019
9754
041
723
656
.59
5845
3884
.44
1917
1482
.35
1010
990
.00
1998
540
396
219
55.3
058
4233
78.5
719
1612
75.0
010
77
100.
00
YE
AR
10 D
EG
RE
EJA
PA
N20
DE
GR
EE
JAP
AN
JAP
AN
1 D
EG
RE
E
JAP
AN
5 D
EG
RE
E

Tab
le 4
. N
umbe
r of
are
a st
rata
(1E
, 5E
, 10E
, 20E
) fi
shed
by
the
U.S
. an
d Ja
pane
se p
urse
sei
ne f
leet
in
the
cent
ral-w
este
rn P
acif
ic,
1981
to 1
998.
“B
OT
H”
indi
cate
s th
e nu
mbe
r of
are
a st
rata
fis
hed
by b
oth
flee
ts.
8
US
JAP
AN
BO
THU
SJA
PA
NB
OTH
US
JAP
AN
BO
THU
SJA
PA
NB
OTH
1981
179
186
104
2722
1912
8 7
8 6
519
8241
118
712
548
1714
1810
7 9
76
1983
549
169
85
6317
1424
10 7
11 7
519
8447
719
412
845
1717
21 7
7 8
33
1985
452
240
145
4725
2019
9 7
9 5
519
8636
528
616
342
2617
17 9
7 8
54
1987
358
304
95
3432
1514
12 7
6 6
419
8827
028
213
935
2617
1311
7 7
65
1989
284
260
108
3723
1612
10 6
6 7
519
9043
725
2 8
942
2917
1513
8 7
85
1991
415
288
148
4031
1614
14 8
711
719
9244
327
612
036
3820
1218
10 6
106
1993
395
315
92
3647
2214
2011
610
619
9455
035
617
746
3521
1913
9 9
75
1995
406
311
146
5135
2317
15 9
8 8
619
9650
733
313
355
3722
1714
8 8
85
1997
555
417
207
4945
3317
1715
910
919
9842
239
620
643
4227
1716
10 7
76
5 D
EG
RE
E10
DE
GR
EE
20 D
EG
RE
EY
EA
R1
DE
GR
EE

9
Figure 1. Percent of sets by set type for U.S. and Japanese purse seine fishery in the central-western
Pacific 1981-1998. FAD (fish aggregating device) sets are drifting rafts.
LOG SETS0
10
20
30
40
50
60
70
80
81 82 83 84 85 86 87 88 89 90 91 92 93 94 95 96 97 98
YEAR
PE
RC
EN
T S
ETS
U.S.
JAPAN
FREE-SWIMMINGSCHOOL SETS
0
10
20
30
40
50
60
70
80
90
100
81 82 83 84 85 86 87 88 89 90 91 92 93 94 95 96 97 98
YEAR
PE
RC
EN
T S
ETS
U.S.
JAPAN
`
FAD SETS
0
5
10
15
20
25
30
35
81 82 83 84 85 86 87 88 89 90 91 92 93 94 95 96 97 98
YEAR
PE
RC
EN
T S
ETS U.S.
JAPAN
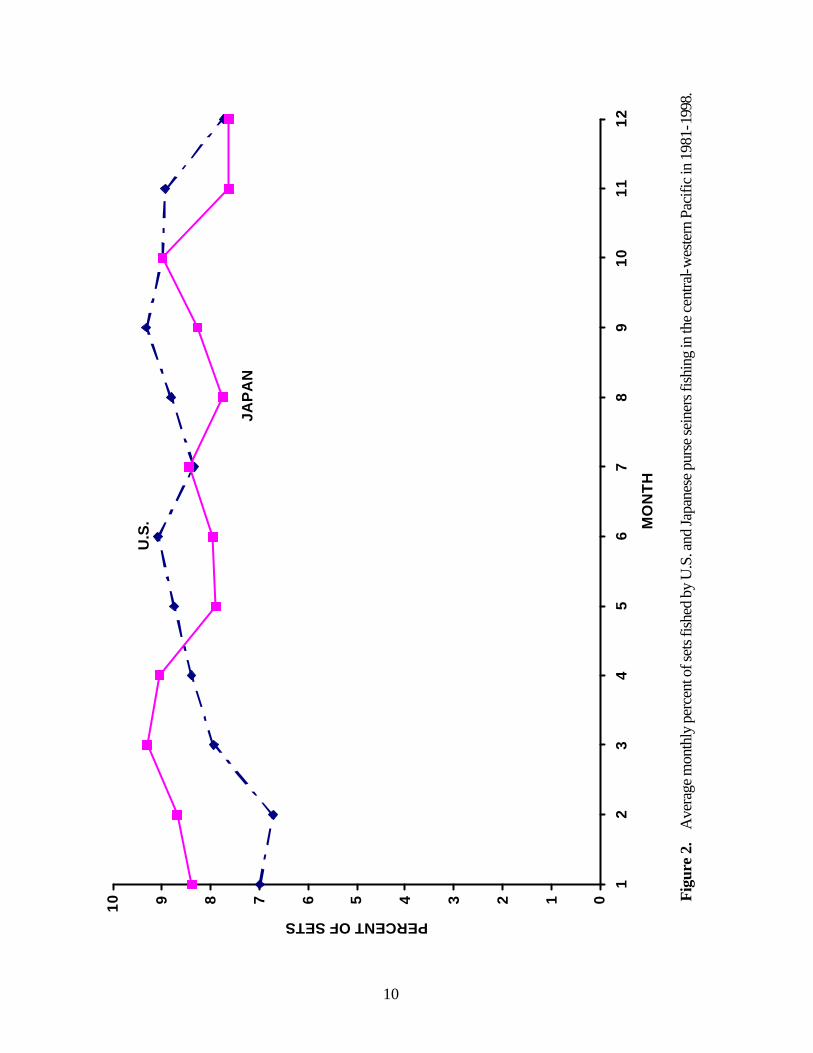
Fig
ure
2.
Ave
rage
mon
thly
per
cent
of s
ets f
ishe
d by
U.S
. and
Japa
nese
pur
se se
iner
s fis
hing
in th
e ce
ntra
l-wes
tern
Pac
ific
in 1
981-
1998
.
10
012345678910
12
34
56
78
910
1112
MO
NT
H
PERCENT OF SETS
JAP
AN
U.S
.

11
Figure 3. 1E area strata fished by the Japanese purse seine fleet (triangles) in 1993 (A) and 1982 (B) and 1E strata fished by the U.S. purse seine fleet and sampled for species composition by the National Marine Fisheries Service (circles), 1993 (A) and 1989 to 1995 (B). Squares indicate area strata where both Japanese fishing and U.S. species composition samples occurred.
A
B
12
Figure 4. 1E area strata fished by the Japanese purse seine fleet (triangles) and the U.S. purse seine fleet (circles) in 1983 (A) and 1997 (B). Squares indicate area strata fished by both fleets.
A
B