Embed Size (px)
Citation preview

Comparison of vibration and acoustic measurements for detection of bearing defects
C. Freitas1, J. Cuenca
1, P. Morais
1, A. Ompusunggu
2, M. Sarrazin
1, K. Janssens
1
1 Siemens Industry Software NV
Interleuvenlaan 68, B-3001, Leuven, Belgium
e-mail: [email protected]
2Flanders Make vzw
Celestijnenlaan 300 C, B-3001, Heverlee, Belgium
Abstract The breakdown of rotating machineries is often linked to the failure of rolling bearings. Thus, several
methods have been developed to identify the signature of bearing faults and it was proved for medium to
high speed regimes that it is possible to detect a fault through vibration signals. Although the available literature on acoustic measurements for fault detection is very limited, these can be useful to identify
damage and have the advantage of using non-contact sensors. This paper aims at comparing the results
obtained with vibration and acoustic signals under medium rotational speed. The selected techniques for this comparison belong to the semi-automated processing proposed by Randall and co-authors based on
envelope analysis. This work includes a comparative analysis of the benefits of applying the different
methods for obtaining key statistical features in the time domain to characterize a fault. The techniques of interest are cepstral editing method and minimum entropy deconvolution.
1 Introduction
Rolling bearings are an important component in rotating machinery and are widely used in industry. Due
to this fact, recent studies have been performed aiming at identifying key techniques to enhance and detect bearing faults. The most well-established monitoring technique is vibration analysis for medium to high
speed regimes [1,2]. Some authors [3-5] noticed that acoustic condition monitoring, on the other hand, has
received very limited attention. This could be related with the fact that the acoustic environment in industrial environments is generally complex and therefore measurements are prone to be contaminated by
background noise. In the last years, sophisticated signal processing techniques have made it possible to
extract useful information from contaminated signals. The acoustic measurements can be done at a
distance from the machine avoiding a safety risk and eliminating the need for high temperature vibration sensors [3-5]. For local tooth damage, the authors in [4] measured in a back-to-back experimental gearbox
test-rig acoustic and vibration signals and verified that vibration damage detection technologies can earlier
detect this type of defect than acoustic sensors. In [5] acoustic measurements were carried out in order to detect a defect in rolling-element bearings using a two microphone sound-intensity technique for a speed
range of 100 to 1500 rpm. It was observed that the detectability of an outer race defect was much better
than for an inner race or ball defect. The authors also performed sound-pressure measurements and verified that the sound-intensity method presented better results. The authors also concluded that the
defect detectability in races and balls, decreases with increasing load and for an outer race fault the
detectability increases with speed.
In order to improve the detection of bearing faults, an alternative approach was proposed in Ref. [2], by
using indicators which are not sensitive to these operational conditions but to the change in health of the
gearbox for vibration signals. In such study the authors defended the importance of pre-processing the
signals before performing the feature extraction. The goal of the pre-processing is to filter out noise and

normalize operational variability. It has been shown that root mean square (RMS) and peak amplitude
values are good indicators for gearbox health monitoring. However, it was pointed out that RMS is only
suitable for intermediate/high speed.
Several studies have been performed in order to identify the features that better detect bearing faults. In
[6], the author studied statistical parameters such as RMS, crest factor, skewness and kurtosis for a test rig
operating from 500 to 3500 rpm for vibration and acoustic signals. The study led to identifying certain trends per rotational speed range for kurtosis, and kurtosis versus crest factor. Four different bearing
conditions (healthy, inner and outer race fault and ball defect) were analysed. The author concluded that
the statistical parameters were rotational speed dependent. In [7] a study was performed to verify the
variations of statistical moments to identify damage at a much earlier stage. An important step introduced in this analysis was the removal of unwanted noise using digital filtering. Four bearing conditions
(healthy, inner and outer race fault and ball defect) were analysed by means of kurtosis and skewness and
five test speeds between 1000 and 3000 rpm were selected. The presence of a rolling element line defect was identified using both sound and vibration signals.
The authors in [1,8] defended the need of applying signal pre-processing in order to enhance the bearing
fault signature in the vibration signals. A vibration signal collected from the bearing housing is composed of different components that might mask the bearing fault signature. The authors confirmed that this
procedure was successfully applied to the majority of the cases and it could be as well applicable for low
speed. The first step is the removal of unwanted deterministic components, and then it is important to recover the impulsiveness of the signal at the source by removing the transfer path between the sensor and
the location where the fault occurred. After this pre-processing, the final step is the application of the
traditional envelope analysis.
Recent work by the authors [9] studied the effect of cepstral editing and minimum entropy deconvolution
on the detectability of outer and inner race bearing faults on a variety of statistical features of vibration
signals.
The goal of this work is to combine the procedure developed in [8] with the application of statistical
features [6,7] in the time domain for outer race faults in medium speed regime and to comparatively
examine its applicability to vibration and acoustic signals.
2 Method
2.1 Vibration Signature of Bearing Faults
Vibration signals generated by bearing faults are impulsive, at least at the source. However, the vibration
signal measured at the bearing housing is the result of a combination of different types of signals originating from gears, transmission path and measurement noise. Shaft- and gear-related signals are
deterministic and dominant, thus representing one of the most important masking components. The other
source that needs to be taken into account is the transmission path from the source to the sensor which can
in turn yield a decrease in the impulsivity of the signal.
This paper intends to study the benefits of different signal pre-processing techniques, namely cepstral
editing and minimum entropy deconvolution (MED) for bearing fault identification in different speed and load regimes, following the schematic diagram of Figure 1.
Figure 1: Schematic representation of the procedures under analysis
PROCEEDINGS OF ISMA2016 INCLUDING USD2016

2.2 Deterministic Components Removal
Different techniques are available in literature, which allow the removal of the deterministic components
(linear prediction, adaptive noise cancellation, self-adaptive noise cancellation, discrete/random
separation, time synchronous averaging, cepstral editing procedure) [10,11]. The method investigated in this paper is the cepstral editing procedure (CEP) due to the efficiency and ease of interpretation and
implementation. It has been shown in literature that CEP enhances the bearing-fault-related signals more
significantly than other techniques [10,11]. It allows the removal of selected discrete frequency components, including sidebands.
The cepstrum is commonly defined as the inverse Fourier Transform of the logarithmic spectrum of a
signal x(t), which can be written as
where X(f) is the frequency spectrum of x(t), ℑ−1 the inverse Fourier Transform and τ is the quefrency.
If the phase is retained, the complex cepstrum, Cc, has logarithmic amplitude as real part and phase as
imaginary part. If the phase is disregarded, the real cepstrum Cr is obtained:
𝐶𝑐 (𝜏) = ℑ−1 {𝑙𝑛(𝐴(𝑓)) + 𝑗𝜑(𝑓)}, (3)
𝐶𝑟 (𝜏) = ℑ−1 {𝑙𝑛( 𝐴(𝑓))}, (4)
Figure 2 shows the procedure used to remove the deterministic components. The main advantage of
cepstral editing for the present application is that the unwanted deterministic components are removed in a subtractive manner.
Figure 2: Schematic representation of the cepstral method to remove deterministic components [10]
2.3 Transmission Path Removal
Minimum entropy deconvolution (MED) is an existing method allowing the removal of the effect of the
transmission path from the source (the fault) to the receiver (the sensor). This technique is a type of
adaptative filtering that searches for an optimum set of filter coefficients that recover the output signal (or inverse filter) with the maximum value of kurtosis [12].
As referred by Randall [1], this method permits to reconstruct the shape of the original impulses at the source position. By minimizing the entropy, the kurtosis of the inverse filter output is maximized. Figure 3
illustrates the concept behind the MED. The forcing signal e(n) passes through the structural filter h
𝐶(𝜏) = ℑ−1{𝑙𝑛(𝑋(𝑓))}, (1)
𝑋(𝑓) = ℑ{𝑥(𝑡)} = 𝐴(𝑓)𝑒𝑗𝜑 (𝑓), (2)
MONITORING AND DIAGNOSTICS OF ROTATING MACHINERY

whose output is mixed with noise u(n) and gives the measured output x(n). The inverse filter f produces
the output y(n) which has to be as close to the original input e(n) which is unknown but should be as
impulsive as possible.
Figure 3: Inverse filtering (deconvolution) process for MED
The filter f is modelled as a FIR filter with L coefficients. f has to invert the system h.
𝑦(𝑛) = ∑ 𝐟(𝑙)𝑥(𝑛 − 1)
𝐿
𝑙=1
(5)
The objective function to be maximized is the kurtosis of the output signal y(n) through the filter
f. The maximum is found through the coeficients of the filter f by making the derivative of the
following objective function equal to zero:
that is,
𝜕𝑂𝑘(𝐟)
𝜕𝐟= 0
(7)
2.4 Envelope Analysis and Frequency Domain Feature Extraction
Over years, the envelope technique has been used to identify bearing faults. In this technique, the signal is
band-pass filtered in a high frequency range and then the band-pass filtered is demodulated to form the envelope signal. Subsequently, the envelope spectrum is estimated from the envelope signal wherein the
diagnostic information is present [1]. For the case where the signal includes other impulsive signals, it is
not easy to identify the frequency band in which the fault impulses are amplified by the structural resonances and for this reason in this paper the envelope was applied to the whole signal. In Figure 4 the
different steps for obtaining the fault frequencies are presented.
𝑂𝑘(𝐟) =∑ 𝑦4(𝑛)𝑁−1
𝑛=0
[∑ 𝑦2(𝑛)𝑁−1𝑛=0 ]2
(6)
PROCEEDINGS OF ISMA2016 INCLUDING USD2016

Figure 4: Signal Processing applied to obtain the enhanced fault frequencies
The amplitude demodulation was done through the Hilbert Transform (h(t)) which is the convolution of the input signal x(t)with the impulse response 1/πt [13]:
ℎ(𝑡) = 𝐻{𝑥(𝑡)} =1
𝜋∫
𝑥(𝜏)
𝑡 − 𝜏
∞
−∞
𝑑𝜏, (8)
The autocorrelation function is applied in this paper to find the periodicity in a noisy signal. The
autocorrelation (Rx(t)) of a signal x(t) is the cross correlation of x(t) with itself, at lag τ [13]:
𝑅𝑥(𝑡) = 𝑥∗(−𝜏) ∗ 𝑥(𝜏) = ∫ 𝑥(𝑡 + 𝜏)𝑥∗(𝑡)𝑑𝑡∞
−∞, (9)
In the frequency domain it is possible to identify the bearing fault signatures that appear at specific
frequencies using the envelope analysis [1]. These bearings fault characteristic frequencies are expressed in the following formulae:
where fs is the shaft speed, the n is the number of rolling elements within the bearing, d is the
mean diameter of the rolling element, D is the pitch diameter and θ is the contact angle of the
load from the radial plane. BPFO stands for ball pass frequency outer corresponding to an outer
race fault, BPFI stands for ball pass frequency inner corresponding to an inner race fault, BSF
stands for ball (roller) spin frequency and FTF stands for fundamental train frequency
corresponding to a cage fault.
cos1
2 D
dnfBPFO s
, (10)
cos1
2 D
dnfBPFI s
, (11)
cos1
2 D
dfFTF s
, (12)
2
cos12
D
d
d
DfBSF s , (13)
MONITORING AND DIAGNOSTICS OF ROTATING MACHINERY

For the feature extraction analysis will be considered the three first harmonics of the outer race
fault:
NMH-1: Normalized Magnitude of 1st
harmonic 𝑁𝑀𝐻_1 = 𝑦(1 𝑥 𝐵𝑃𝐹𝑂) (14)
NMH-2: Normalized Magnitude of 2nd
harmonic 𝑁𝑀𝐻_2 = 𝑦(2 𝑥 𝐵𝑃𝐹𝑂) (15)
NMH-3: Normalized Magnitude of 3rd
harmonic
𝑁𝑀𝐻_3 = 𝑦(3 𝑥 𝐵𝑃𝐹𝑂) (16)
2.5 Time Domain Feature Extraction
For this paper seven statistical features [14] are considered. These are applied to the vibration and acoustic
signals in the time domain and are detailed as follows:
Variance: a measure of the spread of a signal
from its mean. 𝑉𝑎𝑟𝑖𝑎𝑛𝑐𝑒 =
1
𝑛 − 1∑(𝑥𝑘 − �̅�)2
𝑛
𝑘=1
(17)
Kurtosis: a measure of the peakedness of the
vibration signal. s corresponds to the standard
deviation.
𝐾𝑢𝑟𝑡𝑜𝑠𝑖𝑠 = ∑ (𝑥𝑖 − �̅�)4𝑛
𝑘=1
(𝑛 − 1)𝑠4 (18)
Peak to Peak: the range between the
maximum and minimum amplitude value in
the signal.
𝑃𝑒𝑎𝑘_𝑡𝑜_𝑃𝑒𝑎𝑘 = max(𝑥) − min (𝑥) (19)
Crest Factor: the ratio of the peak value to
the RMS value. It gives the shape of the
waveform.
𝐶𝑟𝑒𝑠𝑡 𝐹𝑎𝑐𝑡𝑜𝑟 =𝑃𝑒𝑎𝑘 𝑣𝑎𝑙𝑢𝑒
𝑅𝑀𝑆 (20)
Root Mean Square: the square root of the arithmetic mean of the squares of the original
signal. 𝑅𝑀𝑆 = √
1
𝑛∑ 𝑥𝑘
2
𝑛
𝑘=1
(21)
75th
percentile: 𝑥0.75 is the value below which 75% of the time data falls.
0.75 = 𝑃(𝑥 ≤ 𝑥0.75) (22)
Log energy entropy [15]: log energy entropy
in the signal. 𝐸𝑛𝑡𝑙𝑜𝑔 = ∑ log (
𝑛
𝑘=1𝑥𝑘
2) (23)
3 Experimental Setup: Machine Fault Simulator SpectraQuest
The measurements for medium speed regime were performed in a fault machine simulator from
SpectraQuest (Figure 5). The machine is driven by a 3 HP Marathon Electric Three Phase AC motor controlled by a Delta VFD-S Inverter. Two different bearing conditions were measured (healthy and outer
race fault) for a speed range between 780 and 2340 rpm with an interval of 120 rpm. A 5 kg mass was
added to enhance the fault. The bearings under analysis were ER-16K. The accelerometer PCB 365A01
PROCEEDINGS OF ISMA2016 INCLUDING USD2016

was located on the top of the housing of the faulty bearing and a microphone GRAS 40 PH was located
close by this bearing.
Figure 5: Fault Machine Simulator SpectraQuest and bearing characteristics
4 Data Analysis and Discussion
To understand the benefits of the different pre-processing techniques, vibration and acoustic signals were
acquired and analyzed for different speed on the machine fault simulator of SpectraQuest (Figure 5). In
order to obtain the faulty frequencies, the procedure introduced in the Section 2.4 was followed. In this paper is shown the spectrum for an outer race fault versus healthy case at 1260 rpm (Figure 6 and 7). In
these figures the spectra of the autocorrelation of the envelope after removing the deterministic
components and enhancing the impulsiveness for vibration and acoustic signals, are presented respectively. The magnitude of the envelope spectrum was normalized diving by the magnitude of the
frequency at 0 Hz (DC component). Observing these figures, one can clearly identify the harmonics of the
fault frequency for both vibration and acoustic sensors, being noticed that the vibration signal provides a cleaner spectrum.
Figure 6: Spectrum of the autocorrelation of the envelope for the vibration signal
Bearing ER-16K
Rolling element
diameter
7.94 mm
Pitch diameter 39.32 mm
Ball number 9
Contact angle 0o
50 100 150 200 2500
0.002
0.004
0.006
0.008
0.01
0.012
0.014
0.016
0.018
0.02
Frequency [Hz]
Outer Race Fault
Healthy
NMH-3
NMH-2
NMH-1
MONITORING AND DIAGNOSTICS OF ROTATING MACHINERY
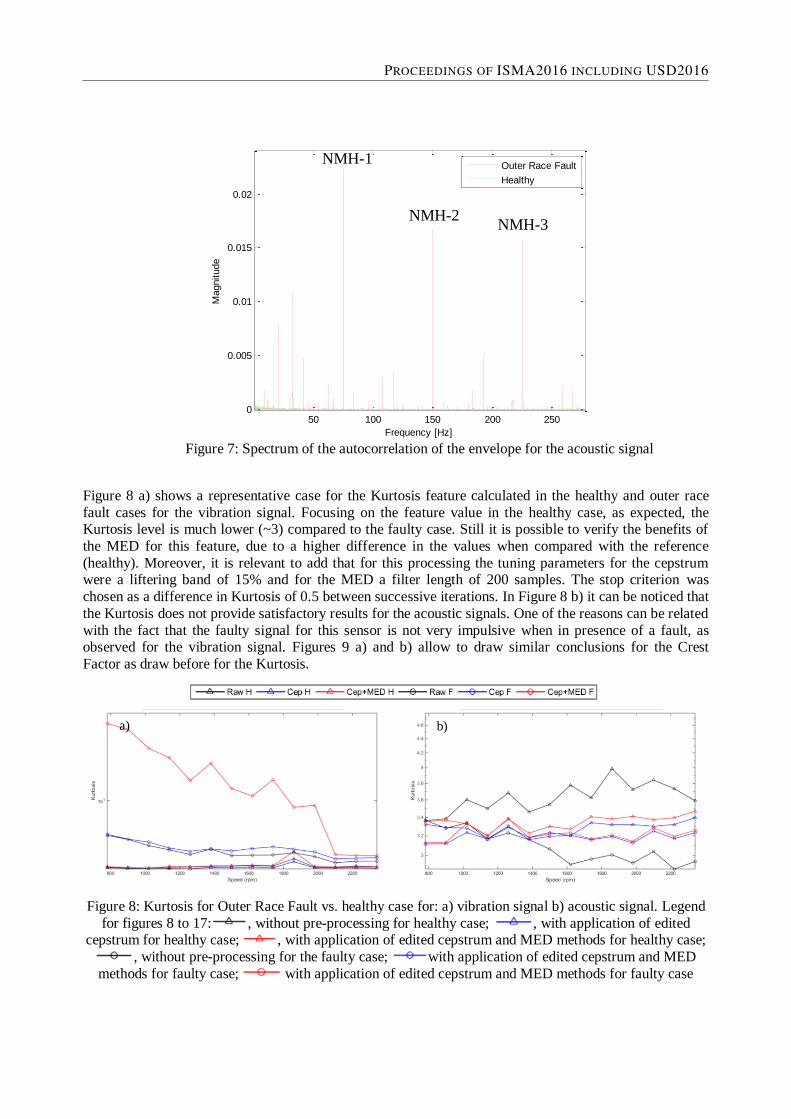
Figure 7: Spectrum of the autocorrelation of the envelope for the acoustic signal
Figure 8 a) shows a representative case for the Kurtosis feature calculated in the healthy and outer race
fault cases for the vibration signal. Focusing on the feature value in the healthy case, as expected, the Kurtosis level is much lower (~3) compared to the faulty case. Still it is possible to verify the benefits of
the MED for this feature, due to a higher difference in the values when compared with the reference
(healthy). Moreover, it is relevant to add that for this processing the tuning parameters for the cepstrum were a liftering band of 15% and for the MED a filter length of 200 samples. The stop criterion was
chosen as a difference in Kurtosis of 0.5 between successive iterations. In Figure 8 b) it can be noticed that
the Kurtosis does not provide satisfactory results for the acoustic signals. One of the reasons can be related
with the fact that the faulty signal for this sensor is not very impulsive when in presence of a fault, as observed for the vibration signal. Figures 9 a) and b) allow to draw similar conclusions for the Crest
Factor as draw before for the Kurtosis.
Figure 8: Kurtosis for Outer Race Fault vs. healthy case for: a) vibration signal b) acoustic signal. Legend
for figures 8 to 17: , without pre-processing for healthy case; , with application of edited cepstrum for healthy case; , with application of edited cepstrum and MED methods for healthy case;
, without pre-processing for the faulty case; with application of edited cepstrum and MED
methods for faulty case; with application of edited cepstrum and MED methods for faulty case
50 100 150 200 2500
0.005
0.01
0.015
0.02
Frequency [Hz]
Magnitude
Outer Race Fault
Healthy
NMH-1
NMH-2 NMH-3
b) a)
PROCEEDINGS OF ISMA2016 INCLUDING USD2016

Figure 9: Crest Factor for Outer Race Fault vs. healthy case for: a) vibration signal b) acoustic signal. Same Legend as Figure 8
Figure 10 presents the calculated Variance feature for the outer race fault versus the healthy case for two different sensors a) accelerometer and b) microphone. For this feature it can be concluded there is no
benefit of applying the MED method for vibration signal. There is already a clear distinction between the
faulty and healthy feature value without any other extra processing. For this case, the application of the cepstral editing method did not provide any other extra advantage in further increasing the deviation of
faulty from healthy results. Regarding the acoustic signals, Figure 10 b), as concluded already for the
vibration signals, the application of the MED does not bring extra benefits while the cepstral editing method provides a clearer distinction between the faulty and healthy data while for higher speeds this
difference tends to decrease. It was also verified for acoustic signals that it is already possible to have a
good distinction of the faulty versus healthy data without any processing. All these conclusions are also
valid for the other statistical features: Variance (Figure 10), Peak to Peak (Figure 11), RMS (Figure 12), Percentile 75 (Figure 13) and Entropy (Figure 14).
Figure 10: Variance for Outer Race Fault vs. healthy case for: a) vibration signal b) acoustic signal. Same
Legend as Figure 8
a) b)
a) b)
MONITORING AND DIAGNOSTICS OF ROTATING MACHINERY

Figure 11: Peak to Peak for Outer Race Fault vs. healthy case for: a) vibration signal b) acoustic signal. Same Legend as Figure 8
Figure 12: RMS for Outer Race Fault vs. healthy case for: a) vibration signal b) acoustic signal. Same
Legend as Figure 8
Figure 13: Percentile for Outer Race Fault vs. healthy case for: a) vibration signal b) acoustic signal. Same Legend as Figure 8
a)
a) b)
a) b)
b)
PROCEEDINGS OF ISMA2016 INCLUDING USD2016

Figure 14: Entropy_Log for Outer Race Fault vs. healthy case for: a) vibration signal b) acoustic signal.
Same Legend as Figure 8
The other important aspect to be noted from this investigation is the fact that the feature values calculated
from time domain features are speed-dependent and the method of the static threshold will not provide satisfactory results and might lead to false alarms. Therefore, the threshold should be set as a function of
the rotational speed.
In Figure 15 a) shows the normalized magnitude of the first harmonic of the envelope spectra obtained from outer race fault and healthy cases. It can be concluded from the figure that there is no benefit of
applying the MED method. However, it can be noticed that the use of the cepstral editing technique helps
to enhance the fault when compared with the healthy case. For the data without any processing it is
difficult to have a clear distinction between faulty and healthy cases. From the Figure 15 b), for the acoustic signals, the same conclusions can be achieved. For both sensors, the feature values seem to be
speed independent and normally the threshold method should provide satisfactory results. The same
conclusions can be drawn for the two other frequency features, Normalized Magnitude Harmonic 2 (NMH-2, Figure 16) and Normalized Magnitude Harmonic 3 (NMH-3, Figure 17). However, for acoustic
signals for NMH-2 and NMH-3 for certain rotational speeds it is not possible to have the same separation
between faulty and healthy as for the NMH-1.
Figure 15: NMH-1 for Outer Race Fault vs. healthy case for: a) vibration signal b) acoustic signal. Same
Legend as Figure 8
a) b)
a) b)
MONITORING AND DIAGNOSTICS OF ROTATING MACHINERY

Figure 16: NMH-2 for Outer Race Fault vs. healthy case for: a) vibration signal b) acoustic signal. Same
Legend as Figure 8
Figure 17:NMH-3 for Outer Race Fault vs. healthy case for: a) vibration signal b) acoustic signal. Same Legend as Figure 8
Figure 18 provides the correlation matrix of the considered features for the outer race fault case for the
accelerometer sensor. There are general observations that can be made; the parameters Variance,
Percentile 75, Entropy_log, NMH2 and NMH-3 provide the higher correlations for the vibration sensor.
With the application of the cepstral editing method and the MED, it can be observed that the number of highly correlated variables is reduced to four, leaving out the NMH-2. The use of this processing reduces
the correlation coefficient between variables. In Figure 19 the correlation coefficients were calculated for
the acoustic signals. The features with higher correlations are the Variance, Crest Factor, Percentile 75,
Entropy and NMH-1, NMH-2 and NMH-3. After the processing the number of correlated variables were reduce to five, Variance, Crest Factor, Percentile 75, Entropy and NMH-3. The main difference between
the two sensors is that for the microphone, the Crest Factor is highly correlated with the other features and
this does not happen for the vibration signals.
An aspect of interest for fault detection is the identification of patterns by using a minimum set of
uncorrelated features. Based on the present results, it is worth noting that a set of correlated features
provide redundant information for fault detection purposes. Thus, in that case the consideration of one feature should be enough to evaluate the trend with speed.
a) b)
a) b)
PROCEEDINGS OF ISMA2016 INCLUDING USD2016

Figure 18: Correlation Coefficient of the features for Outer Race Fault for vibration signal left) without
processing, middle) with cepstral editing, right) with cepstral editing and MED
Figure 19: Correlation Coefficient of the features for Outer Race Fault for acoustic signal left) without
processing, middle) with cepstral editing, right) with cepstral editing and MED
5 Conclusions
This paper was intended to study the benefits of different signal pre-processing techniques, namely
cepstral editing and minimum entropy deconvolution (MED) for bearing outer race fault identification
in different speed regimes. This was performed by extracting several features from vibration and acoustic signals acquired on a bearing fault simulator setup for different speed regimes. It has been
shown that the analysis tools proposed applies both vibration and acoustic measurements.
For medium speed the benefit of the pre-processing techniques seem to be not substantial and the efficiency of their application may be related with the complexity of the machine. Only the Kurtosis
and Crest Factor seemed to benefit from it for vibration signals. In case of the acoustic signals the
MED did not provide any benefits but the cepstral editing method helped enhance the fault for all the features except for Kurtosis and Crest Factor. These last two features do not provide any interesting
information to help the fault identification. It was as well verified that several features were
correlating with each other, and it might be important to consider the application of feature selection
algorithms for pattern recognition proposes. As final remark, the selection of the MED parameters needs to be done carefully in order to prevent false alarms in the fault detection.
MONITORING AND DIAGNOSTICS OF ROTATING MACHINERY

References
[1] R. B. Randall, J. Antoni, Rolling element bearing diagnostics - A tutorial, Mechanical Systems and Signal Processing, vol. 25, pp. 485-520, 2011.
[2] J. Igba, K. Alemzadeh, C. Durugbo, E. T. Eiriksson, Analysing RMS and peak values of vibration
signals for condition monitoring for wind turbine gearboxes, Renewable Energy, vol. 91, pp. 90-106, 2016.
[3] N. Baydar, A. Ball, A comparative study of acoustic and vibration signals in detection of gear
failures using Wigner-Ville distribution, Mechanical Systems and Signal Processing , vol. 15, no. 6, pp. 1091-1107, 2001.
[4] A. Borisov, L. Gelman, K. C. Gryllias, B. Shaw, M. Vaidhianathasamy, M. Walters, Novel
comparisons of vibration and acoustic technologies for local damage detection in gearboxes, in Eighth International Conference on Condition Monitoring and Machinery Failure Prevention
Technologies, Cardiff, 2011.
[5] N. Tandon, B. C. Nakra, The application of sound-intensity technique to defect detection in rolling-element bearings, Applied Acoustics, vol. 29, pp. 207-217, 1990.
[6] R. B. W. Heng, M. J. M. Nor, Statistical Analysis of Sound and Vibration Signals for Monitoring
Rolling Element Bearing, Applied Acoustics, vol. 53, pp. 211-226, 1997.
[7] H. R. Martin, F. Honarvar, Application of Statistical Moments to Bearing Failure Detection, Applied
Acoustics, vol. 44, no. 1, pp. 67-77, 1995.
[8] N. Sawalhi, R. B. Randall, Semi-Automated bearing diagnostics - Three case studies, in International
Congress on Condition Monitoring and Diagnostic Engineering Management, Faro, 2007.
[9] C. Freitas, P. Morais, A. Ompusunggu, M. Sarrazin, K. Janssens, Condition monitoring of bearings under medium and low rotational speed, in European Workshop in Structural Health Monitoring,
Bilbao, 2016.
[10] A. P. Ompusunggu, T. A. Bartic, Automated cepstral editing procedure (ACEP) for removing
discrete components from vibration signals, in International Conference on Condition Monitoring
and Machinery Failure Prevention Technologies, Oxford, 2015.
[11] R. B. Randall, N. Sawalhi, M. Coats, A comparison of methods for separation of deterministic and
random signals, The International Journal of Condition Monitoring, vol. 1, no. 1, pp. 11-19, 2011.
[12] N. Sawalhi, R. B. Randall, H. Endo, The enhancement of fault detection and diagnosis in rolling element bearings using minimum entropy deconvolution combined with spectral kurtosis, Mechanical
Systems and Signal Processing, vol. 21, pp. 2616-2633, 2007.
[13] J. L. F. Chacon, V. Kappatos, W. Balachandran, T.-H. Gan, A novel approach for incipient defect detection in rolling bearing using acoustic emission technique, Applied Acoustics, vol. 89, pp. 88-
100, 2015.
[14] A. D. Poularikas, Handbook of Formulas and Tables for Signal Processing, CRC Press LLC, 1998.
[15] R. R. Coifman, M. V. Wickerhauser, Entropy-based Algorithms for best basis selection, IEEE Trans.
on Inf. Theory, vol. 38, no. 2, pp. 713-718, 1992.
PROCEEDINGS OF ISMA2016 INCLUDING USD2016