Embed Size (px)
Citation preview
Acta Polytechnica Hungarica Vol. 12, No. 7, 2015
– 183 –
Comparison of Two Digital Cameras based on
Spectral Data Estimation Obtained with Two
Methods
Dejana Javoršek*, Tim Jerman, Andrej Javoršek
Faculty of Natural Sciences and Engineering, Department of Textiles, Chair of
Information and Graphic Arts Technology, University of Ljubljana
Snežniška 5, SI-1000 Ljubljana, Slovenia; [email protected],
[email protected], [email protected]
Abstract: The aim of our research was to prove that a digital camera does not influence the
quality of spectral reflectance estimation and that satisfactory results could be achieved
with a low-cost camera instead of using more expensive and complex multispectral devices.
For that purpose two digital cameras – Nikon D300 in Nikon D700 were compared by
obtaining spectral data from RGB values of a digital camera. For calculation of spectral
data two different methods were used – SpecSens method and ImaiBerns method. In the
research, two different color charts – ColorChecker DC and ColorChecker SG, were used.
Performance of each camera and reflectance estimation approach were evaluated based on
RMSE and ΔE*ab. Results showed that in the case of the ImaiBerns method it could be
concluded that the obtained reflectance spectra are independent from the used camera, as
somewhat slightly better results were obtained with Nikon D700. In the case of SpecSens
method, which is based on the determination of the spectral sensitivity of the camera, the
choice of the camera had quite an impact on the results. These results are pretty unreliable
due to the large color differences ΔE*ab, as this calculation takes into account the
standard light (first if you want to calculate XYZ and second the LAB values) and standard
colorimetric observer.
Keywords: digital camera Nikon D300; digital camera Nikon D700; spectral reflectance
estimation
1 Introduction
Digital cameras have become very accurate systems for identifying changes in
color, for example on beef [1], in the field of phenology [2, 3], in pattern
recognition [4], for the identification of colors in urban environments [5], in the
field of culture, where the digitization or digital archiving is used for the needs of
various cultural institutions [6] or in medicine for photography of human wounds
[7].
D. Javoršek et al. Comparison of Two Digital Cameras based on Spectral Data Estimation Obtained with Two Methods
– 184 –
The sensitivities of digital camera differ from CIE color matching functions,
which describe the sensitivity of the human visual system. Digital camera could
provide two metamerically identical images while human observers could see
those images differently [8]. It is known that a color match for all observers when
changing illumination could be achieved only by matching spectral data that are
completely independent of the characteristics of digital camera. Obtaining spectral
data from digital camera RGB values could provide a new way of using digital
camera as spectrophotometric tool, where spectral data enables later reproduction
under different illuminants and observing conditions. That could be very
important and useful for digital archives, network museums, e-commerce and
telemedicine [9]. Even after almost 25 years since Glassner wrote about deriving a
spectrum from an RGB values [10], this is still a very hot topic. Today, one
method to solve this problem is to use a regular digital RGB camera and estimate
Suitableits RGB image into a spectral image by the Wiener estimation method
[11]. This method was also used for spectral reflectance images obtained from a
digital RGB image for estimation of melanin concentration, blood concentration,
and oxygen saturation in human skin tissue [12].
Adequate results of obtained spectral data could be also achieved by combining
two different shots of the same scene acquired using the digital RGB camera with
and without a properly chosen absorption filter [13].
There have been a number of studies on determining camera spectral sensitivity.
For defining camera spectral sensitivity, a monochromator or narrow-band filters
for generating a series of monochromatic light, are usually used. Other methods
that do not use a monochromator require both input images and corresponding
scene spectral radiances [14-19]. Thomson and Westland introduced a novel
method to estimate camera spectral sensitivities and white balance setting from
images with sky regions [20]. In our research instead of a monochromator, a less
expensive and more readily available tools - diffraction grating and
spectroradiometer were used to determine spectral sensitivities of two commercial
digital cameras [21].
In one study authors researched the influence of camera parameters, e.g. exposure,
on spectral data reconstruction of prints [22]. They found out that with multiple
exposures it is possible to capture high dynamic range images, because limited
dynamic range is the factor that lowers the reconstruction performance of
consumer level cameras.
The aim of our research was to prove that the digital camera does not or only
slightly influences the quality of spectral reflectance estimation and that satisfying
results could be achieved with a low-cost camera instead of using more expensive
and complex multispectral devices. For that purpose two digital cameras – Nikon
D300 and Nikon D700 were compared while obtaining spectral data from RGB
values of a digital camera. For calculation of spectral data two different methods
were used. The first method was performed using spectral responses of a digital
Acta Polytechnica Hungarica Vol. 12, No. 7, 2015
– 185 –
camera (SpecSens method), and second one was Imai and Berns (ImaiBerns)
method that includes linearized RGB values [23]. In the research, two different
color charts – ColorChecker DC and ColorChecker SG, were used. ColorChecker
DC was used only in case of the ImaiBerns method, as training set data and for the
linearization method. Performance of each camera and reflectance estimation
approach were evaluated based on root-mean-square-error (RMSE) and color
difference equation ΔE*ab.
2 Experimental
2.1 Materials and Methods
Color charts ColorChecker DC (X-Rite) – training set with 237 color patches –
and ColorChecker SG (X-Rite) – test set with 140 patches, were photographed
with two digital cameras – Nikon D300 in Nikon D700. Charts were illuminated
by two light sources with color temperature 3194 K at 45° angle and distance of
170 cm. Camera settings were as follows – aperture: f/1.4, ISO value: 200,
metering mode: Matrix, captured image format: RAW. Raw images were
converted to TIFF files using an open source program dcraw [24].
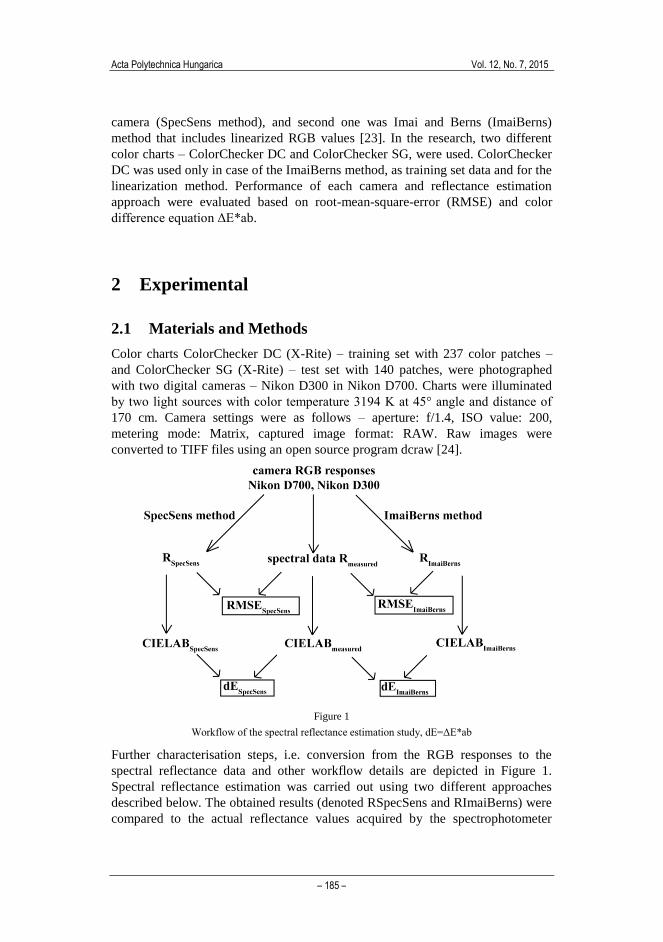
Figure 1
Workflow of the spectral reflectance estimation study, dE=ΔE*ab
Further characterisation steps, i.e. conversion from the RGB responses to the
spectral reflectance data and other workflow details are depicted in Figure 1.
Spectral reflectance estimation was carried out using two different approaches
described below. The obtained results (denoted RSpecSens and RImaiBerns) were
compared to the actual reflectance values acquired by the spectrophotometer
D. Javoršek et al. Comparison of Two Digital Cameras based on Spectral Data Estimation Obtained with Two Methods
– 186 –
EyeOne (denoted Rmeasured). Performance of the two reflectance estimation
procedures was assessed using two error metrics – color difference formula CIE
ΔE*ab and RMSE. For calculation of CIE ΔE*ab and CIELAB values illuminant
A and CIE 1931 standard observer were used. RMSE is a spectral measure of
estimation quality and compares measured and estimated reflectance values on
image pixel location in each patch on a pixel-by-pixel basis.
2.2 Spectral Reflectance Estimation
The inverse problem of estimating spectral reflectances from the RGB values is
related to the image acquisition process that describes the creation of camera
responses. The process is described in [25]:
P = f (Δλ, Y, l, R, b) = Δλ * Y' × diag(l) × R + b (1)
where Δλ denotes the sampling interval of the spectral data, Y are the spectral
responsitivities of dimension w × c, l is the illumination vector of dimension w, R
is the reflectance matrix consisting of the n object pixels in the image and b is an
additive noise term. In spectral reflectance estimation one attempts to calculate
unknown reflectances R from known camera responses P by finding a function d
that minimizes d(g(P), R). Here d is an error metrics, such as RMSE. Since
dimensionality w of R is typically larger than c of P, g does not necessarily have a
unique solution [26].
2.2.1 Spectral Sensitivity-based Method (SpecSens)
For the purpose of our study, the Octave [27] function 'xyz2r' described in [23]
that is used to estimate reflectance spectrum from tristimulus values was modified.
Values for CIEXYZ and the standard illuminant/observer combination that are
required as the function inputs were replaced by camera RGB responses and its
sensors' spectral sensitivities.
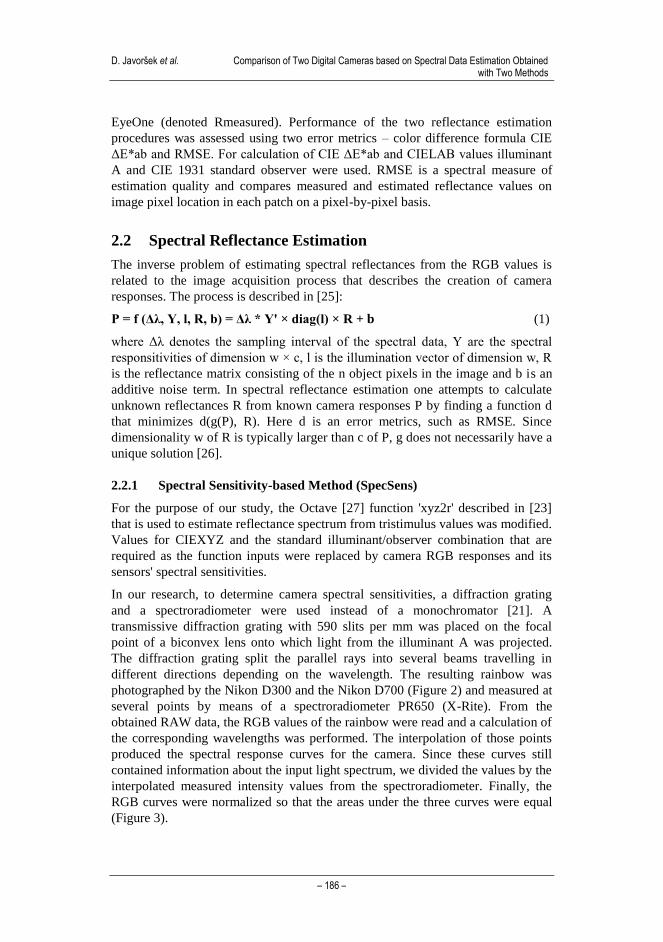
In our research, to determine camera spectral sensitivities, a diffraction grating
and a spectroradiometer were used instead of a monochromator [21]. A
transmissive diffraction grating with 590 slits per mm was placed on the focal
point of a biconvex lens onto which light from the illuminant A was projected.
The diffraction grating split the parallel rays into several beams travelling in
different directions depending on the wavelength. The resulting rainbow was
photographed by the Nikon D300 and the Nikon D700 (Figure 2) and measured at
several points by means of a spectroradiometer PR650 (X-Rite). From the
obtained RAW data, the RGB values of the rainbow were read and a calculation of
the corresponding wavelengths was performed. The interpolation of those points
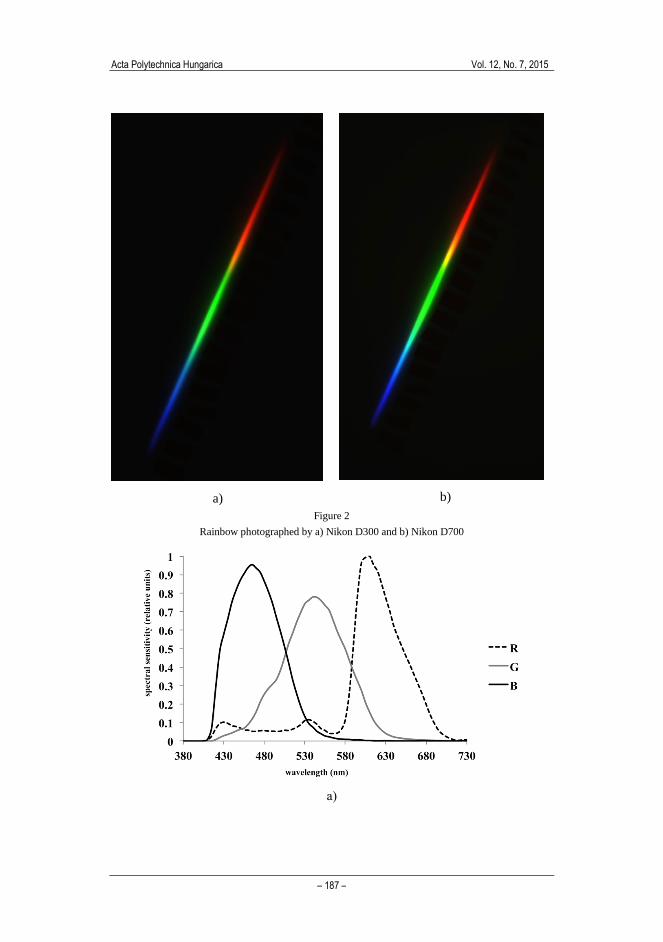
produced the spectral response curves for the camera. Since these curves still
contained information about the input light spectrum, we divided the values by the
interpolated measured intensity values from the spectroradiometer. Finally, the
RGB curves were normalized so that the areas under the three curves were equal
(Figure 3).
Acta Polytechnica Hungarica Vol. 12, No. 7, 2015
– 187 –
a)
b)
Figure 2
Rainbow photographed by a) Nikon D300 and b) Nikon D700
a)
D. Javoršek et al. Comparison of Two Digital Cameras based on Spectral Data Estimation Obtained with Two Methods
– 188 –
b)
Figure 3
Spectral sensitivity curves of the camera sensors, a) Nikon D700 and b) Nikon D300
2.2.2 Imai-Berns Method (ImaiBerns)
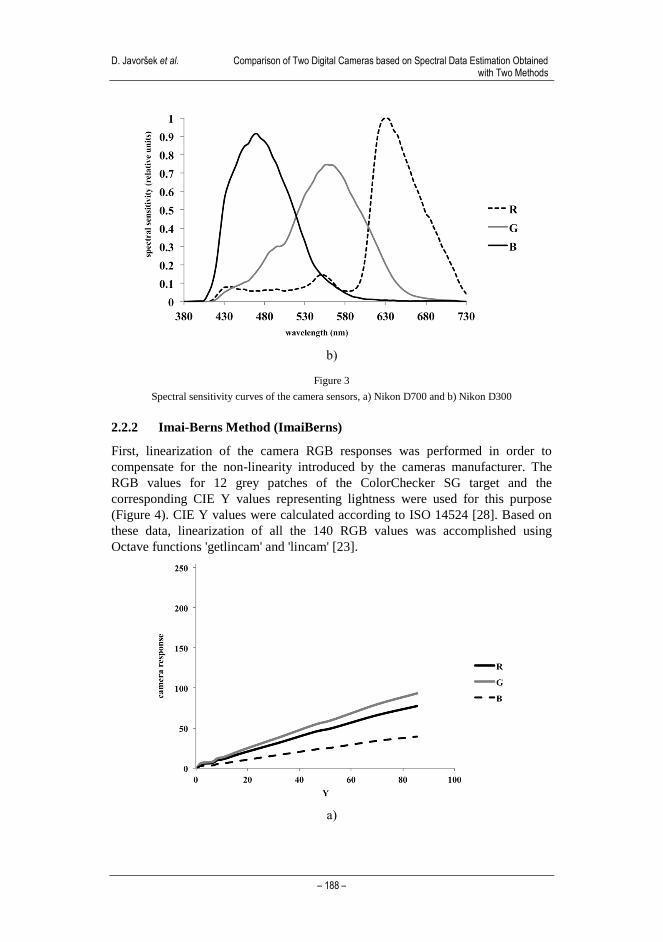
First, linearization of the camera RGB responses was performed in order to
compensate for the non-linearity introduced by the cameras manufacturer. The
RGB values for 12 grey patches of the ColorChecker SG target and the
corresponding CIE Y values representing lightness were used for this purpose
(Figure 4). CIE Y values were calculated according to ISO 14524 [28]. Based on
these data, linearization of all the 140 RGB values was accomplished using
Octave functions 'getlincam' and 'lincam' [23].
a)
Acta Polytechnica Hungarica Vol. 12, No. 7, 2015
– 189 –
b)
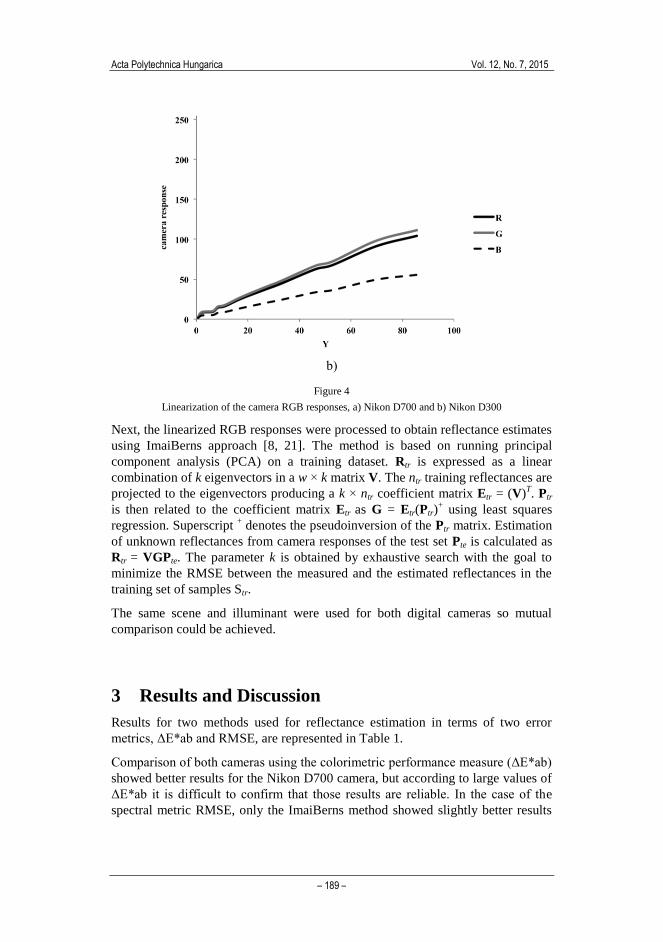
Figure 4
Linearization of the camera RGB responses, a) Nikon D700 and b) Nikon D300
Next, the linearized RGB responses were processed to obtain reflectance estimates
using ImaiBerns approach [8, 21]. The method is based on running principal
component analysis (PCA) on a training dataset. Rtr is expressed as a linear
combination of k eigenvectors in a w × k matrix V. The ntr training reflectances are
projected to the eigenvectors producing a k × ntr coefficient matrix Etr = (V)T. Ptr
is then related to the coefficient matrix Etr as G = Etr(Ptr)+ using least squares
regression. Superscript + denotes the pseudoinversion of the Ptr matrix. Estimation
of unknown reflectances from camera responses of the test set Pte is calculated as
Rtr = VGPte. The parameter k is obtained by exhaustive search with the goal to
minimize the RMSE between the measured and the estimated reflectances in the
training set of samples Str.
The same scene and illuminant were used for both digital cameras so mutual
comparison could be achieved.
3 Results and Discussion
Results for two methods used for reflectance estimation in terms of two error
metrics, ΔE*ab and RMSE, are represented in Table 1.
Comparison of both cameras using the colorimetric performance measure (ΔE*ab)
showed better results for the Nikon D700 camera, but according to large values of
ΔE*ab it is difficult to confirm that those results are reliable. In the case of the
spectral metric RMSE, only the ImaiBerns method showed slightly better results

D. Javoršek et al. Comparison of Two Digital Cameras based on Spectral Data Estimation Obtained with Two Methods
– 190 –
for Nikon D700 compared to Nikon D300. The reason for this could be found in
the 12-megapixel FX (full-frame) sensor of the Nikon D700, which means it has a
more dynamic range and higher ISO, while the Nikon D300 has a smaller 12-
megapixel DX (1.5 crop factor) sensor.
Table 1
Performance of the methods used for reflectance estimation
ΔE*ab
SpecSens
ΔE*ab
ImaiBern
s
RMSE
SpecSens
RMSE
ImaiBern
s
D700 D300 D700 D300 D700 D300 D700 D300
mean 12.87 17.39 6.32 6.95 0.1332 0.1026 0.0596 0.0668
max 35.04 113.17 27.37 27.78 0.3856 0.2898 0.2150 0.2723
min 1.59 0.72 0.47 0.39 0.0132 0.0116 0.0015 0.0017
Both color difference calculations, ΔE*ab as well as spectral metric RMSE,
clearly indicate that the reflectance estimation based on the linearized ImaiBerns
method performs better compared to the alternative method (SpecSens) using
defined camera spectral sensitivities. It should be noted that the differences
between the two methods are almost the same when using both evaluation
methods (RMSE and ΔE*ab): for example, in the case of ΔE*ab the
corresponding ratio of mean values SpecSens/ImaiBerns is 2.04 (= 12.87/6.32)
compared to 2.23 in case of the RMSE.
In order to get a more detailed picture about which color patches can be estimated
more or less accurately in terms of their reflectance values, the following results
are presented. Colors with the lowest ΔE*ab are colors with a mostly high L*
value. In order to get a more detailed information about color shift of these colors
when their reflectance spectra were estimated from RGB values, they were
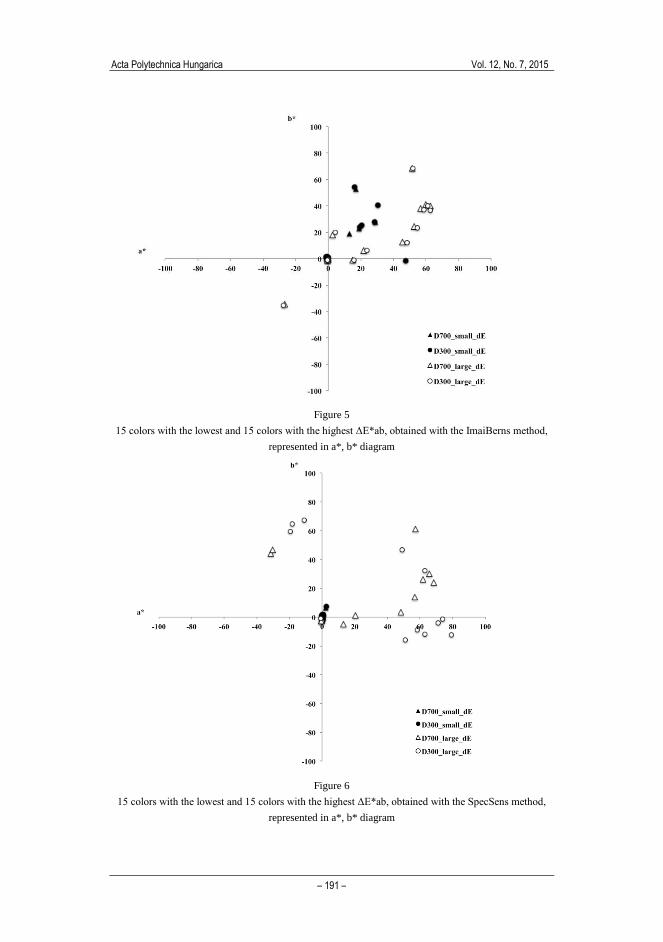
represented in a*, b* diagram (Figures 5 and 6).
Color difference (ΔE*ab) between measured and predicted L*a*b* values using
ImaiBerns method is the most pronounced in the case of black (patches L01, N06,
N03, J05), saturated red (G04, M02, L03, L06, M05), blue (J04) and violet (M03)
patch samples (Figure 5). Color difference (ΔE*ab) between measured and
predicted L*a*b* values using SpecSens method is the most pronounced in case
of black (patches I01, L01, N06, N03), saturated red (G04, M02, L03) and green
(L07, L08, L09, G09, I09, H09) patch samples (Figure 6). Lightness of colors
captured with Nikon D300 is slightly higher in comparison with the Nikon D700.
Lightness of colors captured with the Nikon D700 and obtained with SpecSens
method is slightly higher than in the case of the Nikon D300, which is quite
opposite of the ImaiBerns method. However, as mentioned above, according to
large values of ΔE*ab it is difficult to confirm that results of the SpecSens method
are reliable.
Acta Polytechnica Hungarica Vol. 12, No. 7, 2015
– 191 –
Figure 5
15 colors with the lowest and 15 colors with the highest ΔE*ab, obtained with the ImaiBerns method,
represented in a*, b* diagram
Figure 6
15 colors with the lowest and 15 colors with the highest ΔE*ab, obtained with the SpecSens method,
represented in a*, b* diagram
D. Javoršek et al. Comparison of Two Digital Cameras based on Spectral Data Estimation Obtained with Two Methods
– 192 –
On the other hand, it is also interesting to investigate patch samples with the
lowest values of the ΔE*ab. Not surprisingly, patches with the lowest ΔE*ab are
almost exclusively white, gray and skin color shade samples (ImaiBerns method).
Based on Figures 5 and 6 it can be concluded that in the case of the ImaiBerns
method, the Nikon D700 colors with large ΔE*ab generally moved toward the b*
axis, meaning that they are less saturated than in the case of D300. In the case of
the SpecSens method, large ΔE*ab colors of the digital camera D700 moved
toward the upper half of the a*, b* diagram – their b* values are positive, which
means that colors moved from magenta area to red area of the diagram. In a case
of yellow, colors moved from yellow area to green area of the diagram.
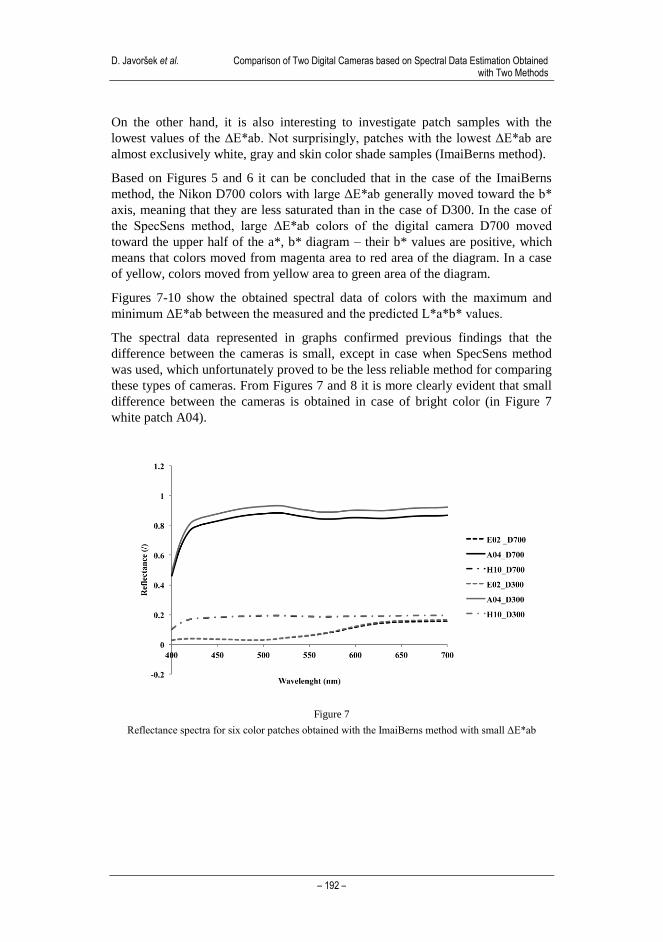
Figures 7-10 show the obtained spectral data of colors with the maximum and
minimum ΔE*ab between the measured and the predicted L*a*b* values.
The spectral data represented in graphs confirmed previous findings that the
difference between the cameras is small, except in case when SpecSens method
was used, which unfortunately proved to be the less reliable method for comparing
these types of cameras. From Figures 7 and 8 it is more clearly evident that small
difference between the cameras is obtained in case of bright color (in Figure 7
white patch A04).
Figure 7
Reflectance spectra for six color patches obtained with the ImaiBerns method with small ΔE*ab
Acta Polytechnica Hungarica Vol. 12, No. 7, 2015
– 193 –
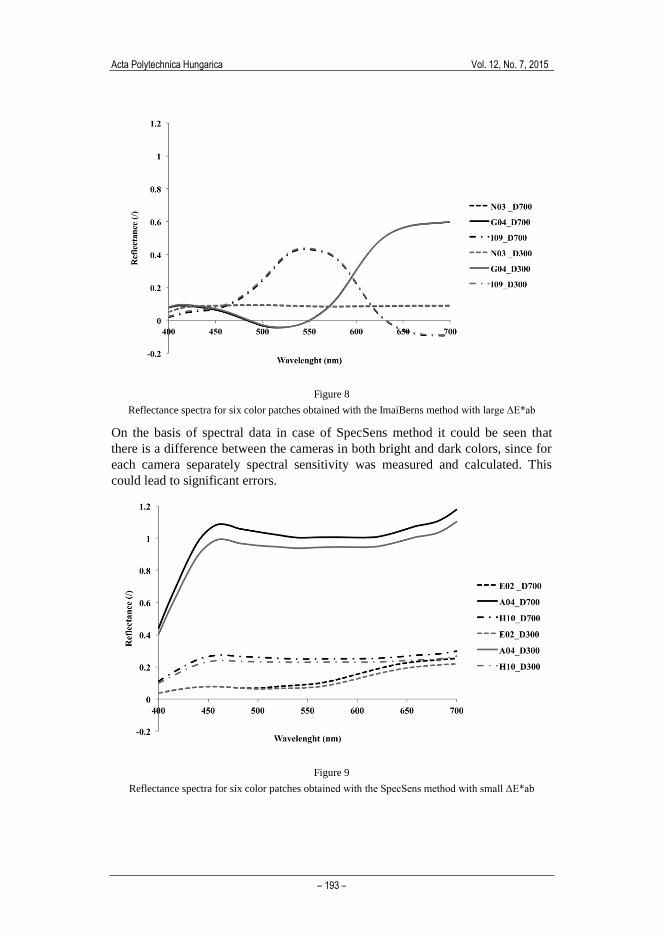
Figure 8
Reflectance spectra for six color patches obtained with the ImaiBerns method with large ΔE*ab
On the basis of spectral data in case of SpecSens method it could be seen that
there is a difference between the cameras in both bright and dark colors, since for
each camera separately spectral sensitivity was measured and calculated. This
could lead to significant errors.
Figure 9
Reflectance spectra for six color patches obtained with the SpecSens method with small ΔE*ab

D. Javoršek et al. Comparison of Two Digital Cameras based on Spectral Data Estimation Obtained with Two Methods
– 194 –
Figure 10
Reflectance spectra for six color patches obtained with the SpecSens method with large ΔE*ab
Conclusion
In our study a comparison of two digital cameras Nikon D300 and Nikon D700
based on spectral data estimation obtained with two methods (ImaiBerns and
SpecSens), was performed. Results showed that in the case of using SpecSens
method and ΔE*ab calculations, Nikon D700 had better results than Nikon D300.
These results are pretty unreliable due to the large color differences ΔE*ab, as this
calculation takes into account the standard light (firstly when calculating XYZ and
secondly when calculating LAB values) and standard colorimetric observer. In a
case of SpecSens method measurement and calculation errors probably also
occurred. In the case of the spectral metric RMSE, only the usage of the
ImaiBerns method showed negligibly better results for Nikon D700 in comparison
with Nikon D300.
Both evaluation methods, ΔE*ab as well as RMSE, clearly indicate that the
reflectance estimation, based on the linearized ImaiBerns method, performs better
compared to the SpecSens method using defined camera spectral sensitivities. The
reason for this could be found in the potential errors that occurred either in the
actual measurements (SpecSens method) or calculations.
In the case of the ImaiBerns method it could be concluded that the obtained
reflectance spectra are independent from the used camera, as somewhat negligibly
better results were obtained with the Nikon D700.
According to ΔE*ab calculations between measured and predicted L*a*b* values
ImaiBerns method was the most pronounced in case of black, saturated red and
blue patch samples, while SpecSens method was the most pronounced in case of
Acta Polytechnica Hungarica Vol. 12, No. 7, 2015
– 195 –
black, saturated red and green patch samples. Patches with the lowest ΔE*ab are
almost exclusively white, grey and also skin color shade samples in the case of
ImaiBerns method.
References
[1] R. E. Larraín, D. M. Schaefer, J. D. Reed, “Use of Digital Images to
Estimate CIE Colour Coordinates of Beef”, Food Research International,
Vol. 41, pp. 380-385, 2008
[2] R. Ide, H. Oguma, “Use of Digital Cameras for Phenological
Observations”, Ecological Informatics, Vol. 5, No. 5, pp. 339-347, 2010
[3] N. A. Clark, R. H. Wynee, D. L. Schmoldt, M. Winn, “An Assessment of
the Utility of a Non-Metric Digital Camera for Measuring Standing Trees”,
Computer and Electronics in Agriculture, 28, No. 2, pp. 151-169, 2000
[4] M. Tsutida, K. Yano, K. Hachimura, S. Tanaka, K. Furukawa, T. Nishiura,
W. Choi, W. Wakit, H. T. Tanaka, “Development of a High-Definition and
Multispectral Image Capturing System for Digital Archiving of Early
Modern Tapestries of Kyoto Gion Festival”, Pattern Recognition (ICPR),
20th
International Conference, Istanbul, Turkey, 2010
[5] M. Starešinič, B. Simončič, S. Bračko, “Using a Digital Camera to Identify
Colors in Urban Environments”, Journal of Imaging Science and
Technology, Vol. 55, No. 6, pp. 1-4, 2011
[6] F. B. Wheeler, M. J. Bennett, “Accurate Color: a Preliminary Investigation
into the Colour Gamut of Selected Special Collection Library Objects”,
UConn Libraries Published Works, accessed August 2011, available from
http://digitalcommons.uconn.edu/libr_pubs/37
[7] S. Van Poucke, “Automatic Colorimetric Calibration of Human Wounds”,
accessed June 2014, available from http://www.biomedcentral.com/1471-
2342/10/7
[8] F. H. Imai and R. S. Berns, “Spectral Estimation using Trichromatic Digital
Cameras”, in Proc. of the International Symposium on Multispectral
Imaging and Color Reproduction for Digital Archives, Chiba University,
Chiba, Japan, pp. 42-49, 1999
[9] Y. Miyake, “Evaluation of Image Quality Based on Human Visual
Characteristics”, Proc. of the First International Workshop on Image Media
Quality and its Applications, Nagoya, Japan, pp. 10-14, 2005
[10] A. S. Glassner, “How to Derive a Spectrum from an RGB Triplet”,
Computer Graphics and Applications, IEEE, Vol. 9, No. 4, pp. 95-99, 1989
[11] P. Stigell, K. Miyata, M. Hauta-Kasari, “Wiener Estimation Method in
Estimating of Spectral Reflectance from RGB Images”, Pattern Recognition
and Image Analysis, Vol. 17, No. 2, pp. 233-242, 2007
D. Javoršek et al. Comparison of Two Digital Cameras based on Spectral Data Estimation Obtained with Two Methods
– 196 –
[12] I. Nishidate, T. Maeda, K. Niizeki, Y. Aizu, “Estimation of Melanin and
Hemoglobin Using Spectral Reflectance Images Reconstructed from a
Digital RGB Image by the Wiener Estimation Method”, Sensors, Vol. 13,
pp. 7902-7915, 2013
[13] S. Bianco, F. Gasparini, R. Schettini, “Spectral-based Color Imaging using
RGB Digital Still Cameras: Simulated Experiments”, accessed June 2014,
available from
http://www.ivl.disco.unimib.it/papers2003/articolo_dsc_multispettrale.pdf
[14] R. Slavuj, P. Green, “To Develop a Method of Estimating Spectral
Reflectance from Camera RGB Values”, Colour and Visual Computing
Symposium, accessed June 2014, available from
http://www.google.si/url?sa=t&rct=j&q=&esrc=s&source=web&cd=34&ve
d=0CDsQFjADOB4&url=http%3A%2F%2Fcolorlab.no%2Fcontent%2Fdo
wnload%2F42497%2F569619%2Ffile%2FCVCS-
Radovan2013.pdf&ei=s6c1U-
wDYeCzAPb8oHYDQ&usg=AFQjCNFbUTd62J68gtXT-
9JSfwl23PB0Xg&bvm=bv.63808443,d.bGE
[15] P. M. Hubel, D. Sherman, J. E. Farrell, “A Comparison of Method of
Sensor Spectral Sensitivity Estimation”, Proceedings of Color Science,
System, and Application, pp. 45-48, 1994
[16] G. Sharma, H. J. Trussell, “Characterization of Scanner Sensitivity”,
Proceedings of Transforms and Transportability of Color, pp. 103-107,
1993
[17] G. Finlayson, S Hordley, P Hubel, “Recovering Device Sensitivities with
Quadratic Programming”, Proceedings of Color Science, System, and
Application, pp. 90-95, 1998
[18] K. Barnard, B. Funt, “Camera Characterization for Color Research”, Color
Research and Application, Vol. 27, No. 3, pp. 153-164, 2002
[19] M. Ebner, “Estimating the Spectral Sensitivity of a Digital Sensor using
Calibration Targets”, Proceedings of Conference on Genetic and
Evolutionary Computation, pp. 642-649, 2007
[20] R. Kawakami, H. Zhao, R. T. Tan, K. Ikeuchi, “Camera Spectral Sensitivity
and White Balance Estimation from Sky Images”, International Journal of
Computer Vision, Vol. 105, No. 3, pp. 187-204, 2013
[21] D. Javoršek, T. Jerman, B. Rat, A. Hladnik, “Assessing the Performance of
a Spectral Reflectance Estimation Method based on a Diffraction Grating
and a Spectroradiometer”, Coloration Technology, Vol. 130, pp. 288-295,
2014
[22] M. Nuutinen, P. Oittinen, “Recovering Spectral Data from Digital Prints
with an RGB Camera using Multi-Exposure Method”, IS\&T's Fourth
Acta Polytechnica Hungarica Vol. 12, No. 7, 2015
– 197 –
European Conference on Colour in Graphics, Imaging and Visualization
2010, pp. 120-125, 2010
[23] S. Westland, C. Ripamonti, “Computational Color Science using
MATLAB”, Chichester: John Wiley & Sons, p. 181, 131, 134, 2004
[24] “Decoding Raw Digital Photos in Linux”, accessed July 2014, available
from http://www.cybercom.net/~dcoffin/dcraw/
[25] T. Eckhard, E. M. Valero, J. Hernández-Andrés, “A Comparative Analysis
of Spectral Estimation Approaches Applied to Print Inspection”, 18
Workshop of the German Color Group, Darmstadt, Germany, pp. 13-24,
2012
[26] A. Ribes, F. Schmitt, “Linear Inverse Problems in Imaging”, Signal
Processing Magazine, IEEE, Vol. 25, No. 4, pp. 84-99, 2008
[27] “GNU Octave”, accessed July 2014 available from
http://www.gnu.org/software/octave/; last accessed 8 July 2014
[28] Photography – Electronic still-picture cameras – Methods for measuring
opto-eletronic conversion functions (OECFs) SIST ISO 14524:2011, Basel:
ISO, p. 23, 179-185, 2011