Embed Size (px)
Citation preview
Scientia Iranica A (2017) 24(5), 2320{2331
Sharif University of TechnologyScientia Iranica
Transactions A: Civil Engineeringwww.scientiairanica.com
Comparison of three-dimensional and two-dimensionalaxisymmetric �nite element analyses of a corner sectionof a tailings dam
M. Auchar Zardaria;�, H. Mattssonb, S. Knutssonb and L. Ormannc
a. Department of Civil Engineering, Quaid-e-Awam University of Engineering Science and Technology, Nawabshah, Pakistan.b. Department of Civil, Environmental and Natural Resources Engineering, Lule�a University of Technology, SE-97187 Lule�a,
Sweden.c. Fortum, Power Division, Renewable Energy, V�axn�asgatan 10, Box 2087, SE-65002 Karlstad, Sweden.
Received 9 December 2015; received in revised form 14 May 2016; accepted 8 August 2016
KEYWORDSTailings dam;Corner;Finite elementanalysis;Internal erosion;Consolidation;Slope stability.
Abstract. This paper presents three-dimensional (3D) and two-dimensional (2D)axisymmetric �nite element analyses of a corner of a tailings dam. The analyses wereperformed to: (i) locate tension and/or low-compression zones and evaluate slope stabilityduring sequential raising of the dam corner, and (ii) �nd whether the results of 2Daxisymmetric analyses could be reliable for the dam corner. The corner is a potentially weaksection of the dam, where tension and/or low-compression zones may develop. Developmentof such zones inside the dam corner can lead to cracks and initiation of internal erosion. Theresults of both the 3D and 2D axisymmetric analyses indicated that (i) tension and/or low-compression zones were located in vicinity of surface of the dam corner mainly above thephreatic level, and (ii) the dam corner was stable up to the planned height if it was graduallystrengthened with rock�ll berms on the downstream side. The results of 2D axisymmetricanalyses showed a fairly good agreement with those of 3D analyses. It is concluded that 2Daxisymmetric analyses are appropriate for this dam corner. This implies that signi�cantcomputational time can be saved by utilizing 2D analyses instead of 3D analyses.© 2017 Sharif University of Technology. All rights reserved.
1. Introduction
A corner of the Aitik tailings dam is the subject of thisstudy. The dam is situated in the north of Sweden.The dam corner is being raised with an upstreamconstruction method (see e.g. [1]). The depositedtailings exert horizontal pressure on the inside of thecurvature of the dam corner. This horizontal pressure
*. Corresponding author. Tel.: 00923331225200E-mail addresses: [email protected] (M.Auchar Zardari); [email protected] (H. Mattsson);[email protected] (S. Knutsson);[email protected] (L. Ormann)
doi: 10.24200/sci.2017.4157
is expected to increase due to additional raisings ofthe dam corner in future. Consequently, there maybe a risk of developing tension zones and/or low-compression zones in the dam corner.
Cracks are likely to occur at tension zones and/orlow-compression zones in the dam corner (see e.g. [2,3]).If the cracks appear in the transverse direction (i.e.,perpendicular to the length of the dam corner), theycan create a path for leakage through the embankment.Cracks in the dam corner can facilitate the process ofinternal erosion. The development of such cracks atinternal portions of the dam corner can pose a potentialrisk to the stability of the dam corner.
It is pertinent to mention here a failure of thecorner of the Ajka tailings pond in Hungary on October

M. Auchar Zardari et al./Scientia Iranica, Transactions A: Civil Engineering 24 (2017) 2320{2331 2321
4, 2010. In this incident, 0.6 million cubic meters ofa mixture of red mud and water were released. Asa consequence, ten people were killed and about 120people were injured [4]. One possible cause of thisfailure was development of cracks at tension zones inthe corner [5].
Three-dimensional (3D) �nite element analysesand two dimensional (2D) axisymmetric �nite elementanalyses were performed on the corner of the Aitiktailings dam. These analyses were carried out tolocate tension zones and/or low-compression zones andto evaluate slope stability of the dam corner. Theparticular aim of these analyses was to compare theresults of the 2D axisymmetric analyses with those ofthe 3D analyses in order to �nd out the reliability ofthe 2D axisymmetric analyses.
It should be noted that there are some casestudies about �nite element analyses of tailings damspresented in the literature, (e.g., [6-17]. To the authors'knowledge, the validity of 2D axisymmetric analyses fora dam corner has not been addressed before.
Three-dimensional analyses are generally consid-ered to be useful for corners of embankments (see,e.g., [18-21]). A �nite element program for three-dimensional models PLAXIS 3D [22] was utilized tosimulate gradual raisings of the corner of Aitik tailingsdam up to a height of 76 m. The gradual raisings ofthe dam corner were simulated in various stages. Eachstage consisted of a raising phase and a consolidationphase.
The 3D analyses of the dam corner consumedmuch computational time. For this reason, the damcorner was also analysed with a 2D axisymmetric �niteelement model in the program PLAXIS 2D [23] in orderto save computational time. The 2D axisymmetricmodel was chosen on the assumption that the damcorner resembled a nearly circular structure. Thisstudy was speci�cally performed to validate the resultsof the 2D axisymmetric analyses.
2. The Aitik tailings dam
Aitik is a copper mine, which is located at about 15 kmfrom G�allivare in the north of Sweden. The mine isowned by Boliden Mineral AB and is today one of thelargest copper mines in Europe and the largest openpit mine in Sweden. The mining activities started in1968. The annual production at the Aitik mine wasabout 34.3 million tonnes of ore in year 2012.
Tailings are the waste materials, which are pro-duced in slurry form during extraction of minerals fromthe ore. At Aitik, the tailings are pumped to thedisposal area, where they are discharged by spigottingfrom the dam embankments. Based on the particle size,the tailings in the vicinity of embankments of the Aitikdam can be classi�ed as silty �ne sands according to
the European Standard EN ISO 14688-1:2002 [24] andas silty sands according to the uni�ed soil classi�cationsystem [25].
Figure 1 shows the tailings impoundment, whichis spread over an area of 13 square kilometers. Thisimpoundment consists of four dams A-B, C-D, E-F(including E-F2 extension), and G-H.
Figure 2 presents a plan view of the corner E-F/G-H, which is the subject of the study. The damcorner is being progressively raised in stages. The damcorner was 37 m high in year 2012. It is planned toraise the dam corner gradually up to a height of 76 min year 2026. The corner ranges between the sectionsAA and EE (cf. Figure 2). The dam becomes almoststraight after the two outer sections AA and EE. Thedownstream slope of the corner has been gradually attened out from 1:6 (at sections AA and EE) to1:12 at the central section CC. For simpli�cation, boththe 3D analyses and 2D axisymmetric analyses wereperformed on the corner with a downstream slopeof 1:6, which gives a conservative estimate for slopestability.
Figure 1. Aerial view of Aitik tailings dam andimpoundment, amended from Google images [26].
Figure 2. Plan view of the dam corner.

2322 M. Auchar Zardari et al./Scientia Iranica, Transactions A: Civil Engineering 24 (2017) 2320{2331
3. The �nite element models
The �nite element programs PLAXIS 3D [22] andPLAXIS 2D [23] were utilized to analyse the dam cor-ner to identify tension zones and/or low-compressionzones and to determine slope stability for gradualraisings of the dam. The 3D and 2D �nite elementmodels, construction schedule, and material propertiesof the dam corner are described below.
3.1. 3D �nite element modelThe region BBDD of the corner (cf. Figure 2),with some modi�cations, has been chosen for the 3Danalyses. Geometrically, this region is considered tobe the most sensitive to the potential development oftension zones and/or low-compression zones comparedto the other parts of the dam.
The di�erent material zones are illustrated in thecross section of the dam corner in Figure 3. It wasmentioned before that the tailings material zones 2, 4,5, 6, 7, and 8 (cf. Figure 3) could be categorized assilty sands according to the uni�ed soil classi�cationsystem [25].
The elevation of the dam corner was +390 m inyear 2012 (Figure 3). It was planned to raise the damcorner in several stages at the rates of (i) 3 m peryear from level +376 m to +409 m and (ii) 2.5 mper year from level +409 m to +429 m (Figure 3).As per site conditions, every year, the raising of aparticular section of the Aitik dam is carried out inabout 10 days and the remaining 355 days are allowedfor consolidation process to take place. The sequentialraisings of the dam corner were simulated in 19 stages.Each stage consisted of a raising phase over 10 daysfollowed by a consolidation phase over 355 days.
The 3D �nite element mesh of the dam cornerincluding future raisings (up to level +429 m) ispresented in Figure 4. In the �nite element mesh, 10noded tetrahedral elements are used. These elementsgive a second-order interpolation of displacements [22].The 3D mesh is su�ciently re�ned to obtain reliableresults from the analyses.
The following boundary conditions are used in the3D �nite element model of the dam corner [22]:
1. The vertical model boundaries with their normal in
Figure 4. 3D �nite element mesh of dam corner.
x direction (parallel to the yz plane) are �xed in xdirection and free in y and z directions;
2. The vertical model boundaries with their normal iny direction (parallel to the xz plane) are �xed in ydirection and free in x and z directions;
3. The vertical model boundaries with their normalneither in x nor in y direction are �xed in x and ydirections and free in z direction;
4. The model bottom boundary is �xed in all x, y, andz directions;
5. The surface of the model is free in all x, y and zdirections;
6. Groundwater ow and/or consolidation are re-stricted to occur across: the bottom, the left verti-cal boundary, the right vertical boundary, and thecurved boundary between the left and right verticalboundaries (Figure 4). All the other boundaries areopen where groundwater ow and/or consolidationcan occur.
3.2. 2D �nite element modelThe dam corner has a complex three-dimensional ge-ometry. For simpli�cation, the dam corner was anal-ysed in a two-dimensional space with an axisymmetricmodel, which could be used for circular structureswith a nearly uniform radial cross section and loaddistribution around the central axis. Figure 5 showsa 2D axisymmetric model in which the x-coordinaterepresents the radius and the y-coordinate denotes theaxial line of symmetry [27].
Figure 6 shows the 2D �nite element mesh of thedam corner (up to level +429 m). The �nite elements
Figure 3. Cross section of dam corner.

M. Auchar Zardari et al./Scientia Iranica, Transactions A: Civil Engineering 24 (2017) 2320{2331 2323
Figure 5. Axisymmetric model in two-dimensionalspace [27], with permission from PLAXIS bv, Delft, theNetherlands.
Figure 6. 2D �nite element mesh of dam corner.
utilized in the mesh are triangular in shape with 15nodes. These elements give a fourth-order (quartic)interpolation for displacements [23]. The 2D mesh wasalso gradually re�ned to obtain results with su�cientaccuracy.
In the 2D �nite element model of the dam corner,water can ow through all boundaries except at theleft vertical boundary and the base. It is assumedthat horizontal displacements are zero along the leftvertical boundary. There is a dense and imperviousmoraine layer between the bottom of the dam and thebedrock. It was estimated that the average depth of
the moraine layer was about 8 m. Initially, an analysiswas performed on the dam with an 8 m thick morainefoundation. From this analysis, it was concluded thatthe moraine deposit had only a slight in uence on thesafety factors and associated slip surfaces. Therefore,for convenience, it was assumed that the foundationof the dam on the moraine was rigid and the morainelayer was not included in the analysis presented in thisstudy. However, it may be necessary to include themoraine layer in the �nite element model if the dam isto be raised further in the future.
3.3. Material propertiesThe Mohr-Coulomb (MC) model was utilized to rep-resent the constitutive behaviour of all the materialzones in the dam corner. The MC model is a simplelinear elastic perfectly plastic model, which requires�ve input parameters, i.e. Young's modulus, Poisson'sratio, friction angle, cohesion, and dilatancy angle.These parameters can be determined from basic soiltests [22,23]. In addition to the parameters requiredfor the MC model, other soil parameters such as unitweight and hydraulic conductivity are also needed forthe analyses [22,23].
Field and laboratory tests were performed onthe tailings material to evaluate the values of theparameters: Young's modulus, friction angle, cohesion,unit weight, and hydraulic conductivity [28,29]. Onthe other hand, suitable values of these parameters forother material zones (moraine, �lter, and rock�ll) wereobtained from the following references [30-34].
Table 1 presents the above-mentioned parametersfor all the material zones in the dam corner [28-34].
For each material zone of the dam corner, thevalue of the Poisson's ratio is assumed to be 0.33, whichis a suitable value for this type of analysis [22,23]. It is
Table 1. Material properties of various zones in the dam corner [28-34].
Materialzone
Materialtype
unsat
kN/m3 sat
kN/m3kx = ky
m/skz
m/sE
kN/m2c0
kN/m2'0
(deg)1 Moraine (initial dike) 20 22 1 � 10�7 5� 10�8 20000 1 352 Layered sand tailings 17 19 5 � 10�7 5� 10�8 9300 10 223 Moraine (dikes) 20 22 5 � 10�8 1� 10�8 20000 1 374 Compacted sand tailings 16 19 1 � 10�6 1� 10�7 8800 13 265 Soft sand tailings 18 18 1 � 10�7 1� 10�8 3100 6 186 Compacted sand tailings (dikes) 16 19 1 � 10�6 1� 10�7 7200 13 26
7, 8 Layered sand tailings 17 19 5 � 10�7 5� 10�8 3900 10 229 Filter 18 20 1 � 10�3 1� 10�3 20000 1 32
10, 11 Rock�ll (berms + externalerosion protection)
18 20 1� 10�1 1� 10�1 40000 1 42
Note: unsat is the unit weight above phreatic level, sat is the unit weight below phreatic level, kx and ky are the hydraulicconductivity in horizontal direction, kz is the hydraulic conductivity in vertical direction, E is the Young's modulus, c0 is thee�ective cohesion, and '0 is the e�ective friction angle.

2324 M. Auchar Zardari et al./Scientia Iranica, Transactions A: Civil Engineering 24 (2017) 2320{2331
assumed that the angle of dilatancy is zero for all thematerial zones of the dam corner [22,23]. This is anappropriate assumption because the use of a positivedilatancy angle may lead to unrealistically large tensilepore pressures (suction) and the use of a negativedilatancy angle may lead to unreasonably high porepressures [22,23].
Laboratory experiments were conducted with Per-meameter to determine the hydraulic conductivity ofthe tailings [28]. Because of the layered nature of thetailings, it was assumed that the hydraulic conductivityvalues in the horizontal direction were 10 times greaterthan the values in the vertical direction [30].
Tailings of the Aitik dam were categorized as looseand dense based on the tip resistance of the ConePenetration Test. The tailings were termed as loosewhere tip resistance was less than 2 MPa, whereasdilatant tailings exhibited tip resistance of 4-6 MPa.
For loading conditions of soils, PLAXIS manu-als [27] recommend to use the secant modulus at 50%strength as the Young's modulus (Figure 7). The val-ues of Young's moduli of di�erent material zones weredetermined from drained triaxial tests as illustratedin Figure 7. The Young's modulus of soils increaseswith the con�ning pressure. The experimental rangeof the con�ning e�ective stress is about 450 kPa whenthe dam reaches the level of 429 m. The magnitudeof Young's moduli for both loose and dilatant tailingsmaterial at three di�erent values of e�ective con�ningstresses were evaluated from drained triaxial tests.Eqs. (1) and (2) [28] were obtained by curve �tting fromthe plotted values of Young's moduli versus e�ectivecon�ning stresses:
Loose tailings E = 1 + 32�03 MPa; (1)
Dilatant tailings E = 6 + 30�03 MPa; (2)
where �03 is the e�ective con�ning stress in MPa.Material zones 4 and 6 comprise of dense tailings;
2, 7, and 8 are the mixture of both loose and densetailings; 5 consists of loose tailings (cf. Figure 3). For arepresentative value of the e�ective stress, a value of theYoung's modulus for (i) material zone 5 was evaluatedusing Eq. (1), (ii) material zones 4 and 6 were evaluatedusing Eq. (2), and (iii) material zones 2, 7, and 8 wereevaluated by taking average of the values obtained fromEqs. (1) and (2) (cf. Table 1 and Figure 3) since thesematerial zones contained both loose and dense tailings.For the zones 2, 5, and 7, the values of the Young'smoduli (cf. Table 1) were kept constant until the damlevel reached 409 m. On additional raisings of the damfrom level +409 m to +429 m, the values of the previousYoung's moduli of the tailings material zones 2, 5, and7 (cf. Figure 3) were re-calculated because the e�ectivestress was increased in the already deposited tailings.
Figure 7. Evaluation of Young's modulus from drainedtriaxial test [27], with permission from PLAXIS bv, Delft,the Netherlands.
Figure 8. Overestimation of undrained shear strength ofnormally consolidated soils using the Mohr Coulombmodel [27], with permission from PLAXIS bv, Delft, theNetherlands.
The new increased values of the Young's moduli ofthe tailings material zones 2, 5, and 7 (cf. Table 1for previous values of the Young's moduli) were about17400 kPa, 12300 kPa, and 8000 kPa, respectively.
It is to be noted that e�ective strength parameterswere utilized in the numerical analyses presented in thispaper. The MC model overestimates the undrainedshear strength of normally consolidated soils (e.g., clayand peat) if the e�ective strength parameters are used,as illustrated in Figure 8 [27]. This is because theMC model, in a stress path diagram, gives constantmean e�ective stress up to failure line (Figure 8).On the other hand, for normally consolidated soils,the mean e�ective stress decreases signi�cantly due topore pressures [22,23]. Consequently, the MC modeloverestimates the value of deviatoric stress (Figure 8).This implies that the MC model predicts greater valueof the mobilized shear strength than that of availableundrained shear strength.

M. Auchar Zardari et al./Scientia Iranica, Transactions A: Civil Engineering 24 (2017) 2320{2331 2325
In order to check whether the MC model over-estimates the undrained shear strength of the tailingsmaterial mentioned in this paper, the results of theundrained direct shear tests on the tailings were com-pared with the corresponding results simulated withthe MC model and a fair agreement was observed.Hence, it can be deduced that the MC model doesnot overestimate the undrained shear strength of thetailings material in the analyses described in this paper.
3.4. Slope stabilization with rock�ll bermsIt is relevant to mention here that the downstream sideof the dam corner has been gradually strengthened withrock�ll berms as shown in Figure 9. The rock�ll bermswere placed during various raising phases to increaseslope stability. The rock�ll berms are marked with thecapital letter R followed by a number (Figure 9). Forexample, R2 (Figure 9) indicates that this rock�ll bermhas been placed during the second raising. The volumeof the rock�ll berms, utilized in the present analyses ofthe corner, was adopted from another study performedby the authors on the straight dam section E-F [6]. Thereason for using the same volume of rock�ll is that boththe dam parts, i.e. the dam E-F and the dam corner,are almost identical in terms of material zones, rate ofraising, and time for raising and consolidation phases.For the sake of uniformity and ease of construction, itis also practical to use the same volume of rock�ll inboth parts of the dam.
4. Results
Coupled deformation and consolidation analyses [22,23,35-36] were carried out to simulate the gradual raisingsof the dam corner. These analyses were conducted toestimate the development and dissipation of excess porepressures, as a function of time, in the dam corner.
As mentioned before, the purpose of the analysesof the dam corner was to identify tension zones and/orlow-compression zones where cracks and internal ero-sion might occur. The magnitudes of the minore�ective principal stresses were used as a criterion tolocate potential tension zones and/or low-compression
zones. A tension zone is de�ned as a zone where theminor e�ective principal stresses are in tension. On theother hand, a low-compression zone is described as azone where the magnitudes of the compressive minore�ective principal stresses are reduced to small valuesnear zero. It is assumed that cracks may develop in thedam corner at tension zones and/or low-compressionzones.
It is also interesting to observe the directions ofthe minor e�ective principal stresses so as to know inwhich direction the potential cracks may develop andprogress. A crack in a dam may appear in a directionroughly perpendicular to the direction of the minore�ective principal stress. If minor e�ective principalstresses located in the longitudinal direction of thedam are of small magnitude, it is likely that cracksmay develop in the transverse direction. From stabilitypoint of view, the cracks in the transverse directionof the dam are more dangerous than those in thelongitudinal direction.
Analyses of safety were also performed by com-puting safety factors for slope stability and by ob-serving the potential failure zones for each raising ofthe dam corner. The results (minor e�ective principalstresses and safety factors) obtained with 3D analysesand 2D axisymmetric analyses of the dam are explainedand compared with each other. For the sake of brevity,the minor e�ective principal stresses computed fromthe 3D analyses and the 2D axisymmetric analyses arereferred to as 3D minor e�ective principal stresses and2D minor e�ective principal stresses, respectively. Thefollowing sign convention is used in this paper, thecompressive stresses are denoted by a positive sign, andthe tensile stresses are indicated with a negative sign.The sign convention adopted here is opposite to thesign convention utilized in the �nite element programsPLAXIS 3D and PLAXIS 2D [22,23].
4.1. Minor e�ective principal stressesThe magnitudes of 3D minor e�ective principal stressesand 2D minor e�ective principal stresses in the damcorner after the 18th raising are shown in Figures 10and 11, respectively. The magnitudes of both the
Figure 9. Placement of rock�ll berms on the downstream side to increase slope stability of the dam corner. Here the termR indicates a rock�ll berm and the number speci�es the raising during which the rock�ll berm was placed.
2326 M. Auchar Zardari et al./Scientia Iranica, Transactions A: Civil Engineering 24 (2017) 2320{2331
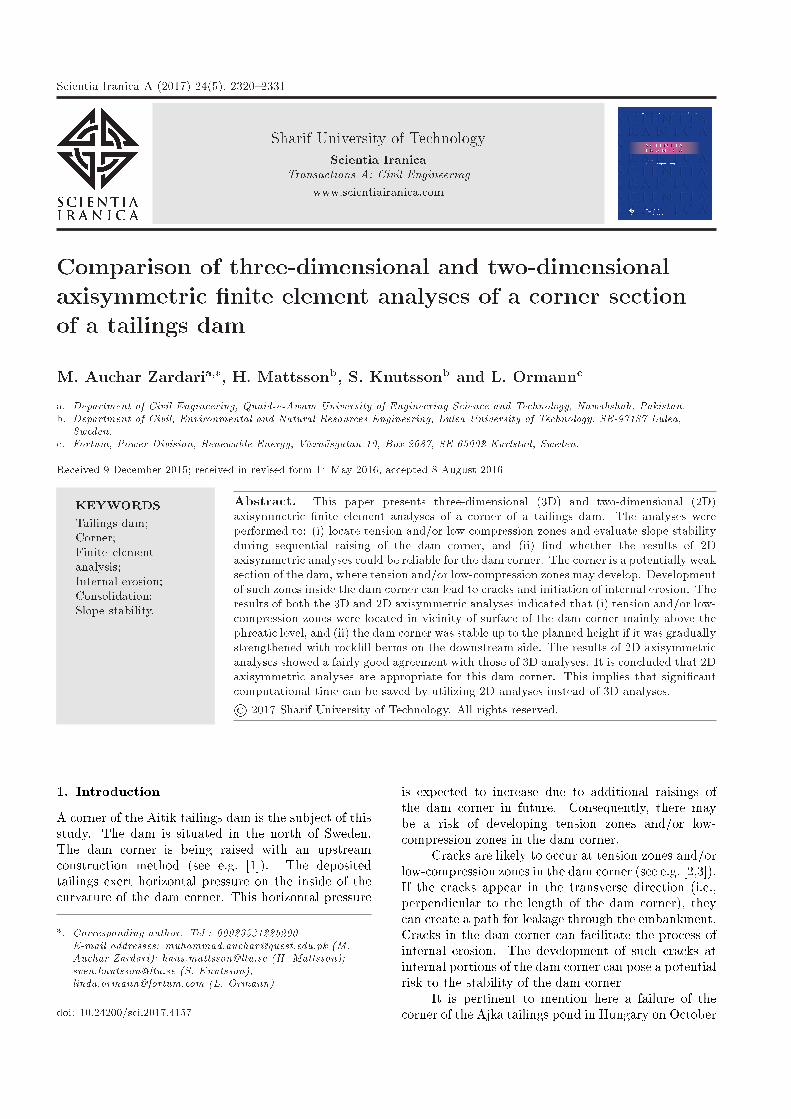
Figure 10. Distribution of the magnitude of 3D minore�ective principal stresses in the dam corner after the 18thraising. For visibility, the height of the �gure is enlargedtwice the original height.
Figure 11. Distribution of the magnitude of 2D minore�ective principal stresses in the dam corner after the 18thraising. For visibility, the height of the �gure is enlargedtwice the original height.
3D and 2D minor e�ective principal stresses indicatethat tension zones and/or low-compression zones arelocated in the vicinity of the surface of the dam cornerprimarily above the phreatic level (Figure 11). Internalerosion is not likely to occur through the embankmentsbecause no ow of water occurs above the phreatic leveland there is a �lter zone along the slope of the damcorner (see, e.g. [37]).
As expected, the magnitudes of both the 3Dand 2D compressive minor e�ective principal stresses(Figures 10 and 11) gradually increase from the surfaceto the bottom of the dam. This implies that a zonelocated in the lower part of the dam corner is morecompressed than the zones which lie above that zone.The increase in the magnitudes of both the 3D and 2Dcompressive minor e�ective principal stresses along thedepth of the dam corner suggests that cracks are notlikely to develop in the interior of the dam corner.
It can be observed that the distribution of magni-tude of 2D minor e�ective principal stresses (Figure 11)closely matches the distribution of magnitude of 3Dminor e�ective principal stresses (Figure 10).
Figure 12 illustrates the magnitude and directionsof 3D minor e�ective principal stresses in the dam atthe level of +376 m. It can be seen that 3D minore�ective principal stresses are largely located in thelongitudinal direction. It is to be noted that the 3D
Figure 12. Magnitudes and directions of 3D minore�ective principal stresses in the dam corner after the 18thraising at level +376 m. Here, the directions of the linesindicate the directions of the minor e�ective principalstresses and the colour of the lines represents themagnitude of the minor e�ective principal stresses.
minor e�ective principal stresses in the whole dam bodyare mainly located in the longitudinal direction, exceptat the bottom part of the dam (from level +353 mto +361 m), where the 3D minor e�ective principalstresses are mainly in the transverse direction. Thedirections of 2D minor e�ective principal stresses areobserved to be consistent with the directions of 3Dminor e�ective principal stresses.
From the above results, it is deduced that trans-verse cracks are not likely to develop in the interior ofthe dam because of the high magnitude of the minore�ective principal stresses at those locations. Theinterpretation that cracks are not likely to occur in theinterior of the dam implies that there is no increasedrisk of internal erosion in the dam corner. The reason isthat the process of internal erosion in an embankmentdam is frequently associated with the development ofcracks within the dam (see, e.g., [37]).
It was mentioned above that there was a closesimilarity between the magnitudes of the 3D minore�ective principal stresses and the 2D minor e�ectiveprincipal stresses. However, the quantitative di�erencein magnitude between the 3D and 2D minor e�ectiveprincipal stresses was also evaluated with the help ofan absolute norm and a relative norm. The absolutenorm Nabs gives the di�erence between the minor e�ec-tive principal stresses obtained from 2D axisymmetricanalyses and 3D analyses and is de�ned as:
Nabs = �032D � �033D; (3)
where �032D represents the minor e�ective principalstresses computed with the 2D axisymmetric analyses

M. Auchar Zardari et al./Scientia Iranica, Transactions A: Civil Engineering 24 (2017) 2320{2331 2327
and �033D symbolizes the minor e�ective principalstresses from the 3D analyses.
The relative normNrel shows increase or decrease,in percentage, of the 2D minor e�ective principalstresses compared to the 3D minor e�ective principalstresses and is expressed as:
Nrel = (�032D � �033D)=�03
3D: (4)
If the values of the absolute norm are small, itmay give impression that there is a negligible di�erencebetween the 2D and 3D minor e�ective principalstresses. However, the di�erence might be signi�cant,if it is evaluated in percentage. In order to avoid thistype of misjudgment, the relative norm is computedto quantify the di�erence in percentage. A drawbackof the relative norm is that the norm value can beabsurdly high even for small absolute deviations ifthe value of the 3D minor e�ective principal stressapproaches zero (cf. Eq. (4)). Obviously, both normsare needed.
The magnitudes of the 2D minor e�ective princi-pal stresses were computed at the Gauss points in the2D �nite element mesh. The Gauss points in the 2Dmesh were di�erent from those in the 3D mesh. It isnecessary to compare the magnitudes of the 2D and 3Dminor e�ective principal stresses at the same locationsin the dam. Therefore, an interpolation technique wasemployed to compute the magnitudes of the 3D minore�ective principal stresses at those points where themagnitudes of the 2D minor e�ective principal stresseswere obtained.
The values of the absolute norm and the relativenorm of the minor e�ective principal stresses weremainly observed in the range of 0 to 10 kPa and 0to 10%, respectively. For convenience, only the above-mentioned range of the values of the absolute normand the relative norm of the minor e�ective principalstresses is presented here.
The absolute norm and the relative norm of theminor e�ective principal stresses, after 18th raising ofthe dam corner, are presented in Figures 13 and 14,respectively. The absolute norm (Figure 13) indicatesthat in comparison with the 3D minor e�ective princi-pal stresses, the 2D minor e�ective principal stresseswere (i) overestimated about 0 to 10 kPa in majorportions of the dam, and (ii) underestimated about 0to 10 kPa in remaining parts of the dam.
The relative norm (Figure 14) showed the similartrends to those of the absolute norm (Figure 13). Therelative norm illustrates that in comparison with the3D minor e�ective principal stresses, the 2D minore�ective principal stresses were (i) about 0-10% highin major portions of the dam, and (ii) about 0-10%low in remaining parts of the dam.
From the norm values discussed above, it is inter-preted that there is not a signi�cant di�erence between
Figure 13. Absolute norm of the minor e�ective principalstresses after the 18th raising of the dam corner. Forvisibility, the vertical axis in the �gure is enlargedcompared to the horizontal axis.
Figure 14. Relative norm of the minor e�ective principalstresses after the 18th raising of the dam corner. Forvisibility, the vertical axis in the �gure is enlargedcompared to the horizontal axis.
the 2D and 3D minor e�ective principal stresses inthe dam corner. It leads to the conclusion that 2Daxisymmetric analyses are suitable for this dam corner.This is an important �nding, because 2D axisymmetricanalyses require much less computational time than 3Danalyses do.
4.2. Slope stabilityIt was described previously that the raisings of the damcorner were simulated in stages. In each stage, the damcorner was raised in 10 days followed by a consolidationperiod of 355 days. Moreover, the dam corner wasprogressively strengthened with rock�ll berms on thedownstream side (cf. Figure 9).
The stability of the dam corner was evaluated interms of factors of safety. The safety factor in the �niteelement programs PLAXIS 3D [22] and PLAXIS 2D[23] was computed by means of a strength reductionmethod [38]. In this method, the strength parameters,i.e. tangent of the friction angle and the cohesion of thesoil, are gradually decreased in the same proportionuntil failure of the structure occurs [22,23,38]. Thefactor of safety is de�ned as the ratio of available shearstrength of soil to the minimum shear strength requiredto maintain a just equilibrium state. The factor ofsafety is mathematically expressed as [22]:
Safety factor=Savailable
Sneeded for equilibrium=
c+�0ntan'cr+�0ntan'r
;(5)
where S is the shear strength; c and ' are the inputvalues and cr and 'r are the reduced values of the
2328 M. Auchar Zardari et al./Scientia Iranica, Transactions A: Civil Engineering 24 (2017) 2320{2331
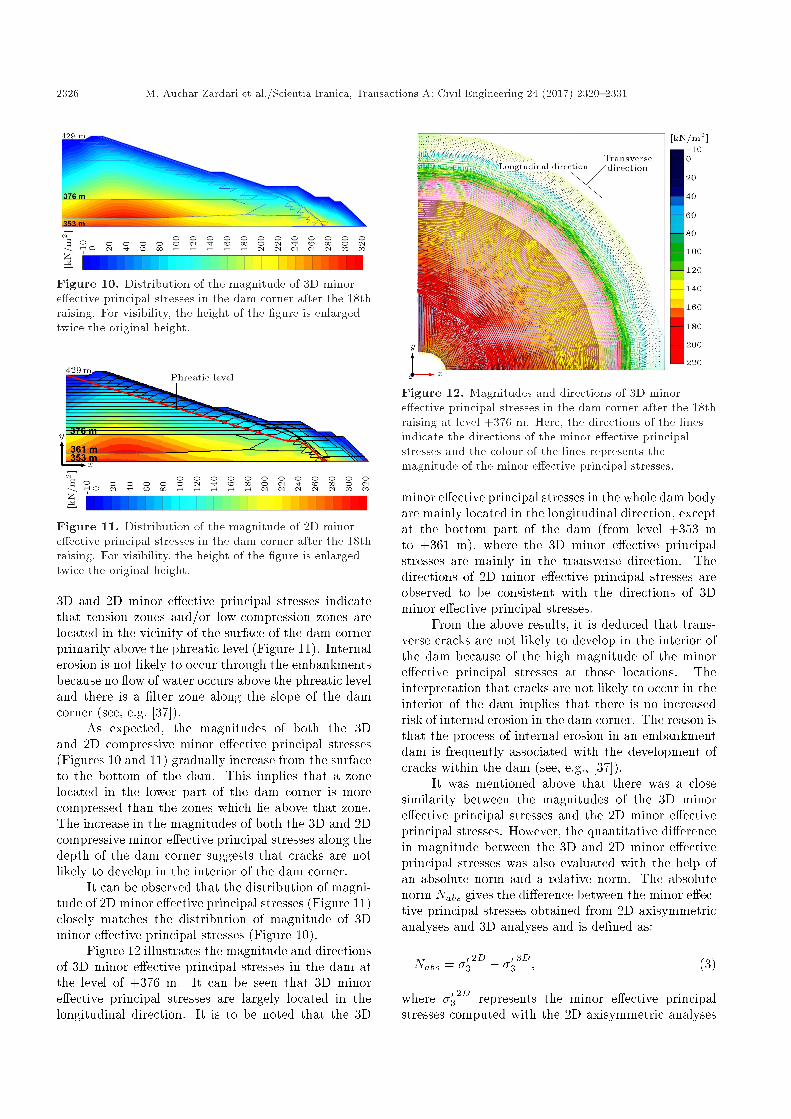
Figure 15. Comparison of safety factors computed with3D analyses and 2D axisymmetric analyses. Here, theterms R and C stand for raising and consolidation phases,respectively.
cohesion and friction angle of the soil, respectively; and�0n is the e�ective normal stress. It is to be noted thatthe de�nition of the safety factor becomes the samein the strength reduction method as in conventionallimiting equilibrium methods [38].
The safety factors computed with the 3D analysesand 2D axisymmetric analyses are here referred to as3D safety factors and 2D safety factors, respectively.Figure 15 shows the 3D safety factors and the 2Dsafety factors for all the raising phases and associatedconsolidation phases. It is seen that the factorsof safety increase gradually during the consolidationperiod due to dissipation of excess pore pressures andincrease in e�ective stresses.
The dam corner is considered to be safe withrespect to slope stability according to Swedish tailingsdams' safety guidelines document GruvRIDAS [30],which states that a safety factor of 1.5 is needed fora tailings dam to be declared as stable during normaloperation conditions.
The 2D safety factors were greater than 1.5 duringall the raising phases, except for the �rst raising wherethe magnitude of the safety factor was about 1.44,which was close to 1.5. This was interpreted as asu�cient stability during the �rst raising.
The 2D safety factors for each raising phase andthe associated consolidation phase were lower than thecorresponding 3D safety factors (Figure 15). This isbecause in a 3D analysis, �xity and soil strength inthe third dimension are taken into account and, asa result, the magnitude of the 3D safety factor ishigher than that of the 2D safety factor (see, e.g., [39]).This implies that the slope stability results of the damcorner computed with the 2D axisymmetric analyses
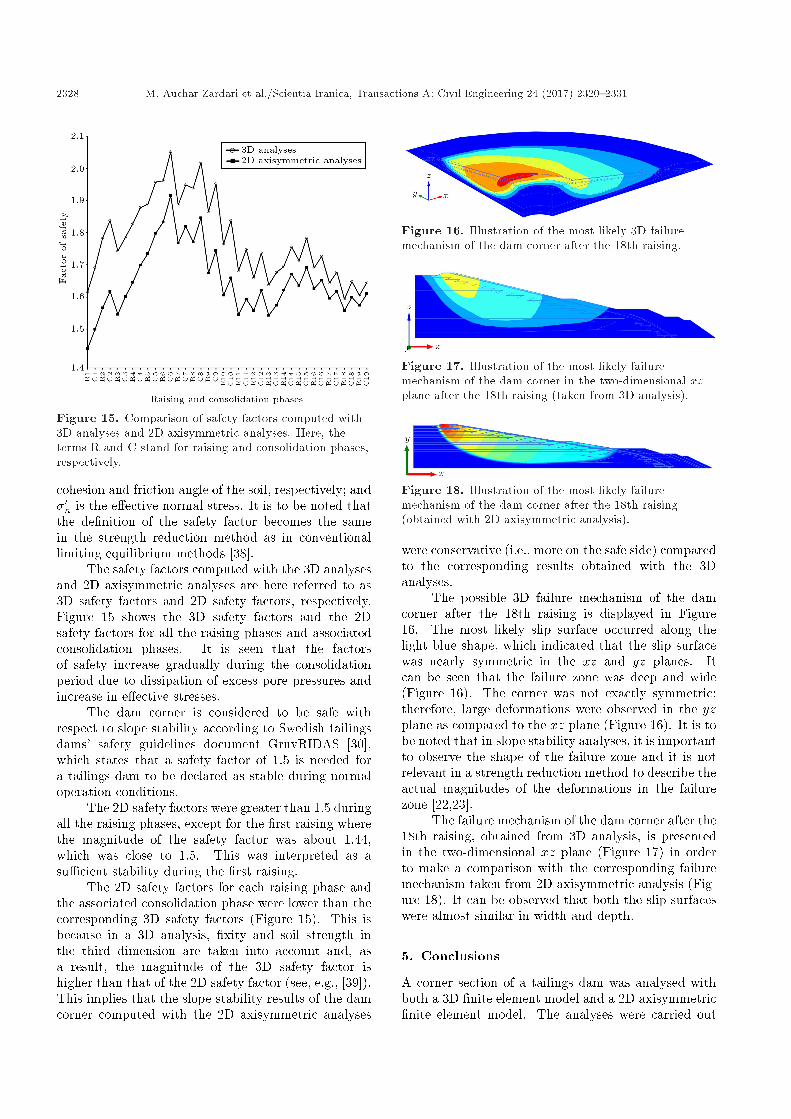
Figure 16. Illustration of the most likely 3D failuremechanism of the dam corner after the 18th raising.
Figure 17. Illustration of the most likely failuremechanism of the dam corner in the two-dimensional xzplane after the 18th raising (taken from 3D analysis).
Figure 18. Illustration of the most likely failuremechanism of the dam corner after the 18th raising(obtained with 2D axisymmetric analysis).
were conservative (i.e., more on the safe side) comparedto the corresponding results obtained with the 3Danalyses.
The possible 3D failure mechanism of the damcorner after the 18th raising is displayed in Figure16. The most likely slip surface occurred along thelight blue shape, which indicated that the slip surfacewas nearly symmetric in the xz and yz planes. Itcan be seen that the failure zone was deep and wide(Figure 16). The corner was not exactly symmetric;therefore, large deformations were observed in the yzplane as compared to the xz plane (Figure 16). It is tobe noted that in slope stability analyses, it is importantto observe the shape of the failure zone and it is notrelevant in a strength reduction method to describe theactual magnitudes of the deformations in the failurezone [22,23].
The failure mechanism of the dam corner after the18th raising, obtained from 3D analysis, is presentedin the two-dimensional xz plane (Figure 17) in orderto make a comparison with the corresponding failuremechanism taken from 2D axisymmetric analysis (Fig-ure 18). It can be observed that both the slip surfaceswere almost similar in width and depth.
5. Conclusions
A corner section of a tailings dam was analysed withboth a 3D �nite element model and a 2D axisymmetric�nite element model. The analyses were carried out

M. Auchar Zardari et al./Scientia Iranica, Transactions A: Civil Engineering 24 (2017) 2320{2331 2329
to identify tension zones and/or low-compression zonesand to evaluate slope stability of the dam cornerduring sequential raisings. A relative comparison waspresented for the results (the magnitudes and thedirections of the minor e�ective principal stresses, andfactors of safety) obtained with the 3D analyses andthe 2D axisymmetric analyses. The comparison showedthat the results of the 2D axisymmetric analyses wereconsistent with those of the 3D analyses.
The results of both the 3D analyses and 2Daxisymmetric analyses indicated that the tension zonesand/or low-compression zones were observed in thevicinity of the surface of the dam corner, mostly abovethe phreatic level. It is interpreted that internal erosionis not likely to occur through the embankment becausethere is a �lter zone along the slope of the dam cornerand no ow of water occurs above the phreatic level.The results of both the 3D and 2D stability analysesshowed that the dam corner could be raised safely upto a height of 76 m if the dam corner was graduallystrengthened with rock�ll berms on the downstreamside. As expected, the safety factors computed withthe 3D analyses were greater than those computed withthe 2D axisymmetric analyses.
A fairly good agreement was observed in themagnitudes and directions of the minor e�ective prin-cipal stresses computed with the 3D analyses and the2D axisymmetric analyses of the dam corner. This,together with the conservative values of the safetyfactors obtained, implies that the 2D axisymmetricanalyses are suitable for this particular dam corner. Asigni�cant amount of computational time can be savedby performing 2D axisymmetric analyses of the damcorner instead of 3D analyses.
It is recommended to include a dense morainelayer as the base of the dam in the �nite element modelif it is intended to raise the height of the dam cornerabove 76 m, since the compressibility of the morainemay then have in uence on the mechanical behaviourof the dam.
Acknowledgements
The authors would like to express their sincere thanksto Boliden AB, Sweden, for giving them an opportunityto carry out the presented study regarding the tailingsdams at the Aitik mine and its disposal facilities andfor giving access to site information. Ms. KerstinPousette at Lule�a University of Technology, Sweden,and Mr. Fredrik Jonasson at SWECO InfrastructureAB, Sweden, are to be acknowledged for performinglaboratory tests and providing information from �eldtests for evaluation of material parameters.
The �rst author would like to thank Lars ErikLundbergs Foundation, Sweden, for granting him ascholarship to conduct some part of his PhD research.
The \IRIS" project within the EU Fp7 frame-work, together with Lule�a University of Technol-ogy, Boliden AB, and \Swedish Hydropower Centre|SVC," is acknowledged for �nancial support, whichmade the work possible. SVC has been establishedby the Swedish Energy Agency, Elforsk and SvenskaKraftn�at together with Lule�a University of Technology,The Royal Institute of Technology, Chalmers Univer-sity of Technology, and Uppsala University.
Participating hydro power companies are: An-dritz Hydro Inepar Sweden, Andritz Waplans, E.ONVattenkraft Sverige, Fortum Generation, HolmenEnergi, J�amtkraft, Karlstads Energi, Linde En-ergi, M�alarenergi, Skellefte�a Kraft, Sollefte�aforsens,Statkraft Sverige, Statoil Lubricants, Sweco Infrastruc-ture, Sweco Energuide, SveMin, Ume�a Energi, Vatten-fall Research and Development, Vattenfall Vattenkraft,VG Power, and WSP.
References
1. Vick, S.G., Planning, Design and Analysis of TailingsDams, BiTech Publishers Ltd, Vancouver (1990).
2. Bui, H.N., Tandjiria, V., Fell, R., Song, C. and Khalili,N. \Two and three dimensional numerical analysisof the potential for cracking of embankment dams",UNICIV report No. R- 438, The University of NewSouth Wales Sydney Australia (2005).
3. Bui, H.N., Song, C. and Fell, R. \Two and threedimensional numerical analysis of the potential forcracking of embankment dams during construction",UNICIV report No. R- 426, The University of NewSouth Wales Sydney Australia (2004).
4. World information service on energy. \The Kolont�arred mud dam failure in Hungary", available from:http://www.wise-uranium.org/mdafko.html (2013).
5. Zanbak, C. \Failure mechanism and kinematics ofAjka tailings pond Incident", The Red mud project,available from http://www.redmud.org/Files/2010-ZANBAK Ajka%20Pond%20Failure-10%20Dec.pdf(2013).
6. Ormann, L., Zardari, M.A., Mattsson, H., Bjelkevik,A. and Knutsson, S. \Numerical analysis of strength-ening by rock�ll embankments on an upstream tailingsdam", Can. Geotech. J., 50(4), pp. 391-399 (2013).DOI: 10.1139/cgj-2012-0255.
7. Zardari, M.A., Mattsson, H. and Knutsson S. \3D�nite element analyses of a corner at Aitik tailings Damin Sweden", In Proceedings of the 13th Int. Symposiumon Environmental Issues and Waste Management inEnergy and Mineral Production (SWEMP), New Delhi,India, pp. 444-453 (2012).
8. Ormann, L., Zardari, M.A., Mattsson, H., Bjelkevik,A. and Knutsson, S. \Numerical analysis of curvedmebankment of an upstream tailings dam", Elec. J.of Geotech. Eng., 16/I, pp. 931-944 (2011).

2330 M. Auchar Zardari et al./Scientia Iranica, Transactions A: Civil Engineering 24 (2017) 2320{2331
9. Saad, B. and Mitri, H. \Hydromechanical analysis ofupstream tailings disposal facilities", J. of Geotech.and Geoenviron. Eng., 137(1), pp. 27-42 (2011).
10. Saad, B. and Mitri H. \Staged construction analysisof surface tailings disposal facilities", Int. J. of Min.,Reclam. and Environ., 24(1), pp. 44-63 (2010).
11. Zandar��n, M.T., Oldecop, L.A., Rodr��guez, R. andZabala, F. \The role of capillary water in the stabilityof tailing dams", Eng. Geol., 105(1-2), pp. 108-118(2009).
12. Psarropoulos, P.N. and Tsompanakis, Y. \Stability oftailings dams under static and seismic loading", Can.Geotech. J., 45(5), pp. 663-675 (2008).
13. Saad, B. \Transient coupled analysis of upstreamtailings disposal facilities construction", Ph.D Thesis,Department of Mining and Materials Engineering,McGill University, Montreal, Canada (2008).
14. Gens, A. and Alonso, E.E. \Aznalc�ollar dam failure.Part 2: Stability conditions and failure mechanism",G�eotechnique, 56(3), pp. 185-201 (2006).
15. Priscu, C. \Behavior of mine tailings dams under hightailings deposition rates", Ph.D Thesis, Department ofMining and Metallurgical Engineering, McGill Univer-sity, Montreal, Canada (1999).
16. Priscu, C., Mitri, H., Keira, H. and Jacobsz, S.W.\Evaluation of mine tailings dams behaviour - A casestudy", In Proceedings of the Sixth Int. Conf. onTailings and Mine Waste `99, Fort Collins, Colorado,A.A Balkema Publishers, Rotterdam, the Netherlands,pp. 325- 334 (1999).
17. Desai, C.S., Shao, C., White, D. and Davis, S. \Sta-bility analysis for consolidation and dynamic responseof mine tailing dam", In Proceedings of the Fifth Int.Conf. on Tailings and Mine Waste '98, Fort Collins,Colorado, A.A Balkema Publishers, Rotterdam, theNetherlands, pp. 193-200 (1998).
18. Zhang, Y., Chen, G., Zheng, L., Li, Y. and Zhuang,X. \E�ects of geometries on three-dimensional slopestability", Can Geotech J., 50(3), pp. 233-249 (2013).DOI: 10.1139/cgj-2012-0279.
19. Nian, T., Huang, R., Wan, S. and Chen, G. \Three-dimensional strength-reduction �nite element analysisof slopes: Geometric e�ects", Can. Geotech. J., 49(5),pp. 574-588 (2012). DOI: 10.1139/t2012-014.
20. Hungr, O., Salgado, F.M. and Byrne, P.M. \Evalua-tion of a three dimensional method of slope stabilityanalysis", Can. Geotech. J., 26, pp. 679-686 (1989).DOI: 10.1139/t89-079.
21. Xing, Z. \Three dimensional stability analysis of con-cave slopes in plan view", J. Geotech. Eng., 114(6),pp. 658-671 (1988). DOI.org/10.1061/(ASCE)0733-9410(1988)114:6(658).
22. Brinkgreve, R.B.J., Engin, E. and Swolfs, W.M.\PLAXIS 3D manuals", PLAXIS b.v., the Netherlands(2011).
23. Brinkgreve, R.B.J., Swolfs, W.M. and Engine, E.\PLAXIS 2D manuals", PLAXIS bv, the Netherlands(2011).
24. The European Standard EN ISO 14688-1. \Geotechni-cal investigation and testing - Identi�cation and classi-�cation of soil - Part 1: Identi�cation and description"(2002).
25. Wagner, A.A. \The use of the uni�ed soil classi�cationsystem by the bureau of reclamation", In Proceedingsof the Fourth Int. Conf. SMFE, 1, Butterworths,London, pp. 125-134 (1957).
26. Google. \Satellite view of Aitik tailings damnear G�allivare, Sweden", Available at http://maps.google.com (2011).
27. Brinkgreve, R.B.J., Kumarswamy, S. and Swolfs,W.M. \PLAXIS 2D reference and material modelsmanuals", PLAXIS bv, the Netherlands (2016).
28. Jonasson, F. \Geotechnical sampling of tailings at damEF and GH Aitik" [Geoteknisk provtagning av an-rikningssand damm EF och GH Aitik], SWECO VBB,Lule�a, Sweden, Uppdragsnummer 2473649 (2007).
29. Pousette, K. \Laboratory tests on tailings from Aitik"[Laboratorief�ors�ok p�a anrikningssand fr�an Aitik], In-ternal working document, Lule�a University of Tech-nology, Lule�a, Sweden (2007).
30. GruvRIDAS \The Swedish mining industry guide fordam safety" [Gruvindustrins riktlinjer f�or damms�a-kerhet], Svensk Energi AB/SveMin, Stockholm (2007).
31. Statens vattenfallsverk \Earth and rock�ll dams"[Jord-och stenfyllningsdam-mar], Stockholm (1988).
32. St�al, T., Wedel, P. and Av�en, S. (editors) \Geotech-nical construction handbook" [Handboken ByggGeoteknik] LiberF�orlag Stockholm (1984).
33. Bergdahl, U., Ottosson, E. and Malmborg, B.S. \Shal-low foundations" [Plattgrundl�aggning], AB SvenskByggtj�anst och Statens Geotekniska Institut, Stock-holm (1993).
34. V�agverket. Bro \The Swedish road administrationguidelines for construction and improvement of bridge"[V�agverkets allm�anna tekniska beskrivning f�or nybyg-gande och f�orb�attring av broar], Borl�ange (2004).
35. Potts, D.M. and Zdravkovi�c, L., Finite Element Anal-ysis in Geotechnical Engineering. Theory, ThomasTelford Ltd, London (1999).
36. Britto, A.M. and Gunn, M.J., Critical State Soil Me-chanics Via Finite Elements, Ellis Horwood Limited,West Sussex, England (1987).
37. Fell, R., MacGregor, P., Stapledon, D. and Bell, G.,Geotechnical Engineering of Dams, Balkema, Leiden(2005).
38. Brinkgreve, R.B.J. and Bakker, H.L. \Non-linear �niteelement analysis of safety factors", In Proceedingsof Seventh Int. Conf. on Computer Methods andAdvances in Geomechanics, Cairns, Australia; A.ABalkema publishers, Rotterdam, the Netherlands, pp.1117-1122 (1991).

M. Auchar Zardari et al./Scientia Iranica, Transactions A: Civil Engineering 24 (2017) 2320{2331 2331
39. Gri�ths, D.V. and Marquez, R.M. \Three-dimensionalslope stability analysis by elasto-plastic �nite ele-ments", Geotechnique, 57(6), pp. 537-546 (2007).DOI: 10.1680/geot.2007.57.6.537.
Biographies
Muhammad Auchar Zardari is Assistant Professorin the Department of Civil Engineering at Quaid-e-Awam University of Engineering Science and Technol-ogy, Nawabshah, Pakistan. His main research interestsare numerical modelling of geotechnical structures,design of deep foundations, stability of hydropowerdams, and reinforced baked clay as a low-cost materialfor building construction.
Hans Mattsson is Associate Professor in the Depart-ment of Civil, Environmental and Natural ResourcesEngineering at Lulea University of Technology, Lulea,
Sweden. His main research interests are geotechnicalmodelling, numerical analysis, hydropower dams, tail-ings dams, and internal erosion.
Sven Knutsson is Professor in the Department ofCivil, Environmental, and Natural Resources Engineer-ing at Lulea University of Technology, Lulea, Sweden.His main research interests are frost, frost action, thawweakening, permafrost, snow mechanics, water reten-tion dams, stability of tailings dams, internal erosion,mechanical properties of coarse grained material, useof industrial by-products, and dredging and depositionof dredged sediments.
Linda Ormann is Geotechnical Engineer at Fortum,Power Division, Renewable Energy, Karlstad, Sweden.She has earned an MSc in Civil Engineering in Sweden.Her research interests are safety of dams and numericalmodelling of dams.