Embed Size (px)
Citation preview

Comparison of simultaneous dual-isotope multi-pinhole SPECT
with rotational SPECT in a group of patients with coronary artery disease (CAD).
Peter P. Steele, Dennis L. Kirch, John E. Koss
Western Cardiology Associates, Westminster CO
Contact:Dennis L. Kirch, MSEE
Western Cardiology Associates
8407 Bryant Street
Westminster, CO 80031
[email protected](e-mail)
(303) 906-2112(Voice)
(303) 426-8688(FAX)
Contact information for first author is same as above. First author (Dr. Steele) is a
physician in private practice.
Total word count (including abstract): 5204
Abstract word count: 288
Captions word count: 475
Total word count: 5967
Running foot line: Multi-pinhole SPECT in patients with CAD
Page 1
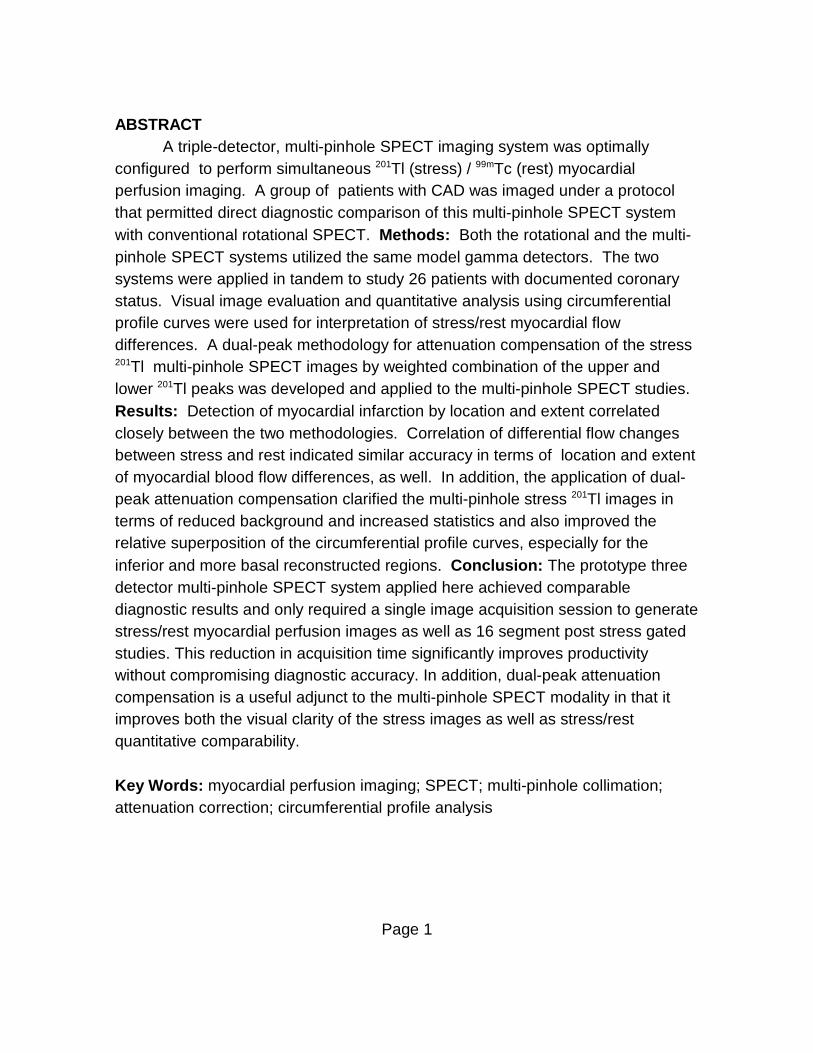
ABSTRACT
A triple-detector, multi-pinhole SPECT imaging system was optimally
configured to perform simultaneous Tl (stress) / Tc (rest) myocardial201 99m
perfusion imaging. A group of patients with CAD was imaged under a protocol
that permitted direct diagnostic comparison of this multi-pinhole SPECT system
with conventional rotational SPECT. Methods: Both the rotational and the multi-
pinhole SPECT systems utilized the same model gamma detectors. The two
systems were applied in tandem to study 26 patients with documented coronary
status. Visual image evaluation and quantitative analysis using circumferential
profile curves were used for interpretation of stress/rest myocardial flow
differences. A dual-peak methodology for attenuation compensation of the stress
Tl multi-pinhole SPECT images by weighted combination of the upper and201
lower Tl peaks was developed and applied to the multi-pinhole SPECT studies. 201
Results: Detection of myocardial infarction by location and extent correlated
closely between the two methodologies. Correlation of differential flow changes
between stress and rest indicated similar accuracy in terms of location and extent
of myocardial blood flow differences, as well. In addition, the application of dual-
peak attenuation compensation clarified the multi-pinhole stress Tl images in201
terms of reduced background and increased statistics and also improved the
relative superposition of the circumferential profile curves, especially for the
inferior and more basal reconstructed regions. Conclusion: The prototype three
detector multi-pinhole SPECT system applied here achieved comparable
diagnostic results and only required a single image acquisition session to generate
stress/rest myocardial perfusion images as well as 16 segment post stress gated
studies. This reduction in acquisition time significantly improves productivity
without compromising diagnostic accuracy. In addition, dual-peak attenuation
compensation is a useful adjunct to the multi-pinhole SPECT modality in that it
improves both the visual clarity of the stress images as well as stress/rest
quantitative comparability.
Key Words: myocardial perfusion imaging; SPECT; multi-pinhole collimation;
attenuation correction; circumferential profile analysis

Page 2
INTRODUCTION
Myocardial perfusion imaging is a useful diagnostic tool for assessing
patients with CAD as well as those at risk for this illness. In clinical practice,
SPECT perfusion imaging is most often accomplished by rotation of large gamma
camera detector(s) about the patient. This procedure is generally conducted in
two separate stress and rest phases and compares perfusion images obtained
under rest conditions using Tc or Tl, against those obtained separately using99m 201
Tc injected during stress. Interpretation of the relative perfusion uptake99m
between stress and rest is made by visual and quantitative comparison. These
rotational SPECT perfusion images are generally accurate, but there is a
troublesome frequency of falsely negative and falsely positive results (1-3).
The multi-pinhole SPECT imaging approach, as applied here, maintains the
detectors in a stationary or fixed position throughout acquisition which has several
advantages in comparison to rotational SPECT imaging. The whole heart is
imaged continuously by all of the non-overlapping pinhole views throughout the
entire acquisition period resulting in a consistent, high-count data set for image
reconstruction. This characteristic is shared by multi-pinhole SPECT and PET
imaging. Since the introduction of multi-pinhole SPECT in 1978 by Vogel et al. (4),
several improvements have been made to the methodology. Extension of the
multi-pinhole method to multiple-headed SPECT methodology was first proposed
by Bizais et al. (5) and Koral et al. (6). Simultaneous stress/rest multi-pinhole
SPECT has also been developed (7) which allows the stress ( Tl) and resting201
( Tc) multi-pinhole images to be acquired in a single imaging session. This99m
reduces artifacts due to stress versus rest image inconsistencies caused by
patient positioning, motion or cardiac volume changes which can occur between
separate stress and rest acquisitions. More recently, a dual-peak approach for
attenuation compensation of the stress Tl images has been developed (8)201
which further improves stress/rest multi-pinhole SPECT image comparability.
In sequentially acquired rotational SPECT projections, temporal changes
lead to data inconsistencies between views. In this circumstance, the various
rotational projections see the heart under condition of changing size, shape or
position from view to view. In mathematical terms these inconsistencies produce
an ill conditioned data set containing ambiguities which will potentially generate
artifacts in the reconstructed myocardial perfusion images as described by
Bacharach (9). Compounding this problem, since the motion artifacts are not
reproducible between the separate stress and rest rotational acquisitions, these

Page 3
artifacts can potentially cause the appearance of false positive stress versus rest
flow differences in rotational SPECT reconstructions.
This type of view-to-view inconsistency cannot occur with simultaneous
stress/rest multi-pinhole SPECT imaging because all of the individual views are
acquired during the same coincidental time period. It remains true that motion
during acquisition causes blurring or resolution loss in SPECT images, but such
motion affects both the stress and rest multi-pinhole images equivalently because
both image sets are being acquired simultaneously. Therefore, patient motion of
any kind is not likely to produce the false-positive appearance of a stress/rest flow
difference in multi-pinhole SPECT images because the type of data
inconsistencies that can degrade stress/rest comparability are essentially
eliminated when both images sets are acquired together.
Additional advantages of multi-pinhole SPECT include reduced incidence
of repeat studies due to patient movement, improved patient comfort in terms of
arm positioning, increased patient throughput because only a single image
acquisition is required and a much simpler system design with fewer moving parts.
The significant gain in sensitivity reported by Funk et al. (10) for multi-pinhole over
rotational SPECT is achieved because the multiplicity of pinhole views are active
through the entire acquisition period utlizing the available detector surface area
with greater efficiency. The pinhole methodology described here also allows serial
measurement of the left ventricular contractile indices by gated analysis during
recovery from stress, high resolution gated list-mode acquisition using less activity
and dynamic acquisition of images acquired using myocardial tracers such as
Tc labeled teboroxime (11).99m

Page 4
MATERIALS AND METHODS
SPECT System Configuration
The goal of this study is to compare myocardial perfusion studies
performed by multi-pinhole technique with rotational studies acquired using
equivalent multidetector SPECT systems in a group of patients with known CAD.
In order to make this comparison directly, perfusion studies were performed on
the same patients by implementing both modalities on identical triple-head Picker
Prism 3000XP SPECT systems. An unmodified system was utilized to perform
conventional rotational SPECT imaging by procedures consistent with routine
SPECT cardiac methodology. A second identical Prism 3000XP system was
modified (Fig. 1A) to perform multi-pinhole SPECT by remounting the three
detectors at fixed locations, with 67.5° angular separation between the middle
line-of-sight of each detector. The detectors were remounted with 90° rotation
from their original orientation so that the long axis of the detector was parallel to
the longitudinal axis of the patient’s body (Fig. 1B). This design optimally views the
180° LAO region surrounding the cardiac apex, thereby placing the pinholes in
closest proximity to the heart and less affected by attenuation and scatter.
By this approach, the multi-pinhole SPECT design utilizes three detectors
(each having a 250 mm by 375 mm UFOV) which were equipped with 2 by 3 view
multi-pinhole collimators (6 mm pinhole diameters) to simultaneously project a set
of 18 views onto separate 125 mm square non-overlapping regions of the
detectors. The correction tables for energy and linearity distortions were loaded
by the manufacturer’s recommended procedures but the detector uniformity
correction capability was turned off. Instead, a flood image acquired through each
collimator was used to correct for detector nonuniformity and pinhole sensitivity
variations. Data was acquired in list-mode format.
For rotational SPECT, an important aspect of our imaging protocol
concerned the fact that the patients were reclined in the supine position for 15
minutes prior to the onset of image acquisition for both the resting and stress
images. This is done to allow time for cardiovascular equilibration to occur,
thereby, reducing both respiratory motion and stabilizing the position and volume
of the left ventricle prior to rotational image acquisition. Equilibration prior to
image acquisition reduces the likelihood that the cardiac volume itself will vary
during acquisition, thereby causing inconsistencies in the rotational SPECT data
set but it does not completely eliminate the possibility that other causes of volume
change or spurious patient movement will occur (Fig. 2). Cardiac arrhythmias,

Page 5
patients dosing off and awakening, coughing and respiratory issues are just a few
of the unpredictable, uncontrollable (and often undetectable) circumstances over
which we have little control. Our simultaneous multi-pinhole SPECT acquisition
protocol, however, allows image acquisition to begin immediately following
completion of stress to facilitate the study of left ventricular contraction and
monitor volume changes during recovery from stress.
Patient Inclusion Criterion
Twenty-six patients (23 men, ages 44 to 73 years) were studied. All had
arteriographically defined CAD, and all had been clinically stable for at least four
months. This was a consecutive series with no patients excluded once stress/rest
imaging studies were completed. Patients were selected to encompass the range
of clinically expressed coronary disease which is encountered in practice.
Patients were also selected to include a range of body builds which was of
concern because the multi-pinhole camera utilized a fixed detector orientation.
Only the patient imaging table was adjustable. Weights ranged from 57 to145 kgs
and all were successfully positioned. Informed consent was reviewed and signed
by all patients according to a protocol approved by the Institutional Review Board
of Presbyterian/St. Luke’s Hospital, Denver, Colorado.
Eighteen of these patients had prior myocardial infarction which was
classified by location as apical-anterior, anterior, anterior-inferior, apical-superior,
apical-inferior, inferior, inferior-basal and posterior-basal in location. Patients were
intentionally selected for the location and extent of infarction which was defined as
a region of decreased segmental wall thickening with a history of clinically
documented infarction. Previous coronary arteriography and clinical stress testing
followed by SPECT myocardial perfusion imaging were the documentation criteria
used to identify patients for inclusion in this study. The patient group included
those with an extent of CAD from mild to severe.
Validation of the diagnostic accuracy for SPECT myocardial perfusion
imaging in application to CAD can be established in various ways. The stratified
risk of CAD can be determined (pretest likelihood of disease) in patients
presenting for clinical testing and the results of SPECT imaging results can then
be interpreted in terms of the degree of normalcy for correlation with the pretest
likelihood. In the situation where two different imaging modalities are being
compared, interpretative results can also be graded in terms of diagnostic
confidence for correlation with the clinical outcome for each patient. We have
utilized an alternative approach where the two modalities are applied to a group of

Page 6
patients in which the clinical outcome is known in advance of SPECT imaging and
the images are compared in terms of quality, as measured by interpretive
confidence and correlation with coronary arteriographic findings. This approach
makes each arteriographic segment available as a separate interpretive test
sample, effectively expanding the sample size.
We have chosen to avoid the use of rotational SPECT imaging as our
reference standard for this study, because this introduces the expectation that
images from subsequent modalities should look identical or superior but not in any
way different. The mathematic criterion for exact reconstruction of a three-
dimensional distribution function requires a fully three-dimensional sampling
geometry covering 2B steradians. This not physically achievable in the application
of SPECT to image the heart by either multi-pinhole or rotational SPECT
technique. Considering that multi-pinhole and rotational SPECT have somewhat
different sampling geometries it is expected that the reconstructed images from
these two modalities will be similar but not identical.
Coronary arteriography is not a perfect standard of comparison either.
Often, the degree to which a lower level obstruction (e.g., 50-80%) might be
expected to decrease myocardial flow does not correlate with the observed
decrease in stress induced myocardial blood flow demand. Furthermore, patent
coronary arteries in areas of infarction, patent bypass grafts and patent
angioplastic intervention do not necessarily support normal myocardial blood flow.
It is also to be expected that normal native coronary arteries can provide adequate
flow following stress testing and, therefore, the corresponding segments should
demonstrate normal perfusion images and curves.
The arteriograms were reviewed in terms of whether or not a difference in
myocardial blood flow could possibly occur in a given left ventricular segment with
exercise stress. These segments were defined as “tenable segments” in that they
represented regions of possible blood flow difference that potentially could result
from exercise stress. The clinical definition of a tenable segment required a >50%
decrease in the cross-sectional diameter of the coronary artery supplying that
segment. All patients were right coronary dominant. That is, both right coronary
and left circumflex supplied segments were present in all patients.
A tenable segment could also include a segment involved in myocardial
infarction, independent of whether the coronary artery supplying this segment was
patent or not. This is because changes in left ventricular segmental wall tension in
and around areas of infarction can also alter blood flow distribution. A tenable

Page 7
segment was also considered to be one supplied by an artery in which angioplasty
or stent placement had occurred (at least four months prior to inclusion in all
cases). This is due to the potential for various degrees of partial restenosis to
occur in arteries following intervention, as was the case for a number of patients
selected for this study. Finally, all segments where a bypass graft had been
placed during coronary bypass surgery were considered as tenable, because the
designation of “normal flow” cannot be assumed even when graft patency has
been previously established.
Four segments of each annular reconstructed short axis slice were
analyzed: anterior, inferior, posterior, and superior. The anterior segment
corresponds to the 120° interventricular septum. Inferior segments are defined as
those from the 90° arc extending toward the posterior segment from the septum.
Superior segments are those including the 90° arc extending from the superior
aspect of the septum toward the posterior wall. Posterior segments are those
encompassed by the 60° arc between the superior and the inferior segment.
Patients were selected such that up to four myocardial segments could potentially
show a blood flow difference following exercise stress (i.e., tenable segments). It
was anticipated that abnormalities in blood flow distribution would not occur in all
tenable segments with exercise. The majority of the patients in this group had
segments where blood flow maldistribution would be a virtual impossibility (i.e.,
nontenable segments).
Exercise Stress Testing and Imaging Protocol
In order to complete both multi-pinhole and rotational SPECT imaging
procedures within the same day for each patient, treadmill exercise testing was
undertaken in two sessions, performed 90-120 minutes apart to allow full
recovery. Stress testing was performed using the standard Bruce Protocol in all
cases and was intentionally symptom limited. Only two patients had myocardial
ischemic signs and symptoms during the exercise test. Exercise duration lasted
from five to twelve minutes prior to stress injection ( Tl for multi-pinhole or Tc201 99m
as tetrofosmine for rotational SPECT imaging). All injections were made exactly
one minute prior to cessation of exercise. The peak heart rate achieved during
the last minute of exercise for any individual varied by less than 5% for the paired
exercise tests.
Following the initial placement of an intravenous line, injection of 222 MBq
of Tc was made at rest. The patient was then reclined for 15 minutes on the99m

Page 8
imaging table prior to the acquisition of the resting rotational SPECT image set.
The first treadmill exercise test was then performed, with administration of 148
MBq of Tl occurring one minute prior to the end of exercise. Immediately201
following completion of exercise, the patient was reclined for simultaneous
imaging of Tl (stress) and Tc (rest) by multi-pinhole SPECT technique during201 99m
a single 20 minute imaging session. Positioning of the patient for multi-pinhole
SPECT was easily accomplished and was not limited by body habitus in any of
this patient group. The acquisition of this simultaneous image completed the
multi-pinhole portion of the study. Thus, the initial injection of the Tc agent at99m
rest provided data for the resting images for both the rotational as well as the
multi-pinhole SPECT portions of the study.
Following an adequate recovery period, the second graded treadmill
exercise test was performed with stress injection of 1100 MBq of Tc The99m
patient was then reclined in a supine position for the standard 15-minute
equilibration period prior to acquisition of the final rotational SPECT stress images.
This completed the acquisition of same-day, multi-pinhole and rotational SPECT
data. All injected isotope doses were weight adjusted and the activity levels given
here are mean values.
Data Acquisition, Reconstruction and Analysis
During multi-pinhole SPECT image acquisition, the combined stress/rest
data were streamed into a list-mode file containing the (x,y) coordinates, the
energy value of each gamma event and the R-wave trigger signals generated from
the ECG gate. Following multi-pinhole acquisition, this list-mode data file was
then reformatted (1.78 mm pixel size) for off-line correction for scatter, cross-talk,
and nonuniformity, followed by attenuation compensation of the stress Tl201
images. Reconstruction was performed (4.03 mm voxel size) by 12 iterations of
MLEM algorithm using filtered back-projection (FBP) as the initial estimate. The
same reconstruction approach was used for both the multi-pinhole as well as the
rotational SPECT reconstructions.
All rotational SPECT studies were acquired in the standard step-and-shoot
mode (40 seconds each image in 6° steps) using LEHR collimation. Rotational
images were stored in 64 by 64 pixel matrices. The acquisition pixel size and the
reconstructed voxel sizes were both 5.34 mm. This acquisition protocol supports
reconstruction of the stress gated rotational SPECT images into16 frame
animations per R-to-R interval with statistical quality comparable to that of the
multi-pinhole gated reconstructions. The cine presentation of the rotational

Page 9
images was reviewed visually prior to reconstruction to detect visible patient
motion. The 180° portion of the full 360° data acquisition, which was most
proximal to the apex of the heart, was selected from the FBP initial estimates prior
to reconstruction. Care was taken to reconstruct the rest and stress studies in a
reproducible manner that was spatially consistent between the individual stress
and rest reconstructions. Scatter and attenuation correction were not applied to
the rotational SPECT studies.
For both the rotational and multi-pinhole data, the same method of
circumferential profile analysis was applied to develop stress/rest curve pairs for
eight equally spaced short-axis annular images between the apex and the base of
the heart. Middle-of-the-wall, maximum-value tracking in 6° increments around
each short axis slice was performed using an automated program with manual
override capability. The values used to populate the curves were the average of
the maximum pixel value from the middle of the wall and the two immediately
adjacent inner and outer pixels along each of the 60 radial search lines.
Each stress and rest circumferential profile curve was initially normalized to
100% at the maximum value. Upon review of the over-plotted, normalized
stress/rest curves, if this approach resulted in plots showing the resting curve
falling significantly below the stress curve, then the point of normalization was
relocated to this anomalous region. Specifically, all portions of each stress/rest
curve pair were reviewed to detect any contiguous 30° segments in which the
resting curve was >5% below the stress curve. We consider such an occurrence
to be physiologically erroneous. This approach constrains the resting curve to be
substantially equal to or above the stress curve over every segmental portion of
the myocardium.
This same normalization process was applied to scale the intensity of the
stress and rest images prior to visual evaluation so that quantitative differences
between the curves would be consistent with the visual appearance in
corresponding regions of the myocardium. When circumferential profile curves are
normalized by simply setting the maximum uptake value of each individual curve
to 100 percent, cris-crossing patterns are frequently observed for which there is no
satisfactory explanation in the field of exercise physiology. In this circumstance,
our approach to normalization applies a constraint which prevents the resting
curve from tracking significantly below the stress curve and also eliminates the
appearance of defects in the resting images which are not seen in the stress
images (reverse redistribution). Curves and images normalized in this manner
support interpretive results which are better correlated with the clinical findings.

Page 10
Attenuation Compensation Methodology
Over the range of the energy spectrum that is useful for myocardial
perfusion imaging with Tl, there are two energetic regions (one in the lower201
energy range of 69-83 keV and a higher peak at 167.5 keV) which contain
radionuclide emissions that are useful for estimation of the attenuation
characteristics. The gamma emissions attributed to the lower and upper peaks
were additively combined by our approach (8) to achieve what we term “dual-peak
attenuation compensation.” An anthropomorphic heart phantom was used to
determine the optimal weighting for additive combination of the images from these
two peaks. This was evaluated in terms of visual and quantitative equivalence
between stress ( Tl) and rest ( Tc) multi-pinhole SPECT images. 201 99m
This approach is supported by the fact that the 140 keV energy peak of
Tc is located in between the lower and upper peaks of Tl. It is implemented99m 201
by weighting the individual images from the upper and lower Tl peaks (following201
scatter, crosstalk and uniformity correction) to have an equal number of total
scaled counts, which are then additively combined to form the attenuation
compensated stress image. This process generates composite stress multi-
pinhole Tl images that have visual and quantitative characteristics which more201
nearly correspond to those of the resting Tc multi-pinhole images. We did not99m
apply any attenuation compensation methodology to the resting Tc multi-99m
pinhole images prior to reconstruction.

Page 11
RESULTS
Visual interpretation of location and extent of infarction
In this study 18 of the 26 patients had a prior myocardial infarction. As
noted earlier, patients were selected to include all potential locations of infarction
and to cover a range of infarction sizes corresponding to left ventricular ejection
fractions (LVEF) ranging from 0.25 to 0.63. In all patients the location of the
infarction was consistently identified in both the multi-pinhole and rotational
SPECT images (e.g., an apical-anterior infarction in one modality was not an
anterior-superior or anterior-inferior infarction in the other imaging modality, and
so forth). Visual inspection of infarct size was comparable between the two
methodologies, although as previously reported (12-14) the appearance of defects
in the Tl multi-pinhole SPECT images was slightly larger.201
Visual interpretation of flow differences
The comparison of paired stress/rest perfusion studies in patients with prior
infarction and in those without infarction resulted in multi-pinhole and rotational
SPECT images which are clinically similar but not identical. As previously
discussed, the different sampling geometries for the two modalities influence the
specific appearance of the final reconstructed images. This is the major factor
contributing to the visual differences in the multi-pinhole and rotational short axis
images shown in our results (Figs. 2, 3 and 7).
However, these differences did not significantly effect clinical interpretation
of the studies included here because interpretation depends on relative
differences visually observed and quantified by circumferential profile analysis of
normalized stress/rest image sets (Figs. 4, 5 and 6). One observer (PS) felt that
the multi-pinhole images were generally easier to interpret and provided greater
certainty in grading abnormalities, although we recognize that this is a subjective
impression.
Circumferential profile curve analysis
Curve quantification available from the circumferential profile analysis
provides an objective means to support precise visual image evaluation. A
comparative example of the short axis images and circumferential profile curves
on the same patient for one of these studies is shown in Figure 3 and 4,
respectively. For the tenable segments there is a general agreement between the
multi-pinhole and the rotational SPECT perfusion images. Furthermore, results
from circumferential profile curve analysis of myocardial blood flow differences in
the 18 patients with documented infarction correlated well with the images

Page 12
produced by both the multi-pinhole and rotational methodologies. Thirty-seven
segments (out of 72 possible) were tenable. In rotational SPECT studies 18 of 37
(49%) showed a flow difference. For the multi-pinhole curves, 19 of 37 (51%)
demonstrated a difference that was considered significant.
Most of the blood flow differences in these patients were in segments that
also contained an infarct. There was no relationship between patency of the
infarct-related artery and the presence or the extent of flow differences. The
presence of an infarct induced scar poses another nonobstructive mechanism of
maldistribution of blood flow arising from altered myocardial wall tension. Results
of positive findings in left bundle branch block represent a similar observation. In
this small group of patients, analysis of heart rate times the blood pressure
product at the end of exercise did not correlate well with quantitative
measurements of flow differences. However, extending this concept to a larger
group of patients might prove useful. Vasodilator stress perfusion imaging might
be fruitful in correlating flow differences in areas of infarction for patients who
otherwise are difficult to evaluate clinically.
In this study group, 8 patients have not had infarction. Out of 32 possible
segments 20 were considered to have a potential flow difference with exercise
stress (tenable segments). With rotational SPECT imaging, 9 of the 20 (45%)
segments demonstrated flow differences, whereas10 of the 20 (50%) tenable
segments had a flow difference with multi-pinhole SPECT imaging. Again, the
quantitative precision obtained with circumferential profile analysis was essential
for demonstration of flow differences in segments supplied by arteries with less
severe blockages. This was demonstrated visually in the multi-pinhole images
compared with those obtained with rotational SPECT in a patient with left anterior
descending obstruction (Fig. 5).
Rotational SPECT studies demonstrated flow differences in 5 of the 26
patients (19%) who had flow differences in angiographically defined nontenable
segments. These differences (Fig. 6) occur most often in apical-superior
segments and are typically small differences that an experienced observer might
safely ignore. However, these small changes occurred in a segment that is often
supplied by the diagonal branch of the left anterior descending coronary artery,
which challenges its exclusion. None of the multi-pinhole SPECT perfusion
images had flow differences in nontenable segments.

Page 13
Attenuation Compensation
Our dual-peak approach to attenuation compensation resulted in images
with less noise, enhanced contrast (lower background) and clinically consistent
profile curves in 8 patients (31%) as compared to the multi-pinhole images without
attenuation compensation (Fig. 7). However, there were no instances in which a
diagnostic difference was revealed following application of dual-peak attenuation
compensation. It was apparent to one interpreter (PS) that diagnostic certainty
was increased by its application.
This approach utilizes intrinsic information available from the multiple
energy peaks of Tl as acquired during simultaneous stress/rest imaging.201
Therefore, no additional radiation exposure is imposed and there are no alignment
issues in registering the attenuation information with the images themselves. As
would be expected, the inferior and posterior-basal segments benefitted most
from application of dual peak attenuation compensation (Fig. 7), since they are
deeper within the thorax.
We term the process described here to be “attenuation compensation”
rather than “attenuation correction” since we have not advanced its use to
compute an attenuation map or attempted absolute quantification of myocardial
blood flow. It would be of interest to compare our dual-peak attenuation
compensation approach with attenuation maps generated by the more rigorous x-
ray computerized tomographic method because the possibility exist, with proper
validation and correlation, that this approach could be extended to achieve
absolute blood flow quantification. Supplemental data showing the compilation of
the correlative clinical information including perfusion images, circumferential
profile curves and gated analysis for all 26 patients reported on in this paper are
contained in a PowerPoint presentation which is available online at ©
www.nuclear-cardiology.com .

Page 14
DISCUSSION
In the group of patients studied here we have demonstrated that multi-
pinhole SPECT myocardial perfusion imaging achieved comparable diagnostic
accuracy in comparison to rotational SPECT in terms of detection of the location
and size of myocardial infarction and measurement of the location and extent of
myocardial blood flow differences. By multi-pinhole technique 29 segments out of
a possible 56 tenable segments indicated a flow difference whereas 27 of these
segments showed a flow difference with rotational SPECT. The patients in our
study were selected to include many subtle flow differences in the tenable
segments, so it is difficult to know with absolute certainty whether multi-pinhole
imaging is more sensitive than rotational. It is clear, however, that in this study
group sensitivity was not compromised by the simultaneous Tc/ Tl multi-99m 201
pinhole SPECT imaging protocol.
A primary benefit of the multi-pinhole SPECT approach was born out by the
absence of the type of motion induced defects to which rotational SPECT is
subject as seen in Figure 2. If such artifactual segments are excluded, there is
little diagnostic difference between multi-pinhole and rotational SPECT camera
systems in this group of patients. The use of a 15-minute pre-image equilibration
period for rotational SPECT image acquisition is an important qualifier to this
finding. As has been reported elsewhere, commencement of rotational SPECT
imaging too soon following exercise can lead to false positive findings in rotational
SPECT due to upward creep (15) or cardiac volume changes.
Variability in cardiac position due to respiration during the rotational
imaging period may also be a factor contributing to the artifacts in rotational
images. The predominantly apical superior location is suggestive of this
possibility. Rotational images were analyzed both with and without the
commercially supplied motion correction program, but this additional analysis did
not successfully eliminate these artifacts. The higher sensitivity achieved by multi-
pinhole SPECT imaging lends itself to a motion correction scheme which is
capable of accommodating respirational motion and in preliminary studies,
correction for respiratory motion achieved resolution improvement in reconstructed
multi-pinhole SPECT images (16).
Attenuation compensation improved image quality when applied to the
multi-pinhole. In no instance was a diagnostic difference apparent between
uncompensated versus attenuation compensated multi-pinhole images.
Attenuation compensated images demonstrated lower background and the

Page 15
circumferential profile curves were less noisy in about one-third of the stress
images for the patients in this study group. In the group of patients studied here,
attenuation compensation is considered to reduce systematic error, enhance
interpretive diagnostic certainty and is easily incorporated into routine imaging
preprocessing when list-mode data is available.
Brown et al. (17), first suggested the use of the high peak of Tl to201
characterize attenuation effects. However, their approach was based on the use
of rotational SPECT with limited statistical content which only allowed identification
of specific patients whose studies would benefit from more rigorous attenuation
correction such as might be available from dual-modality SPECT/CT. The
sensitivity of the rotational SPECT camera systems used for comparative
purposes here and in the work of Brown, et al. (17), are very similar. Therefore,
our attenuation compensation approach could not be applied to the rotational
studies in this report.
The Tc activity injected (222 MBq for the simultaneous multi-pinhole99m
SPECT protocol) was chosen to provide adequate resting count statistics without
overwhelming the stress counts present in the region of the lower Tl peak (148201
MBq) with Compton scatter. At these injected activity levels the quality of the multi-
pinhole studies was maintained while reducing the imaging time by half. The
ability to generate images of this quality using the activity levels given results from
the whole heart being continuously imaged in all views simultaneously. This also
allows measurement of left ventricular volume, ejection fraction, contractile
indices, segmental wall motion and thickening to be made during recovery from
stress, representing additional measurements that can assist image interpretation.
This work also points to the future prospects that multi-pinhole SPECT can be
applied to other clinical applications such as myocardial viability, as well as true
dynamic SPECT studies of tracer kinetics leading to the ability to make absolute
measurements of myocardial blood flow.
Finally, even though significantly less Tc activity was needed for99m
simultaneous multi-pinhole SPECT imaging, equivalent diagnostic accuracy was
obtained with only a single combined stress-rest imaging session. The fact that
patient, staff and facility procedure times are reduced for multi-pinhole SPECT
without compromising diagnostic outcome is also of intrinsic value.

Page 16
CONCLUSION
Multi-pinhole SPECT as described here, using a stationary multi-detector
system, increases detection sensitivity and reduces systematic errors associated
with myocardial perfusion imaging. The improved statistical content of these
images facilitates simultaneous dual-isotope stress/rest perfusion imaging, dual-
peak attenuation compensation of the stress images, more precise stress/rest
quantification of flow differences and reduced incidence of motion induced
artifactual features in the reconstructed images.
In the patient group reported here multi-pinhole SPECT images are
comparable in diagnostic accuracy to those produced by rotational SPECT
technique, but at significantly reduced cost, improved patient comfort and an
expenditure of time and effort that is approximately one-half that of rotational
SPECT. The elimination of mechanical motion by multi-pinhole approach reduces
the complexity associated with both the manufacture and maintenance of
rotational dedicated cardiac SPECT systems.
The multi-pinhole approach also supports other diagnostic capabilities
which are difficult to perform by rotational acquisition. This is accomplished in
conjunction with the use of circumferential profile analysis which facilitates both
precise quantification of perfusion flow differences and accurate measurement of
gated cardiac performance. The ability to form all images simultaneously also
represents a significant step toward the ability to quantify dynamic tracer uptake
and washout characteristics leading to absolute flow measurements.
ACKNOWLEDGMENTS
The authors wish to thank Drs. Bruce Hasegawa and Tobias Funk of the
University of California, San Francisco for many helpful suggestions regarding
approaches to the multi-pinhole, multidetector design and Dr. J. Keenan Brown of
Mindways Software, Inc. (Austin, Texas) who provided useful guidance on
methods for reconstruction of images generated from limited angular sampling
geometry. Mr. Al Blount provided invaluable contributions to the assembly,
calibration and technical support for operation of the Prism 3000XP as modified to
perform multi-pinhole SPECT imaging. We also wish to thank Mr. Jeffery Nobles,
Mr. Michael Adams, Todd Bublitz and Ms. Louise Renoux for their capable
technical assistance.

Page 17
REFERENCES
1.Van Train KF, Garcia EV, Maddahi J, et al. Multicenter trial validation for
quantitative analysis of same-day rest-stress technetium-99m sestamibi
myocardial tomograms. J Nucl Med. 1994;35:609-618.
2. Patterson R, Horowitz S, Eisner R. Comparison of modalities to diagnose
coronary artery disease. Semin Nucl Med. 1994;24:286-310.
3. Des Prez RD, Shaw LJ, Gillespe RL, et al. Cost-effectiveness of myocardial
perfusion imaging: A summary of the currently available literature. J Nucl Cardiol.
2005;12:750-759.
4. Vogel RA, Kirch DL, Lefree M, et al. A new method of multiplanar emission
tomography using a seven pinhole collimator and an Anger scintillation camera. J
Nucl Med. 1978;19:648-654.
5. Bizais Y, Bennett GW, Brill AB, Rowe RW, Zubal IG. Dual seven pinhole
tomography. IEEE Trans. Nucl Sci. 1983; 30: 703-706.
6. Koral IF, Clinthorne NH, Rogers WL, Keyes JW Jr. Feasibility of sharpening
limited-angle tomography by including an orthogonal set of projections. Nuclear
Instrum Methods. 1982;193:223–227.
7. Kirch DL, Koss JE, Steele PP, Johnson TK. Performance and Clinical Trials of
a multi-pinhole nonrotational cardiac SPECT system [abstract]. J Nucl Med.
2000;41(suppl):177P.
8. Kirch DL, Koss JE, Steele PP. Dual-peak attenuation compensation (DPAC)
using the upper and lower Tl-201 peaks during simultaneous stress/rest multi-
pinhole SPECT (MP-SPECT) for myocardial perfusion imaging (MPI) [abstract]. J
Nucl Med. 2007;48 (suppl 2):99P
9. Bacharach, SL. Why does SPECT work? J Nucl Cardiol. 2006;13:313-315
10. Funk T, Kirch DL, Koss JE, et al. A novel approach to multi-pinhole SPECT for
myocardial perfusion imaging. J Nucl Med. 2006;47:595-602.
11. Koss JE, Steele PP, Kirch DL. Increased spatial and temporal resolution of
Gated Myocardial Perfusion Images (GMPI) achieved by Multi-pinhole SPECT
(MP-SPECT) [abstract]. J Nucl Med. 2007;48 (suppl 2):420P.
12. Matsunari I, Fujino S, Taki J, et al. Comparison of defect size between
thallium-201 and technetium-99m tetrofosmin myocardial single-photon emission
computed tomography in patients with single-vessel coronary artery disease. Am J
Cardiol. 1996;77:350-354.
13. Zaret BL, Rigo P, Wackers FJ, et al. Tetrofosmin International Trial Study
Group. Myocardial perfusion imaging with Tc tetrofosmin: comparison to Tl99m 201

Page 18
imaging and coronary angiography in a phase III multicenter trial. Circ.
1995;91:313-319.
14. Glover DK, Mirta Ruiz ME, Yang JY, et al. Myocardial Tc-tetrofosmin99m
Uptake During Adenosine-Induced Vasodilatation With Either a Critical or Mild
Coronary Stenosis: Comparison With Tl and Regional Myocardial Blood Flow. 201
Circ. 1997;96:2332-2338.
15. Friedman J, Van Train K, Maddahi J, et al. “Upward creep” of the heart: a
frequent source of false-positive reversible defects during thallium-201 stress-
redistribution SPECT. J Nucl Med. 1989;30:1718-1722.
16. Kirch DL, Koss JE, Steele PP. Motion Correction (MC) of muliti-pinhole
SPECT (MP-SPECT) myocardial perfusion imaging (MPI)on breath-by-breath
basis improves accuracy in measurement of LV function [abstract]. J Nucl Med.
2007; 48(suppl 2):42P.
17. Brown JK, Tang HR, Hattner RS, et al. Intrinsic dual-energy processing of
myocardial perfusion images. J Nucl Med. 2000;41:1287-1297

Page 19
FIGURES
Figure 1. Picker Prism 3000XP is shown as modified for multi-pinhole cardiac SPECTperfusion imaging (A). System is shown setup for patient to be positioned “feet-in” sothat the three detectors will surround the LAO position of the heart. Detector 3 has beenremounted between detectors 1 and 2 and three detectors were rotated 90 degreesfrom the original mounting configuration. A closeup of all three detectors with pinholecollimators in place is shown in (B).

Page 20
Figure 2. Short axis reconstructions for multi-pinhole (A) and rotational (B) SPECTacquisitions performed on a patient showing an inferior-lateral defect. Resting imagesare shown above the stress images. Arrows point to an artifact caused by patientmotion which occurred during acquisition of the resting rotational SPECT images. Thistype of motion artifact is eliminated by the simultaneous multi-pinhole SPECTtechnique.

Page 21
Figure 3. Short axis reconstructions for multi-pinhole (A) and rotational (B) SPECTacquisitions performed on a patent with an anterior flow difference. Resting images areshown above the stress images. The images from the two modalities are visually andquantatively similar. (See curves in Figure 4). The same areas of anterior flowdifference are identified in both sets of images but (A) shows a larger stress defect thanthe rotational SPECT results in (B).

Page 22
Figure 4. Circumferential profile analysis of the short axis images shown in Figure 3 formulti-pinhole (A) and rotational (B) SPECT reconstructions. The same anterior regionsof flow difference are identified in both sets of curves but the multi-pinhole analysisshows greater flow differentiation (open arrows) than the rotational analysis (closedarrows).

Page 23
Figure 5. Circumferential profile analysis of the short axis slices from multi-pinhole (A)and rotational (B) SPECT acquisitions on a patient with an anterior infarct. Low levelflow differences as seen in the region of the infarct in the multi-pinhole study (openarrows) are also demonstrated to a lesser extent in the rotational study (closed arrows).

Page 24
Figure 6. Circumferential profile analysis of the short axis slices from multi-pinhole (A)and rotational (B) SPECT acquisitions on a patient with an inferior defect. The curvesfor both (A) and (B) analyses show inferior flow differences (open arrows) which areconsistent with the patient’s history. The rotational study also shows flow differences inthe superior apical region (solid arrows) which are inconsistent with the location of anyknown obstructions.

Page 25
Figure 7. Short axis reconstructions from multi-pinhole myocardial perfusion SPECTstudy demonstrating dual-peak attenuation compensation. The top row (A) shows theresting images using Tc as tetrofosmin. The simultaneously acquired Tl stress99m 201
reconstructions which combine both peaks of Tl are shown in (B). The bottom two201
rows show the separate reconstructions for the lower peak of Tl (C) and the upper201
peak in (D). The attenuation compensated stress images in (B) visually compare betterto the resting images in (A) than the stress images from the two separated thalliumpeaks shown in (C) and (D).