Embed Size (px)
Citation preview
1
There is continued interest in physiological imaging to select patients for reperfusion therapy in acute ischemic stroke.1 In
this context, ischemic core volume is an increasingly important determinant for the success of reperfusion therapy. Accuracy of acute ischemic core volume estimates is clinically important, particularly as a volume of 70 mL is considered a critical upper limit, above which outcome is poor.2–5 Computed tomographic perfusion (CTP) analysis produces brain perfusion maps that indicate several parameters, including cerebral blood volume (CBV), cerebral blood flow (CBF), mean transit time (MTT), and time to maximum (T
max). These parameters are combined in
different ways and based on different thresholds in a summary map to quantitatively distinguish between the ischemic core and hypoperfused tissue.6,7 The latter refers to tissue that is likely to have critically lowered perfusion and includes both salvageable tissue and already irreversibly damaged tissue (ischemic core). The difference between the hypoperfusion volume and the isch-emic core volume indicates the tissue at risk.
Although commercial software packages for CTP analysis are widely available, there is an ongoing debate as to whether CTP analysis can estimate the final infarct volume (FIV) with sufficient accuracy. Furthermore, there is no clear con-sensus about which parameters and thresholds are optimal to accurately predict ischemic core and tissue at risk.8–13 On the basis of the various studies from Wintermark et al, König et al, and Olivot et al, vendors defined different parameters and thresholds for their CTP software.6,14–22 However, informa-tion is lacking about the predictive accuracy of CTP and FIV, particularly after mechanical thrombectomy (MT). Recent clinical trials of MT, which applied CTP for patient selec-tion, showed a different benefit from the treatment effects of MT.5,23,24 When comparing CTP postprocessing of the stud-ies, it becomes obvious that different software packages were applied for CTP analysis. We, therefore, hypothesize that the accuracy of the various commercial CTP software packages differs in predicting the FIV after MT.
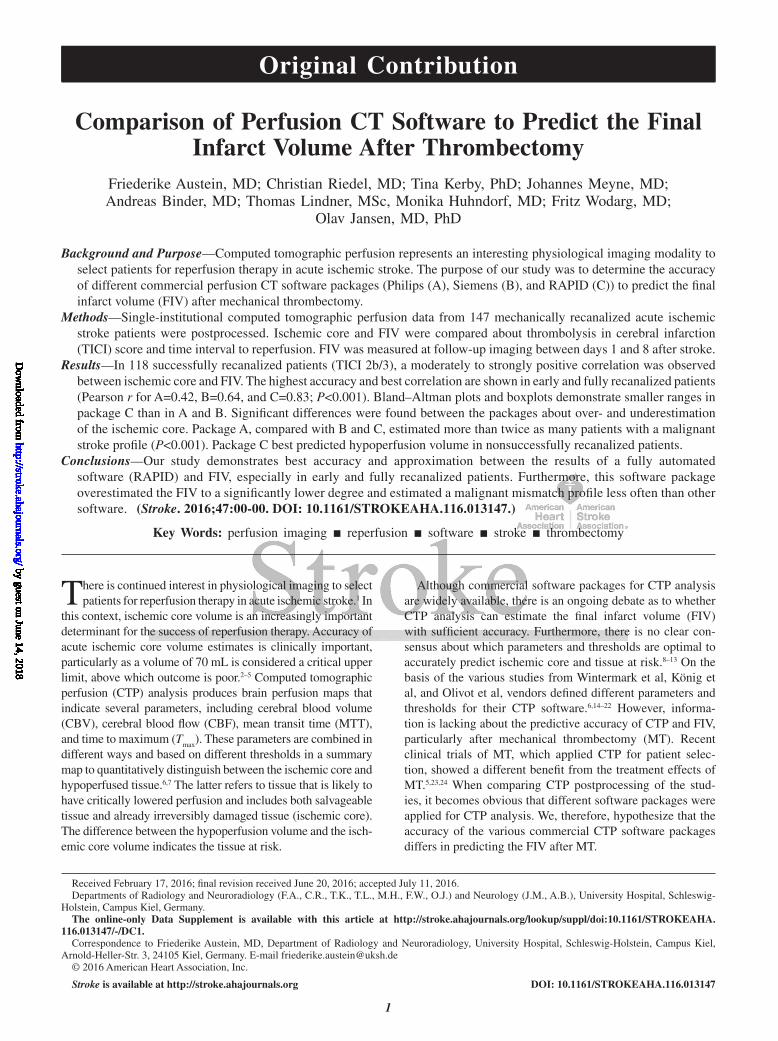
Background and Purpose—Computed tomographic perfusion represents an interesting physiological imaging modality to select patients for reperfusion therapy in acute ischemic stroke. The purpose of our study was to determine the accuracy of different commercial perfusion CT software packages (Philips (A), Siemens (B), and RAPID (C)) to predict the final infarct volume (FIV) after mechanical thrombectomy.
Methods—Single-institutional computed tomographic perfusion data from 147 mechanically recanalized acute ischemic stroke patients were postprocessed. Ischemic core and FIV were compared about thrombolysis in cerebral infarction (TICI) score and time interval to reperfusion. FIV was measured at follow-up imaging between days 1 and 8 after stroke.
Results—In 118 successfully recanalized patients (TICI 2b/3), a moderately to strongly positive correlation was observed between ischemic core and FIV. The highest accuracy and best correlation are shown in early and fully recanalized patients (Pearson r for A=0.42, B=0.64, and C=0.83; P<0.001). Bland–Altman plots and boxplots demonstrate smaller ranges in package C than in A and B. Significant differences were found between the packages about over- and underestimation of the ischemic core. Package A, compared with B and C, estimated more than twice as many patients with a malignant stroke profile (P<0.001). Package C best predicted hypoperfusion volume in nonsuccessfully recanalized patients.
Conclusions—Our study demonstrates best accuracy and approximation between the results of a fully automated software (RAPID) and FIV, especially in early and fully recanalized patients. Furthermore, this software package overestimated the FIV to a significantly lower degree and estimated a malignant mismatch profile less often than other software. (Stroke. 2016;47:00-00. DOI: 10.1161/STROKEAHA.116.013147.)
Key Words: perfusion imaging ◼ reperfusion ◼ software ◼ stroke ◼ thrombectomy
Comparison of Perfusion CT Software to Predict the Final Infarct Volume After Thrombectomy
Friederike Austein, MD; Christian Riedel, MD; Tina Kerby, PhD; Johannes Meyne, MD; Andreas Binder, MD; Thomas Lindner, MSc, Monika Huhndorf, MD; Fritz Wodarg, MD;
Olav Jansen, MD, PhD
Received February 17, 2016; final revision received June 20, 2016; accepted July 11, 2016.Departments of Radiology and Neuroradiology (F.A., C.R., T.K., T.L., M.H., F.W., O.J.) and Neurology (J.M., A.B.), University Hospital, Schleswig-
Holstein, Campus Kiel, Germany.The online-only Data Supplement is available with this article at http://stroke.ahajournals.org/lookup/suppl/doi:10.1161/STROKEAHA.
116.013147/-/DC1.Correspondence to Friederike Austein, MD, Department of Radiology and Neuroradiology, University Hospital, Schleswig-Holstein, Campus Kiel,
Arnold-Heller-Str. 3, 24105 Kiel, Germany. E-mail [email protected]© 2016 American Heart Association, Inc.
Stroke is available at http://stroke.ahajournals.org DOI: 10.1161/STROKEAHA.116.013147
Original Contribution
by guest on June 14, 2018http://stroke.ahajournals.org/
Dow
nloaded from
by guest on June 14, 2018http://stroke.ahajournals.org/
Dow
nloaded from
by guest on June 14, 2018http://stroke.ahajournals.org/
Dow
nloaded from
by guest on June 14, 2018http://stroke.ahajournals.org/
Dow
nloaded from
by guest on June 14, 2018http://stroke.ahajournals.org/
Dow
nloaded from
by guest on June 14, 2018http://stroke.ahajournals.org/
Dow
nloaded from
by guest on June 14, 2018http://stroke.ahajournals.org/
Dow
nloaded from
by guest on June 14, 2018http://stroke.ahajournals.org/
Dow
nloaded from
by guest on June 14, 2018http://stroke.ahajournals.org/
Dow
nloaded from
by guest on June 14, 2018http://stroke.ahajournals.org/
Dow
nloaded from
by guest on June 14, 2018http://stroke.ahajournals.org/
Dow
nloaded from
by guest on June 14, 2018http://stroke.ahajournals.org/
Dow
nloaded from
by guest on June 14, 2018http://stroke.ahajournals.org/
Dow
nloaded from
by guest on June 14, 2018http://stroke.ahajournals.org/
Dow
nloaded from
by guest on June 14, 2018http://stroke.ahajournals.org/
Dow
nloaded from
by guest on June 14, 2018http://stroke.ahajournals.org/
Dow
nloaded from

2 Stroke September 2016
Material and Methods
Study Design and Patient CohortIn this retrospective study, data were analyzed from patients who were admitted to our clinic between March 2009 and December 2013 and who met the following inclusion criteria: (1) acute isch-emic stroke, (2) initial noncontrast-enhanced computed tomogra-phy (NCCT), CT angiography to confirm occlusion of the internal carotid artery terminus or the middle cerebral artery and CTP, (3) MT performed, and (4) follow-up NCCT or magnetic resonance imaging (MRI) between days 1 and 8. There was no restriction about age, clinical severity, or Alberta Stroke Program Early CT (ASPECT) score. According to standard guidelines, eligible patients were additionally treated with intravenous thrombolysis. Cases of severe motion artifacts or poor cardiac output generating erroneous CTP data were excluded. General indications for MT in our center were as follows: acute stroke with substantial neurolog-ical deficits (National Institutes of Health Stroke Scale [NIHSS] >6), occlusion of a targeted large vessel, lack of significant early ischemic infarct signs (ASPECT score ≥5), and perfusion imag-ing indicating a mismatch or when intravenous thrombolysis was contraindicated. Our cohort was not selected according to strict criteria as in clinical trials; and thus, it reflects the biases and preferences of real-world practice. Successful endovascular recanalization was defined as achieving a thrombolysis in cere-bral infarction (TICI) reperfusion score of 2b or 3. NIHSS and modified Rankin Scale (mRS) were assessed at patient admission; additionally, mRS was assessed at discharge and day 90. The local medical ethics committee approved retrospective analysis of the anonymized patient data.
CTP Image AcquisitionAll CT scans were performed using a 64-slice CT scanner equipped with a 40-mm wide detector (Brilliance 64, Philips Medical Systems, Best, The Netherlands). The imaging parameters for CTP were 80 kVp, 150 mAs, and 32×1.25 mm detector collimation and a scan duration of 60 s. After cerebral NCCT, CTP was conducted with the toggling table technique, allowing an extended coverage of the brain of 80 mm. A scan delay of 3 s was applied after injecting 60 mL (flow rate 5 mL/s) of iodinated contrast agent (350 mg I/mL Imeron 350, Bracco Imaging, Ravensburg, Germany).
CTP Image Postprocessing and AnalysisThree different types of processing software were used to analyze all CTP data:
Package ABrain CT Perfusion Package (Philips Healthcare, The Netherlands), Extended Brilliance Workspace, version 3.5.0.2250: This software
uses a delay-sensitive algorithm. The CTP parameters relative MTT and CBV distinguish the hypoperfusion and the ischemic core. Hypoperfusion is defined as a relative MTT >145% compared with the contralateral hemisphere. Ischemic core is also defined as a rela-tive MTT >145% but has a CBV of <2.0 mL/100 g.6,25
Package BSyngo Volume Perfusion CT Neuro (Siemens Healthcare, Erlangen, Germany): This application offers 2 different evaluation modes: the deconvolution model and the maximum slope model. We used the deconvolution model that represents the delay-insensitive algo-rithm.26 CTP is performed using threshold values for relative CBF and relative CBV given by the vendor to distinguish between isch-emic core (CBV <1.2 mL/100 mL) and hypoperfusion (CBF <35.1 mL/100 mL per minute).19,27,28
Package CRAPID (iSchemaView Inc, Menlo Park, CA): At the time of the study, this software package was declared to be a research version; how-ever, it is now Food and Drug Administration approved. In contrast to package A, RAPID uses a delay-insensitive algorithm. Ischemic core is diagnosed if the relative CBF is <30% of that in normal tissue.8 Hypoperfusion is distinguished from minimally hypoperfused tissue if the T
max delay is >6 s.20–22,29
An example of the CTP analysis results as calculated by the 3 soft-ware packages and the FIV is shown in Figure 1. For consistency of data evaluation among the 3 software packages, only one investigator (F.A.) analyzed all CTP imaging studies. Software packages A and B require registration, segmentation, and definition of perfusion param-eters. Package C is a fully automated software allowing rapid online estimation of perfusion maps and mismatch.
Final Infarct VolumeFIV was assessed between days 1 and 8, using a dedicated open-source imaging software (OsiriX v.5.8.2 32-bit, Pixmeo SARL, Bernex, Switzerland) to analyze NCCT or diffusion-weighted imag-ing in MRI. If both CT and MRI were performed, MRI data were used to calculate FIV. A region of interest of the subacute lesion was outlined manually with optimal window settings in each axial slice of the respective NCCT or diffusion-weighted imaging and the FIV calculated. Secondary hemorrhages were classified according to the radiographic ECASS (European Cooperative Acute Stroke Study) criteria30 and included in the FIV.
Statistical AnalysisAll data sets were checked for normality before analysis with the appropriate parametric or nonparametric tests. Wilcoxon test for paired differences was used as a nonparametric test. P values of <0.05 were considered statistically significant. Descriptive statis-tics, correlation coefficients, and linear regression analysis were
Figure 1. Example of computed tomographic perfusion analysis results calculated by the 3 software packages A (A), B (B), and C (C) of a 76-year-old man with occlusion of the left middle cerebral artery. All summary maps were generated from the same source images. Color codes for the ischemic core, hypoperfusion, and the respective volumes are in package A: red (61 mL) and green (52 mL), in package B: red (30 mL) and yellow (115 mL), and in package C: pink (10 mL) and green (152 mL), resulting in a mismatch ratio of 0.85 (A), 3.83 (B), and 15.2 (C). The infarct area was outlined in every slice (D) to calculate the exact final infarct volume (7.14 mL). Times from symptom onset to imaging were 90 min and from imaging to complete reperfusion 105 min.
by guest on June 14, 2018http://stroke.ahajournals.org/
Dow
nloaded from

Austein et al Comparison of Perfusion CT Software 3
used to compare the ischemic core and FIV, as well as the relation-ship between hypoperfusion and FIV in the patients who achieved TICI 0-2a. Categorical variables are reported as proportions. Because of non-normality of the data, median values and inter-quartile ranges (IQRs) were calculated and are presented, rather than means and SDs. A volumetric agreement comparison (Bland–Altman plot) between ischemic core and FIV was performed for each package in successfully recanalized patients according to the TICI score; this was then subdivided by time intervals between CTP and reperfusion into very early (≤110 minutes), early (≤144 minutes), and late (>144 minutes) groups. The time of 144 min-utes was chosen because it represents the median time interval and, at ≤110 minutes, is the first IQR from CTP to reperfusion in our cohort. Furthermore, we analyzed cases in which CTP estimated a malignant mismatch profile and determined whether the respective FIV was smaller or larger than 70 mL. Malignant mismatch profile is defined as ischemic core >70 mL, or absolute volume differ-ence <10 mL, or ratio of hypoperfusion and ischemic core <1.2.5,31 Statistical analyses were performed with IBM SPSS Statistics 23 (SPSS Inc an IBM Company, Chicago, IL).
ResultsPatient Characteristics, Clinical Outcomes, and Procedural CharacteristicsRetrospective analysis of our database identified 147 patients. For patient characteristics, clinical outcomes, time lapses, and endovascular procedures please see Tables I and II in the online-only Data Supplement.
Radiological DataRadiological findings are summarized in Tables III through V in the online-only Data Supplement.
Final Infarct VolumeIn 147 patients, median FIV was 38 mL (IQR, 14–126). Patients in whom recanalization was successful (n=118) had a significantly lower FIV (30 mL, IQR, 13–92) than non-successfully recanalized (n=29) patients (114 mL, IQR, 50–247; P<0.001). Small petechial hemorrhages (HI 1) were observed in 11 (7.5%), more confluent petechial (HI 2) in 11 (7.5%), parenchymal hematoma <30% of infarcted area with mild space-occupying effect (PH 1) in 6 (4%), and parenchymal hematoma >30% of infarcted area with signifi-cant space-occupying effect (PH2) in 3 (2%) patients. No significant correlations were observed between patients with and without intravenous thrombolysis and secondary hemor-rhages (P=0.863) and between the TICI score and secondary hemorrhages (P=0.563). However, there was a significant correlation between the occurrence rate of secondary hemor-rhages and a large FIV on follow-up imaging (P<0.05).
Ischemic CoreThe median ischemic core volumes were significantly different between packages A (largest ischemic core) and C (smallest ischemic core), but not between packages A and B (P=0.65). All software packages only demonstrated a small difference in the absolute median differences between the ischemic core and FIV, depending on the degree of recanalization and time between CTP and reperfusion; however, distributions were dif-ferent. Smaller IQR were found in package C than in A and B (Figure 2). Furthermore, it could be shown that the limits of
agreement were smaller in package C than in A and B (Figures I through IV in the online-only Data Supplement). This indi-cates that the results in packages A and B were more ambiguous than those in C. The best correlation between ischemic core and FIV was found in early and fully recanalized patients (Pearson r for A=0.42, B=0.64, and C=0.83; P<0.001). Independent of TICI score, time intervals between CTP and reperfusion, and follow-up modality, all results showed an identical tendency, with better correlations and significantly smaller ranges in package C than in A and B. FIV was overestimated more often by software A (n=41) and B (n=44) than by software C (n=25; P<0.001). The difference between packages A and B in this point was not statistically relevant (P=0.65).
Hypoperfusion VolumeThe hypoperfusion volumes differed significantly among all the 3 software packages (P<0.001). The smallest median volumes were estimated in package A with 93 mL (IQR, 65–118), the largest in B with 190 mL (IQR, 158–219), and 125 mL in C (IQR, 80–174). Considering the median absolute dif-ferences between hypoperfusion volume and FIV in patients with TICI 0-2a, package C overestimated the volumes to a lesser degree (28 mL; IQR, −74 to 98) than package B (58 mL, −78/113), whereas only package A underestimated the volumes (−50 mL; IQR, −168 to 14).
Estimation as Malignant Mismatch ProfileAccording to the mismatch criteria described above, pack-age A, when compared with B and C, estimated more than twice as many patients with a malignant mismatch profile (P<0.001; Figure 3). The difference between packages A and B and between A and C in this point was statistically relevant (P<0.001), but not between packages B and C (P=0.289). Each package gave false-positive estimates for a malignant-mismatch profile (A: 15/34 [44.1%], B: 1/11 [9.1%], and C: 5/15 [33.3%]) in patients who ultimately had a good radio-logical outcome after MT with a FIV <70 mL.
DiscussionThe aim of this study was to assess the prognostic accuracy of CTP summary maps in predicting the FIV in patients with acute ischemic stroke after MT, comparing 3 different com-mercially available software packages. We analyzed a large study population (n=147) of patients with an acute large-vessel occlusion in the anterior circulation in whom mechani-cal recanalization was performed using second-generation stent retriever devices, allowing us to accurately record times between CTP imaging and reperfusion and the final degree of recanalization. A further advantage of this study was that only 1 CT scanner and a standard CTP protocol with a brain coverage of 80 mm were used. The FIV was calculated by follow-up imaging with diffusion-weighted imaging–MRI or NCCTs.
Our study showed that, ultimately, all software packages only demonstrated a small difference in the absolute median between the ischemic core and FIV, depending on the degree of recanalization and time between CTP and reperfusion, but the distributions were different. The higher precision and
by guest on June 14, 2018http://stroke.ahajournals.org/
Dow
nloaded from

4 Stroke September 2016
accuracy of the RAPID software, in particular in early and fully recanalized patients, is an important finding of our study because nowadays with newer endovascular technology and increasing experience, faster and more complete reperfusion rates can be achieved. The comparison between ischemic core and FIV demonstrated a significantly lower overesti-mation of FIV with package C than with packages A and B. With increasing ischemic core volumes, CTP demonstrated increased deviation from FIV.
One reason for the advantage of package C over A and B can be found in the use of different algorithms: package A uses a delay-sensitive deconvolution algorithm, whereas packages B and C use a delay-insensitive deconvolution algorithm. Only the latter corrects for the arrival delay of contrast agent, explaining the differences in the volume predictions and overestimation of MTT in the delay-sensitive method.32 A further important reason for the advantage of package C over A and B can be found in the hypoperfusion volume estimates. Here, package
Figure 2. Boxplot of absolute differences between final infarct volume (FIV) and ischemic core, depending on recanaliza-tion degree (A=TICI 3, B=TICI 2b) and time interval to reperfusion (<110 min, <144 min, and >144 min) for package A, B, and C. Error bars indicate the range of absolute difference between FIV and ischemic core. Boxes represent values within the 25th–75th percentiles (interquartile range), and hori-zontal lines represent the median absolute differences.
by guest on June 14, 2018http://stroke.ahajournals.org/
Dow
nloaded from

Austein et al Comparison of Perfusion CT Software 5
A predicts a significantly smaller hypoperfusion volume than packages B and C. Apart from the different algorithms used, different definitions for ischemic core and hypoperfusion based on CTP parameters such as MTT, CBV, CBF, and T
max may
play a role. In comparison to package C, which showed the smallest deviation in the hypoperfusion volume in nonsuccess-fully recanalized patients by using T
max, package A underesti-
mated and package B significantly overestimated this volume. Applying T
max as a reliable parameter to define the hypoperfu-
sion was also recently confirmed by a study of Olivot et al.33
Estimation as Malignant Mismatch ProfileFor the decision-making process, both over- and under-estimation of the ischemic core and the hypoperfusion volume may have important clinical consequences in the management of acute stroke. According to the result of one software package, clinicians may exclude a patient from endovascular stroke treatment, whereas they would include the same patient according to the results of another pack-age. Our findings are in contrast to the study of Abels et al34 who found no greater effect of different postprocessing algorithms for decision making. This might be why various studies have seen a benefit in CTP-based imaging selec-tion,5,23 whereas others did not.24 Furthermore, our results demonstrated that each software package gave false-posi-tive estimates for a malignant profile and a respective FIV <70 mL. On the basis of our findings, patients with acute ischemic stroke might be excluded from effective endo-vascular therapy as a result of a malignant profile; this applies in particular for patients in an early time window. However, it is critical that these selection techniques do not exclude patients who could potentially benefit from MT. Therefore, the thresholds of the mismatch criteria, which were developed in the era of intravenous thrombolysis with prolonged and often incomplete reperfusion, would need
to be adapted to the recently introduced faster and more efficient endovascular treatment of acute ischemic stroke. Thus, CTP analysis should be interpreted with respect to the time frame, the individual ischemic patterns, and the degree of collaterals. CTP only represents a snap shot of the individual infarct situation and in the dynamic process of stroke. Volume differences between prognosis and FIV are crucially dependent on the degree of recanalization ulti-mately achieved, the time needed for recanalization, addi-tional reperfusion injuries due to recanalization, edema, or temporary dysregulation of the systemic blood pressure due to additional medical treatment.
In accordance with the latest trials on MT,5,35–39 our study population demonstrated a significant benefit from successful recanalization with significantly better clinical and imaging outcomes than nonsuccessfully recanalized patients. Although selection of our patient population was not ideal compared with the controlled thrombectomy trials,5,35,38 our study has the advan-tage of reflecting daily clinical routine better. Nevertheless, our results about predictive accuracy of FIV are in good agree-ment with the results in the subanalysis of SWIFT PRIME,40,41 despite the generally longer time windows in our population. This supports the idea that CTP may have the potential to widen the individual time window beyond 6 hours for MT.
Our study has several limitations, including the retrospec-tive analysis of the acquired data. Furthermore, we used CT or MRI scans performed between 1 and 8 days as the reference standard for FIV; however, brain edema after stroke commonly has a maximum peak at day 4, which potentially influences the measurement of the FIV. We, therefore, acknowledge that the definition and measurement of the FIV are not distinct and we, thus, cannot exclude the possibility that the infarct may has progressed between the different time points of follow-up imaging. We focused our evaluation of the 3 software packages only on the prognostic capability and did not evaluate prac-tical aspects, such as reproducibility, practicability, and time required for the application. However, compared with semi-automated software (eg, Philips, Siemens), it has already been shown that automated CTP-based mismatch selection is rapid and robust in clinical practice.42 Thus, automated software, such as RAPID, has the potential to improve the reliability and reproducibility of CTP and extends the application of this tool beyond highly specialized academic centers. Still, there is a need to standardize CTP analysis in both clinical practice and for future stroke research.
ConclusionsThis study showed significant differences between 3 CTP packages in the predictive accuracy of FIV after MT. The high-est precision and a good accuracy were found for the RAPID software (package C), which was superior to the Philips (pack-age A) and Siemens software (package B). Of the 3 packages, the Philips software would imply a more restrictive patient selection. The Siemens software significantly overestimated the hypoperfusion volume compared with the others.
DisclosuresDr Wodarg received speakers’ honoraria from Penumbra Europe GmbH. The other authors report no conflicts.
Figure 3. Numbers of patients estimated as malignant mismatch profile and the respective final infarct volume (FIV). Subgroups show the proportion of false-positively estimated patients with an FIV of <70 mL (light gray), and the proportion of patients with an FIV of >70 mL (dark gray). A malignant profile is defined as a result of the ischemic core volume of ≥70 mL or hypoperfusion-core vol-ume of <10 mL, or hypoperfusion/ischemic-core ratio of <1.2.
by guest on June 14, 2018http://stroke.ahajournals.org/
Dow
nloaded from
6 Stroke September 2016
References 1. Campbell BC, Christensen S, Levi CR, Desmond PM, Donnan
GA, Davis SM, et al. Comparison of computed tomography per-fusion and magnetic resonance imaging perfusion-diffusion mis-match in ischemic stroke. Stroke. 2012;43:2648–2653. doi: 10.1161/STROKEAHA.112.660548.
2. Campbell BC, Mitchell PJ, Yan B, Parsons MW, Christensen S, Churilov L, et al; EXTEND-IA Investigators. A multicenter, randomized, controlled study to investigate EXtending the time for Thrombolysis in Emergency Neurological Deficits with Intra-Arterial therapy (EXTEND-IA). Int J Stroke. 2014;9:126–132. doi: 10.1111/ijs.12206.
3. Lansberg MG, Straka M, Kemp S, Mlynash M, Wechsler LR, Jovin TG, et al; DEFUSE 2 Study Investigators. MRI profile and response to endovascular reperfusion after stroke (DEFUSE 2): a prospec-tive cohort study. Lancet Neurol. 2012;11:860–867. doi: 10.1016/S1474-4422(12)70203-X.
4. Yoo AJ, Verduzco LA, Schaefer PW, Hirsch JA, Rabinov JD, González RG. MRI-based selection for intra-arterial stroke therapy: value of pre-treatment diffusion-weighted imaging lesion volume in selecting patients with acute stroke who will benefit from early recanalization. Stroke. 2009;40:2046–2054. doi: 10.1161/STROKEAHA.108.541656.
5. Campbell BC, Mitchell PJ, Kleinig TJ, Dewey HM, Churilov L, Yassi N, et al; EXTEND-IA Investigators. Endovascular therapy for ischemic stroke with perfusion-imaging selection. N Engl J Med. 2015;372:1009–1018. doi: 10.1056/NEJMoa1414792.
6. Wintermark M, Flanders AE, Velthuis B, Meuli R, van Leeuwen M, Goldsher D, et al. Perfusion-CT assessment of infarct core and pen-umbra: receiver operating characteristic curve analysis in 130 patients suspected of acute hemispheric stroke. Stroke. 2006;37:979–985. doi: 10.1161/01.STR.0000209238.61459.39.
7. Murphy BD, Fox AJ, Lee DH, Sahlas DJ, Black SE, Hogan MJ, et al. Identification of penumbra and infarct in acute ischemic stroke using computed tomography perfusion-derived blood flow and blood vol-ume measurements. Stroke. 2006;37:1771–1777. doi: 10.1161/01.STR.0000227243.96808.53.
8. Campbell BC, Christensen S, Levi CR, Desmond PM, Donnan GA, Davis SM, et al. Cerebral blood flow is the optimal CT perfusion param-eter for assessing infarct core. Stroke. 2011;42:3435–3440. doi: 10.1161/STROKEAHA.111.618355.
9. Kamalian S, Kamalian S, Maas MB, Goldmacher GV, Payabvash S, Akbar A, et al. CT cerebral blood flow maps optimally correlate with admission diffusion-weighted imaging in acute stroke but thresholds vary by postprocessing platform. Stroke. 2011;42:1923–1928. doi: 10.1161/STROKEAHA.110.610618.
10. Bivard A, Levi C, Spratt N, Parsons M. Perfusion CT in acute stroke: a comprehensive analysis of infarct and penumbra. Radiology. 2013;267:543–550. doi: 10.1148/radiol.12120971.
11. Wintermark M, Sanelli PC, Albers GW, Bello J, Derdeyn C, Hetts SW, et al. Imaging recommendations for acute stroke and transient isch-emic attack patients: A joint statement by the American Society of Neuroradiology, the American College of Radiology, and the Society of NeuroInterventional Surgery. AJNR Am J Neuroradiol. 2013;34:E117–E127. doi: 10.3174/ajnr.A3690.
12. Lev MH. Acute stroke imaging: what is sufficient for triage to endo-vascular therapies? AJNR Am J Neuroradiol. 2012;33:790–792. doi: 10.3174/ajnr.A3098.
13. Bivard A, McElduff P, Spratt N, Levi C, Parsons M. Defining the extent of irreversible brain ischemia using perfusion computed tomography. Cerebrovasc Dis. 2011;31:238–245. doi: 10.1159/000321897.
14. Wintermark M, Maeder P, Thiran JP, Schnyder P, Meuli R. Quantitative assessment of regional cerebral blood flows by perfusion CT studies at low injection rates: a critical review of the underlying theoretical models. Eur Radiol. 2001;11:1220–1230. doi: 10.1007/s003300000707.
15. Konstas AA, Goldmakher GV, Lee TY, Lev MH. Theoretic basis and technical implementations of CT perfusion in acute ischemic stroke, part 1: Theoretic basis. AJNR Am J Neuroradiol. 2009;30:662–668. doi: 10.3174/ajnr.A1487.
16. Wintermark M, Thiran JP, Maeder P, Schnyder P, Meuli R. Simultaneous measurement of regional cerebral blood flow by perfusion CT and stable xenon CT: a validation study. AJNR Am J Neuroradiol. 2001;22:905–914.
17. Kudo K, Terae S, Katoh C, Oka M, Shiga T, Tamaki N, et al. Quantitative cerebral blood flow measurement with dynamic perfusion CT using the vascular-pixel elimination method: comparison with H2(15)O positron emission tomography. AJNR Am J Neuroradiol. 2003;24:419–426.
18. Sase S, Honda M, Machida K, Seiki Y. Comparison of cerebral blood flow between perfusion computed tomography and xenon-enhanced computed tomography for normal subjects: territorial analysis. J Comput Assist Tomogr. 2005;29:270–277.
19. Klotz E, König M. Perfusion measurements of the brain: using dynamic CT for the quantitative assessment of cerebral ischemia in acute stroke. Eur J Radiol. 1999;30:170–184.
20. Olivot JM, Mlynash M, Zaharchuk G, Straka M, Bammer R, Schwartz N, et al. Perfusion MRI (Tmax and MTT) correlation with xenon CT cerebral blood flow in stroke patients. Neurology. 2009;72:1140–1145. doi: 10.1212/01.wnl.0000345372.49233.e3.
21. Dehkharghani S, Bammer R, Straka M, Albin LS, Kass-Hout O, Allen JW, et al. Performance and Predictive Value of a User-Independent Platform for CT Perfusion Analysis: Threshold-Derived Automated Systems Outperform Examiner-Driven Approaches in Outcome Prediction of Acute Ischemic Stroke. AJNR Am J Neuroradiol. 2015;36:1419–1425. doi: 10.3174/ajnr.A4363.
22. Lansberg MG, Lee J, Christensen S, Straka M, De Silva DA, Mlynash M, et al. RAPID automated patient selection for reperfusion therapy: a pooled analysis of the Echoplanar Imaging Thrombolytic Evaluation Trial (EPITHET) and the Diffusion and Perfusion Imaging Evaluation for Understanding Stroke Evolution (DEFUSE) Study. Stroke. 2011;42:1608–1614. doi: 10.1161/STROKEAHA.110.609008.
23. Albers GW, Goyal M, Jahan R, Bonafe A, Diener HC, Levy EI, et al. Relationships Between Imaging Assessments and Outcomes in Solitaire With the Intention for Thrombectomy as Primary Endovascular Treatment for Acute Ischemic Stroke. Stroke. 2015;46:2786–2794. doi: 10.1161/STROKEAHA.115.010710.
24. Borst J, Berkhemer OA, Roos YB, van Bavel E, van Zwam WH, van Oostenbrugge RJ, et al; MR CLEAN Investigators. Value of Computed Tomographic Perfusion-Based Patient Selection for Intra-Arterial Acute Ischemic Stroke Treatment. Stroke. 2015;46:3375–3382. doi: 10.1161/STROKEAHA.115.010564.
25. Wintermark M, Meuli R, Browaeys P, Reichhart M, Bogousslavsky J, Schnyder P, et al. Comparison of CT perfusion and angiography and MRI in selecting stroke patients for acute treatment. Neurology. 2007;68:694–697. doi: 10.1212/01.wnl.0000255959.30107.08.
26. Kudo K, Sasaki M, Yamada K, Momoshima S, Utsunomiya H, Shirato H, et al. Differences in CT perfusion maps generated by different com-mercial software: quantitative analysis by using identical source data of acute stroke patients. Radiology. 2010;254:200–209. doi: 10.1148/radiol.254082000.
27. Koenig M, Kraus M, Theek C, Klotz E, Gehlen W, Heuser L. Quantitative assessment of the ischemic brain by means of perfusion-related param-eters derived from perfusion CT. Stroke. 2001;32:431–437.
28. Abels B, Klotz E, Tomandl BF, Kloska SP, Lell MM. Perfusion CT in acute ischemic stroke: a qualitative and quantitative comparison of deconvolution and maximum slope approach. AJNR Am J Neuroradiol. 2010;31:1690–1698. doi: 10.3174/ajnr.A2151.
29. Straka M, Albers GW, Bammer R. Real-time diffusion-perfusion mis-match analysis in acute stroke. J Magn Reson Imaging. 2010;32:1024–1037. doi: 10.1002/jmri.22338.
30. Hacke W, Kaste M, Fieschi C, Toni D, Lesaffre E, von Kummer R, et al. Intravenous thrombolysis with recombinant tissue plasminogen activator for acute hemispheric stroke. The European Cooperative Acute Stroke Study (ECASS). JAMA. 1995;274:1017–1025.
31. Albers GW, Thijs VN, Wechsler L, Kemp S, Schlaug G, Skalabrin E, et al; DEFUSE Investigators. Magnetic resonance imaging profiles predict clinical response to early reperfusion: the diffusion and perfusion imag-ing evaluation for understanding stroke evolution (DEFUSE) study. Ann Neurol. 2006;60:508–517. doi: 10.1002/ana.20976.
32. Hanson EH, Roach CJ, Day KJ, Ghosh K, Peters KR, Bradley WG Jr, et al. Assessment of tracer delay effect in whole-brain computed tomogra-phy perfusion: results for selected regions of interest in middle cerebral artery acute ischemic strokes. J Comput Assist Tomogr. 2013;37:222–232. doi: 10.1097/RCT.0b013e318280a465.
33. Olivot JM, Mlynash M, Thijs VN, Kemp S, Lansberg MG, Wechsler L, et al. Optimal Tmax threshold for predicting penum-bral tissue in acute stroke. Stroke. 2009;40:469–475. doi: 10.1161/STROKEAHA.108.526954.
34. Abels B, Villablanca JP, Tomandl BF, Uder M, Lell MM. Acute stroke: a comparison of different CT perfusion algorithms and validation of isch-aemic lesions by follow-up imaging. Eur Radiol. 2012;22:2559–2567. doi: 10.1007/s00330-012-2529-8.
by guest on June 14, 2018http://stroke.ahajournals.org/
Dow
nloaded from

Austein et al Comparison of Perfusion CT Software 7
35. Saver JL, Goyal M, Bonafe A, Diener HC, Levy EI, Pereira VM, et al; SWIFT PRIME Investigators. Stent-retriever thrombectomy after intra-venous t-PA vs. t-PA alone in stroke. N Engl J Med. 2015;372:2285–2295. doi: 10.1056/NEJMoa1415061.
36. Campbell BC, Mitchell PJ; EXTEND-IA Investigators. Endovascular therapy for ischemic stroke. N Engl J Med. 2015;372:2365–2366. doi: 10.1056/NEJMc1504715.
37. Goyal M, Demchuk AM, Menon BK, Eesa M, Rempel JL, Thornton J, et al; ESCAPE Trial Investigators. Randomized assessment of rapid endo-vascular treatment of ischemic stroke. N Engl J Med. 2015;372:1019–1030. doi: 10.1056/NEJMoa1414905.
38. Berkhemer OA, Fransen PS, Beumer D, van den Berg LA, Lingsma HF, Yoo AJ, et al; MR CLEAN Investigators. A randomized trial of intraarte-rial treatment for acute ischemic stroke. N Engl J Med. 2015;372:11–20. doi: 10.1056/NEJMoa1411587.
39. Jovin TG, Chamorro A, Cobo E, de Miquel MA, Molina CA, Rovira A, et al; REVASCAT Trial Investigators. Thrombectomy within 8 hours
after symptom onset in ischemic stroke. N Engl J Med. 2015;372:2296–2306. doi: 10.1056/NEJMoa1503780.
40. Albers GW, Goyal M, Jahan R, Bonafe A, Diener HC, Levy EI, et al. Ischemic core and hypoperfusion volumes predict infarct size in SWIFT PRIME. Ann Neurol. 2016;79:76–89. doi: 10.1002/ana.24543.
41. Saver JL, Goyal M, Bonafe A, Diener HC, Levy EI, Pereira VM, et al; SWIFT PRIME Investigators. Solitaire™ with the Intention for Thrombectomy as Primary Endovascular Treatment for Acute Ischemic Stroke (SWIFT PRIME) trial: protocol for a randomized, controlled, multicenter study comparing the Solitaire revascularization device with IV tPA with IV tPA alone in acute ischemic stroke. Int J Stroke. 2015;10:439–448. doi: 10.1111/ijs.12459.
42. Campbell BC, Yassi N, Ma H, Sharma G, Salinas S, Churilov L, et al. Imaging selection in ischemic stroke: feasibility of automated CT-perfusion analysis. Int J Stroke. 2015;10:51–54. doi: 10.1111/ijs.12381.
by guest on June 14, 2018http://stroke.ahajournals.org/
Dow
nloaded from

Lindner, Monika Huhndorf, Fritz Wodarg and Olav JansenFriederike Austein, Christian Riedel, Tina Kerby, Johannes Meyne, Andreas Binder, Thomas
ThrombectomyComparison of Perfusion CT Software to Predict the Final Infarct Volume After
Print ISSN: 0039-2499. Online ISSN: 1524-4628 Copyright © 2016 American Heart Association, Inc. All rights reserved.
is published by the American Heart Association, 7272 Greenville Avenue, Dallas, TX 75231Stroke published online August 9, 2016;Stroke.
http://stroke.ahajournals.org/content/early/2016/08/09/STROKEAHA.116.013147World Wide Web at:
The online version of this article, along with updated information and services, is located on the
http://stroke.ahajournals.org/content/suppl/2016/08/10/STROKEAHA.116.013147.DC1Data Supplement (unedited) at:
http://stroke.ahajournals.org//subscriptions/
is online at: Stroke Information about subscribing to Subscriptions:
http://www.lww.com/reprints Information about reprints can be found online at: Reprints:
document. Permissions and Rights Question and Answer process is available in the
Request Permissions in the middle column of the Web page under Services. Further information about thisOnce the online version of the published article for which permission is being requested is located, click
can be obtained via RightsLink, a service of the Copyright Clearance Center, not the Editorial Office.Strokein Requests for permissions to reproduce figures, tables, or portions of articles originally publishedPermissions:
by guest on June 14, 2018http://stroke.ahajournals.org/
Dow
nloaded from

ONLINE SUPPLEMENT
Comparison of Perfusion CT Software to Predict the Final Infarct after Thrombectomy
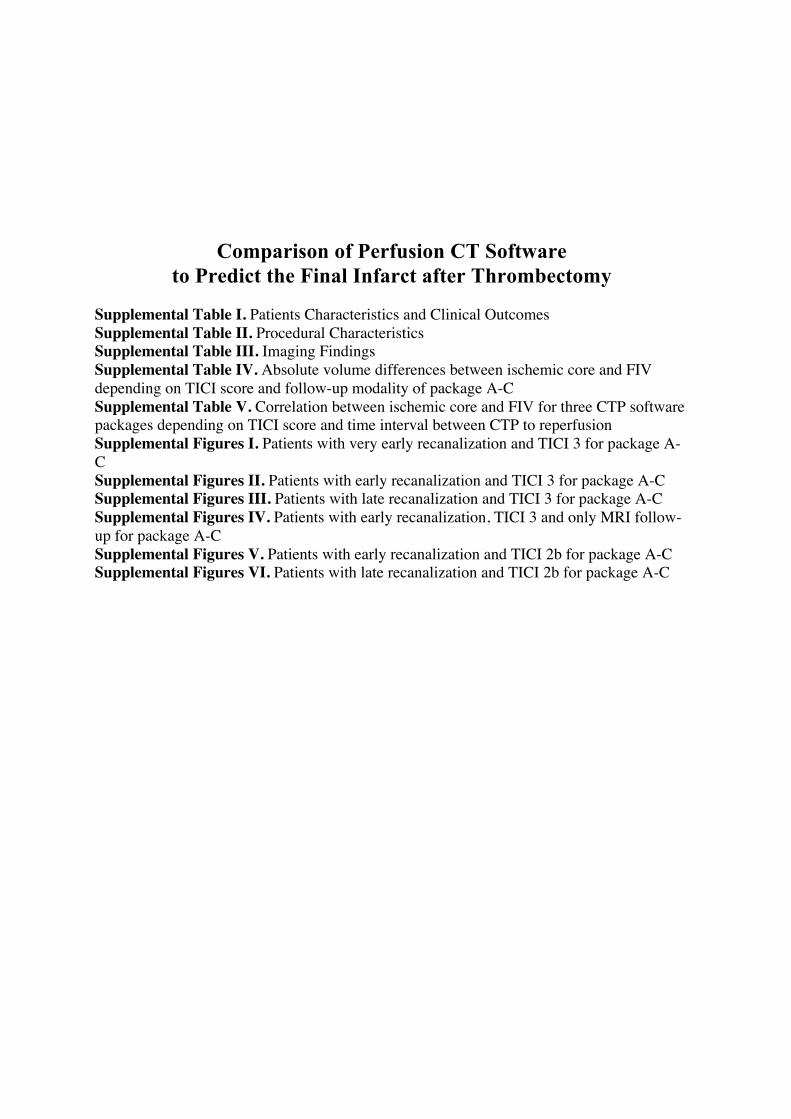
Supplemental Table I. Patients Characteristics and Clinical Outcomes Supplemental Table II. Procedural Characteristics Supplemental Table III. Imaging Findings Supplemental Table IV. Absolute volume differences between ischemic core and FIV depending on TICI score and follow-up modality of package A-C Supplemental Table V. Correlation between ischemic core and FIV for three CTP software packages depending on TICI score and time interval between CTP to reperfusion Supplemental Figures I. Patients with very early recanalization and TICI 3 for package A-C Supplemental Figures II. Patients with early recanalization and TICI 3 for package A-C Supplemental Figures III. Patients with late recanalization and TICI 3 for package A-C Supplemental Figures IV. Patients with early recanalization, TICI 3 and only MRI follow-up for package A-C Supplemental Figures V. Patients with early recanalization and TICI 2b for package A-C Supplemental Figures VI. Patients with late recanalization and TICI 2b for package A-C

Supplemental Table I. Patients Characteristics and Clinical Outcome
All patients TICI 2b/3 TICI 0-2a Number of patients 147 118 29 Male sex, N (%) 69 52 17 Age, years(†) 72 (64/78) 72 (61/77) 74 (70/81) NHISS(†) 14.5 (12/19) 14 (12/19) mRS at admission(†) 5 (4/5) 5 (4/5) 5 (5/5) mRS at discharge(†) 4 (2/5) 3 (1/5) 5 (3/6) mRS 0-2 d90, N (%) 52/ 142 (36.6) 49/116 (42.2) 3/26 (11.5) †Data are displayed as median (interquartile range) Abbreviations: mRS,Modified Rankin Scale; NIHSS, National Institutes of Health Stroke Scale; TICI-score, Thrombolysis in Cerebral Infarction

Supplemental Table II. Procedural Characteristics Left hemisphere, N (%) 81 (55.1) Occlusion site, N (%)
ICA terminus 38 (25.9) M1 segment, MCA 100 (68) M2 segment, MCA 9 (6.1)
Safe symptom onset, N (%) 93 (63.3) Unknown symptom onset, N (%) 54 (36.7)
Last symptom-free 11 (20.4) Wake-up stroke 3 (5.6) Found 20 (37.0) Unknown 20 (37.0)
Symptom onset to 1.angiography series, minutes(†) 227 (163/299) CTP to reperfusion, minutes(†) 144 (110/181) Additional IV thrombolysis, N (%) 72 (49) Patients receiving general anesthesia, N (%) 144 (96) Final TICI score, N (%)
3 60 (40.8) 2b 58 (39.5) 2a 15 (10.2) 1 4 (2.7) 0 10 (6.8)
†Data are displayed as median (interquartile range) Abbreviations: CTP, computed tomography perfusion; ICA terminus, internal carotid artery terminus; MCA, middle cerebral artery; TICI-score, Thrombolysis in Cerebral Infarction

Supplemental Table III. Imaging Findings All patients TICI 2b/3 TICI 0-2a Number of patients 147 118 29 CT perfusion findings
Ischemic core volume, mL(†) Package A 18 (3/51) 18 (4/50) 13 (2/55) Package B 21 (11/43) 21 (11/43) 21 (10/47) Package C 7 (3/21) 8 (3/24) 5 (3/17)
Hypoperfusion Volume, mL(†) Package A 93 (65/118) 94 (68/119) 78 (54/113) Package B 190 (158/219) 192 (163/224) 181 (137/211) Package C 125 (80/174) 124 (80/173) 127 (81/169)
Follow-Up Imaging CT, N (%) 98 (66.7) 77 (65.3) 21 (72.4) MRI, N (%) 49 (33.3) 41 (34.7) 8 (27.6) Final Infarct Volume, mL(†) 38 (15/126) 30 (13/92) 114 (50/247) PH 1 incidence, N (%) 6 (4.1) 6 (5.1) - PH 2 incidence, N (%) 3 (2.0) 2 (2) 1 (3.4)
†Data are displayed as median (interquartile range) Abbreviations: CTP, computed tomography perfusion; MRI, magnetic resonance imaging; PH 1, parenchymal hematoma -1 (hematoma in <30% of the infarcted area, with a mild space-occupying effect); PH 2 (hematoma in >30% of the infarcted area, with a significant space-occupying effect). TICI score, Thrombolysis in Cerebral Infarction Package A= Philips software Package B= Siemens software Package C= RAPID software
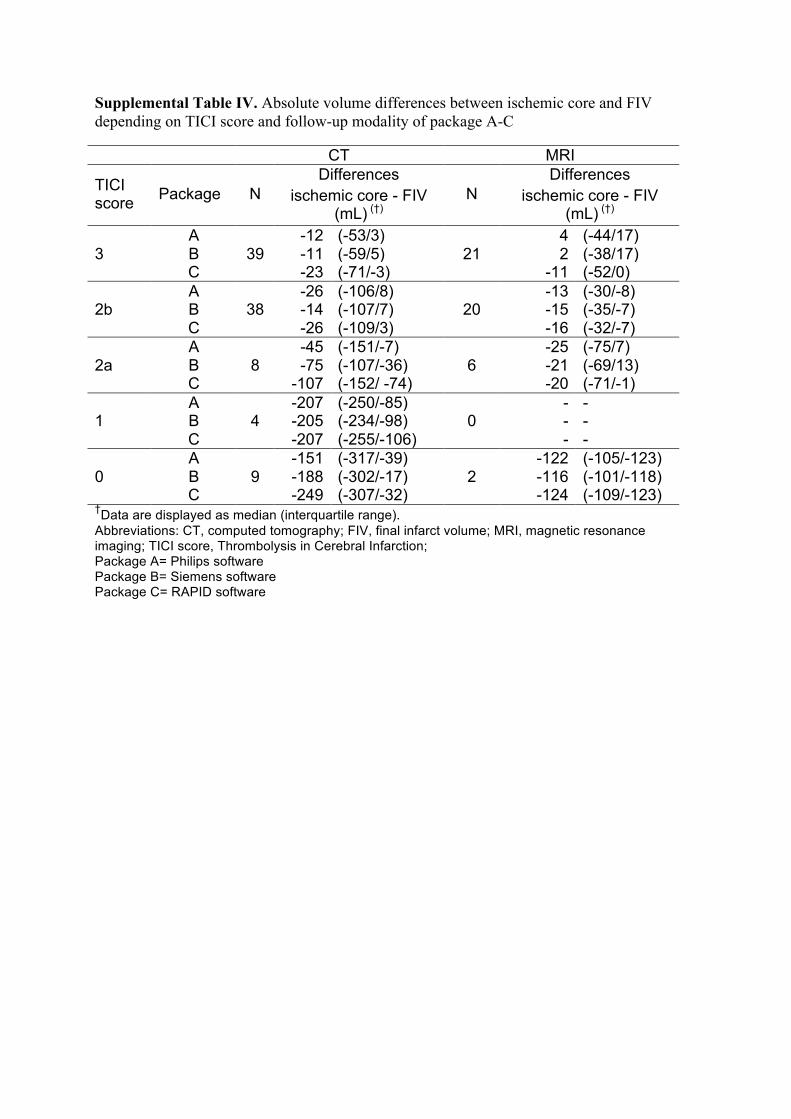
Supplemental Table IV. Absolute volume differences between ischemic core and FIV depending on TICI score and follow-up modality of package A-C CT MRI
TICI score Package N
Differences ischemic core - FIV
(mL) (†) N
Differences ischemic core - FIV
(mL) (†)
3 A
39 -12 (-53/3)
21 4 (-44/17)
B -11 (-59/5) 2 (-38/17) C -23 (-71/-3) -11 (-52/0)
2b A
38 -26 (-106/8)
20 -13 (-30/-8)
B -14 (-107/7) -15 (-35/-7) C -26 (-109/3) -16 (-32/-7)
2a A
8 -45 (-151/-7)
6 -25 (-75/7)
B -75 (-107/-36) -21 (-69/13) C -107 (-152/ -74) -20 (-71/-1)
1 A
4 -207 (-250/-85) - -
B -205 (-234/-98) 0 - - C -207 (-255/-106) - -
0 A
9 -151 (-317/-39)
2 -122 (-105/-123)
B -188 (-302/-17) -116 (-101/-118) C -249 (-307/-32) -124 (-109/-123)
†Data are displayed as median (interquartile range). Abbreviations: CT, computed tomography; FIV, final infarct volume; MRI, magnetic resonance imaging; TICI score, Thrombolysis in Cerebral Infarction; Package A= Philips software Package B= Siemens software Package C= RAPID software
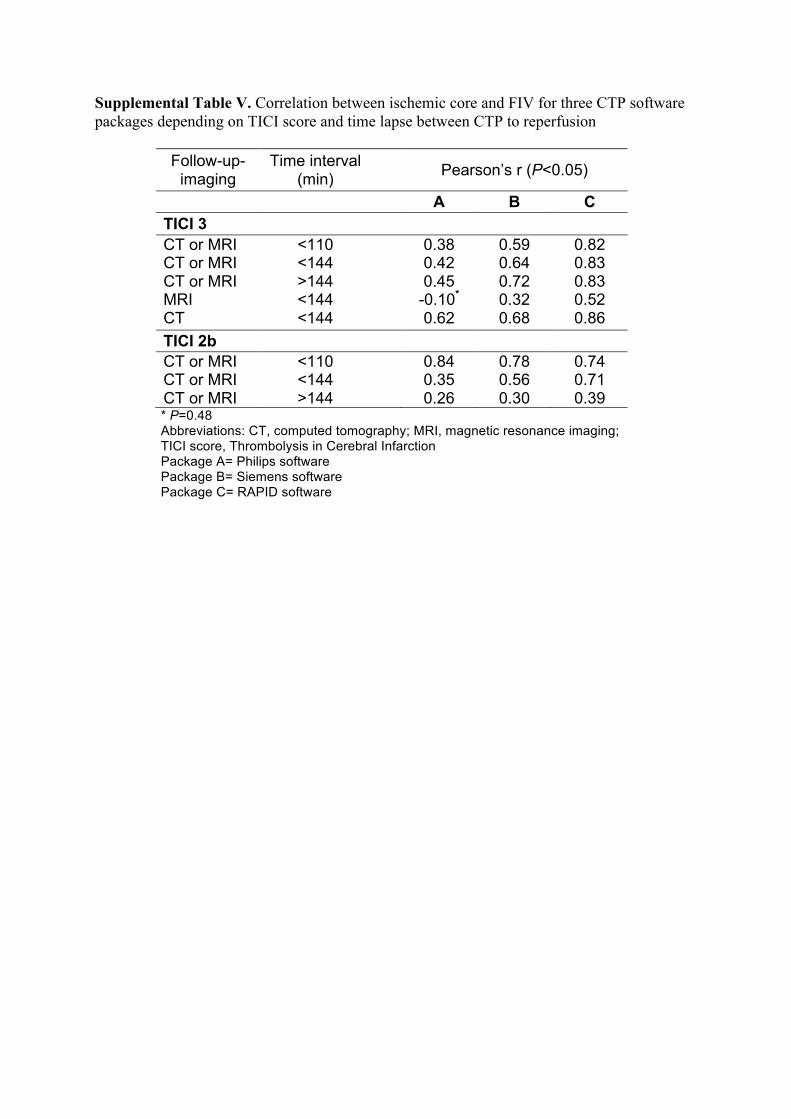
Supplemental Table V. Correlation between ischemic core and FIV for three CTP software packages depending on TICI score and time lapse between CTP to reperfusion
Follow-up-imaging
Time interval (min) Pearson’s r (P<0.05)
A B C TICI 3 CT or MRI <110 0.38 0.59 0.82 CT or MRI <144 0.42 0.64 0.83 CT or MRI >144 0.45 0.72 0.83 MRI <144 -0.10* 0.32 0.52 CT <144 0.62 0.68 0.86 TICI 2b CT or MRI <110 0.84 0.78 0.74 CT or MRI <144 0.35 0.56 0.71 CT or MRI >144 0.26 0.30 0.39 * P=0.48 Abbreviations: CT, computed tomography; MRI, magnetic resonance imaging; TICI score, Thrombolysis in Cerebral Infarction Package A= Philips software Package B= Siemens software Package C= RAPID software

Supplemental Figures I. Patients with very early recanalization and TICI 3 for package A-C
y=0,6338x-5,3705R²=0,20598
-150-100-50050100150200250
0 50 100 150 200 250
FIV-Ischem
iccore
(FIV+Ischemiccore)/2
PackageATICI3<110min(FIVwithCTorMRI)
y=0,9638x-18,315R²=0,58074
-150
-100
-50
0
50
100
150
200
250
0 50 100 150 200 250
FIV-Ischem
iccore
(FIV+Ischemiccore)/2
PackageBTICI3<110min(FIVwithCTorMRI)
y=0,7354x+4,7117R²=0,63595
-150
-100
-50
0
50
100
150
200
250
0 50 100 150 200 250
FIV-Ischem
iccore
(FIV+Ischemiccore)/2
PackageCTICI3<110min(FIVwithCTorMRI)

Supplemental Figures II. Patients with early recanalization and TICI 3 for package A-C
y=0,6901x-11,62R²=0,25705
-150
-100
-50
0
50
100
150
200
250
0 50 100 150 200 250
FIV-Ischem
iccore
(FIV+Ischemiccore)/2
PackageATICI3<144min(FIVwithCTorMRI)
y=0,9115x-18,492R²=0,58041
-150
-100
-50
0
50
100
150
200
250
0 50 100 150 200 250
FIV-Ischem
iccore
(FIV+Ischemiccore)/2
PackageBTICI3<144min(FIVwithCTorMRI)
y=0,8407x+1,9119R²=0,73702
-150
-100
-50
0
50
100
150
200
250
0 20 40 60 80 100 120 140 160
FIV-Ischem
iccore
(FIV+Ischemiccore)/2
PackageCTICI3<144min(FIVwithCTorMRI)

Supplemental Figures III. Patients with late recanalization and TICI 3 for package A-C
y=0,7943x-10,76R²=0,34934
-150
-100
-50
0
50
100
150
200
250
0 50 100 150 200 250
FIV-Ischem
iccore
(FIV+Ischemiccore)/2
PackageATICI3>144min(FIVwithCTorMRI)
y=1,1618x-18,731R²=0,80977
-150
-100
-50
0
50
100
150
200
250
0 50 100 150 200 250
FIV-Ischem
iccore
(FIV+Ischemiccore)/2
PackageBTICI3>144min(FIVwithCTorMRI)
y=1,2084x+1,796R²=0,88635
-150
-100
-50
0
50
100
150
200
250
0 50 100 150 200 250
FIV-Ischem
iccore
(FIV+Ischemiccore)/2
PackageCTICI3>144min(FIVwithCTorMRI)

Supplemental Figures IV. Patients with early recanalization, TICI 3 and only MRI follow-up for package A-C
y=-0,497x+11,097R²=0,0504
-150
-100
-50
0
50
100
150
200
250
0 50 100 150 200 250
FIV-Ischem
iccore
(FIV+Ischemiccore)/2
PackageATICI3<144min(FIVwithMRI)
y=0,6763x-14,218R²=0,20775
-150
-100
-50
0
50
100
150
200
250
0 50 100 150 200 250
FIV-Ischem
iccore
(FIV+Ischemiccore)/2
PackageBTICI3<144min(FIVwithMRI)
y=1,0889x-5,3882R²=0,61521
-150
-100
-50
0
50
100
150
200
250
0 50 100 150 200 250
FIV-Ischem
iccore
(FIV+Ischemiccore)/2
PackageCTICI3<144min(FIVwithMRI)

Supplemental Figures V. Patients with early recanalization and TICI 2b for package A-C
y=0,5907x-1,9743R²=0,17181
-150
-100
-50
0
50
100
150
200
250
0 50 100 150 200 250
FIV-Ischem
iccore
(FIV+Ischemiccore)/2
PackageATICI2b<144min(FIVwithCTorMRI)
y=1,0476x-11,401R²=0,62193
-150
-100
-50
0
50
100
150
200
250
0 50 100 150 200 250
FIV-Ischem
iccore
(FIV+Ischemiccore)/2
PackageBTICI2b<144min(FIVwithCTorMRI)
y=1,0095x-0,7775R²=0,79094
-150
-100
-50
0
50
100
150
200
250
0 50 100 150 200 250
FIV-Ischem
iccore
(FIV+Ischemiccore)/2
PackageCTICI2b<144min(FIVwithCTorMRI)

Supplemental Figures VI. Patients with late recanalization and TICI 2b for package A-C
y=1,5193x-32,525R²=0,75262
-200
-100
0
100
200
300
0 50 100 150 200 250
FIV-Ischem
iccore
(FIV+Ischemiccore)/2
PackageATICI2b>144min(FIVwithCTorMRI)
y=1,4396x-26,183R²=0,72415
-200
-100
0
100
200
300
0 50 100 150 200 250
FIV-Ischem
iccore
(FIV+Ischemiccore)/2
PackageBTICI2b>144min(FIVwithCTorMRI)
y=1,4139x-13,617R²=0,75846
-200
-100
0
100
200
300
0 50 100 150 200 250
FIV-Ischem
iccore
(FIV+Ischemiccore)/2
PackageCTICI2b>144min(FIVwithCTorMRI)

Figure I. Bland-Altman plots showing the relationship between the difference of FIV and predicted infarct volume and the average of FIV and predicted infarct including regression lines. Black dots visualize the estimation of FIV as predicted by the applied CTP software: negative values represent overestimation, positive values underestimation. Solid horizontal lines indicate the bias, dashed lines the limits of agreement.Package A= Philips software Package B= Siemens software Package C= RAPID software