Embed Size (px)
Citation preview
NOAA Technical Memorandum ERL PMEL-25
COMPARISON OF OCEAN AND ISLAND RAINFALL
IN THE TROPICAL SOUTH PACIFIC, ATLANTIC, AND INDIAN OCEANS
Cathleen WrightR. K. Reed
Pacific Marine Environmental LaboratorySeattle, WashingtonApril 1981
NOAALISO
SEATTLE
UNITED STATESDEPARTMENT OF COMMERCE
Malcolm Baldrige,Secretary
NATlONAL OCEANIC ANDATMOSPHERIC ADMINISTRATION
James P. Walsh,Acting Administrator
Environmental ResearchLaboratories
Joseph O. Fletcher,Acting Director


TABLE OF CONTENTS
Page
Abstract 1
l. INTRODUCTION 1
2. DATA 1
3. ISLAND/OCEAN RAINFALL RATIOS 12
4. DISCUSSION 14
5. CONCLUSIONS 16
6. REFERENCES 17
iii


COMPARISON OF OCEAN AND ISLAND RAINFALL IN THETROPICAL SOUTH PACIFIC, ATLANTIC, AND INDIAN OCEANS
Cathleen WrightR. K. Reed
AbstractMean annual rainfall and maximum elevation were compiled from a variety
of sources for islands in the tropical South Pacific, Atlantic, and Indianoceans. Estimated annual ocean rainfall in the vicinity of each island wastaken from a map of annual precipitation over the world ocean recentlyprepared by Reed and Elliott. Island rainfall was compared with oceanrainfall, and these island/ocean rainfall ratios were examined in terms oflocation and island elevation. No reliable correlation between island andocean precipitation was revealed, although low islands near the intertropicalconvergence zone seem most likely to have island rainfall representative ofocean rainfall.
1. INTRODUCTION
Reed and Elliott (1979) mapped mean annual precipitation over the North
Pacific from ship-of-opportunity frequency data using direct measurements of
ocean rainfall to verify precipitation intensity, and Reed (1980) consequently
compared these values with those obtained from tropical island rain gauges.
He concluded that island data are not reliable indices of oceanic rainfall.
Reed and Elliott (1981) have now mapped annual and seasonal precipitation
over the world ocean making it possible to extend island-ocean rainfall
comparison to the tropical South Pacific, Atlantic, and Indian oceans. This
memorandum presents compiled island and ocean rainfall data, sources, and some
calculations useful in such a comparison and briefly discusses the results.
2. DATA
Tables 1, 2, and 3 list the annual mean measured rainfall for selected
tropical islands in the South Pacific, Atlantic, and Indian oceans. Weather
records (Table 4) were consulted to determine which islands had sufficient
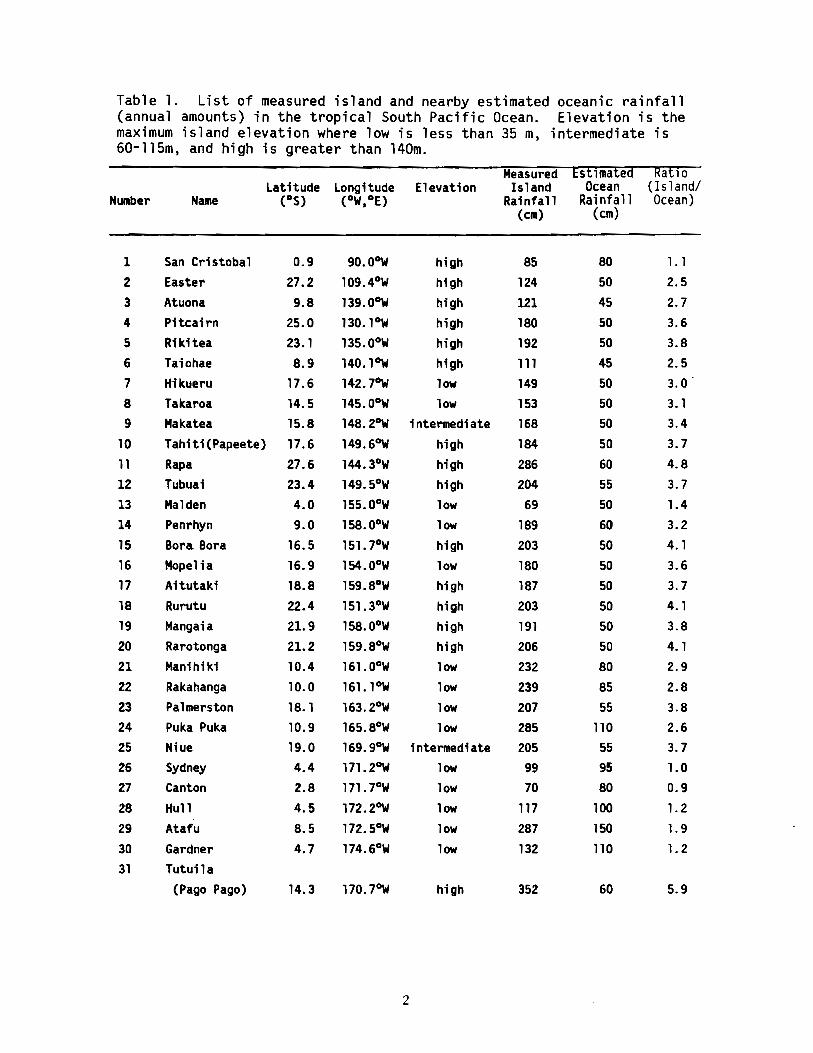
Table 1. List of measured island and nearby estimated oceanic rainfall(annual amounts) in the tropical South Pacific Ocean. Elevation is themaximum island elevation where low is less than 35 m, intermediate is60-l15m, and high is greater than 140m.
Measured Esbmated RailaLatitude Longitude Elevation Island Ocean (Is 1and/
Number Nalle (OS) (OW.oE) Rai nfall Rai nfall Ocean)(cm) (em)
1 San Cristobal 0.9 90.0oW high 85 80 1.1
2 Easter 27.2 109.4°W high 124 50 2.5
3 Atuona 9.8 139.0oW high 121 45 2.74 Pitcairn 25.0 130. lOW high 180 50 3.6
5 Rikitea 23.1 135.0oW high 192 50 3.86 Taiohae 8.9 140. lOW high 111 45 2.57 Hikueru 17.6 142.7°W low 149 50 3.08 Takaroa 14.5 145.0oW low 153 50 3. 19 Makatea 15.8 148.2°W intermediate 168 50 3.4
10 Tahiti (Papeete) 17.6 149.6OW high 184 50 3.711 Rapa 27.6 144.3°W high 286 60 4.812 Tubuai 23.4 149.5°W high 204 55 3.713 Malden 4.0 155.0oW low 69 50 1.414 Penrhyn 9.0 158.0oW low 189 60 3.215 Bora. Bora 16.5 151. 7°W high 203 50 4.116 Mope1ia 16.9 154.0oW low 180 50 3.617 Aitutaki 18.8 159.8°W high 187 50 3.718 Rurutu 22.4 151.3°W high 203 50 4.119 Mangaia 21.9 158.0oW high 191 50 3.820 Rarotonga 21.2 159.8°W high 206 50 4.121 Mani hi ki 10.4 161. OOW low 232 80 2.922 Rakahanga 10.0 161. lOW low 239 85 2.823 Pa1merston 18.1 163.2°W low 207 55 3.824 Puka Puka 10.9 165.8°W low 285 110 2.625 Niue 19.0 169.9°W intermediate 205 55 3.726 Sydney 4.4 171. lOW low 99 95 1.027 Canton 2.8 171.7°W low 70 80 0.928 Hull 4.5 172.2°W low 117 100 1.229 Atafu 8.5 172. SoW low 287 150 1.930 Gardner 4.7 174.6°W low 132 110 1.231 Tutui1a
(Pago Pago) 14.3 170.7°W high 352 60 5.9
2

Measured Esbmated RatIolatitude longitude Elevation Island Oeean (Island/
Number Nue (OS) (OW,OE) Rainfall Rainfall Ocean)(em) (em)
32 Swain's 11.0 171. lOW low 322 140 2.333 Upo1u (Apia) 13.8 171.8°W high 287 60 4.834 Keppel 16.0 173.8°W intermediate 232 60 3.935 Vavau 18.7 174.00 W high 218 55 4.036 Wall is 13.3 176. lOW high 341 80 4.337 Futuna(leava) 14.4 178.3°W high 326 60 5.438 lakemba 18.2 178.8°W high 190 50 3.839 Onoilau 20.7 178.7°W intermediate 171 50 3.440 Raoul 29.2 177.9OW high 150 50 3.041 Funafuti 8.5 179.2°E low 364 175 2. 142 Vaitupu 7.5 178.7°E low 313 160 2.043 Niutao 6.1 177.3°E low 280 160 1.844 Arorae 2.7 176.9°E low 143 125 1.145 Nui 7.3 176.2°E low 313 175 1.846 Nanumea 5.6 176.1°E low 278 155 1.847 Beru 1.4 176.00 E low 122 120 1.048 Tamana 2.5 176.00 E low 114 130 0.949 Tabiteuea 1.2 174.8°E low 111 120 0.950 Matuku 19. 1 179.7°E high 178 50 3.651 Nurakita 10.8 179.5°E low 351 170 2.152 Vitilevu(Suva) 18.1 178.4°E high 303 50 6.153 Rotuma 12.5 177.00 E high 365 120 3.054 Erromanga
(Dillon's Bay)18.8 169.00 E high 178 45 4.055 Tongoa 16.9 168.6°E high 282 50 5.656 Nguna 17.5 168.4°E high 222 45 4.957 Ma1ekula
(lamap) 16.4 167.8°E high 210 50 4.258 Vanua1ava(Sola)13.9 167.6°E high 403 60 6.759 Vanikoro 11.7 167.00 E high 566 160 3.560 Aneityum 20.2 169.8°E high 231 45 5. 161 Norfolk 29.0 167.9°E high 133 40 3.362 lord Howe 31. 5 159.1°E high 173 45 3.863 Will i s 16.3 150.0o E low 110 50 2.2
3

Table 2. List of measured island and nearby estimated oceanic rainfall(annual amounts) in the tropical Atlantic Ocean. Elevation is themaximum island elevation where low is less than 35m t intermediate ;sGO-115m and high ;s greater than 140m.
Number NameElevation
MeasuredIsland
Rainfall(em)
EsbmatedOcean
Rainfall(em)
RatlO(Is 1and/Ocean)
1 Sao Tome 0.4°N 6.1°E high 81 130 0.1
2 St. Helena 16.00 S 5.1°W high 82 25 3.3
3 Porto Santo 33.00 N 16.3OW high 36 25 1.4
4 Madeira(Funchal)32.6°N 16.9°W high 51 25 2.3
5 Fuerteventura 28. SON 13.9OW high 12 10 1.2
6 Gran Canaria(Las Palmas) 21.9°N 15.4°W high 20 15 1.3
1 Tenerife(Santa Cruz) 28.4°N 16.2°W high 33 15 2.2
8 Ascension 1.9°S 14.4°W high 11 35 0.3
9 Sao Tiago 14.9°M 23. SoW high 26 45 0.6
10 Sao Vincente 16.9°N 25.00 W high 15 40 0.4
11 Bermuda 32.3°N 64.8°W intermediate 133 55 2.4
12 St. Maarten 18.00 N 63. lOW high 114 80 1.4
13 St. Croix 17.1°N 64.8°W high 108 80 1.4
14 Curacao 12.2°N 69.00 W high 52 10 0.1
15 Mayaguana 22.4°N 15. SoW low 95 80 1.2
16 New Providence(Nassau) 25.00 N 77. SoW low 118 80 1.5
17 Grand Cayman 19.3ON 81.4°W low 130 80 1.6
18 Swan 17 .4°N 83.9°W low 133 80 1.1
4
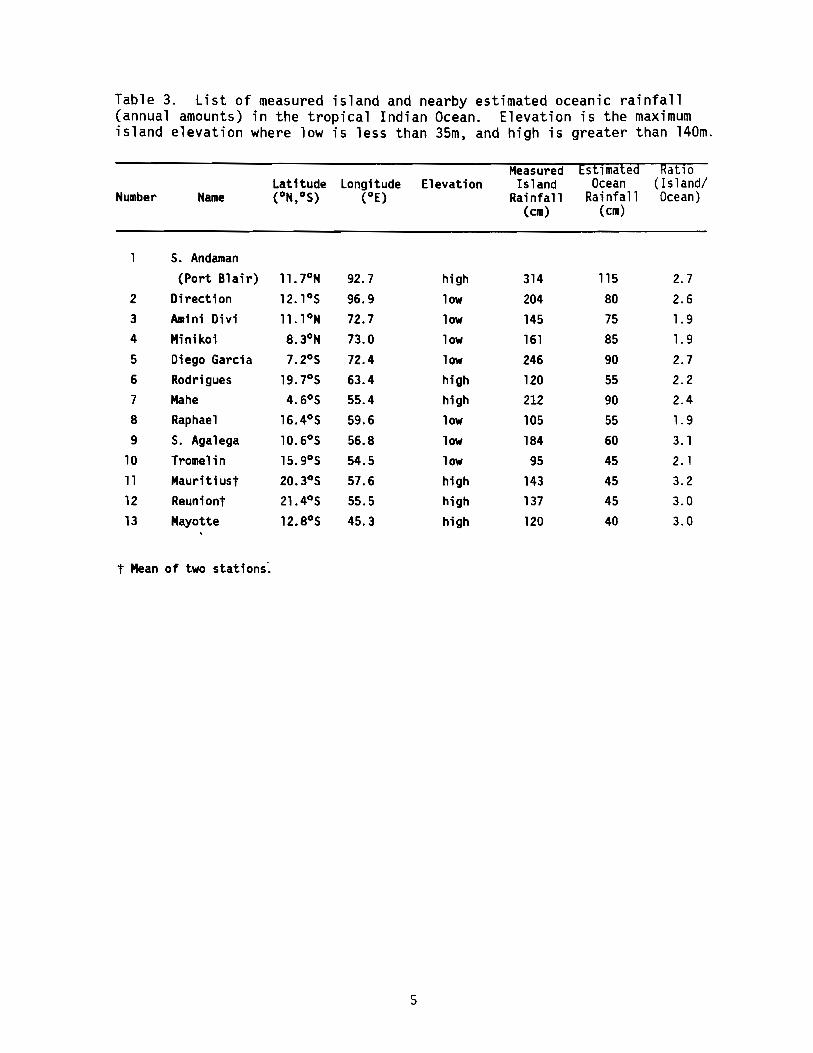
Table 3. List of measured island and nearby estimated oceanic rainfall(annual amounts) in the tropical Indian Ocean. Elevation is the maximumisland elevation where low is less than 35m, and high is greater than 140m.
EsbmatedMeasured Rat 10
Latitude longitude Elevation Island Ocean (Is 1and/Number Name (ON,OS) (OE) Rainfall Rainfall Ocean)
(em) (em)
S. Andaman(Port Blair) 11.7°N 92.7 high 314 115 2.7
2 Direction 12. lOS 96.9 low 204 80 2.63 AIIIini Divi 11.1°N 72.7 low 145 75 1.94 Minikoi 8.3°N 73.0 low 161 85 1.95 Diego Garcia 7.2°S 72.4 low 246 90 2.76 Rodrigues 19.7°S 63.4 high 120 55 2.27 Mahe 4.6°S 55.4 high 212 90 2.48 Raphael 16.4°S 59.6 low 105 55 1.99 S. Agalega 10.6°S 56.8 low 184 60 3. 1
10 Tramel in 15.9°S 54.5 low 95 45 2. 111 Mauritiust 20.3°S 57.6 high 143 45 3.212 Reuniont 21.4°S 55.5 high 137 45 3.013 Mayotte 12.8°S 45.3 high 120 40 3.0
t Mean of two stations~
5
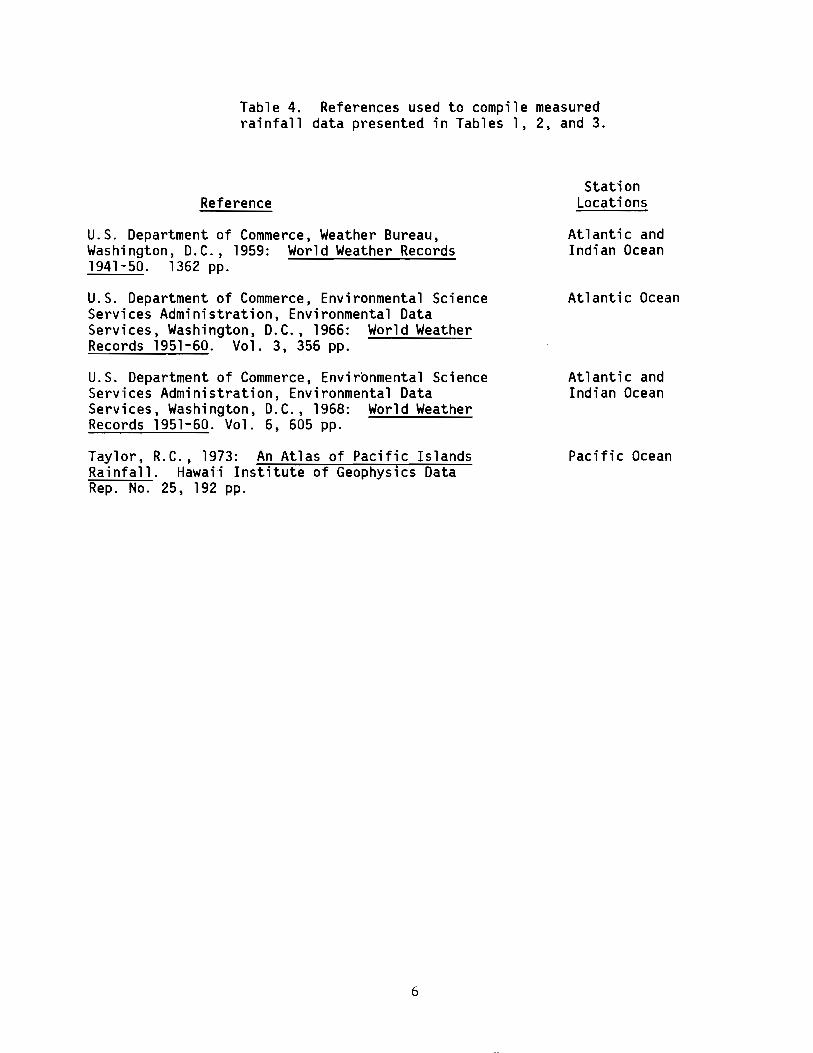
Table 4. References used to compile measuredrainfall data presented in Tables 1,2, and 3.
Reference
U.S. Department of Commerce, Weather Bureau,Washington, D.C., 1959: World Weather Records1941-50. 1362 pp.
U.S. Department of Commerce, Environmental ScienceServices Administration, Environmental DataServices, Washington, D.C., 1966: World WeatherRecords 1951-60. Vol. 3, 356 pp.
U.S. Department of Commerce, Environmental ScienceServices Administration, Environmental DataServices, Washington, D.C., 1968: World WeatherRecords 1951-60. Vol. 6, 605 pp.
Taylor, R.C., 1973: An Atlas of Pacific IslandsRainfall. Hawaii Institute of Geophysics DataRep. No. 25, 192 pp.
6
StationLocations
Atlantic andIndian Ocean
Atlantic Ocean
Atlantic andIndian Ocean
Pacifi c Ocean

rainfall data to provide reliable annual means for comparison with mean annual
ocean rainfall estimates. Taylor's atlas (Table 4) was used to select
tropical South Pacific islands where records of rainfall were available for
periods of at least ten years. Also selected were Swain1s Island with records
for six years and Easter Island and Malekula Island each with nine-year
records. This same criterion (record length) was used in choosing Indian
Ocean islands, and again three islands with shorter records were also ac
cepted: Tromelin Island (six years), Reunion Island (eight years), and
Direction Island (nine years). In the tropical Atlantic Ocean, several
islands (including Cuba, Jamaica, and Hispaniola,) are very large compared to
other Atlantic islands as well as most of those in the Pacific and Indian
oceans. Data on "l arge" islands, an admittedly subjective criterion, were not
used, and stations at high elevations and at sites sheltered from the wind
were also eliminated in a few instances. Fuerteventura, Bermuda, and Grand
Cayman were used even though their rainfall records cover only a nine-year
period.
Of the many physical factors that may affect island rainfall, maximum
island elevation is the most easily obtained and was also used by Reed (1980)
in his comparison in the North Pacific. Tables 1,2, and 3 accordingly
classify stations by maximum island elevation: low is under 35 m; intermediate
ranges from 60 to 115 m; and high is over 140 m. Elevations were found in the
references listed in Table 5. Insufficient information about island terrain
was used as the basis for rejection of some stations.
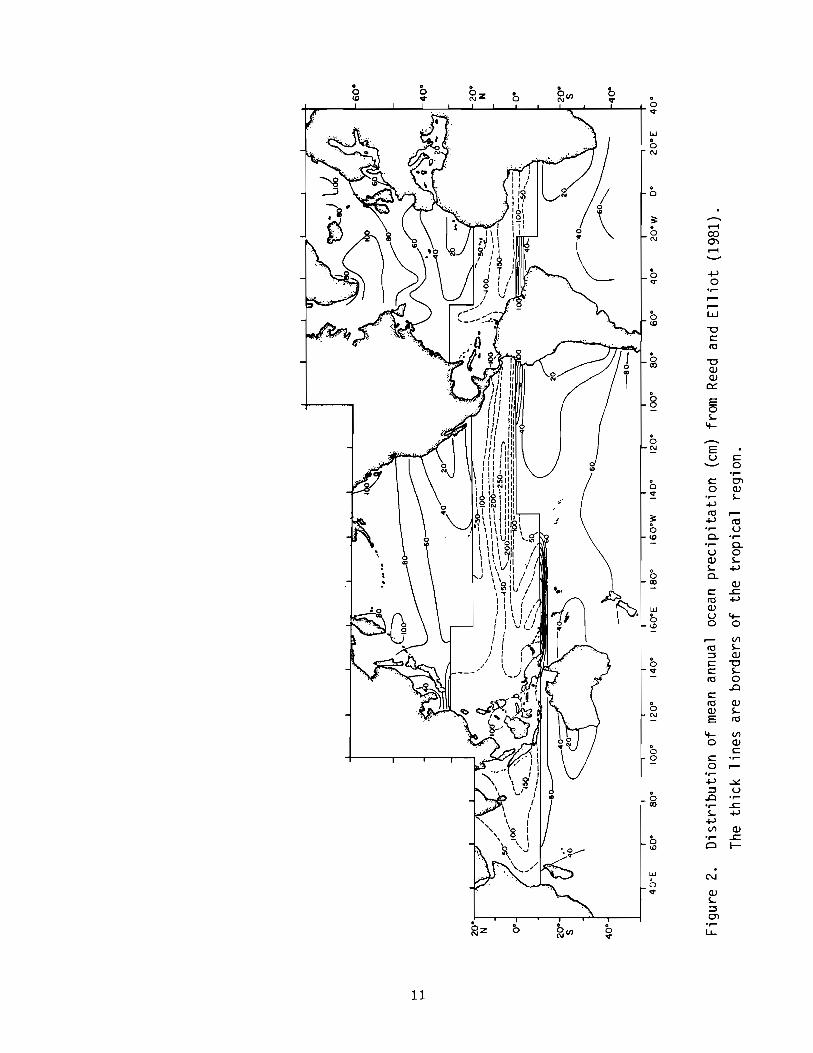
Figure 1 shows station positions numbered to correspond with the
tabulated data. Figure 2 shows mean annual oceanic precipitation from Reed
and Elliott (1981). Annual ocean rainfall estimates at the locations of the
7

Table 5. References used to determine island elevations for Tables 1, 2, and 3.
Pacific Ocean Stations
U.S. Hydrographic Office, 1929: Sailing Directions, New ZealandPilot including the Kermadec Islands, Chatham Islands and the off-lyingIslands to the Eastward and Southward of New Zealand. H.O. No. 171, 527 pp.
U.S. Hydrographic Office, 1930: Sailing Directions, Australia Pilot, Vol. !I,East Coast of Australia from Port Jackson to Cape York including the Islandsin the Coral Sea, Torres Strait, and the Inner Route. H.O. No. 169, 628 pp.
U.S. Navy Hydrographic Office, 1952: Sailing Directions for the PacificIslands, Vol. !!, Eastern Groups. H.O. Publ. No. 166, 420 pp.
U.S. Navy Hydrographic Office, 1952: Sailing Directions for the PacificIslands, Vol. !I, the Santa Cruz Group, the New Hebrides, New Caledonia,and Adjacent Islands. H.O. Publ. No. 165B, 238 pp.
Atlantic Ocean Stations
Defense Mapping Agency Hydrographic Center, 1976: Sailing Directions(Enroute) for the West Coast of Europe and Northwest Africa. Publ. 143, 519 pp.
Defense Mapping Agency Hydrographic/Topographic Center, 1976:Sailing Directions (Enroute) for the Caribbean Sea. Publ. 144, 467 pp.
Encyclopaedia Britannica, Inc., 1951: Encyclopaedia Britannica,Vol. 19, 1003 pp.
Times Books, New York City, 1980; The Times Atlas of the World,Comprehensive Edition. 123 plates, 227~ ------ --- ---- -----
8
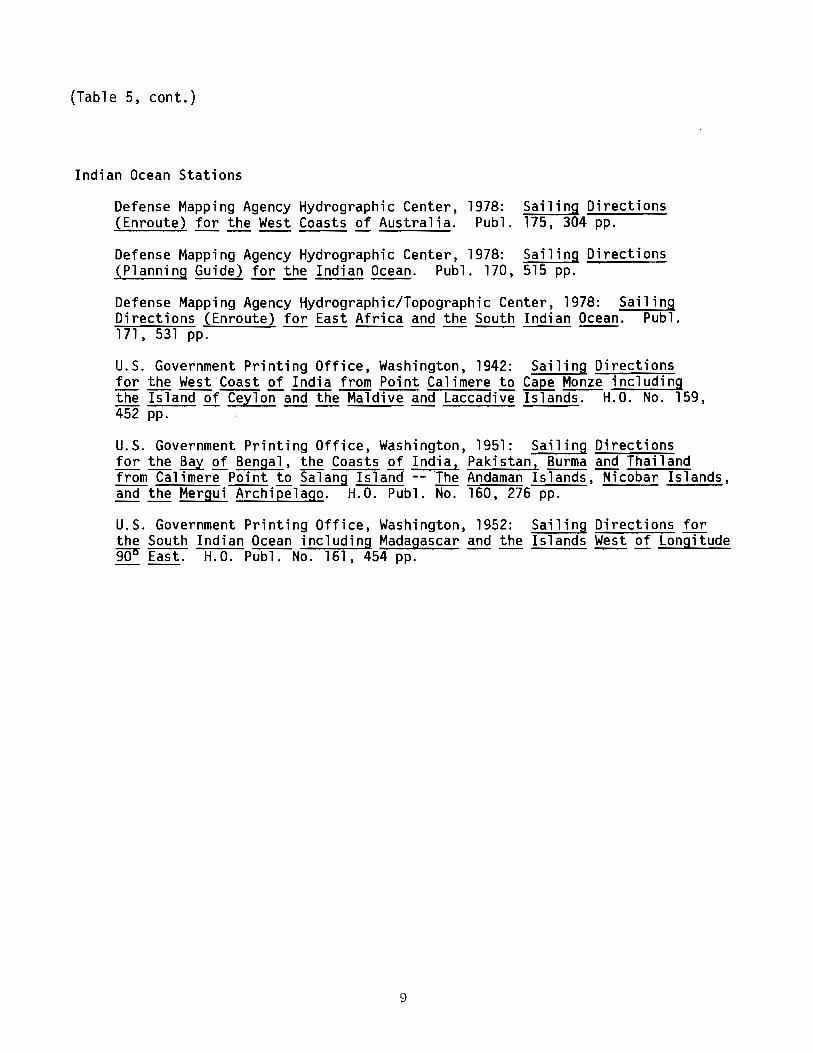
(Table 5, cont.)
Indian Ocean Stations
Defense Mapping Agency Hydrographic Center, 1978: Sailing Directions(Enroute) for the West Coasts of Australia. Publ. 175, 304 pp.
Defense Mapping Agency Hydrographic Center, 1978: Sailing Directions(Planning Guide) for the Indian Ocean. Publ. 170, 515 pp.
Defense Mapping Agency Hydrographic/Topographic Center, 1978: SailingDirections (Enroute) for East Africa and the South Indian Ocean. Publ.171, 531 pp. - -- -- -- --
U.S. Government Printing Office, Washington, 1942: Sailing Directionsfor the West Coast of India from Point Calimere to Cape Monze includingthe Island of Ceylon and the Maldive and Laccadive Islands. H.O. No. 159,452 pp.
U.S. Government Printing Office, Washington, 1951: Sailing Directionsfor the Bay of Bengal, the Coasts of India, Pakistan, Burma and Thailandfrom Calimere Point to Salang Island --The Andaman Islands, Nicobar Islands,and the Mergui Archipelago. H.O. Publ. No. 160, 276 pp.
U.S. Government Printing Office, Washington, 1952: Sailing Directions for~ South Indian Ocean including Madagascar and the Islands~ of Longitude90 East. H.O. Publ. No. 161, 454 pp.
9

20
·N O
·
60
·
20
·S40
·
40
·
,8,,-
.1\
UfJ
.2
~~ "g
:
------:l
."•~
.~
0••
NO
RT
HP
AC
IFIC
ST
AT
IVN
S
o
(J'"
",7
tJ'"''l,.
g" ....
12
-II
O·
I
YQ
..I
'\0
,I
"2
0°/
\\../
~d
'lO1
-'t~
",~
.,
'.
=,.
,,~t,'g
,.,
•••
."'I
'i{;
l'-~
"••••
•,"~"
;~'""
"'.
,\:J
.'~
._
....
..,.
,.,
.,'.
<::::::,W
·_..
.'"
..'
'~"';~,i
!.2
()0
18
',1
2"
.2.
~/."60;
~II""
,\."
,'0
.,,
~2
• c:P~
20
°S 40
·
......
o
40
·E6
0·
80
·10
0°1
20
·1
40
·1
60
·E1
80
·1
60
·W1
40
·1
20
·1
00
·8
0·
60
°4
0·
20
·WO
·2
0·
E4
0°
Fig
ure
1.L
ocat
ions
ofis
lan
dra
infa
llst
atio
ns
list
edin
Tab
les
1,2,
and
3.Th
ebl
ock
lab
eled
IIN
orth
Pac
ific
Sta
tion
sllre
fers
toa
stud
yby
Ree
d(1
980)
.
20
'N40
'
60
·
O'
20
'S 40
"
20
'E'1
0·
20
·WO
·'1
0'
60
·8
0·
10
0·
12
0·
16
0·W
1'10
·16
0·E
180°
14
0·
12
0·
10
0·
80
·6
0·
40
0E
O·
20
·,l
',
IN
•w
w•
w
20
·S 40
·
......
......
Fig
ure
2.D
istr
ibut
ion
ofm
ean
annu
aloc
ean
pre
cip
itat
ion
(cm
)fr
omR
eed
and
Ell
iot
(198
1).
The
thic
kli
nes
are
bord
ers
ofth
etr
op
ical
regi
on.

islands were taken from this map and are given in Tables 1, 2, and 3. The
measured island rainfall was divided by the estimated ocean rainfall to obtain
the ratio printed in the last column of these tables.
Table 6 separates the islands into physical subgroups within geographical
regions and tabulates mean island/ocean rainfall ratios and standard
deviations.
3. ISLAND/OCEAN RAINFALL RATIOS
The best areal island distribution is in the tropical South Pacific where
there are large numbers of both low and high islands. As shown in Table 6,
most of the low islands form two groups: islands 13, 26-28, 30, 44, and 47-49
have a mean rainfall ratio of 1.1 and lie between 1 and 50S; islands 14, 21,
22, 24, 29, 32, 41-43, 45, 46, and 51 have a mean ratio of 2.3 and lie between
6 and 110S. Of all the low islands listed in Table 1, 65% have rainfall
ratios greater than 1.8.
Most of the high islands (91%) have rainfall ratios of 3.0 or larger and,
as a group, have a mean ratio of 4.1. In contrast, Reed (1980) listed a ratio
of 3.0 ± 0.7 for high islands in the North Pacific. San Cristobal, with a
ratio of 1.1, is not included statistically with the other high islands since
the meteorological station seems to be exposed to the prevailing trade winds
and is not generally influenced by the mountains. The high islands can be
loosely grouped by position east or west of 165°W. Stations in the Tuamoto
Archipelago, Society Islands, and Austral Seamount Chain (4, 5, 10-12, 15,
17-20) are east of 165°W and have a mean ratio of 3.9 ± 0.4. Stations in the
Fiji, Tonga, Samoa, and New Hebrides islands (31, 33, 35-38, 50, 52, 54-60)
12
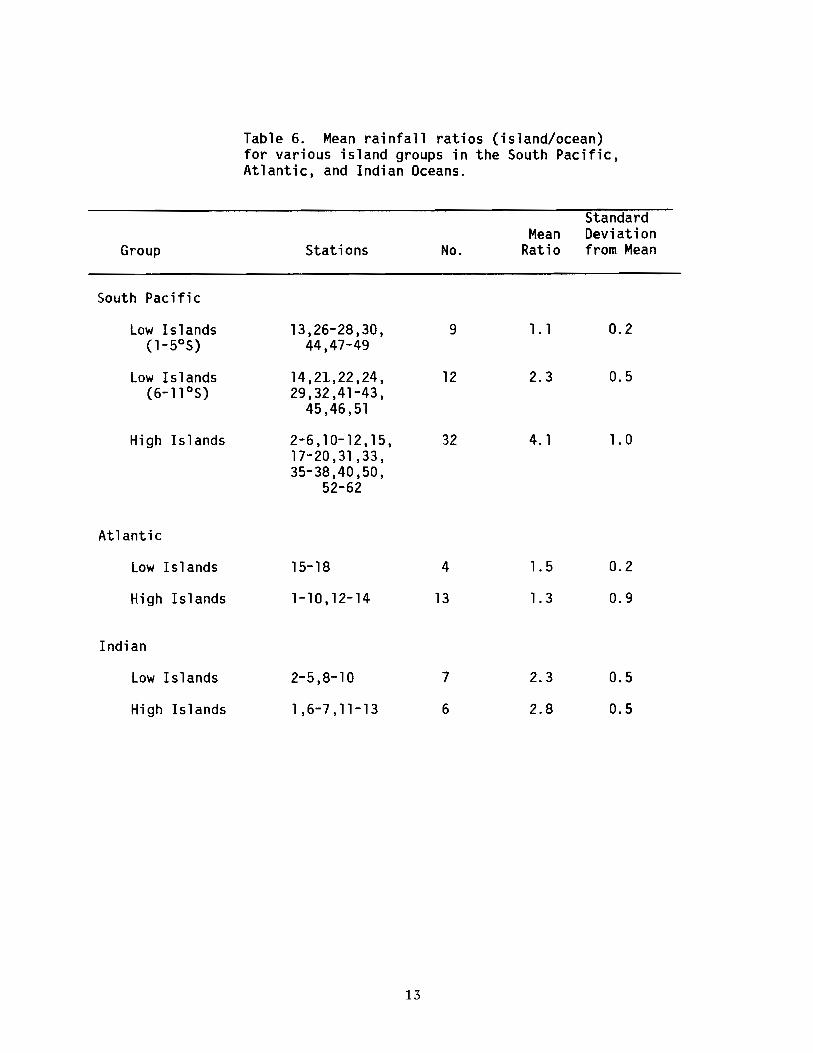
Table 6. Mean rai nfa 11 ratios (island/ocean)for various island groups in the South Pacific,Atlantic, and Indian Oceans.
StandardMean Deviation
Group Stations No. Ratio from Mean
South Pacifi c
low Islands 13,26-28,30, 9 1.1 0.2(1-5°5) 44,47-49
low Islands 14,21,22,24, 12 2.3 0.5(6-11°5) 29,32,41-43,
45,46,51
High Islands 2-6,10-12, 15, 32 4. 1 1.017-20,31,33,35-38,40,50,
52-62
Atlantic
low Islands 15-18 4 1.5 0.2
High Islands 1-10, 12-14 13 1.3 0.9
Indian
low Islands 2-5,8-10 7 2.3 0.5
High Islands 1,6-7,11-13 6 2.8 0.5
13

are west of 165°W and have a mean ratio of 4.8 ± 1.0. While the western group
has a higher mean ratio, it also has a larger standard deviation.
The tropical Atlantic Ocean islands are mostly high. The four low
islands have a mean island/ocean rainfall ratio of 1.5 with a standard
deviation of 0.2 and are situated west of the high islands used. While the
high islands as a group have a mean rainfall ratio of 1.3, less than that for
the low islands, the range is from 0.3 to ~.3. The three lowest values
(stations 8-10) are for Ascension Island and the Cape Verde Islands.
The Indian Ocean stations are mostly clustered near India and Madagascar;
six of the islands are high and seven are low. The mean rainfall ratio for
all of the islands is 2.5 with a standard deviation of 0.5. The low-island
ratio is slightly lower than this, and the high-island ratio is slightly
higher.
4. DISCUSSION
The results presented here are compatible with tropical North Pacific
data (Reed, 1980). In the tropical South Pacific, low islands between 1 and
50S (Table 6) received rainfall that was in best agreement with estimated
annual ocean rainfall (mean ratio = 1.1). Island rainfall increases to two to
six times the estimated ocean amount for islands located farther south of this
group or for sites with greater elevation.
The stations from 1 to 50S are on the south side of the intertropical
convergence zone which occurs over the entire Pacific just north of the
equator. The low island stations between 6 and 110S, which have a higher mean
ratio than the 1 to 50S group, are in a second, southern branch of the
intertropical convergence zone which stretches from New Guinea to about 1600W
(Hubert et !l., 1969; Reed and Elliott, 1981). Reed (1980) found that
14

rainfall ratios for North Pacific islands nearest the northern convergence
were lower than for those farther away and suggested that this resulted from a
change from convective to more frontal rainfall as distance from the
convergence zone increases. It is unclear, however, why the stations from 6
to 110S have relatively high ratios unless rainfall in this southern branch of
the intertropical convergence zone is different in character from that near
the northern zone.
Since the mean ratio for the South Pacific high islands is greater than
that for the low-island groups (Table 6), it was thought that there might be a
relationship between a high island's maximum elevation and its corresponding
rainfall ratio. However, calculations yielded a correlation coefficient of
only 0.16.· Thus, factors besides maximum island elevation (station elevation
and exposure, cross-sectional area of island, island relief in relation to
prevailing winds, etc.) appear to have important effects on rainfall.
Ratios for tropical Atlantic Ocean islands are unusual in that the high
islands have ratios much lower there than in the other oceans (Table 6). Five
of the high islands have less rainfall than the ocean estimates; however,
ratios for Ascension Island and the Cape Verde Islands (Sao Tiago and Sao
Vincente) may be low because they are near the "tropical boundary" (Reed and
Elliott, 1981), which could not be precisely located and may have been placed
too far poleward at these sites. It should also be kept in mind that ocean
rainfall estimates for the western islands are subjective since Reed and
Elliott's isohyets are not clearly established in this particular region.
All the Indian Ocean islands receive two to three times as much rain as
occurs over the open ocean regardless of latitude or elevation. However, some
of these islands are located near the tropical boundary, and the values may be
suspect as noted above. Also, few of the islands are near the intertropical
15
convergence zone, and the rainfall may be mainly frontal in nature resulting
in relatively high ratios (Reed, 1980).
5. CONCLUSIONS
High islands in the Pacific and Indian oceans generally had larger
island/ocean rainfall ratios than low islands, but this was not true in the
Atlantic. Calculation of a correlation coefficient for maximum island
elevation versus island/ocean rainfall ratio revealed that the variations in
these variables were not well correlated.
Low islands between latitudes 1 and 50 S in the Pacific have rainfall
comparable to ocean estimates, but other low islands have as much as two to
three times the estimated amount. Rainfall type due to island location with
respect to the intertropical convergence zone may have a strong influence on
island precipitation.
The main implication is that island rainfall generally does not reflect
ocean rainfall and cannot be used as a predictor. In addition, it seems
likely that many factors, such as cross-sectional area of island relief, type
of terrain, and geographic location, all affect actual island precipitation.
No matter how important orographic effects may be, maximum island elevation
alone can provide only a very crude estimate of the increase in island rainfall
compared with ocean rainfall.
16
7. REFERENCES
Hubert, L.F., A.F. Krueger, and J.S. Winston (1969): The double intertropical
convergence lone--fact or fiction? J. Atmos. Sci., 26:771-73.
Reed, R.K. (1980):
North Pacific.
Comparison of ocean and island rainfall in the tropical
J. Appl. Meteor., 19:877-80.
Reed, R.K., and W.P. Elliott (1979): New precipitation maps for the North
Atlantic and North Pacific oceans. J. Geophys. Res., 84:7S39-46.
Reed, R.K., and W. P. Elliott (1981): New precipitation maps for the world
ocean. Unpublished manuscript.
17