Embed Size (px)
Citation preview
ORI GIN AL PA PER
Comparison of near-fault and far-fault ground motioneffects on geometrically nonlinear earthquake behaviorof suspension bridges
Suleyman Adanur • Ahmet Can Altunisik • Alemdar Bayraktar •
Mehmet Akkose
Received: 8 June 2009 / Accepted: 14 June 2012 / Published online: 27 June 2012� Springer Science+Business Media B.V. 2012
Abstract This paper presents a comparison of near-fault and far-fault ground motion
effects on geometrically nonlinear earthquake behavior of suspension bridges. Bogazici
(The First Bosporus) and Fatih Sultan Mehmet (Second Bosporus) suspension bridges built
in Istanbul, Turkey, are selected as numerical examples. Both bridges have almost the
same span. While Bogazici Suspension Bridge has inclined hangers, Fatih Sultan Mehmet
Suspension Bridge has vertical hangers. Geometric nonlinearity including P-delta effects
from self-weight of the bridges is taken into account in the determination of the dynamic
behavior of the suspension bridges for near-fault and far-fault ground motions. Near-fault
and far-fault strong ground motion records, which have approximately identical peak
ground accelerations, of 1999 Chi-Chi, 1999 Kocaeli, and 1979 Imperial Valley earth-
quakes are selected for the analyses. Displacements and internal forces of the bridges are
determined using the finite element method including geometric nonlinearity. The dis-
placements and internal forces obtained from the dynamic analyses of suspension bridges
subjected to each fault effect are compared with each other. It is clearly seen that near-fault
ground motions are more effective than far-fault ground motion on the displacements and
internal forces such as bending moment, shear force and axial forces of the suspension
bridges.
Keywords Suspension bridge � Far-fault ground motion � Near-fault ground motion �Geometric nonlinearity � Nonlinear earthquake behavior � P-delta effect
S. Adanur � A. C. Altunisik (&) � A. Bayraktar � M. AkkoseDepartment of Civil Engineering, Karadeniz Technical University, 61080 Trabzon, Turkeye-mail: [email protected]
S. Adanure-mail: [email protected]
A. Bayraktare-mail: [email protected]
M. Akkosee-mail: [email protected]
123
Nat Hazards (2012) 64:593–614DOI 10.1007/s11069-012-0259-5

1 Introduction
Near-fault ground motions recorded in recent major earthquakes (1999 Taiwan Chi-Chi,
1989 Loma Prieta, 1994 US Northridge, and 1995 Japan Hyogoken-Nanbu) are charac-
terized by a ground motion with large velocity pulse, which exposes the structures to high
input energy in the beginning of the earthquake. Comparison of the near-fault strong
ground motion velocities with far-fault strong ground motions is shown in Fig. 1 (Akkar
et al. 2005). These pulses are strongly influenced by the orientation of the fault, the
direction of slip on the fault, and the location of the recording station relative to the fault
which is termed as ‘directivity effect’ due to the propagation of the rupture toward the
recording site (Archuleta and Hartzell 1981; Megawati et al. 2001; Agrawal and He 2002;
Wang et al. 2002; Somerville 2003; Bray and Marek 2004; Pulido and Kubo 2004; Akkar
et al. 2005).
The effects of near-fault ground motion on many civil engineering structures such as
buildings, tunnels, dams, bridges, nuclear station have been investigated in many recent
studies (Hall et al. 1995; Malhotra 1999; Ohmachi and Jalali 1999; Chopra and Chin-
tanapakdee 2001; Rao and Jangid 2001; Liao et al. 2004; Corigliano et al. 2006; Galal and
Ghobarah 2006; Ghahari et al. 2006; Dicleli and Buddaram 2007; Bayraktar et al. 2008). It
can be clearly seen from these studies that the importance of near-fault ground motion
effect on the response of the structures has been highlighted.
There are many studies about the dynamic responses of suspension bridges under the
uniform or nonuniform earthquake ground motions using deterministic or stochastic
methods in the literature (Abdel-Ghaffar 1976, 1980; Abdel-Ghaffar and Rubin 1982,
1983a, b, Abdel-Ghaffar and Stringfellow 1984; Dumanoglu and Severn 1987, 1989, 1990;
Dumanoglu et al. 1992; Hyun et al. 1992; Nakamura et al. 1993; Brownjohn 1994;
Harichandran et al. 1996; Rassem et al. 1996; Wang et al. 1999; Zhang et al. 2005).
However, there is not sufficient research about the effects of near-fault ground motions on
dynamic responses of suspension bridges.
Suspension bridges consist of elements like tower, cable, hanger and deck; the behavior
of each one is different. Under the effect of external forces and self-weight of the bridge,
especially cables and hangers are subjected to large tension forces, which have consid-
erable influence on the element stiffness matrices. This characteristic is called as geometric
nonlinearity of the structural elements and should be taken into account in the analysis of
suspension bridges.
The main objective of this paper is to determine and compare the earthquake behavior
of suspension bridge subjected to near-fault and far-fault ground motions considering
geometric nonlinearity. For this purpose, Bogazici (The First Bosporus) suspension bridge
Fig. 1 The time-histories of strong ground motion velocities (Akkar et al. 2005). a Near-fault strong groundmotion. b Far-fault strong ground motion
594 Nat Hazards (2012) 64:593–614
123

with inclined hangers and Fatih Sultan Mehmet (Second Bosporus) suspension bridge with
vertical hangers are utilized. The 1999 Chi-Chi, 1999 Kocaeli, and 1979 Imperial Valley
earthquake records are selected to represent the near-fault ground motion characteristics. In
this study, the term ‘‘near-fault ground motion’’ is referred to the ground motion record
obtained in the vicinity of a fault with apparent velocity pulse (pulse duration larger than
1.0 s), the distance of the fault of the ground motion record less than 10 km, and the peak
ground velocity/peak ground acceleration (PGV/PGA) value which is larger than 0.1 s.
The far-fault ground motions recorded at the same site at abovementioned earthquakes
used to compare with near-fault ground motions.
2 Near-fault and far-fault ground motions
In this study, near-fault ground motion records are selected as an input ground motion from
1999 Chi-Chi, 1999 Kocaeli, and 1979 Imperial Valley earthquakes. These records are
taken from station numbers TCU060, IZT180, and H-BRA225, respectively. In addition,
another set of earthquake records, which recorded at the same site conditions from the
same earthquakes events with epicenter far away from the site, is selected to illustrate far-
fault ground motion characteristics. PGA and PGV, surface projection distances from the
site to the fault, and PGV/PGA values are given in Table 1. The ground motion records are
obtained from the PEER Strong Motion Database (PEER 2008). The database has infor-
mation on the site conditions and the soil type for the instrument locations.
It is aimed to obtain two ground motion records with same peak acceleration values of
each earthquake (1999 Chi-Chi, 1999 Kocaeli, and 1979 Imperial Valley) to compare the
results more accurately. So, more attention was paid to the selection of records. If the
ground motion records of each earthquake are selected randomly (different peak accel-
eration values), it cannot be said directly that near-fault ground motion has remarkable
effects on the geometric nonlinear earthquake response of suspension bridges. So, it is
aimed to eliminate this contradiction by selected ground motion records with same peak
acceleration values.
The acceleration, velocity, and response spectra time-histories of the horizontal com-
ponent of the near-fault and far-fault ground motions obtained from all earthquakes are
shown in Figs. 2, 3, and 4, respectively. These figures show that the velocity pulses of the
near-fault ground motions are significantly different as compared to the far-fault ground
motions. The near-fault ground motions have significantly long-period velocity pulse.
The horizontal or longitudinal components of ground motions are important for an
earthquake response analysis of many types of structures. For long-span bridges, however,
Table 1 Properties of selected near-fault and far-fault ground motion records
Groundmotion
Earthquake Station PGA(m/s2)
PGV(cm/s)
PGV/PGA (s) Mw Distanceto fault (km)
Near fault Chi-Chi TCU060 0.20g 36.3 0.18 7.6 9.50
Far fault Chi-Chi ILA067 0.20g 11.8 0.06 7.6 48.68
Near fault Kocaeli IZT180 0.15g 22.6 0.15 7.8 4.80
Far fault Kocaeli FAT090 0.16g 0.09 0.06 7.8 64.50
Near fault Imperial Valley H-BRA225 0.16g 35.9 0.22 6.9 8.50
Far fault Imperial Valley H-CMP285 0.15g 9.5 0.06 6.9 32.60
Nat Hazards (2012) 64:593–614 595
123

Fig. 2 Near-fault and far-fault ground motions recorded at 1999 Chi-Chi earthquake. a Acceleration time-histories for near-fault and far-fault ground motions. b Velocity time-histories for near-fault and far-faultground motions. c Response spectra for near-fault and far-fault ground motions
596 Nat Hazards (2012) 64:593–614
123

Fig. 3 Near-fault and far-fault ground motions recorded at 1999 Kocaeli earthquake. a Acceleration time-histories for near-fault and far-fault ground motions. b Velocity time-histories for near-fault and far-faultground motions. c Response spectra for near-fault and far-fault ground motions
Nat Hazards (2012) 64:593–614 597
123

Fig. 4 Near-fault and far-fault ground motions recorded at 1979 Imperial Valley earthquake. a Accelerationtime-histories for near-fault and far-fault ground motions. b Velocity time-histories for near-fault and far-fault ground motions. c Response spectra for near-fault and far-fault ground motions
598 Nat Hazards (2012) 64:593–614
123

vertical component of the ground motion is more important than lateral (longitudinal and
transverse) components. Therefore, in this study, selected ground motion records are
applied to only vertical direction, and lateral (longitudinal and transverse) motions are
ignored (Abdel-Ghaffar and Stringfellow 1984; Dumanoglu and Severn 1987, 1989).
3 Numerical examples
This study is focused on the determination and comparison of near-fault and far-fault
strong ground motion effects on the geometrically nonlinear earthquake response of sus-
pension bridges. Because of self-weight of suspension bridges, they have large displace-
ments. These displacements cause geometric nonlinear behavior of suspension bridges.
P-delta effect has significant effect on the numerical result for the present structural sys-
tems (Adanur 2003; Altunısık et al. 2006). The geometric nonlinearity due to self-weight
of the bridges is taken into account, including the P-delta effects in the nonlinear dynamic
analyses. 2D finite element models of the suspension bridges are prepared using the
software SAP2000 (SAP2000 1998). The dimensional and material properties of the
structural elements are selected by project drawings and calculation reports (Freeman et al.
1968; Brown and Parsons 1975). In this paper, the program is used to determine the
dynamic characteristics and geometrically nonlinear behavior of bridges based on their
physical and mechanical properties. Finite element models of the Bogazici and Fatih
Sultan Mehmet suspension bridges have three degrees of freedom at each nodal point,
namely two translational degrees of freedom in vertical and longitudinal axes and one
rotational degree of freedom in lateral axis. As the deck, towers and cables are represented
by beam elements, the hangers are represented by truss elements in the both bridges. The
fact that this 2D model has relatively small number of degrees of freedom makes it more
attractive by saving on computer time. Obviously, if actual design values for the responses
are desired, 3D model should be taken into account. Although 2D bridge model includes
some simplifications, it has been extensively used in the literature and has been shown to
capture the dynamic behavior of 3D model. It was verified that 2D analysis provides
natural frequencies and mode shapes which are in close agreement with those obtained by
3D analysis in the vertical direction for suspension bridges (Dumanoglu and Severn 1985;
Adanur 2003; Altunısık et al. 2006). Therefore, it is believed that the results based on the
2D analyses are representative of the actual 3D long-span bridge structures.
It is generally expected that finite element models based on technical design data and
engineering judgments can yield reliable simulation for both the static and dynamic
behaviors of suspension bridges. However, because of modeling uncertainties such as
stiffness of supports and nonstructural elements, material properties and so on as well as
inevitable differences between the properties of the designed and as-built structure, these
finite element models often cannot predict natural frequencies and mode shapes with the
required level of accuracy. This raises the need for verification of the finite element models
of suspension bridges after their construction. For this purpose, modal testing is nowadays
used commonly. The aim of modal testing is to determine as-built natural frequencies,
mode shapes, and damping ratios. These are especially important when they are required to
further study the behavior of suspension bridges.
There are two basically different methods available to experimentally identify the
dynamic system parameters of a structure (of any kind, including suspension bridges):
Experimental Modal Analysis and Operational Modal Analysis. In the Experimental Modal
Analysis, the structure is excited by known input force (such as impulse hammers, drop
Nat Hazards (2012) 64:593–614 599
123

weights and electrodynamics shakers) and response of the structure is measured. In the
Operational Modal Analysis, the structure is excited by unknown input force (ambient
vibrations such as traffic load, wind and wave) and response of the structure is measured.
Some heavy forced excitations become very expensive and sometimes may cause the
possible damage to the structure. But ambient excitations such as traffic, wave, wind,
earthquake and their combination are environmental or natural excitations. Therefore, the
system identification techniques through ambient vibration measurements become very
attractive. In this case, only response data of ambient vibrations are measurable while
actual loading conditions are unknown. A system identification procedure will therefore
need to base itself on output-only data. Ambient vibration tests using Operational Modal
Analyses method were conducted on Bogazici and Fatih Sultan Mehmet Suspension
Bridges to validate the finite element models (Dumanoglu et al. 1989; Brownjohn et al.
1992).
Suspension bridges are not structurally homogeneous as building and dams. It was
concluded from previous studies that the tower, deck, and cables affect the structural
response in a wide range of modes (Dumanoglu and Severn 1987). The number of modes
plays a very important role in obtaining the acceptable results. Therefore, the first 15
modes of vibration and a 2 % of damping coefficient are adopted for the response cal-
culations. The modal frequencies of the first fifteen modes of the bridges used in this study
are given in Table 2. As can be seen from Table 2, the low modes of the both bridges have
very low frequencies and are very closely spaces.
3.1 Earthquake response of Bogazici (First Bosporus) suspension bridge
The Bogazici (First Bosporus) suspension bridge (Fig. 5) (http://www.oib.gov.tr/portfoy/
bogazici_koprusu.htm) connecting the Europe and Asia Continents in Istanbul, Turkey, is a
1,560 m long with a main span of 1,074 m and side spans of 231 and 255 m on the
Table 2 The first 15 modal fre-quencies of the consideredbridges
Mode number Frequency (Hz)
First Bosporusbridge
Second Bosporusbridge
1 0.121 0.120
2 0.161 0.154
3 0.220 0.208
4 0.277 0.240
5 0.365 0.314
6 0.449 0.388
7 0.554 0.474
8 0.574 0.538
9 0.661 0.566
10 0.771 0.669
11 0.896 0.780
12 1.026 0.902
13 1.032 1.034
14 1.036 1.176
15 1.174 1.226
600 Nat Hazards (2012) 64:593–614
123

European and the Asian sides, respectively, without any side spans supported by cables.
The decks of the side spans at the bridge are supported on the ground by piers. The bridge
has flexible steel towers of 165 m high, inclined hangers and a steel box-deck. The hor-
izontal distance between the cables is 28 m and the roadway is 21 m wide, accommodating
three lanes each way. The roadway at the mid-span of the bridge is approximately 64 m
above the sea level.
The 2D finite element model of the bridge with 202 nodal points, 199 beam elements
and 118 truss elements is considered for the analyses. The selected finite element model of
the bridge is represented by 475 degrees of freedom (Fig. 6). The material and section
properties of the elements used in the finite element model are given in Table 3.
3.1.1 Tower responses
Time-histories of horizontal displacements at the top point of European side tower of
Bogazici suspension bridge obtained from nonlinear analysis for near-fault and far-fault
Fig. 5 Picture of Bogazici (First Bosporus) Suspension Bridge (http://www.oib.gov.tr/portfoy/bogazici_koprusu.htm)
Fig. 6 2D finite element model of Bogazici (First Bosporus) suspension bridge subjected to vertical groundmotions
Nat Hazards (2012) 64:593–614 601
123

ground motions of 1999 Chi-Chi, 1999 Kocaeli, and 1979 Imperial Valley earthquakes are
presented in Fig. 7. The maximum displacements on the tower occurred as 3.40–1.80 cm,
2.20–0.95 cm, and 5.50–1.02 cm for near-fault and far-fault ground motions, respectively.
Figure 7 shows that maximum displacements occurred due to near-fault ground motions.
Variation in maximum horizontal displacements with height of European side tower for
1999 Chi-Chi, 1999 Kocaeli, and 1979 Imperial Valley earthquake ground motions is
shown in Fig. 8. It can be seen from Fig. 8 that the horizontal displacements increase along
the height of the tower and that those corresponding to near-fault ground motion are the
highest.
Figure 9 points out the maximum internal forces such as bending moment, shear forces,
and axial forces of the European side tower corresponding to the considering earthquake
ground motions. It can be seen from Fig. 9 that all internal forces are the highest for the
near-fault ground motions. Maximum bending moments occurred at the base of the tower
for both near-fault and far-fault ground motions. The axial forces are nearly equal along the
height of the tower, but the values of the shear forces are variable and maximum values
come into being at the base of the tower.
3.1.2 Deck responses
The time-histories of vertical displacements at the middle point of the deck for both near-
fault and far-fault ground motions of 1999 Chi-Chi, 1999 Kocaeli, and 1979 Imperial
Valley earthquakes are presented in Fig. 10. The maximum displacements on the deck
occurred as 56.1–31.9 cm, 31.2–12.0 cm, and 73.70–16.7 cm for near-fault and far-fault
ground motions, respectively. Figure 10 shows that near-fault ground motions have effect
on the deck displacements.
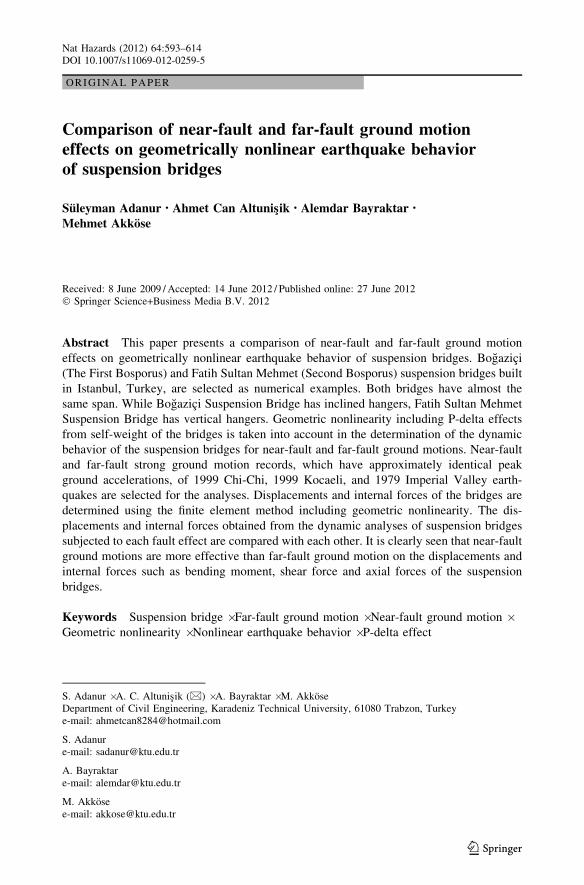
Variation in maximum displacements and bending moments along the deck for 1999
Chi-Chi, 1999 Kocaeli, and 1979 Imperial Valley earthquake ground motions is shown in
Fig. 11. It can be seen from Fig. 11 that both maximum displacement and maximum
bending moment values are obtained from the near-fault ground motion.
3.2 Earthquake response of Fatih Sultan Mehmet (Second Bosporus) suspension bridge
The Fatih Sultan Mehmet (Second Bosporus) suspension bridge (Fig. 12) (http://www.oib.
gov.tr/portfoy/fatih_koprusu.htm) also connecting the Europe and Asia Continents in
Istanbul, Turkey, has a box girder deck with 39.4 m wide overall and 1,090 m long. There
are no side spans and the steel towers rise 110 m above the ground level. The hangers are
Table 3 Material and section properties of the elements of Bogazici Bridge
Elements Material properties
Modulus of elasticity(kN/m2)
Poisson’s ratio(–)
Section areas(m2)
Inertia moment(m4)
Towers 2.05E8 0.30 1.360 9.0000
Deck 2.05E8 0.30 0.851 1.2380
Main cable 1.93E8 0.30 0.410 0.0133
Side span cable 1.93E8 0.30 0.438 0.0153
Hanger 1.62E8 0.30 0.0042 –
602 Nat Hazards (2012) 64:593–614
123

Near-fault Far-fault
0 20 40Time (s)
-6
-3
0
3
6
Dis
plac
emen
t (cm
)
Max=5.5 (cm)
0 20 40Time (s)
-6
-3
0
3
6
Dis
plac
emen
t (cm
)
Max=1.02 (cm)
0 20 40 60 80 100Time (s)
-4
-2
0
2
4(a)
(b)
(c)
Dis
plac
emen
t (cm
)
Max=3.4 (cm)
0 20 40 60 80 100Time (s)
-4
-2
0
2
4
Dis
plac
emen
t (cm
)
Max=1.8 (cm)
0 10 20 30Time (s)
-3
-2
0
2
3
Dis
plac
emen
t (cm
)
Max=2.2 (cm)
0 20 40 60 80Time (s)
-3
-2
0
2
3D
ispl
acem
ent (
cm)
Max=0.95 (cm)
Fig. 7 Time-histories of horizontal displacements at the top of the European side tower of Bogazicisuspension bridge. a Time-histories of horizontal displacements for 1999 Chi-Chi earthquake. b Time-histories of horizontal displacements for 1999 Kocaeli earthquake. c Time-histories of horizontaldisplacements for 1979 Imperial Valley earthquake
Nat Hazards (2012) 64:593–614 603
123

0 2 4 6
Displacement (cm)
0
50
100
150
200(a) (b) (c)
Hei
ght
(m)
0 2 4 6
Displacement (cm)
0
50
100
150
200
Hei
ght
(m)
0 2 4 6
Displacement (cm)
0
50
100
150
200
Hei
ght
(m)
Near-Fault Far-Fault
Fig. 8 Maximum horizontal displacements along the height of European side tower of Bogazici suspensionbridge. a 1999 Chi-Chi, b 1999 Kocaeli, c 1979 Imperial Valley
Near-Fault Far-Fault
0 5000 10000 15000
Bending moment (kNm)
0
50
100
150
20(a)
(b)
(c)
0
Tow
er h
eigh
t (m
)
0 5000 10000 15000
Bending moment (kNm)
0
50
100
150
200
Tow
er h
eigh
t (m
)
0 5000 10000 15000
Bending moment (kNm)
0
50
100
150
200
Tow
er h
eigh
t (m
)
0 50 100 150 200
Shear force (kN)
0
50
100
150
200
Tow
er h
eigh
t (m
)
0 50 100 150 200
Shear force (kN)
0
50
100
150
200
Tow
er h
eigh
t (m
)
0 50 100 150 200
Shear force (kN)
0
50
100
150
200
Tow
er h
eigh
t (m
)
0 5000 10000 15000
Axial force (kN)
0
50
100
150
200
Tow
er h
eigh
t (m
)
0 5000 10000 15000
Axial force (kN)
0
50
100
150
200
Tow
er h
eigh
t (m
)
0 5000 10000 15000
Axial force (kN)
0
50
100
150
200
Tow
er h
eigh
t (m
)
1999 Chi-Chi 1999 Kocaeli 1979 Imperial Valley
1999 Chi-Chi 1999 Kocaeli 1979 Imperial Valley
1999 Chi-Chi 1999 Kocaeli 1979 Imperial Valley
Fig. 9 Maximum bending moments (a), shear forces (b), and axial forces (c) at the European side tower ofBogazici suspension bridge
604 Nat Hazards (2012) 64:593–614
123

Near-fault Far-fault
0 20 40 60 80 100
Time (s)
-60
-30
0
30
6(a)
(b)
(c)
0
Dis
plac
emen
t (cm
)
Max=56.1 (cm)
0 20 40 60 80 100
Time (s)
-60
-30
0
30
60
Dis
plac
emen
t (cm
)
Max=31.9 (cm)
0 10 20 30
Time (s)
-40
-20
0
20
40
Dis
plac
emen
t (cm
)
Max=31.2 (cm)
0 20 40 60 80
Time (s)
-40
-20
0
20
40D
ispl
acem
ent (
cm)
Max=12.0 (cm)
0 10 20 30 40Time (s)
-80
-40
0
40
80
Dis
plac
emen
t (cm
)
Max=73.7 (cm)
0 10 20 30 40Time (s)
-80
-40
0
40
80
Dis
plac
emen
t (cm
)
Max=16.7 (cm)
Fig. 10 Time-histories of vertical displacements on the deck of Bogazici suspension bridge. a Time-histories of vertical displacements for 1999 Chi-Chi earthquake. b Time-histories of vertical displacementsfor 1999 Kocaeli earthquake. c Time-histories of vertical displacements for 1979 Imperial Valley earthquake
Nat Hazards (2012) 64:593–614 605
123
vertical and connected to the deck and cable with singly hinged bearing. The horizontal
distance between the cables is 33.8 m and the roadway is 28 m wide, accommodating two
four-lane highways. The roadway at the mid-span of the bridge is approximately 64 m
above the sea level.
The 2D finite element model of the bridge with 144 nodal points, 142 beam elements,
60 truss elements is used in the analyses. The finite element model of the bridge has 418
degrees of freedom (Fig. 13). The material and section properties of the elements used in
the finite element model are given in Table 4.
3.2.1 Tower responses
Time-histories of horizontal displacements at the top point of European side tower of Fatih
Sultan Mehmet suspension bridge obtained from nonlinear analysis for near-fault and far-
fault ground motions of 1999 Chi-Chi, 1999 Kocaeli, and 1979 Imperial Valley earth-
quakes are presented in Fig. 14. The maximum displacements on the tower occurred as
Near-Fault Far-Fault
-600 -400 -200 0 200 400 600
-80
-60
-40
-20
0
(a)
(b)
(c)
Dis
plac
emen
t (cm
)
-600 -400 -200 0 200 400 600
0
5000
10000
15000
20000
Ben
ding
mom
ent (
kNm
)
-600 -400 -200 0 200 400 600
Bridge Span (m)
-80
-60
-40
-20
0
Dis
plac
emen
t (cm
)
-600 -400 -200 0 200 400 600
Bridge Span (m)
Bridge Span (m) Bridge Span (m)
0
5000
10000
15000
20000
Ben
ding
mom
ent (
kNm
)
-600 -400 -200 0 200 400 600
Bridge Span (m)
-80
-60
-40
-20
0
Dis
plac
emen
t (cm
)
-600 -400 -200 0 200 400 600
Bridge Span (m)
0
5000
10000
15000
20000
Ben
ding
mom
ent (
kNm
)
Fig. 11 Dynamic response values of Bogazici suspension bridge deck. a Displacement and bendingmoment subjected to 1999 Chi-Chi earthquake. b Displacement and bending moment subjected to 1999Kocaeli earthquake. c Displacement and bending moment subjected to 1979 Imperial Valley earthquake
606 Nat Hazards (2012) 64:593–614
123

Fig. 12 Picture of Fatih Sultan Mehmet (Second Bosporus) Suspension Bridge (http://www.oib.gov.tr/portfoy/fatih_koprusu.htm)
Fig. 13 2D finite element model of Fatih Sultan Mehmet (Second Bosporus) suspension bridges subjectedto vertical ground motions
Table 4 Material and section properties of the elements of Fatih Sultan Mehmet Bridge
Element Material properties
Modulus of elasticity(kN/m2)
Poisson’s ratio(–)
Section areas(m2)
Inertia moment(m4)
Towers 2.05E8 0.30 2.68 6.4100
Deck 2.05E8 0.30 1.26 1.7300
Main cable 1.93E8 0.30 0.7333 0.0428
Side span cable 1.93E8 0.30 0.7835 0.0488
Hanger 1.62E8 0.30 0.0181 –
Nat Hazards (2012) 64:593–614 607
123

Near-fault Far-fault
0 20 40 60 80 100
Time (s)
-4
-2
0
2
4(a)
(b)
(c)
Dis
plac
emen
t (cm
)
Max=3.2 (cm)
0 20 40 60 80 100
Time (s)
-4
-2
0
2
4
Dis
plac
emen
t (cm
)
Max=2.2 (cm)
0 10 20 30
Time (s)
-3
-2
0
2
3
Dis
plac
emen
t (cm
)
Max=1.8 (cm)
0 20 40 60 80
Time (s)
-3
-2
0
2
3D
ispl
acem
ent (
cm)
Max=0.71 (cm)
0 20 40
Time (s)
-6
-3
0
3
6
Dis
plac
emen
t (cm
)
Max=5.0 (cm)
0 20 40
Time (s)
-6
-3
0
3
6
Dis
plac
emen
t (cm
)
Max=0.89 (cm)
Fig. 14 Time-histories of horizontal displacements at the top of the European side tower of Fatih SultanMehmet suspension bridge. a Time-histories of horizontal displacements for 1999 Chi-Chi earthquake.b Time-histories of horizontal displacements for 1999 Kocaeli earthquake. c Time-histories of horizontaldisplacements for 1979 Imperial Valley earthquake
608 Nat Hazards (2012) 64:593–614
123

Near-Fault Far-Fault
0 1 2 3 4 5
Displacement (cm)
0
50
100
150(a) (b) (c)H
eigh
t (m
)
0 1 2 3 4 5
Displacement (cm)
0
50
100
150
Hei
ght (
m)
0 1 2 3 4 5
Displacement (cm)
0
50
100
150
Hei
ght (
m)
Fig. 15 Maximum horizontal displacements along the height of European side tower of Fatih SultanMehmet suspension bridge. a 1999 Chi-Chi, b 1999 Kocaeli, c 1979 Imperial Valley
Near-Fault Far-Fault
0 10000 20000
Bending moment (kNm)
0
50
100
(a)
(b)
(c)
150
Tow
er h
eigh
t (m
)
0 10000 20000
Bending moment (kNm)
0
50
100
150
Tow
er h
eigh
t (m
)
0 10000 20000
Bending moment (kNm)
0
50
100
150
Tow
er h
eigh
t (m
)
1999 Chi-Chi 1999 Kocaeli 1979 Imperial Valley
0 100 200 300
Shear force (kN)
0
50
100
150
Tow
er h
eigh
t (m
)
0 100 200 300
Shear force (kN)
0
50
100
150
Tow
er h
eigh
t (m
)
0 100 200 300
Shear force (kN)
0
50
100
150
Tow
er h
eigh
t (m
)
1999 Chi-Chi 1999 Kocaeli 1979 Imperial Valley
1999 Chi-Chi 1999 Kocaeli 1979 Imperial Valley
0 12500 25000
Axial force (kN)
0
50
100
150
Tow
er h
eigh
t (m
)
0 12500 25000
Axial force (kN)
0
50
100
150
Tow
er h
eigh
t (m
)
0 12500 25000
Axial force (kN)
0
50
100
150
Tow
er h
eigh
t (m
)
Fig. 16 Maximum bending moments (a), shear forces (b), and axial forces (c) at the European side tower ofFatih Sultan Mehmet suspension bridge
Nat Hazards (2012) 64:593–614 609
123

Near-fault Far-fault
0 20 40 60 80 100
Time (s)
-60
-30
0
30
(a)
(b)
(c)
60
Dis
plac
emen
t (cm
)
Max=59.3 (cm)
0 20 40 60 80 100
Time (s)
-60
-30
0
30
60
Dis
plac
emen
t (cm
)
Max=35.6 (cm)
0 10 20 30
Time (s)
-40
-20
0
20
40
Dis
plac
emen
t (cm
)
Max=34.9 (cm)
0 20 40 60 80
Time (s)
-40
-20
0
20
40D
ispl
acem
ent (
cm)
Max=13.2 (cm)
0 10 20 30 40Time (s)
-100
-50
0
50
100
Dis
plac
emen
t (cm
)
Max=91.5 (cm)
0 10 20 30 40Time (s)
-100
-50
0
50
100
Dis
plac
emen
t (cm
)
Max=15.2 (cm)
Fig. 17 Time-histories of vertical displacements on deck of Fatih Sultan Mehmet suspension bridge.a Time-histories of vertical displacements for 1999 Chi-Chi earthquake. b Time-histories of verticaldisplacements for 1999 Kocaeli earthquake. c Time-histories of vertical displacements for 1979 ImperialValley earthquake
610 Nat Hazards (2012) 64:593–614
123

3.2–2.2 cm, 1.8–0.71 cm, and 5.0–0.89 cm for near-fault and far-fault ground motions,
respectively. Figure 14 shows that maximum displacements occurred due to near-fault
ground motions.
Variation in maximum horizontal displacements with height of European side tower for
1999 Chi-Chi, 1999 Kocaeli, and 1979 Imperial Valley earthquake ground motions is
shown in Fig. 15. It can be seen from Fig. 15 that the horizontal displacements increase
along the height of the tower and that those corresponding to near-fault ground motion are
the highest.
Figure 16 points out the maximum internal forces such as bending moment, shear
forces, and axial forces of the European side tower corresponding to all earthquake ground
motions. It can be seen from Fig. 16 that all internal forces are the highest for the near-fault
ground motion. The values of the axial forces are nearly equal along the height of the
tower, but the values of the shear forces are variable and maximum values come into being
Near-Fault Far-Fault
-600 -400 -200 0 200 400 600
-80
-60
-40
-20
0
(a)
(b)
(c)
Dis
plac
emen
t (cm
)
-600 -400 -200 0 200 400 600
0
10000
20000
30000
Ben
ding
mom
ent (
kNm
)
-600 -400 -200 0 200 400 600
-80
-60
-40
-20
0
Dis
plac
emen
t (cm
)
-600 -400 -200 0 200 400 600
0
10000
20000
30000
Ben
ding
mom
ent (
kNm
)
-600 -400 -200 0 200 400 600
Bridge Span (m) Bridge Span (m)
Bridge Span (m) Bridge Span (m)
Bridge Span (m) Bridge Span (m)
-100
-80
-60
-40
-20
0
Dis
plac
emen
t (cm
)
-600 -400 -200 0 200 400 600
0
10000
20000
30000
Ben
ding
mom
ent (
kNm
)
Fig. 18 Dynamic response values of Fatih Sultan Mehmet suspension bridge deck. a Displacement andbending moment subjected to 1999 Chi-Chi earthquake. b Displacement and bending moment subjected to1999 Kocaeli earthquake. c Displacement and bending moment subjected to 1979 Imperial Valleyearthquake
Nat Hazards (2012) 64:593–614 611
123
at the base of the tower. Also, maximum bending moments occurred at the base of the
tower for both near-fault and far-fault ground motion records.
3.2.2 Deck responses
The time-histories of vertical displacements at the middle point of the deck for both near-
fault and far-fault ground motions of 1999 Chi-Chi, 1999 Kocaeli, and 1979 Imperial
Valley earthquakes are presented in Fig. 17. The maximum displacements on the deck
occurred as 59.3–35.6 cm, 34.9–13.2 cm, and 91.5–15.2 cm for near-fault and far-fault
ground motions, respectively. Figure 17 shows that near-fault ground motions have effect
on the deck displacements.
Variation in displacements and bending moments along the deck for 1999 Chi-Chi,
1999 Kocaeli, and 1979 Imperial Valley earthquake ground motions is shown in Fig. 18. It
can be seen from Fig. 18 that both maximum displacements and maximum bending
moment values occurred under the near-fault ground motion records.
4 Conclusions
This paper presents a comparison of near-fault and far-fault ground motion effects on
geometrically nonlinear earthquake behavior of suspension bridges. Bogazici (The First
Bosporus) and Fatih Sultan Mehmet (Second Bosporus) suspension bridges built in
Istanbul, Turkey, are selected as numerical examples. Geometric nonlinearity including
P-delta effects from self-weight of the bridges is considered in the determination of the
dynamic behavior of the suspension bridges for near-fault and far-fault ground motions.
While displacements along the height of the tower have an increasing trend, bending
moments have a decreasing trend for both suspension bridges. In addition to these, axial
forces are nearly constant along the tower, but shear forces values are variable. Along the
suspension deck, maximum bending moments occurred at the middle point of the deck but
maximum displacements are variable for Bogazici and Fatih Sultan Mehmet suspension
bridges.
The performed geometric nonlinear analyses showed that near-fault ground motion is
rather effective on the displacements and internal forces in the suspension bridges. The
maximum displacements and maximum internal forces from the suspension bridges
obtained for near-fault ground motion are effective than those for far-fault ground motion.
It should be clarified that the near-fault ground motion effects appear along the duration of
earthquake. It is also seen that maximum displacements and internal forces have not
occurred when near-fault ground motions have peak acceleration value.
According to this study, near-fault earthquake ground motion has remarkable effects on
the geometric nonlinear response of suspension bridges. In the next studies related to
earthquake responses of engineering structures such as suspension bridges, near-fault
ground motion effects should be taken into account to obtain more realistic results.
References
Abdel-Ghaffar AM (1976) Dynamic analyses of suspension bridge structures. EERL 76-01, CaliforniaInstitute of Technology, Pasadena
Abdel-Ghaffar AM (1980) Vertical vibration analysis of suspension bridges. J Struct Div 106:2053–2074
612 Nat Hazards (2012) 64:593–614
123

Abdel-Ghaffar AM, Rubin LI (1982) Suspension bridge response to multiple-support excitations. J EngMech 108:419–435
Abdel-Ghaffar AM, Rubin LI (1983a) Nonlinear free vibrations of suspension bridges. J Eng Mech109:313–345
Abdel-Ghaffar AM, Rubin LI (1983b) Vertical seismic behaviour of suspension bridges. Earthq Eng StructDyn 11:1–19
Abdel-Ghaffar AM, Stringfellow RG (1984) Response of suspension bridges to travelling earthquakeexcitations. Soil Dyn Earthq Eng 3:62–81
Adanur S (2003) Geometrically nonlinear deterministic and stochastic analyses of suspension bridges tomultiple support seismic excitations. PhD Thesis, Karadeniz Technical University, Trabzon
Agrawal AK, He WL (2002) A closed-form approximation of near-fault ground motion pulses for flexiblestructures. In: 15th ASCE engineering mechanics conference, New York
Akkar S, Yazgan U, Gulkan P (2005) Drift estimates in frame buildings subjected to near-fault groundmotions. J Struct Eng ASCE 131:1014–1024
Altunısık AC, Bayraktar A, Adanur S (2006) Effect of hanger shapes on the geometric nonlinear static anddynamic responses of Bosporus suspension bridge. In: 17th International congress on advances in civilengineering, Istanbul
Archuleta RJ, Hartzell SH (1981) Effect of fault finiteness on near-source ground motion. Bull Seismol SocAm 71:939–957
Bayraktar A, Altunisik AC, Sevim B, Kartal ME, Turker T (2008) Near-fault ground motion effects on thenonlinear response of dam-reservoir-foundation systems. Struct Eng Mech 28:11–42
Bray JD, Marek AR (2004) Characterization of forward-directivity ground motions in the near-fault region.Soil Dyn Earthq Eng 24:815–828
Brown WC, Parsons MF (1975) Bosporus Bridge, part 1: history of design. Proc Inst Civ Eng 1(58):505–532Brownjohn JMW (1994) Observations on non-linear dynamic characteristics of suspension bridges. Earthq
Eng Struct Dyn 23:1351–1367Brownjohn JMW, Dumanoglu AA, Severn RT (1992) Ambient vibration survey of the Fatih Sultan Mehmet
suspension bridge. Earthq Eng Struct Dyn 21:907–924Chopra AK, Chintanapakdee C (2001) Comparing response of SDF systems to near-fault and far-fault
earthquake motions in the context of spectral regions. Earthq Eng Struct Dyn 30:1769–1789Corigliano M, Lai CG, Barla G (2006) Seismic response of rock tunnels in near-fault conditions. In: 1st
European conference on earthquake engineering and seismology, SwitzerlandDicleli M, Buddaram S (2007) Equivalent linear analysis of seismic-isolated bridges subjected to near-fault
ground motions with forward rupture directivity effect. Eng Struct 29:21–32Dumanoglu AA, Severn RT (1985) Asynchronous seismic analysis of modern suspension bridges. Part 1:
Free vibration, Department of Civil Engineering, University of Bristol, BristolDumanoglu AA, Severn RT (1987) Seismic response of modern suspension bridges to asynchronous vertical
ground motion. Proc Inst Civ Eng 83:701–730Dumanoglu AA, Severn RT (1989) Seismic response of modern suspension bridges to asynchronous lon-
gitudinal and lateral ground motion. Proc Inst Civ Eng 87:73–86Dumanoglu AA, Severn RT (1990) Stochastic response of suspension bridges to earthquake forces. Earthq
Eng Struct Dyn 19:133–152Dumanoglu AA, Brownjohn JMW, Severn RT, Blakeborough A (1989) Ambient vibration survey of the
bosporus suspension bridge. Earthq Eng Struct Dyn 18:263–283Dumanoglu AA, Brownjohn JMW, Severn RT (1992) Seismic analysis of the Fatih Sultan Mehmet (Second
Bosporus) Suspension Bridge. Earthq Eng Struct Dyn 21:881–906Freeman, Fox and Partners (1968) Bosporus bridge calculations. Westminster, London, S.W.IGalal K, Ghobarah A (2006) Effect of near-fault earthquakes on North American nuclear design spectra.
Nucl Eng Des 236:1928–1936Ghahari F, Jahankhah H, Ghannad MA (2006) The effect of background record on response of structures
subjected to near-fault ground motions. In: 1st European conference on earthquake engineering andseismology, Switzerland
Hall JF, Heaton TH, Halling MW, Wald DJ (1995) Near-source ground motion and its effects on flexiblebuildings. Earthq Spectra 11:569–605
Harichandran RS, Hawwari A, Sweiden BN (1996) Response of long-span bridges to spatially varyingground motion. J Struct Eng 122:476–484
Hyun CH, Yun CB, Lee DG (1992) Nonstationary response analysis of suspension bridges for multiplesupport excitations. Prob Eng Mech 7:27–35
Liao WI, Loh CH, Lee BH (2004) Comparison of dynamic response of isolated and non-isolated continuousgirder bridges subjected to near-fault ground motions. Eng Struct 26:2173–2183
Nat Hazards (2012) 64:593–614 613
123
Malhotra PK (1999) Response of buildings to near-fault pulse-like ground motions. Earthq Eng Struct Dyn28:1309–1326
Megawati K, Higashihara H, Koketsu K (2001) Derivation of near-source ground motions of the 1995 Kobe(Hyogo-ken Nanbu) earthquake from vibration records of the Akashi Kaikyo Bridge and its impli-cations. Eng Struct 23:1256–1268
Nakamura Y, Der Kiureghian A, Liu D (1993) Multiple-support response spectrum analysis of the GoldenGate Bridge. Report No. UCB/EERC-93/05, Berkeley (CA), Earthquake Engineering Research Center,College of Engineering, University of California
Ohmachi T, Jalali A (1999) Fundamental study on near-fault effects on earthquake response of arch dams.Earthq Eng Eng Seismol 1:1–11
PEER (2008) http://peer.berkeley.edu/smcat/data. Accessed 13 March 2008Pulido N, Kubo T (2004) Near-fault strong motion complexity of the 2000 Tottori earthquake (Japan) from a
broadband source asperity model. Tectonophysics 390:177–192Rao BP, Jangid RS (2001) Performance of sliding systems under near-fault motions. Nucl Eng Des
203:259–272Rassem M, Ghobarah A, Heidebrecht AC (1996) Site effects on the seismic response of a suspension bridge.
Eng Struct 18:363–370SAP2000 (1998) Integrated finite element analysis and design of structures. Computers and Structures Inc.,
BerkeleySomerville PG (2003) Magnitude scaling of the near fault rupture directivity pulse. Phys Earth Planet Int
137:201–212Wang J, Hu S, Wei X (1999) Effects of engineering geological condition on response of suspension bridges.
Soil Dyn Earthq Eng 18:297–304Wang GQ, Zhou XY, Zhang PZ, Igel H (2002) Characteristics of amplitude and duration for near fault
strong ground motion from the 1999 Chi-Chi, Taiwan earthquake. Soil Dyn Earthq Eng 22:73–96Zhang YH, Lin JH, Williams FW, Li QS (2005) Wave passage effect of seismic ground motions on the
response of multiply supported structures. Struct Eng Mech 20:655–672
614 Nat Hazards (2012) 64:593–614
123