Embed Size (px)
Citation preview
Brigham Young University Brigham Young University
BYU ScholarsArchive BYU ScholarsArchive
Theses and Dissertations
2008-07-18
Comparison of Guided and Open Inquiry Instruction in a High Comparison of Guided and Open Inquiry Instruction in a High
School Physics Classroom School Physics Classroom
Brett M. Guisti Brigham Young University - Provo
Follow this and additional works at: https://scholarsarchive.byu.edu/etd
Part of the Educational Methods Commons
BYU ScholarsArchive Citation BYU ScholarsArchive Citation Guisti, Brett M., "Comparison of Guided and Open Inquiry Instruction in a High School Physics Classroom" (2008). Theses and Dissertations. 1485. https://scholarsarchive.byu.edu/etd/1485
This Thesis is brought to you for free and open access by BYU ScholarsArchive. It has been accepted for inclusion in Theses and Dissertations by an authorized administrator of BYU ScholarsArchive. For more information, please contact [email protected], [email protected].
COMPARISON OF GUIDED AND OPEN INQUIRY INSTRUCTION
IN A HIGH SCHOOL PHYSICS CLASSROOM
by
Brett M. Guisti
A thesis submitted to the faculty of
Brigham Young University
in partial fulfillment of the requirements for the degree of
Master of Science
School of Technology
Brigham Young University
August 2008


BRIGHAM YOUNG UNIVERSITY
GRADUATE COMMITTEE APPROVAL
of a thesis submitted by
Brett M. Guisti This thesis has been read by each member of the following graduate committee and by majority vote has been found to be satisfactory. Date Steven L. Shumway, Chair
Date Ronald E. Terry
Date Jean-François S. Van Huele

BRIGHAM YOUNG UNIVERSITY As chair of the candidate’s graduate committee, I have read the thesis of Brett M. Guisti in its final form and have found that (1) its format, citations, and bibliographical style are consistent and acceptable and fulfill university and department style requirements; (2) its illustrative materials including figures, tables, and charts are in place; and (3) the final manuscript is satisfactory to the graduate committee and is ready for submission to the university library. Date Steven L. Shumway
Chair, Graduate Committee
Accepted for the School
Barry M. Lunt Graduate Coordinator
Accepted for the College
Alan R. Parkinson Dean, Ira A. Fulton College of Engineering and Technology

ABSTRACT
COMPARISON OF GUIDED AND OPEN INQUIRY INSTRUCTION
IN A HIGH SCHOOL PHYSICS CLASSROOM
Brett M. Guisti
School of Technology
Master of Science
This study compared two levels of inquiry in high school physics classrooms over
a year-long course. One class fit well the definition of guided-inquiry and the other
matched common descriptions of open-inquiry. Four sections of introductory physics at
Lone Peak High School in Highland, Utah were randomly divided into two sections for
each treatment. The majority of students in all classes were sophomores with relatively
few juniors and seniors. The guided-inquiry classes followed the Modeling Instruction
Program developed at Arizona State University, while the open-inquiry classes were be
based on an approach used by Wolff-Michael Roth, at the University of Victoria, British
Colombia.
The independent variable in this study was the level of inquiry of the high school
physics class. The dependent variables of interest were the students’ short-term and long-

term understanding of introductory physics concepts as well as the student’s attitudes
towards physics. The Force Concept Inventory (FCI) and the Utah State Criterion
Referenced Physics Test (CRT) were used to judge learning of physics concepts and the
Colorado Learning Attitudes about Science Survey (CLASS) was used to analyze
changes in views towards physics.
FCI results showed no statistically significant differences in short-term or long-
term mean scores between the two treatments. Small practical significance was found in
the greater short-term mean gain scores of the guided-inquiry class with an effect size of
.34. The CRT showed the open-inquiry class to have a higher mean score that was
slightly statistically significant (p-value of .049) and at a medium level of practical
significance with an effect size of .43. A curious result arose when comparing the scores
on each of the FCI posttests. The open-inquiry treatment had a higher increase in average
gain score that was found to have statistical significance with a p-value of .010 as well as
practical significance in the medium range with an effect size of .57.
Both treatments were found to have somewhat unfavorable effects on students’
opinions towards physics. Additionally, the open-inquiry treatment had a more
polarizing effect on the attitudes of students towards physics. Open-inquiry students
responded particularly positively on questions addressing “Problem Solving.” For the
open-inquiry students, positive shifts were strongest in questions addressing “Real World
Connections” and “Personal Interest.”


ACKNOWLEDGMENTS
I wish to express appreciation to those who have helped in the completion of this
thesis. My committee members Dr. Steve Shumway, Dr. Ron Terry, and Dr. Jean-
François Van Huele gave many hours in their guidance and feedback throughout the
writing process. Duane Merrell was an indispensable asset not only in the inception of
this project but also in supporting me in the actual teaching of my classes. Dr. Jared
Berrett was also a major influence in shaping my research interests.
Thanks is due to my students at Lone Peak High School for enduring the
experience of being my guinea pigs for an entire year. Tom Erekson and Wade Tischner
were also valuable sources of support and feedback throughout the project.
Lastly I would like to thank my family for their support in my pursuit of a
master’s degree. I am particularly appreciative of my wife, Lindsey, who gave countless
hours to corralling our boys, Dallin and Luke, so that I could be free to write. Maybe
even more admirable is the patience she showed in listening to me talk incessantly about
physics education. Thank you for all that you sacrifice for me.


vii
TABLE OF CONTENTS
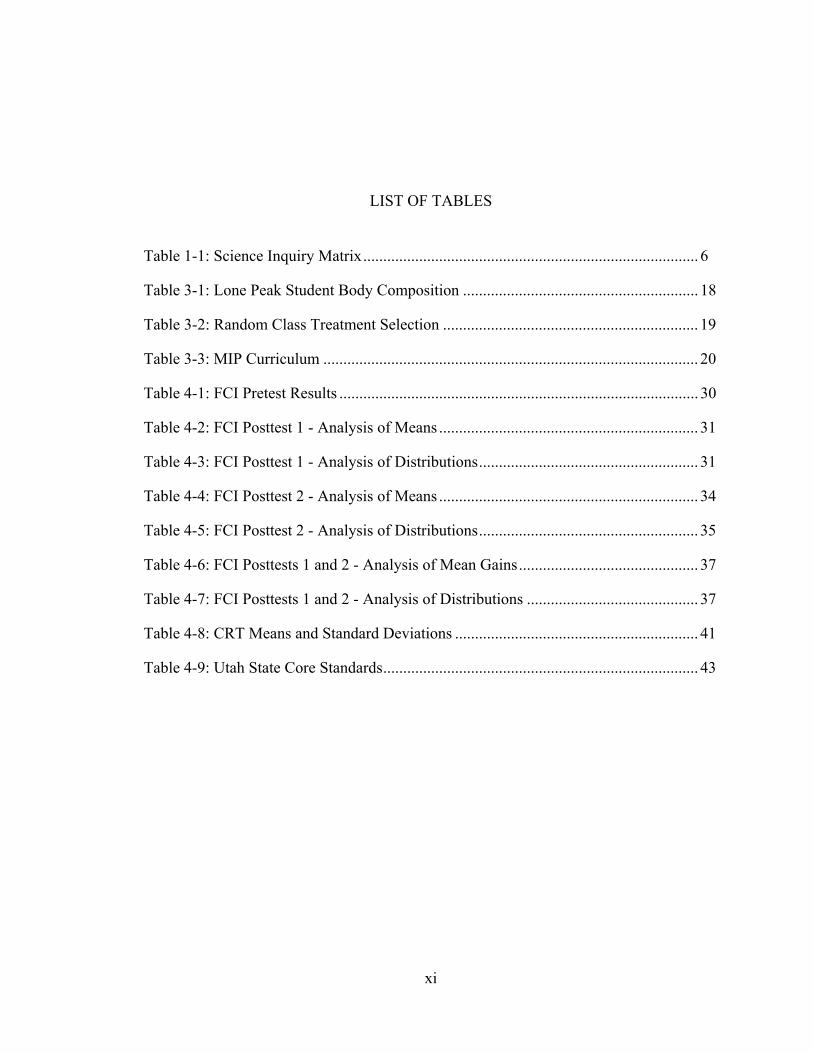
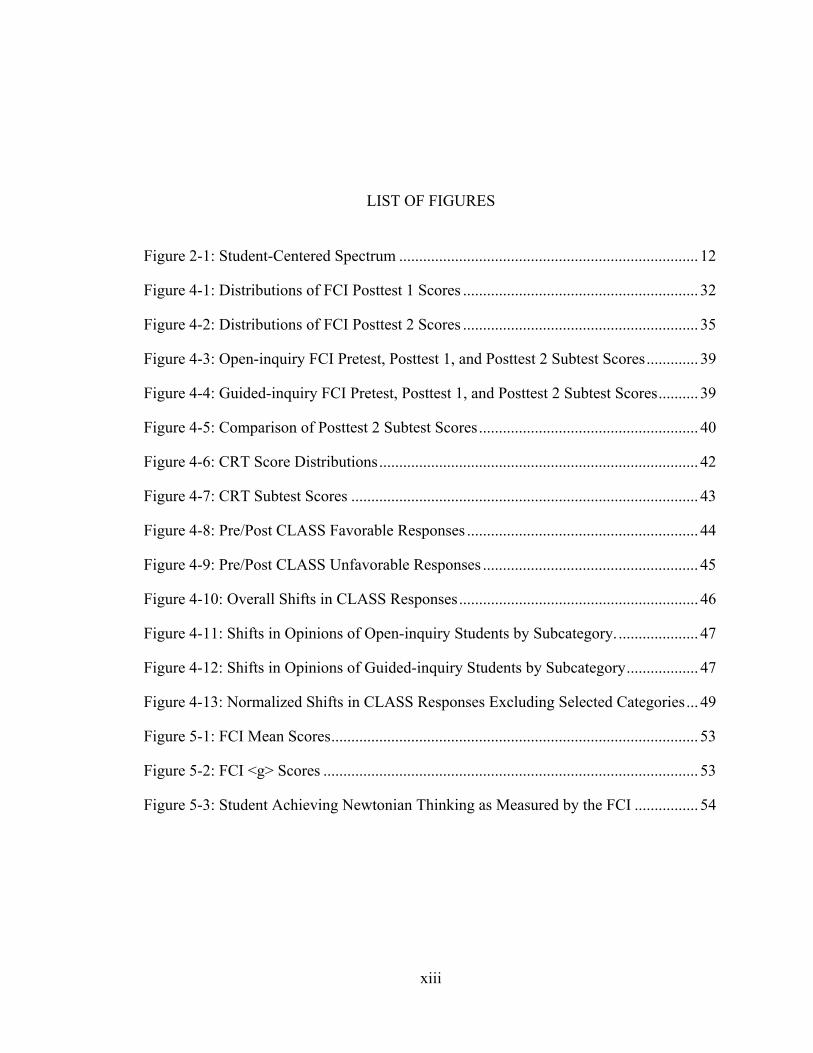
LIST OF TABLES ........................................................................................................... xi
LIST OF FIGURES ....................................................................................................... xiii
1 Introduction ............................................................................................................... 1
1.1 Competing Philosophies ..................................................................................... 1
1.2 Current State of the Debate ................................................................................. 3
1.3 A Direction for Student-Centered Research ....................................................... 4
1.4 Statement of the Problem .................................................................................... 7
1.5 Research Questions ............................................................................................. 8
2 Review of Literature ................................................................................................. 9
2.1 History of Student-Centered Teaching ............................................................... 9
2.2 Inquiry-Based Science ...................................................................................... 11
3 Methodology ............................................................................................................ 17
3.1 Purpose .............................................................................................................. 17
3.2 Classroom Contexts .......................................................................................... 17
3.3 Research Design ............................................................................................... 18
3.3.1 Guided Inquiry Classroom ............................................................................ 19
3.3.2 Open Inquiry Classroom ............................................................................... 21

viii
3.4 Data and Instrumentation .................................................................................. 24
3.5 Analysis of Data ................................................................................................ 25
4 Findings .................................................................................................................... 29
4.1 FCI Results – Measure of conceptual understanding of force and motion ....... 29
4.1.1 Pretest ............................................................................................................ 29
4.1.2 Posttest 1 ....................................................................................................... 30
Raw Scores .................................................................................................... 30
Raw Gain Scores ........................................................................................... 32
Normalized Gain Scores ............................................................................... 33
4.1.3 Posttest 2 ....................................................................................................... 33
Raw Scores .................................................................................................... 34
Raw Gain Scores ........................................................................................... 36
Normalized Gain Scores ............................................................................... 36
4.1.4 Comparing Posttests 1 and 2 ......................................................................... 36
Raw Gain Scores ........................................................................................... 36
Normalized Gain Scores ............................................................................... 38
4.1.5 FCI Subtests .................................................................................................. 38
4.2 CRT Results – State core test of physics knowledge ........................................ 40
4.2.1 Mean Scores .................................................................................................. 41
4.2.2 Subtests ......................................................................................................... 42
4.3 CLASS Results – Physics Attitudes Survey ..................................................... 43
5 Conclusions .............................................................................................................. 51
5.1 Conclusions Relevant to Research Question 1 ................................................. 51
5.2 Conclusions Relevant to Research Question 2 ................................................. 55

ix
5.3 Comparing with Previous Research .................................................................. 56
5.4 Observations ..................................................................................................... 57
5.5 Internal Validity Issues ..................................................................................... 57
5.6 Recommendations ............................................................................................. 58
References ........................................................................................................................ 61
Appendix A. MIP Lab Sample ................................................................................. 67
Appendix B. MIP Lab Report Instructions ............................................................ 69
Appendix C. CLASS .................................................................................................. 71
Appendix D. CLASS Expert Responses .................................................................. 75
Appendix E. CLASS Sub-Categories ...................................................................... 77
Appendix F. Physics Final Review........................................................................... 79

x
xi
LIST OF TABLES Table 1-1: Science Inquiry Matrix .................................................................................... 6
Table 3-1: Lone Peak Student Body Composition ........................................................... 18
Table 3-2: Random Class Treatment Selection ................................................................ 19
Table 3-3: MIP Curriculum .............................................................................................. 20
Table 4-1: FCI Pretest Results .......................................................................................... 30
Table 4-2: FCI Posttest 1 - Analysis of Means ................................................................. 31
Table 4-3: FCI Posttest 1 - Analysis of Distributions ....................................................... 31
Table 4-4: FCI Posttest 2 - Analysis of Means ................................................................. 34
Table 4-5: FCI Posttest 2 - Analysis of Distributions ....................................................... 35
Table 4-6: FCI Posttests 1 and 2 - Analysis of Mean Gains ............................................. 37
Table 4-7: FCI Posttests 1 and 2 - Analysis of Distributions ........................................... 37
Table 4-8: CRT Means and Standard Deviations ............................................................. 41
Table 4-9: Utah State Core Standards ............................................................................... 43

xii
xiii
LIST OF FIGURES Figure 2-1: Student-Centered Spectrum ........................................................................... 12
Figure 4-1: Distributions of FCI Posttest 1 Scores ........................................................... 32
Figure 4-2: Distributions of FCI Posttest 2 Scores ........................................................... 35
Figure 4-3: Open-inquiry FCI Pretest, Posttest 1, and Posttest 2 Subtest Scores ............. 39
Figure 4-4: Guided-inquiry FCI Pretest, Posttest 1, and Posttest 2 Subtest Scores .......... 39
Figure 4-5: Comparison of Posttest 2 Subtest Scores ....................................................... 40
Figure 4-6: CRT Score Distributions ................................................................................ 42
Figure 4-7: CRT Subtest Scores ....................................................................................... 43
Figure 4-8: Pre/Post CLASS Favorable Responses .......................................................... 44
Figure 4-9: Pre/Post CLASS Unfavorable Responses ...................................................... 45
Figure 4-10: Overall Shifts in CLASS Responses ............................................................ 46
Figure 4-11: Shifts in Opinions of Open-inquiry Students by Subcategory. .................... 47
Figure 4-12: Shifts in Opinions of Guided-inquiry Students by Subcategory .................. 47
Figure 4-13: Normalized Shifts in CLASS Responses Excluding Selected Categories ... 49
Figure 5-1: FCI Mean Scores ............................................................................................ 53
Figure 5-2: FCI <g> Scores .............................................................................................. 53
Figure 5-3: Student Achieving Newtonian Thinking as Measured by the FCI ................ 54

xiv

1
1 Introduction
This study was primarily motivated by a desire to improve the teaching in my
classroom. Incorporating that desire with a thesis gave me extra motivation and support
to approach teaching high school physics in way (open-inquiry) novel and largely foreign
to me, as well as to formalize a study of the outcomes. While I wanted all of my students
to succeed, I was also hoping that my new approach would achieve equal if not superior
results while giving students a more autonomous experience. As this study constitutes
action research, the researcher and the instructor were one in the same.
1.1 Competing Philosophies
While each educational movement has its particularities, one can generalize most
reform efforts of the past several decades to a struggle between teacher-centered and
student-centered approaches (Chall, 2000; Fielding et al., 1983; Kirschner et al., 2006;
Mayer, 2004). This line of demarcation between educational philosophies is evident in
myriad terminologies applied to educational methods. Kirschner et al. (2006) defined the
rift in terms of the amount of structure or guidance present in the classroom:
On one side of this argument are those advocating the hypothesis that people learn best in an unguided or minimally guided environment, generally defined as one in which learners, rather than being presented with essential information, must discover or construct essential information for themselves (e.g., Bruner, 1961; Papert, 1980; Steffe & Gale, 1995). On the other side are those suggesting that novice learners
2
should be provided with direct instructional guidance on the concepts and procedures required by a particular discipline and should not be left to discover those procedures by themselves (e.g., Cronbach & Snow, 1977; Klahr & Nigam, 2004; Mayer, 2004; Shulman & Keisler, 1966; Sweller, 2003). (p. 75) While there are undoubtedly pros and cons to each approach, it has been proposed
that their superposition can lead to unintended circumstances. For example, Bencze
(2000) comments that, “Many educators continue to face the dilemma of wanting
students to become independent thinkers, while not being able to resist the urge to
engineer their thinking…However, such stage-managed conceptual reconstructions in the
context of investigative activities seriously compromise students’ opportunities to gain
literacy and independence” (p. 849-850). The underlying notion is that being true to an
educational philosophy can help give a classroom a sense of purpose and direction.
Teacher-centered approaches are often referred to as traditional, didactic, or direct
instruction. They stress transmission of knowledge in a manner that emphasizes training
or memorization. Costenson & Lawson (1986) described this traditional method as
“teaching centered around one fact-laden text…consist[ing] of assign, recite, test, and
then, discuss the test” (p. 150). The term “teacher-centered” comes from the role that the
teacher assumes in a traditional classroom: possessor of knowledge to be transferred to
students and principal decision maker as to how that knowledge transfer is to take place.
Teaching styles that are often referred to as student-centered include discovery,
constructivist, inquiry, experiential, and problem-based learning (Kirschner et al., 2006).
These approaches are characterized by students sharing some degree of the responsibility
for making decisions in the classroom. The teacher is often described as a partner or a
facilitator in the learning process. It is argued that learning in a student-centered
3
environment is more personally meaningful and durable as the student is a more active
participant in the learning process (Walker, 2007, p. 10). Another common claim of
student-centered teaching is that the learner ultimately decides what information he takes
in and what sense he makes of it. Mayer (2004) described this idea in reference to
constructivism, “an underlying premise is that learning is an active process in which
learners are active sense makers who seek to build coherent and organized knowledge”
(p. 14). Practices that support these student-centered approaches commonly include less-
structured activities such as open-ended projects that focus on problem solving or
analytical skills rather than mastering facts.
1.2 Current State of the Debate
After years of research conducted on each side of the philosophical debate,
groups representing student-centered and teacher-centered philosophies have claimed
evidence that their approach is the superior one (Ellis et al., 1994). A response to the
common refrain that educators do not employ research-based teaching practices could
well be, “Which ones?” This leaves today’s landscape of educational research as largely
a mélange of recycled ideas, neatly packaged and stamped with new buzz words.
Curiously, the language of student-centered teaching has become ubiquitous in
educational circles whereas the practices of the teacher-center approach appear to be a
mainstay in the classroom.
Professional, in-service, and collaborative meetings are rife with student-centered
vernacular. Examples include a U.S Department of Education study of professional
development that spoke often of “a higher-order teaching strategy” and “the use of

4
problems with no obvious solution” (Porter et al., 2000, p. ES-5). The National
Research Council suggested in their National Science Education Standards (1996) that,
“engaging students in inquiry helps develop an understanding of scientific concepts, an
appreciation of “how we know” what we know in science, an understanding of the nature
of science, skills necessary to become independent inquirers about the natural world, and
dispositions to use the skills, abilities, and attitudes associated with science” (p. 105).
While schools are not devoid of student-centered practices, traditional methods
appear to remain the prevalent approach. One study of the instructional practices of
community college instructors (Barrett et al., 2007) found 84% of the 292 participants
used predominantly teacher-centered instructional methods. Dana (2001) noted that:
During the 1980’s and 1990’s, classroom observations revealed plenty of examples of the absence of inquiry-based teaching or opportunities for higher level thinking (Maor, 1991). Teachers have retained a belief in learning through ‘transmission’ … Overall secondary science teaching has changed little in the last 40 years. Science in secondary schools is still largely fact driven and didactic. Current curricula consist of textbooks, teacher talk, and testing. (p. 7-8)
It appears that a dichotomy has arisen between educational talk and educational practice.
1.3 A Direction for Student-Centered Research
Since the teacher-centered approach has been, and continues to be the status quo
(Barrett et al., 2007; Dana, 2001; Maor, 1991), it is probable that direct instruction will
remain the dominant teaching method as long as a definitive body of research does not
come down on the side of student-centered teaching. One obstacle faced by the student-
centered advocates is how broadly terms such as inquiry and constructivism have been
applied to widely differing classrooms. These classrooms might all share common

5
theoretical underpinnings, but the practical applications ascribed to the same
philosophical motive have outcomes as varying as their teaching methods (compare
Kirschner et al., 2006, and Roth, 1994). The bifurcation all classrooms into teacher-
centered or student-centered appears to be a generalization.
Rather than looking at student-centered versus teacher-centered classrooms in an
all-inclusive manner as many researchers have done (Adams, 1997; Chomy, 1998;
Fielding et al., 1983; Hake, 1998; Kirschner et al., 2006; Mayer, 2004), student-centered
research can benefit from pinpointing the characteristics of inquiry that make it effective.
To some extent the varying degrees of student-centeredness are recognized in the
separation of inquiry into guided and open. Foos (2003) describes the common usage of
these terms thus: “At the guided inquiry end of the spectrum, the instructor states the
problem, formulates the hypothesis, and develops a working plan and the student
performs the activity, gathers the data, and draws conclusions…[At the open inquiry end
of the spectrum s]tudents state the problem, formulate the hypothesis, and develop their
own working plan” (abstract). Though looking at inquiry as guided versus open is useful,
this language is still too broad to describe accurately all types of student-centered
classrooms.
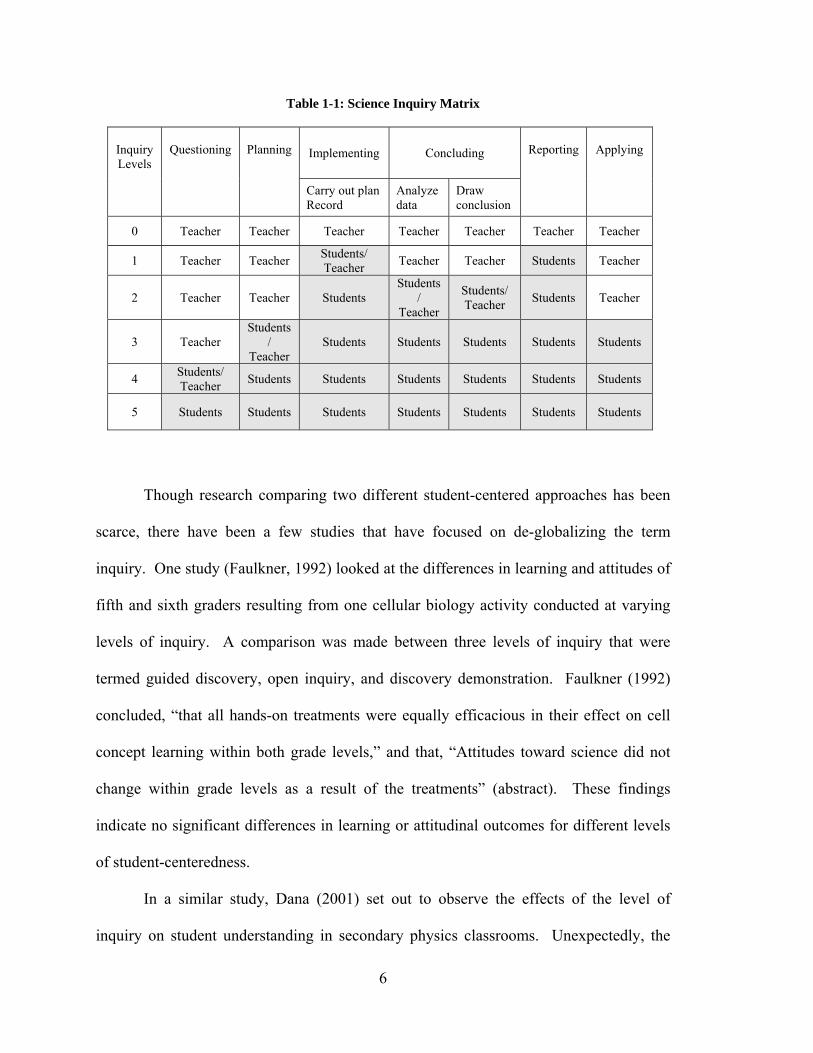
In an effort to further clarify the spectrum of student-centered classrooms, Fradd
et al. (2001) created a matrix (Table 1-1) to quantify the student-centeredness of a
classroom. The matrix allows one to identify more concisely just how much
responsibility is in the hands of the students.
6
Table 1-1: Science Inquiry Matrix
Inquiry Levels
Questioning
Planning Implementing Concluding
Reporting
Applying
Carry out plan Record
Analyze data
Draw conclusion
0 Teacher Teacher Teacher Teacher Teacher Teacher Teacher
1 Teacher Teacher Students/ Teacher Teacher Teacher Students Teacher
2 Teacher Teacher Students Students
/ Teacher
Students/ Teacher Students Teacher
3 Teacher Students
/ Teacher
Students Students Students Students Students
4 Students/ Teacher Students Students Students Students Students Students
5 Students Students Students Students Students Students Students
Though research comparing two different student-centered approaches has been
scarce, there have been a few studies that have focused on de-globalizing the term
inquiry. One study (Faulkner, 1992) looked at the differences in learning and attitudes of
fifth and sixth graders resulting from one cellular biology activity conducted at varying
levels of inquiry. A comparison was made between three levels of inquiry that were
termed guided discovery, open inquiry, and discovery demonstration. Faulkner (1992)
concluded, “that all hands-on treatments were equally efficacious in their effect on cell
concept learning within both grade levels,” and that, “Attitudes toward science did not
change within grade levels as a result of the treatments” (abstract). These findings
indicate no significant differences in learning or attitudinal outcomes for different levels
of student-centeredness.
In a similar study, Dana (2001) set out to observe the effects of the level of
inquiry on student understanding in secondary physics classrooms. Unexpectedly, the

7
teachers participating in the study all ended up using approaches on the guided-inquiry
end of the spectrum. Dana (2001) reported that the study, “demonstrated limited effects
of various levels of inquiry due to small sample size and lack of differentiation between
teacher” (p. iv). Another researcher (Roth, 1994) was successful at studying open-
inquiry in a high school physics setting by teaching the class himself. It was found to be
a successful method by primarily qualitative measures, but no attempt was made to
explicitly compare outcomes with those of any other approach.
1.4 Statement of the Problem
Disagreement persists among researchers over the efficacy of teacher-centered
and student-centered teaching approaches. As traditional teaching methods are well
ingrained in the education community, definitive evidence in favor of student-centered
approaches is likely needed for a substantial change in classroom practices to be possible.
To help define student-centered approaches more clearly and to focus related
research efforts, a few studies have looked at specific aspects of varying levels of inquiry.
But these studies have yet to look at differing levels of inquiry applied over a year-long
course. There has also been few, if any, studies comparing differing levels of inquiry
specifically in a high school setting or in the discipline of physics.
To address these issues, this study compared two levels of inquiry in high school
physics classrooms over a year-long course. The researcher was the instructor for both
treatments. The level of inquiry in one classroom was rated by five science teachers to
have an average score of 2.9 on the science inquiry matrix (Table 1-1) while the second
class was rated at an average inquiry level of 4.4. The former class fit well the definition
8
of guided-inquiry and the latter matched common descriptions of open-inquiry. The
researcher compared scored responses on conceptual, computational, and attitudinal
exams/surveys between guided and open-inquiry physics classrooms taught by the same
instructor at the same high school to evaluate differences in student performance and
attitudes.
1.5 Research Questions
1. Is there a statistically or practically significant difference in scored
responses (short-term and long-term) for students experiencing a guided-
inquiry teaching approach versus students experiencing an open-inquiry
teaching approach in a high school physics classroom?
2. Is there a difference in survey responses regarding attitudes towards
physics for students experiencing a guided-inquiry teaching approach
versus students experiencing an open-inquiry teaching approach in a high
school physics classroom?

9
2 Review of Literature
2.1 History of Student-Centered Teaching Many of the principles of a student-centered approach to education have their
roots in the philosophy of Rousseau. His work “Emile” particularly stresses the
instinctual nature of children to investigate and naturally learn from experiences with
their environment. The 19th century Swiss school teacher Johann Pestalozzi was heavily
influenced by Rousseau’s writings and set up schools following similar principles.
Pestalozzi believed in nurturing the student and placed particular importance on only
introducing new terms once adequate familiarity with the concept was achieved through
experience. The torch was picked up in the 20th century by the American educational
philosopher John Dewey. His writings sparked the progressivist school movement of the
1940’s and 50’s. While Dewey shared the sentiment that education needed to start with
the individual, he also accentuated the social nature of the educative process. While
never gaining wide acceptance, progressive schools did become quite influential before
going virtually extinct during the Cold War.
Today the most prevalent school of thought advocating student-centered ideas is a
learning theory known as constructivism. While its application in the educational setting
has obvious links to Dewey, its epistemological underpinnings are closely tied to the
work of Jean Piaget where “what we call knowledge does not and cannot have the

10
purpose of producing representations of an independent reality, but instead has an
adaptive function” (von Glaserfeld, 2005, p. 3). The very existence of knowledge then is
determined by the meaning that the learner is able to construct from his experiences,
rather than one’s familiarization with a static body of facts. Fosnot (2005) describes
constructivism this way:
Constructivism is a theory about knowledge and learning; it describes both what “knowing” is and how one “comes to know.” Based on work in psychology, philosophy, science, and biology, the theory describes knowledge not as truths to be transmitted or discovered, but as emergent, developmental, nonobjective, viable constructed explanations by humans engaged in meaning-making in cultural and social communities of discourse. Learning from this perspective is viewed as a self-regulatory process of struggling with the conflict between existing personal models of the world and discrepant new insights, constructing new representations and models of reality as a human meaning-making venture with culturally developed tools and symbols, and further negotiating such meaning through cooperative social activity, discourse, and debate in communities of practice. (p. ix) Dewey’s emphasis on the social nature of learning is still present, yet where the
progressive movement was in large part counter-establishment, rejecting all things
traditional, constructivism accepts some level of authority and organization. Stemming
more from a belief in the individual nature of the learning process rather than a
Rousseauian rejection of societal impositions, constructivists do envision a classroom
quite different from what is commonplace today. Fosnot (2005) continues:
Although constructivism is not a theory of teaching, it suggests taking a radically different approach to instruction from that used in most schools…The traditional hierarchy of teacher as the autocratic knower, and learner as the unknowing, controlled subject studying and practicing what the teacher knows, begins to dissipate as teachers assume more of a facilitator’s role and learners take on more ownership of the ideas. Indeed, autonomy, mutual reciprocity of social relations, and empowerment become the goals. (p. ix)

11
While similar sentiments are frequently expressed in educational settings, most
classroom practices do not reflect this shift in objectives and methodology. Core
curricula dictate the concepts covered and are employed to measure the success of a
student.
A significant difficulty in discussing teaching approaches in today’s classroom is
the lack of common terminology in expressing related ideas. Terms such as student-
centered, constructivism, inquiry, and discovery learning are often used interchangeably.
“Various interpretations of constructivism still abound, often confusing it with ‘hands-on’
learning, discovery, and a host of pedagogical strategies” (Fosnot, 2005, p. x). While
there are commonalities between these terms, experts in each field feel there are
important differences.
2.2 Inquiry-Based Science
In the sciences, the term used most often to refer to student-centered approaches is
“inquiry.” The inquiry approach to teaching science has been advocated by the Physics
Education Group lead by Lillian McDermott at the University of Washington. Their
primary curricular publication is entitled “Physics by Inquiry” (McDermott et al. 1996).
Their description of the work includes:
Physics by Inquiry has been designed for courses in which the primary emphasis is on discovering rather than on memorizing and in which teaching is by questioning rather than by telling. Such a course allows time for open-ended investigations, dialogues between the instructor and individual students, and small group discussions. A major goal is to help students think of physics not as an established body of knowledge, but rather as an active process of inquiry in which they can participate. (McDermott et al., 1996)

12
Inquiry applies to a range of investigative activities with varying degrees of
structure or teacher control. On the more structured end of the spectrum we have guided
inquiry. This is not the cookbook lab where a teacher walks you through every step,
instead “the instructor provides the problem and encourages students to work out the
procedures to resolve it…The teacher asks questions giving students direction rather than
telling them what to do” (Trowbridge et al., 2000, p. 209). The less structured end of the
spectrum is referred to as free or open-inquiry. In this case the students would come up
with their own research questions as well as methods of investigating their hypotheses.
Many “discovery learning” activities might fall somewhere in between (Figure 2-1),
where the research question and some equipment are supplied by the teacher, but the
decisions about the exact methodology to be employed and the conclusions drawn are left
up to the student. All of these methods are more student-centered than the traditional
approach of direct instruction, but they vary in degree of student responsibility and
autonomy. While hands-on and discovery activities have become part of nearly every
science class, true constructivist classrooms remain quite rare.
Figure 2-1: Student-Centered Spectrum
Open Inquiry Guided Inquiry
Constructivism Discovery Learning
Hands-On Learning
Spectrum of Student-Centered Techniques

13
A constructivist approach in a physics classroom has been applied by Dewey I.
Dykstra Jr., at Boise State University. Dykstra (2005) summarizes the evolution of his
teaching philosophy in this way:
I came to this constructivist point of view because of my belief that, as the result of teaching, one’s students should have new understandings of the world. I found at the beginning of my career that when I taught as I had been taught, new understandings on the part of the students were not usually the result. Having looked for evidence of new understandings as a result of teaching at a wide range of levels over the past two decades, I have found that this is unfortunately the general state of affairs. I also do not believe that only certain smart people can do math and science. Holding these two beliefs has made life difficult…Left with the realization that typical physics instruction results in an unsatisfactory outcome and deprived of the typical ad hoc explanations for this failure, I wrestled in a great disequilibrium for a number of years. (p. 222-3) An aspect of constructivism upon which Dykstra places particular importance is
that of focusing on the student’s preconceptions, specifically in getting the student to
explicitly express what might otherwise remain tacit. It has been observed that students
often learn a given subject matter well enough to use the correct terminology in
discussing the topic and even perform well on examinations, yet later revert back to their
previous ideas about the world. The new material seems to be disconnected from
previous learning, rather than building on or replacing it. To combat this phenomenon,
Dykstra decided to teach his introductory physics course quite differently from the
traditional methods with which he had been taught.
Several days are spent carefully guiding the students to articulate and share their
ideas with as little teacher influence as possible. As a given physical situation is
demonstrated, students must explain what they are seeing, often in pictures and diagrams
as well as prose. The class then shares their ideas, and when differences of opinion arise,
students are encouraged to communicate their reasoning in an effort to come to a
14
consensus. When there is agreement between a majority of students, they are then asked
to apply their ideas to make predictions about another physical situation. It is a usual
practice in a physics class to give demonstrations that challenge common misconceptions,
but taking more time to have students think about and commit to their predictions helps
the discrepant events to lead to actual conceptual change. Dykstra puts it this way, “My
goal ultimately is to maximize the chances that the students will be disequilibrated. The
more explicit and detailed their ideas are to themselves and the greater their commitment
to these explanations, the more likely the disequilibration when the students decide for
themselves that the explanations do not make sense” (p. 230). The greater the buy-in on
the part of the student, the greater the chances of long term learning taking place.
Another example of a constructivist physics classroom focuses on the autonomy
of the student in originating and testing research questions. Wolff-Michael Roth (1994),
at Simon Fraser University, taught an experimental high school course at a private school
in central Canada. “He used a graduate student advisor metaphor as referent for the
planning of, and acting in, the learning environment” with “about six to seven of the nine
periods in a two-week cycle” spent on experimentation (p. 201-2). The occasional class
period not spent in the lab was used for class discussions or introducing new tools for
collecting or analyzing data. Often the instructor would supply an initial research
question when a new topic was to be covered, but then students would be responsible for
subsequent investigations. The idea was for the students to “take individual
responsibility for their learning” (p. 201) in a setting similar to a graduate student
working with an advisor. The students worked in groups to generate their own research
questions, experimental methodology, and to analyze their results. The instructor would

15
then provide feedback on their lab reports that “included alternate interpretations,
different graphical and statistical analysis procedures using the student data set as an
example, suggestions for error sources, suggestions for everyday application, general
encouragement, and praise” (p. 202). The focus was more on the process and
interpretations rather than the replication of established science.
Many teachers experienced in traditional approaches to education would likely
react to this course construction with concerns of managing and motivating students in
such an unstructured environment. Roth (1994) reports:
Our results are in marked contrast to earlier studies in science laboratories, which indicated that open inquiry was too confusing and did not work for most students, that learning outcomes were too uncertain, and that students were little concerned with meaningful learning but mostly pursued their own agendas of a social nature. We found a remarkable ability and willingness to generate research questions, to design and develop apparatus for data collection, to deal with problems arising during implementation out of the context of inquiry, and to pursue meaningful learning during the interpretation of data and graphs to arrive at reasonable answers of their focus questions (p. 204). The students themselves noted the stark difference between the constructivist
laboratory and the traditional approach used in many of their other science courses.
“Most students did not like the cookbook approach of traditional laboratories because the
purpose of most steps remained hidden from them. Thus, they completed a chemistry
laboratory exercise without knowing why they took each step” (p. 211). The novelty of
the open-inquiry experience did lead to an adjustment period of 3-4 months before the
students were really comfortable with how to proceed (Roth, 2007).
Roth (1994) reported that students conducted science experiments in a manner
much more closely resembling the work of actual scientists and “used reasoning modes
similar to those that appear during everyday practices of scientists and nonscientists

16
alike” (p. 216). As the students formulated and researched their own questions, the
sentiment towards the lab experience shifted from a task to be completed to a personal
inquiry for which an answer was sought.

17
3 Methodology
3.1 Purpose
The purpose of this study was to compare the outcomes of a guided-inquiry with
an open-inquiry teaching approach in a high school physics classroom. The outcomes
that were investigated were academic student performance and student attitudes towards
physics.
3.2 Classroom Contexts
The classes involved in this study were taught at Lone Peak High School in
Highland, Utah during the 2007-2008 school year. Lone Peak had 1,974 students (52%
male, 48% female) in 2006 and is part of the Alpine School District which had 52,920
students and 67 schools. The median household income of the district was $51,916.
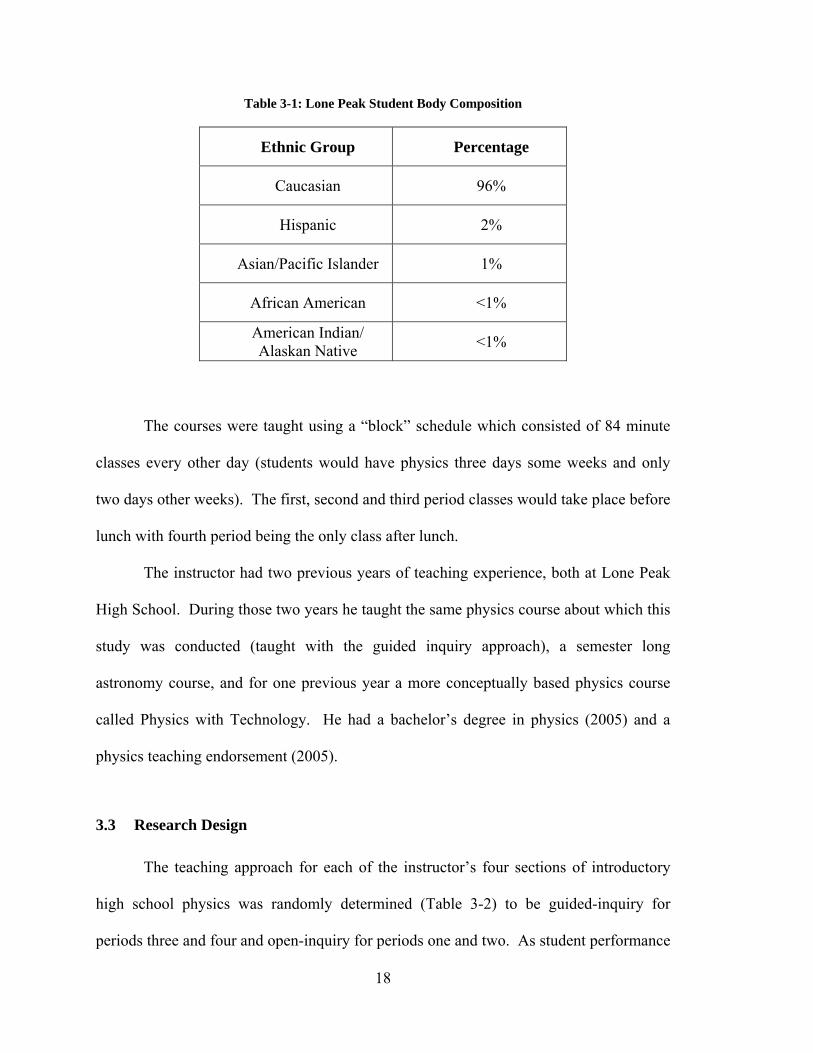
Table 3-1 gives the ethnic breakdown of Lone Peak as of 2006. It had a graduation rate
of 90.41%. Eight percent of the students qualified for free or reduced lunches. The
student to teacher ratio was 25:1 in 2005, compared to a state average of 23:1. The
average ACT score in 2006 was 22.9 while the Utah state average was 21.7.
18
Table 3-1: Lone Peak Student Body Composition
Ethnic Group Percentage
Caucasian 96%
Hispanic 2%
Asian/Pacific Islander 1%
African American <1%
American Indian/ Alaskan Native <1%
The courses were taught using a “block” schedule which consisted of 84 minute
classes every other day (students would have physics three days some weeks and only
two days other weeks). The first, second and third period classes would take place before
lunch with fourth period being the only class after lunch.
The instructor had two previous years of teaching experience, both at Lone Peak
High School. During those two years he taught the same physics course about which this
study was conducted (taught with the guided inquiry approach), a semester long
astronomy course, and for one previous year a more conceptually based physics course
called Physics with Technology. He had a bachelor’s degree in physics (2005) and a
physics teaching endorsement (2005).
3.3 Research Design
The teaching approach for each of the instructor’s four sections of introductory
high school physics was randomly determined (Table 3-2) to be guided-inquiry for
periods three and four and open-inquiry for periods one and two. As student performance
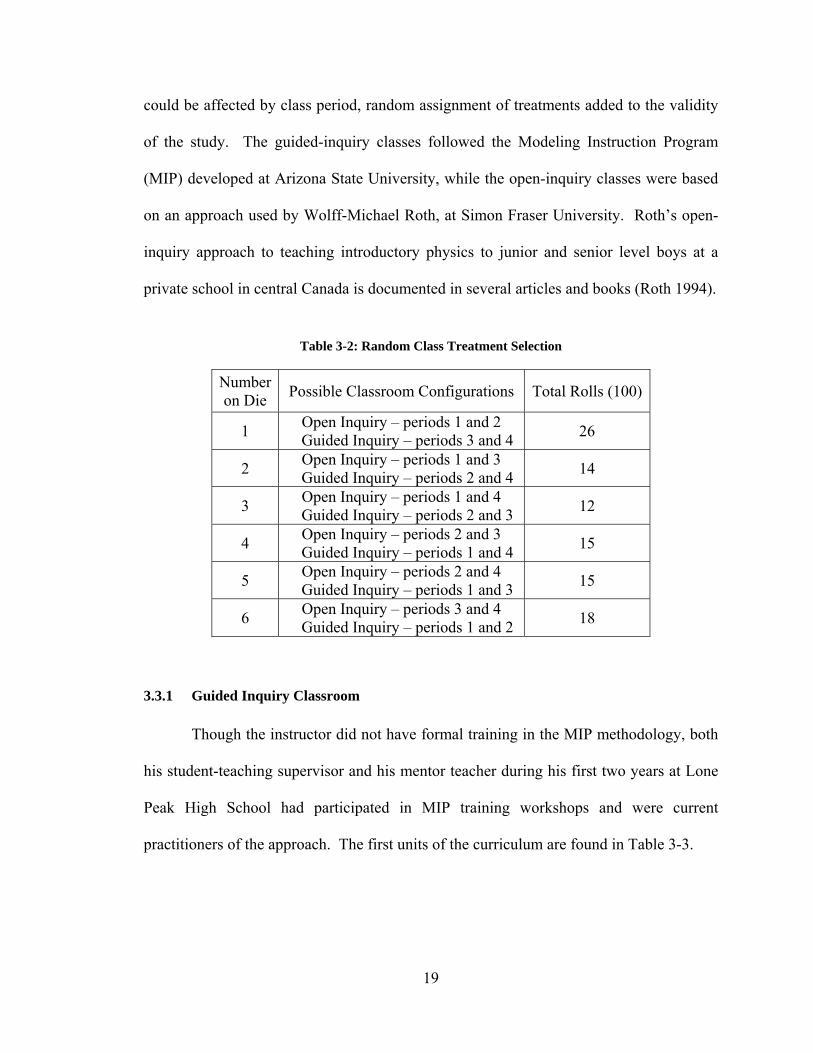
19
could be affected by class period, random assignment of treatments added to the validity
of the study. The guided-inquiry classes followed the Modeling Instruction Program
(MIP) developed at Arizona State University, while the open-inquiry classes were based
on an approach used by Wolff-Michael Roth, at Simon Fraser University. Roth’s open-
inquiry approach to teaching introductory physics to junior and senior level boys at a
private school in central Canada is documented in several articles and books (Roth 1994).
Table 3-2: Random Class Treatment Selection
Number on Die Possible Classroom Configurations Total Rolls (100)
1 Open Inquiry – periods 1 and 2 Guided Inquiry – periods 3 and 4 26
2 Open Inquiry – periods 1 and 3 Guided Inquiry – periods 2 and 4 14
3 Open Inquiry – periods 1 and 4 Guided Inquiry – periods 2 and 3 12
4 Open Inquiry – periods 2 and 3 Guided Inquiry – periods 1 and 4 15
5 Open Inquiry – periods 2 and 4 Guided Inquiry – periods 1 and 3 15
6 Open Inquiry – periods 3 and 4 Guided Inquiry – periods 1 and 2 18
3.3.1 Guided Inquiry Classroom
Though the instructor did not have formal training in the MIP methodology, both
his student-teaching supervisor and his mentor teacher during his first two years at Lone
Peak High School had participated in MIP training workshops and were current
practitioners of the approach. The first units of the curriculum are found in Table 3-3.

20
Table 3-3: MIP Curriculum (Modeling Instruction Program, 2002)
Unit 1 Scientific Thinking
Unit 2 Constant Velocity
Unit 3 Constant Acceleration
Unit 4 Free Particle (Balanced Forces)
Unit 5 Constant Force (Net Force)
Unit 6 2-Dimensional Kinematics
MIP is a self-contained high school physics curriculum that does not accompany
any textbook. The word “modeling” in MIP is not to be confused with the teaching
method known as modeling, where the teacher “models” behavior for the students.
Instead it refers to the idea that phenomena can be modeled, or represented, in several
ways (e.g. as a picture, as a graph, as an equation, etc.). One of the overarching
principles in the structure of the MIP approach is to help students recognize that all of
these representations are equivalent. This is done through labs which introduce new
concepts and are designed to shift thinking towards a Newtonian paradigm. Lab reports,
homework problems, tests, and the sharing of results through a process termed white-
boarding, are other foundational elements of the course.
The nature of the MIP labs and their placement at the beginning of the unit are
both aspects of guided inquiry that contrast with traditional physics classrooms. With the
lab experience before a formal introduction to a new concept, students can connect the
new ideas presented with an actual phenomenon that they have experienced. Almost
every equation used in the course is derived from the students’ actual lab data, rather than
being materialized ex nihilo. While the teacher does have a set research question in mind

21
for each lab, the students are lead to identify the relevant variables themselves (through
brainstorming and evaluating significant factors influencing a given phenomenon) and
are given substantial liberty in choosing the methods used to answer the research
question. Individual lab reports help each student to be accountable for understanding
and communicating the purpose, methods, and findings of the lab.
About 20-30% of class time is spent in the lab with the majority of the remaining
time used for working through a number of worksheets that are generally focused on
computation. Unit tests (given every 2-3 weeks) very closely resemble the homework but
often include selected conceptual questions that address the ideas brought forth in the lab.
Another integral piece of the MIP curriculum is white-boarding. So named
because small white-boards (approximately 2 feet by 3 feet) are used by groups of
students to organize and present their findings to each other. This is done to discuss the
data and conclusions after each lab. Included are a graph, an equation, and an
explanation of the relationship(s) found. It also plays a central role in working through
homework problems. Generally each group is given a different problem from the
assignment and the students present solutions and answer questions from classmates as
well as the teacher. The presenting students must have a good understanding of the
problem in order to coherently explain it to others and the receiving students can at times
gain a clearer understanding from a peer’s explanation than from that of a teacher.
3.3.2 Open Inquiry Classroom
To summarize the difference in the two classrooms, the open-inquiry approach
had the allotment of class time on labs and homework swapped with that of the guided-
inquiry approach. Preparing for, performing, or analyzing labs accounted for 60-70% of
22
the total class time. The rest of the time was spent sharing experimental results, concept
mapping, and taking tests. Textbook problems were also given as homework. The same
content used in the MIP curriculum also set the framework for the open-inquiry
classroom.
Another major difference was that the students were responsible for generating
their own research questions within the context of the unit. Things looked very similar to
the MIP class for the first lab of the unit as the teacher provided suggestions for
investigations, though students did ultimately have the choice of their research question.
But this was used as a starting off point, where questions arising in the first lab would
lead to an additional lab or two (depending on the unit) where the students supplied the
relationship to be studied and the methodology used. This meant that it was possible for
every group to be working on a different lab. The teacher was available as a resource in
the formulation of research questions, but care was taken to support the students in
solidifying their own thoughts rather than supplying ideas for them. Occasionally the
instructor felt that a lab was just not feasible and recommended trying something else.
The labs would generally take two to three class periods to complete: 45-60 minutes
formulating the question and planning the data collection, 80-130 minutes collecting and
analyzing data, and 45-60 minutes discussing results with the teacher and fellow students
as conclusions were formed.
Lab reports were submitted in groups. Because of the nature of the student-
centered lab experience (it was possible that an experiment did not lead to a conclusion
other than that the given approach was not successful), the grading of lab reports focused
on logical consistency and feasibility of interpretations of data. About one period every

23
two weeks was used for class discussions which included presentations of laboratory
findings, reviewing, or introducing new tools or instruments (force meters, computer
programs, etc.). As groups presented their lab design, results, and conclusions to the
class, each lab would be related back to the common themes fundamental to the current
unit of study.
Students were also required to complete 6 homework problems of their choosing
each week and concept maps summarizing the entire unit. The homework problems were
to be completed individually, but the concept maps were again a group assignment. This
often led to valuable exchanges between students as they helped each other articulate
their understanding of the relationships between the concepts of a given unit. Unit tests
were given less frequently than in the guided-inquiry approach and counted as a smaller
portion of the students’ overall grade. The tests were originated by the teacher and were
written to reflect the focus of the class, asking the students to analyze and interpret data
tables and graphs similar to what they encountered in their lab experiences.
A main goal of the open-inquiry approach was to give the student as much
responsibility over their learning as possible, yet still retain enough structure for the class
to be coherent and to hold the students accountable. Also the focus is shifted from
spending most of the time working on foundational knowledge with the occasional
project to address higher-order learning, to the majority of the time being concentrated on
analytical and reasoning skills.

24
3.4 Data and Instrumentation
The independent variable in this study was the level of inquiry, or student-
centeredness, of the high school physics class. The dependent variables of interest were
the students’ short-term (immediately following instruction on all concepts) and long-
term (10-11 weeks later) understanding of introductory physics concepts as well as the
student’s attitudes towards physics. To assess these outcomes, the following instruments
were employed:
1. The Force Concept Inventory (FCI) – a 30 question multiple choice conceptual exam widely used as baseline measurement of understanding of Newtonian physics. Short-term and long-term physics understanding was assessed with the FCI (Hestenes, 1992).
2. Utah State Criterion Referenced Physics Test (CRT) – a 70 question
multiple choice test covering a broader range of topics than what is found on the FCI. It is mostly conceptual but includes some minor computational questions. This was used to assess short-term understanding and to validate the results of the FCI.
3. Colorado Learning Attitudes about Science Survey (CLASS) – a 42
question Likert scale (agree-disagree) survey to measure students’ attitudes towards physics. (Adams et al., 2006; Appendix C)
The FCI was given three times during the course of the year. A pretest was given
at the beginning of the year in order to later calculate gain scores. A posttest was given
during the third quarter of the year after all concepts addressed on the FCI had been
covered. The first test was given without a review and counted only minimally on the
students’ grades. On the last day of the year, a second posttest was given as the course
final. Content was reviewed prior to the second posttest and students’ scores were a
significant part of their grade. As the material covered on the FCI was not explicitly
taught between the first and second posttests, the second posttest was intended as a
measure of retention. The CRT was administered throughout the state of Utah near the

25
end of the school year. This was used as an additional measure of the learning of
Newton’s Laws, as well as additional physics topics. The CRT also influenced students’
grades significantly. The CLASS was used at the beginning of the year and again at the
time of the first FCI posttest to investigate changes in students’ attitudes towards physics.
3.5 Analysis of Data
Both practical and statistical significances were considered in comparing the
differences in outcomes for the two instructional approaches. Only scores from students
who remained in a single treatment for the whole year were included in the data. This
excluded students who moved in or transferred from another class part way through the
year as well as students who switched from one treatment to the other. A total of 44
students in the open-inquiry class and 42 in the guided-inquiry took the FCI all three
times as well as the CRT while remaining in the same treatment for the entire school
year. The pre and post CLASS was completed by 40 open-inquiry and 41 guided-inquiry
students. Fewer students were included in the CLASS results due to absence and
incorrect responses to a questions designed to identify those who did not actually read the
survey. When comparing scored responses on the exams (FCI and CRT) an F-test was
employed to confirm equal sample variances followed by a two-tailed t-test of sample
means assuming equal variances with an alpha level of .05. A two-tailed test was chosen
because it was important to see if the test scores of students experiencing the open-
inquiry approach were statistically higher or lower than the scores of students undergoing
the guided-inquiry method. The results of the survey were analyzed with a spreadsheet
provided by Adams et al. (2006) and conclusions were made interpretively rather than on

26
a test of significance. Subtests of the FCI and CRT consisting of a subset of questions
applying to a given concept were also examined.
For the FCI test average raw gain scores (‹G›, equation 3-1) were calculated for
each of the two posttests as well as normalized gain scores (‹g›). The normalized gain
score measures how many more questions a student answered correctly on a posttest out
of how many they could have possibly improved by. Because the FCI is a 30 question
test, the normalized gain was calculated using equation 3-2. An advantage of this method
of examining a gain score is that it removes the limitation on the gain score of a student
who does well on the pretest. For example, if students A and B both had raw gain scores
of 10 points on the FCI, but student A scored a 10 on the pretest and student B a 20, then
their raw gain scores would be equal but their normalized gain scores would be quite
different. Student A would have a normalized gain score of .5 (he correctly answered
half of the questions that he had missed the first time) whereas student B would have a
normalized gain score of 1 (he gained all points he possibly could). Hake (1998)
interpreted <g> scores for the FCI as low if ‹g›<.3, medium if .3≤‹g›<.7, and large if
‹g›≥.7 (p. 65). A t-test was applied to the raw scores on both FCI post tests, as well as the
raw and normalized gain scores. The CRT test could only be given once throughout the
year which limited the analysis to a t-test of sample means.
G post pre< >= − (3-1)
max 30post pre post preg
pre pre− −
< >= =− −
(3-2)

27
An additional way of evaluating the results of the FCI was to look at the
percentage of students scoring at or above 18, the score chosen by the creator of the test
(Hestenes et al., 1992) as the threshold of those who have successfully achieved thinking
in a Newtonian paradigm. As there were no students who scored at the Newtonian
threshold on the pretest, percentages of students scoring above 18 on the posttests were
compared as well as the change in that percentage from the first posttest to the second.
With the relatively small sample sizes in this study, large differences in scores
would be needed to claim statistical significance. For that reason practical significance in
the form of effect sizes (d) were also considered in analyzing the results of the FCI and
CRT. The effect size is defined as a difference in sample means expressed in numbers of
pooled standard deviations. The effect size (d) is calculated using equation 3-2, which is
independent of the sample size. Though somewhat subjective, a commonly used scale for
the interpretation of an effect size is 0.20 for small significance, 0.50 for medium
significance, and 0.80 for large significance (Cohen, 1988).
1 22 21 2( ) / 2X Xdσ σ
−=
+ (3-3)
The CLASS uses a 5-point Likert scale of the strength of agreement or
disagreement with each statement. An “expert opinion” has been determined for 36 of
the 42 survey questions (Appendix D) and responses were viewed as either agreeing or
disagreeing with the expert. To agree with the expert meant to disagree with some
statements but to agree with others. This meant that it was not possible to sum the
responses from each treatment to determine the degree to which attitudes towards physics

28
had changed. An additional challenge to analyzing the survey was having “neutral” as a
possible response. When comparing the pre and post-surveys, one could have fewer
students choose the neutral option and potentially have a higher percentage of students
agree with the expert opinion at the same time that a higher percentage of students
disagree. The most positive change was seen then as an increase in the percentage of
students agreeing with the expert opinion accompanied by a decrease in the percentage of
students disagreeing.

29
4 Findings
The researcher was interested in comparing knowledge of physics content as
measured by raw test scores and gain scores, and attitudes towards physics for students
participating in open-inquiry (Roth) and guided-inquiry (MIP) high school physics
courses. The results are grouped by measurement instrument.
4.1 FCI Results – Measure of conceptual understanding of force and motion
4.1.1 Pretest
The first time the students in both treatments took the FCI was on the second day
of school (23 August). No instruction related to forces or motion had been given to either
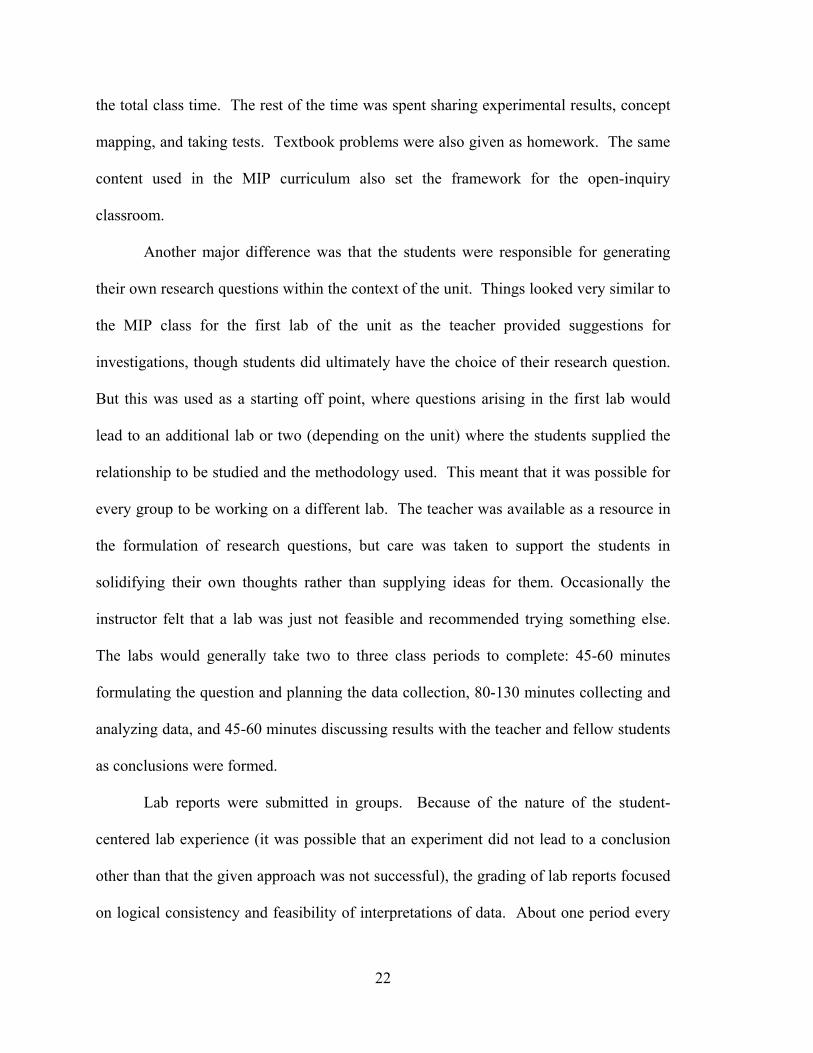
class prior to the test being administered. The average scores for the open and guided-
inquiry classes were 7.8 and 7.2 respectively with standard deviations of 3.3 and 3.0
(Table 4-1). The open-inquiry classes had a maximum score of 16 and a minimum score
of 2, while the maximum and minimum for the guided-inquiry classes were 14 and 3,
respectively. As evinced by the already mentioned maximum scores, no students in
either treatment scored at or above the Newtonian threshold of 18. F and t-tests showed
no statistically significant difference in the sample variations or means.
30
Table 4-1: FCI Pretest Results
Open Guided Difference p-value
Mean 7.8 7.2 0.6 0.41
σ 3.3 3.0 0.3 0.24
4.1.2 Posttest 1
Due to slight variations in pacing arising from the differences in instructional
methods, the first posttest was not administered on the same day for all classes, though
for both treatments it was immediately after completing the material that is addressed on
the FCI. The two sections of open-inquiry physics took the first posttest on 12 March
and the guided-inquiry physics sections took it on 20 March. No class time was taken to
review for the test nor were any review materials supplied to the students.
Raw Scores
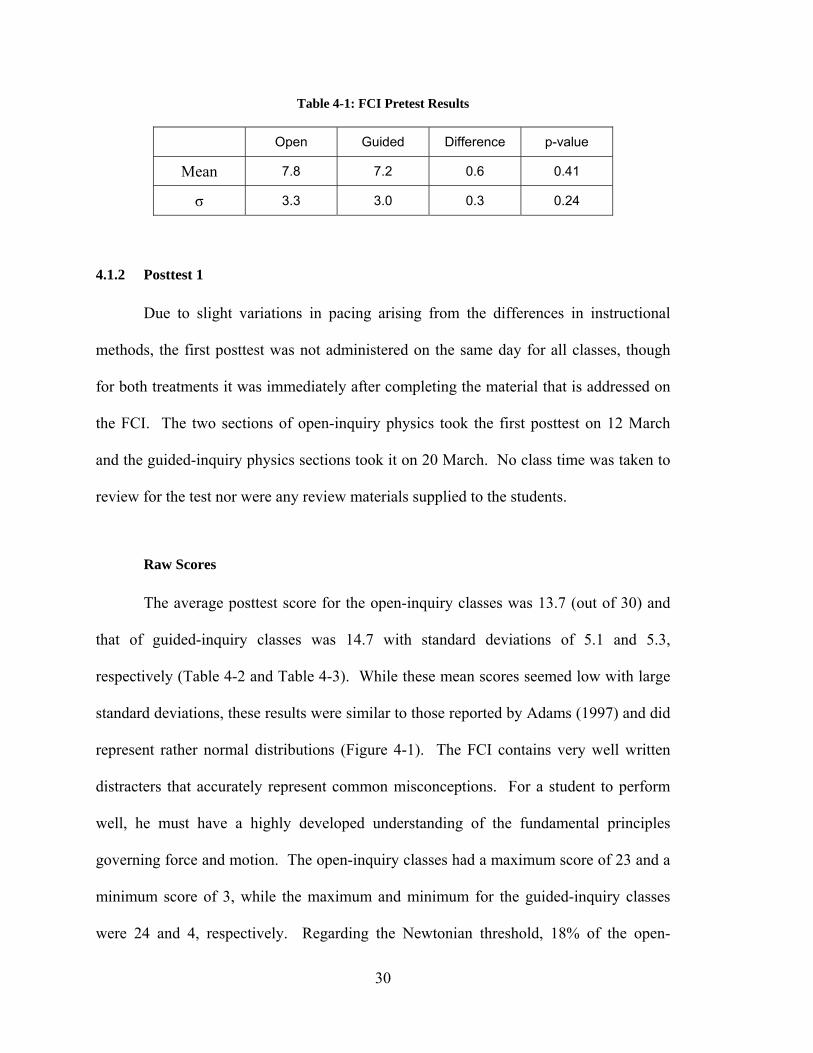
The average posttest score for the open-inquiry classes was 13.7 (out of 30) and
that of guided-inquiry classes was 14.7 with standard deviations of 5.1 and 5.3,
respectively (Table 4-2 and Table 4-3). While these mean scores seemed low with large
standard deviations, these results were similar to those reported by Adams (1997) and did
represent rather normal distributions (Figure 4-1). The FCI contains very well written
distracters that accurately represent common misconceptions. For a student to perform
well, he must have a highly developed understanding of the fundamental principles
governing force and motion. The open-inquiry classes had a maximum score of 23 and a
minimum score of 3, while the maximum and minimum for the guided-inquiry classes
were 24 and 4, respectively. Regarding the Newtonian threshold, 18% of the open-

31
inquiry physics scored at least an 18 compared to 29% of the guided-inquiry students.
An F-test showed no statistically significant difference in variance. A t-test showed the 1
point difference in sample means to also lack statistical significance with a two-tailed p-
value of .38. The effect size of the difference in mean scores between the two treatments
was .19, below the .20 threshold to even be considered of small significance and barely
higher than the d of .18 for the difference in pretest means.
Table 4-2: FCI Posttest 1 - Analysis of Means
Open Guided Difference p-value d
Mean 13.7 14.7 -1.0 0.38 -0.19
‹G› 6.0 7.5 -1.5 0.11 -0.34
‹g› 0.27 0.33 -0.06 0.17 -0.29
Difference - open-inquiry score subtract guided-inquiry score - a negative value indicates lower scores for the open-inquiry treatment.
d - effect size – a negative value indicates the open-inquiry score was lower than the guided-inquiry score.
‹G› - Raw gain scores (posttest-pretest) ‹g› - Normalized gain score (‹G›/possible ‹G›)
Table 4-3: FCI Posttest 1 - Analysis of Distributions
Open Guided Difference p-value
σ (mean) 5.1 5.3 -0.2 0.38
σ (‹G›) 4.2 4.8 -0.6 0.18
σ (‹g›) 0.19 0.22 -0.03 0.19
32
Figure 4-1: Distributions of FCI Posttest 1 Scores
Raw Gain Scores
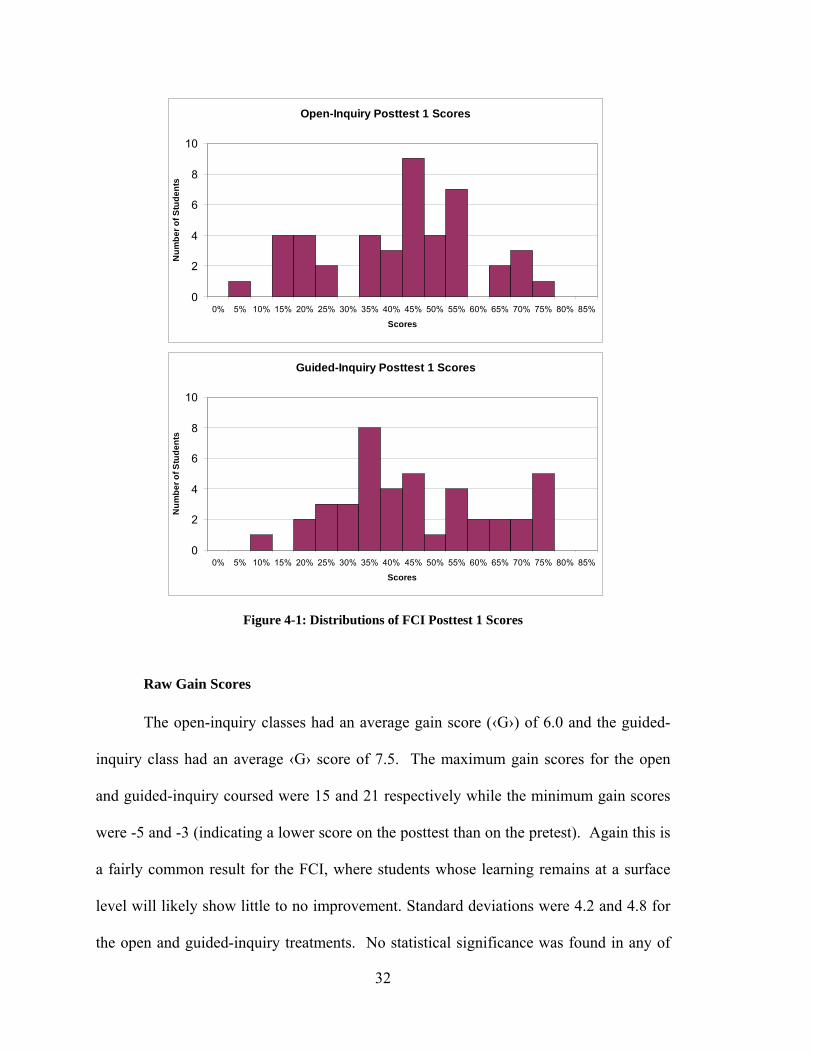
The open-inquiry classes had an average gain score (‹G›) of 6.0 and the guided-
inquiry class had an average ‹G› score of 7.5. The maximum gain scores for the open
and guided-inquiry coursed were 15 and 21 respectively while the minimum gain scores
were -5 and -3 (indicating a lower score on the posttest than on the pretest). Again this is
a fairly common result for the FCI, where students whose learning remains at a surface
level will likely show little to no improvement. Standard deviations were 4.2 and 4.8 for
the open and guided-inquiry treatments. No statistical significance was found in any of
Open-Inquiry Posttest 1 Scores
0
2
4
6
8
10
0% 5% 10% 15% 20% 25% 30% 35% 40% 45% 50% 55% 60% 65% 70% 75% 80% 85%
Scores
Num
ber o
f Stu
dent
s
Guided-Inquiry Posttest 1 Scores
0
2
4
6
8
10
0% 5% 10% 15% 20% 25% 30% 35% 40% 45% 50% 55% 60% 65% 70% 75% 80% 85%
Scores
Num
ber o
f Stu
dent
s

33
these differences, but a two-tailed t-test of mean gains had a lower p-value (.11) than that
of the t-test for mean scores. The difference in average ‹G› scores does represent a d
(effect size) of .34, a value near the middle of the range of small significance.
Normalized Gain Scores
The average ‹g› (normalized gain) scores for the open and guided-inquiry classes
were .27 and .33, respectively. These normalized gain scores straddle the cutoff between
low and medium gains for the FCI with the open-inquiry scores just below and the
guided-inquiry scores just above. The separate approaches had standard deviations of .19
and .22, maxima of .65 and .78, and minima of -.23 and -.13. None of these differences
were statistically significant. Analysis of the effect size again showed a small practical
significance with a d of .29.
4.1.3 Posttest 2
The third time that the FCI was given was on the last class of the year (either 27
or 29 May depending on the finals schedule) for both the open-inquiry and the guided-
inquiry courses. Between 10 and 11 weeks had passed since the first posttest, during
which time no teacher instruction directly of forces or motion was given, but the concepts
covered on the FCI were reviewed identically with all classes on two occasions: once
with an online practice test completed in groups during class to prepare for the CRT, and
a second time with student groups presenting concepts outlined on a review sheet (0)
supplied by the instructor in preparation for the final (the second FCI posttest). The
online practice test gave immediate feedback on whether or not the question was
answered correctly while the instructor was available to the students for further
34
explanation as needed. Raw and normalized gain scores for the second posttest were
calculated by comparing to pretest scores.
Raw Scores
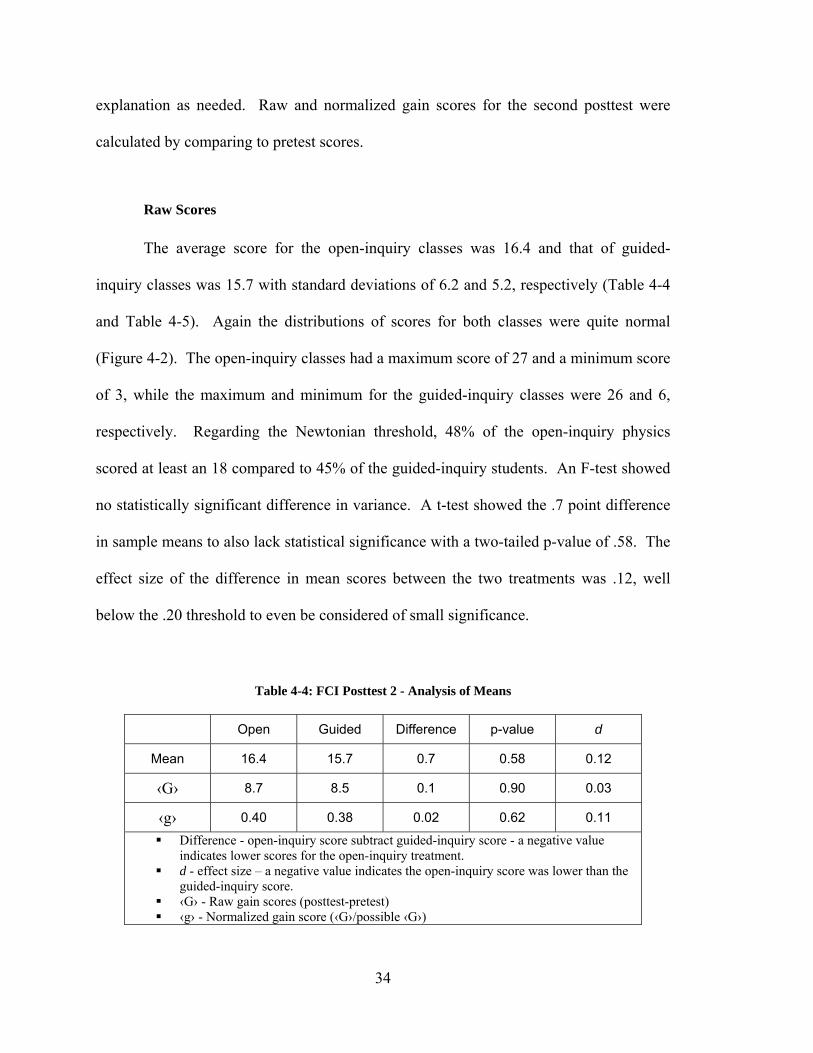
The average score for the open-inquiry classes was 16.4 and that of guided-
inquiry classes was 15.7 with standard deviations of 6.2 and 5.2, respectively (Table 4-4
and Table 4-5). Again the distributions of scores for both classes were quite normal
(Figure 4-2). The open-inquiry classes had a maximum score of 27 and a minimum score
of 3, while the maximum and minimum for the guided-inquiry classes were 26 and 6,
respectively. Regarding the Newtonian threshold, 48% of the open-inquiry physics
scored at least an 18 compared to 45% of the guided-inquiry students. An F-test showed
no statistically significant difference in variance. A t-test showed the .7 point difference
in sample means to also lack statistical significance with a two-tailed p-value of .58. The
effect size of the difference in mean scores between the two treatments was .12, well
below the .20 threshold to even be considered of small significance.
Table 4-4: FCI Posttest 2 - Analysis of Means
Open Guided Difference p-value d
Mean 16.4 15.7 0.7 0.58 0.12
‹G› 8.7 8.5 0.1 0.90 0.03
‹g› 0.40 0.38 0.02 0.62 0.11
Difference - open-inquiry score subtract guided-inquiry score - a negative value indicates lower scores for the open-inquiry treatment.
d - effect size – a negative value indicates the open-inquiry score was lower than the guided-inquiry score.
‹G› - Raw gain scores (posttest-pretest) ‹g› - Normalized gain score (‹G›/possible ‹G›)

35
Table 4-5: FCI Posttest 2 - Analysis of Distributions
Open Guided Difference p-value
σ (mean) 6.2 5.2 1.0 0.13
σ (‹G›) 5.0 4.5 0.5 0.27
σ (‹g›) 0.24 0.20 0.03 0.16
Figure 4-2: Distributions of FCI Posttest 2 Scores
Open-Inquiry Posttest 2 Scores
0
2
4
6
8
10
12
0% 5% 10% 15% 20% 25% 30% 35% 40% 45% 50% 55% 60% 65% 70% 75% 80% 85% 90%
Scores
Num
ber o
f Stu
dent
s
Guided-Inquiry Posttest 2 Scores
0
2
4
6
8
10
12
0% 5% 10% 15% 20% 25% 30% 35% 40% 45% 50% 55% 60% 65% 70% 75% 80% 85% 90%
Scores
Num
ber o
f Stu
dent
s
36
Raw Gain Scores
The open-inquiry classes had an average ‹G› score of 8.7 and the guided-inquiry
class had an average ‹G› score of 8.5. The maximum gain scores for the open and
guided-inquiry coursed were 18 and 19 respectively while the minimum gain scores were
both -3. Standard deviations were 5.0 and 4.5 for the open and guided-inquiry
treatments. Again no statistical significance was found in any of these differences. The
difference in average ‹G› scores represents a d of only .03.
Normalized Gain Scores
The average ‹g› scores (actual increase divided by maximum possible increase)
for the open and guided-inquiry classes were .40 and .38, respectively. These ‹g› scores
both fall in the range of medium gain scores for the FCI. The separate approaches had
standard deviations of .24 and .20, maxima of .82 and .78, and minima of -.13 and -.14.
None of these differences were statistically significant. Analysis of the effect size again
showed no indication of practical significance with a d (effect size) of .11.
4.1.4 Comparing Posttests 1 and 2
The results of the second posttest were somewhat surprising to the researcher in
that they indicated continued improvement rather than measuring retention. For this
reason the gain scores between posttest 1 and posttest 2 were of particular interest.
Raw Gain Scores
The open-inquiry classes had an average ‹G› score of 2.7 and the guided-inquiry
class had an average ‹G› score of 1.0 (Table 4-6 and Table 4-7). The maximum gain

37
scores for the open and guided-inquiry coursed were both 8 while the minimum gain
scores were -3 and -5, respectively. Standard deviations were 2.8 and 3.1 for the open
and guided-inquiry treatments. The difference of 1.7 in the average gain scores was
definitively found to have statistical significance with a p-value of .010 as well as having
practical significance in the medium range with a d of .57. The percentage of students in
the open-inquiry class reaching the Newtonian threshold increased 30% from one posttest
to the next compared to 17% of the guided-inquiry students.
Table 4-6: FCI Posttests 1 and 2 - Analysis of Mean Gains
Open Guided Difference p-value d
‹G› 2.7 1.0 1.7 0.010 0.57
‹g› 0.20 0.04 0.16 0.002 0.69
Difference - open-inquiry score subtract guided-inquiry score - a negative value indicates lower scores for the open-inquiry treatment.
d - effect size – a negative value indicates the open-inquiry score was lower than the guided-inquiry score.
‹G› - Raw gain scores (posttest-pretest) ‹g› - Normalized gain score (‹G›/possible ‹G›)
Table 4-7: FCI Posttests 1 and 2 - Analysis of Distributions
Open Guided Difference p-value
σ (‹G›) 2.8 3.1 -0.2 0.32
σ (‹g›) 0.20 0.25 -0.04 0.11

38
Normalized Gain Scores
The average ‹g› scores for the open and guided-inquiry classes were .20 and .04,
respectively. The two treatments had standard deviations of .20 and .25 (Table 4-7),
maxima of .70 and .47, and minima of -.14 and -.83. Strong evidence of a difference in
average ‹g› scores was found. A t-test gave a statistically significant p-value of .002. A
d of .69 was calculated, a value approaching high practical significance.
4.1.5 FCI Subtests
Each of the 30 questions on the FCI was assigned to one of six concepts to
consider if one treatment appeared to teach certain ideas more effectively than the other
treatment. These categories and pretest, posttest 1, and posttest 2 scores as a percentage
of correct responses are shown in Figure 4-3 and Figure 4-4. A definite adjustment
period for the open-inquiry class to be comfortable with the increased autonomy was
noted, yet the instructor felt that it was about 2 months rather than the 3-4 months
observed by Roth (2007). Some instruction on all categories except “circular motion’
and “projectiles” was given during this time period.
39
Open-Inquiry Subtest Scores
0%
10%20%
30%40%
50%
60%70%
80%
New
ton'
s1s
t Law
New
ton'
s2n
d La
w
New
ton'
s3r
d La
w
Iden
tifyi
ngFo
rces
Circ
ular
Mot
ion
Pro
ject
iles
Gen
eral
Mot
ion
PrePost 1Post 2
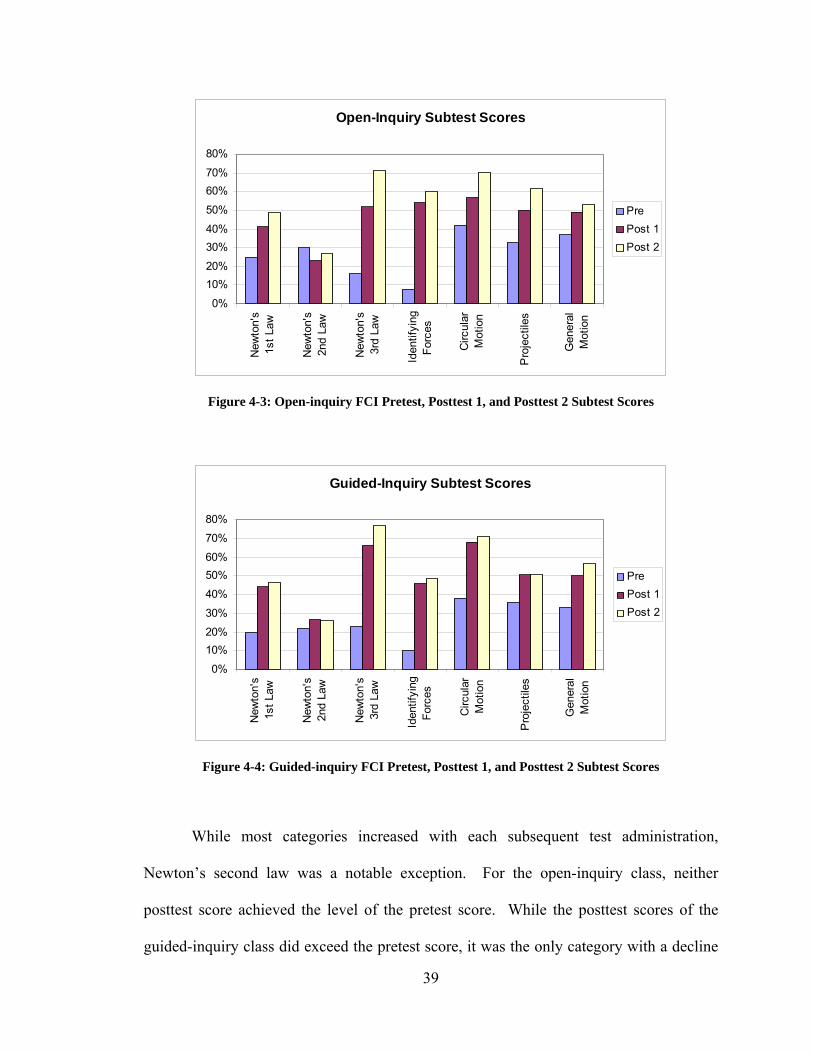
Figure 4-3: Open-inquiry FCI Pretest, Posttest 1, and Posttest 2 Subtest Scores
Guided-Inquiry Subtest Scores
0%
10%20%
30%
40%
50%60%
70%
80%
New
ton'
s1s
t Law
New
ton'
s2n
d La
w
New
ton'
s3r
d La
w
Iden
tifyi
ngFo
rces
Circ
ular
Mot
ion
Pro
ject
iles
Gen
eral
Mot
ion
PrePost 1Post 2
Figure 4-4: Guided-inquiry FCI Pretest, Posttest 1, and Posttest 2 Subtest Scores
While most categories increased with each subsequent test administration,
Newton’s second law was a notable exception. For the open-inquiry class, neither
posttest score achieved the level of the pretest score. While the posttest scores of the
guided-inquiry class did exceed the pretest score, it was the only category with a decline
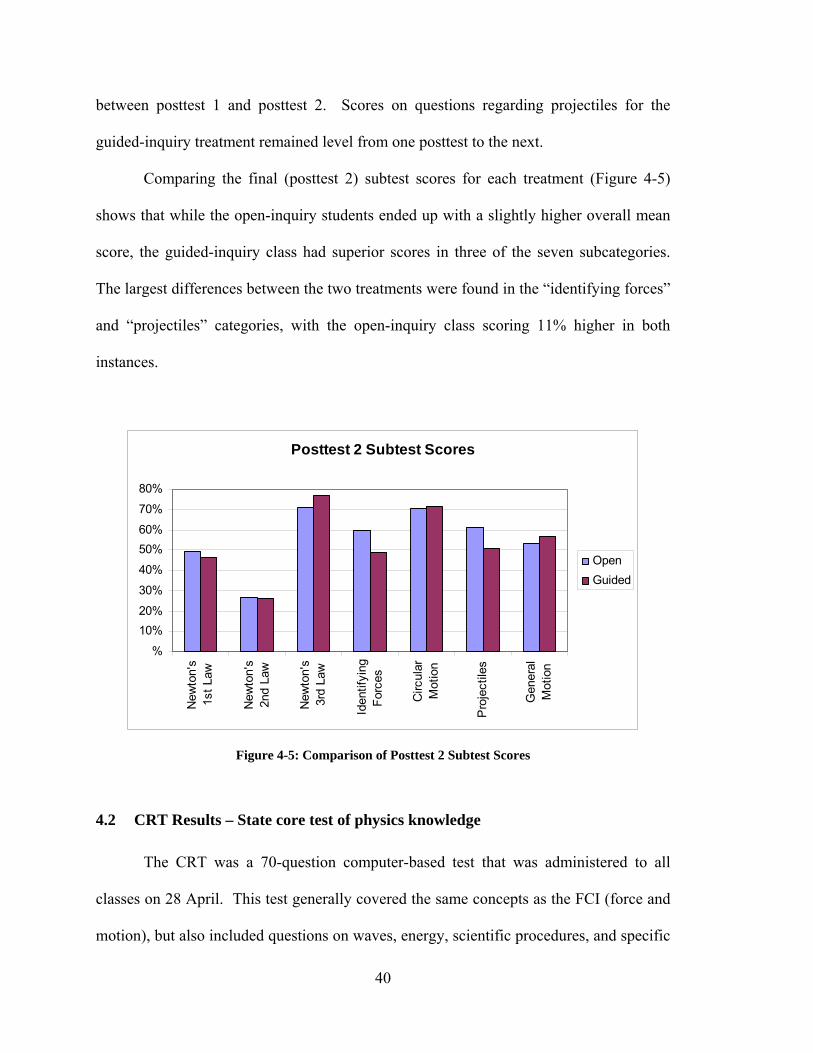
40
between posttest 1 and posttest 2. Scores on questions regarding projectiles for the
guided-inquiry treatment remained level from one posttest to the next.
Comparing the final (posttest 2) subtest scores for each treatment (Figure 4-5)
shows that while the open-inquiry students ended up with a slightly higher overall mean
score, the guided-inquiry class had superior scores in three of the seven subcategories.
The largest differences between the two treatments were found in the “identifying forces”
and “projectiles” categories, with the open-inquiry class scoring 11% higher in both
instances.
Posttest 2 Subtest Scores
%
10%20%
30%
40%
50%60%
70%
80%
New
ton'
s1s
t Law
New
ton'
s2n
d La
w
New
ton'
s3r
d La
w
Iden
tifyi
ngFo
rces
Circ
ular
Mot
ion
Pro
ject
iles
Gen
eral
Mot
ion
OpenGuided
Figure 4-5: Comparison of Posttest 2 Subtest Scores
4.2 CRT Results – State core test of physics knowledge
The CRT was a 70-question computer-based test that was administered to all
classes on 28 April. This test generally covered the same concepts as the FCI (force and
motion), but also included questions on waves, energy, scientific procedures, and specific

41
questions about gravitational and electric forces. Though largely a conceptual test, the
CRT also asks students to interpret data in the form of tables and graphs as well as to
make rudimentary mathematical calculations. Scores are reported by the state to the
instructor and include class averages and an analysis of subtests aligned with the state
core curriculum.
4.2.1 Mean Scores
The mean score for students from open-inquiry classes was 52.0 while the mean
for students from guided-inquiry classes was 47.7 (Table 4-8). In 2007, a score above 42
was considered proficient (or passing) and above 51 was classified as highly proficient.
The state-wide average score was 44.1 and the average of the district of which Lone Peak
is a part was 45.5. Standard Deviations were 9.7 and 10.0, respectively. An F-test
showed no evidence of unequal variance so a two-tailed t-test of sample means assuming
equal variance was used. A p-value of .049 was just slightly less than the alpha of .05
and indicated that there was significant statistical evidence that the mean of the scores
from open-inquiry students was higher than the mean of the scores from guided-inquiry
students. A d (effect size) calculated at .43 was indicative of a medium level of practical
significance. Multi-modal distributions were observed in both treatments (Figure 4-6).
Table 4-8: CRT Means and Standard Deviations
Open Guided Difference p-value d Mean 52.0 47.7 4.2 0.049 0.43 σ 9.7 10.0 -0.4 0.403 n/a Difference - open-inquiry score subtract guided-inquiry score - a negative value indicates
lower scores for the open-inquiry treatment. d - effect size – a negative value indicates the open-inquiry score was lower than the
guided-inquiry score.

42
Figure 4-6: CRT Score Distributions
4.2.2 Subtests
The state of Utah assigned each question on the physics CRT to one of five
categories known as standards (Table 4-9). Scores calculated as a percentage of correct
responses to questions for each standard are shown in Figure 4-7. Not only did the open-
inquiry classes have a higher overall average, they also scored higher in every subtest.
The discrepancy was smallest for questions relating to gravitational and electric forces
and largest for questions relating to energy.
Open-Inquiry CRT Scores
0
2
4
6
8
10
30% 35% 40% 45% 50% 55% 60% 65% 70% 75% 80% 85% 90% 95%
Scores
Num
ber o
f Stu
dent
s
Guided-Inquiry CRT Scores
0
2
4
6
8
10
30% 35% 40% 45% 50% 55% 60% 65% 70% 75% 80% 85% 90% 95%
Scores
Num
ber o
f Stu
dent
s
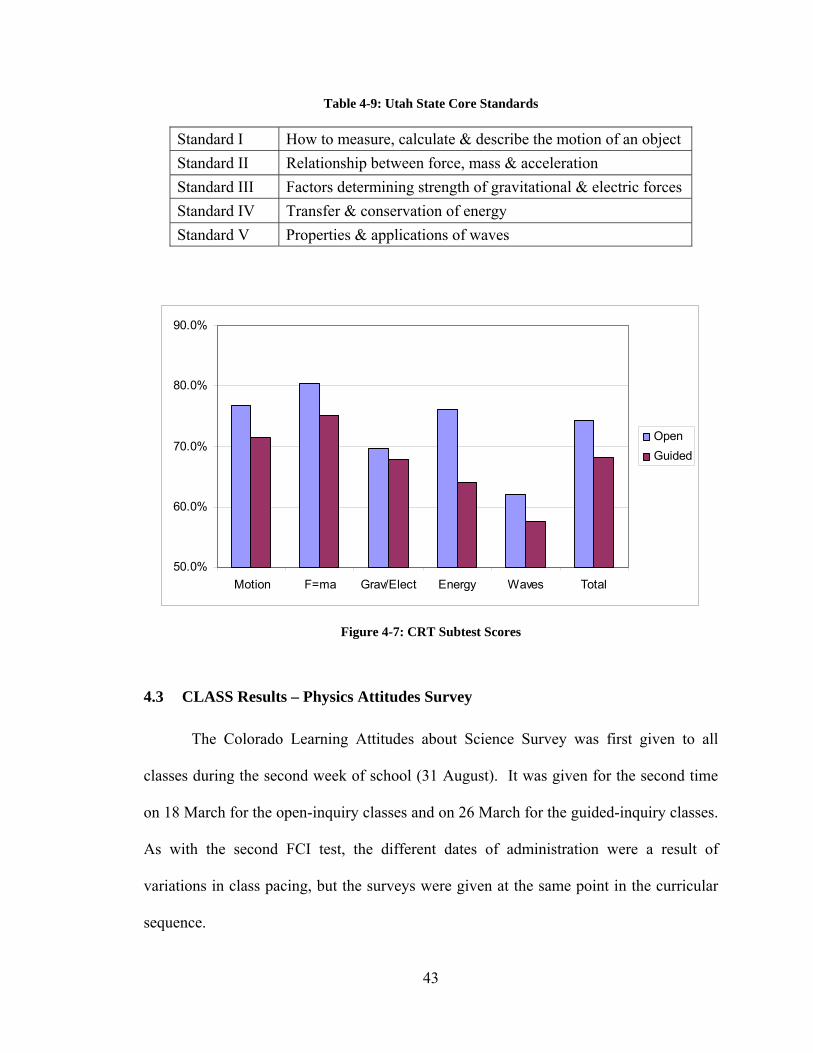
43
Table 4-9: Utah State Core Standards
Standard I How to measure, calculate & describe the motion of an object Standard II Relationship between force, mass & acceleration Standard III Factors determining strength of gravitational & electric forces Standard IV Transfer & conservation of energy Standard V Properties & applications of waves
50.0%
60.0%
70.0%
80.0%
90.0%
Motion F=ma Grav/Elect Energy Waves Total
OpenGuided
Figure 4-7: CRT Subtest Scores
4.3 CLASS Results – Physics Attitudes Survey
The Colorado Learning Attitudes about Science Survey was first given to all
classes during the second week of school (31 August). It was given for the second time
on 18 March for the open-inquiry classes and on 26 March for the guided-inquiry classes.
As with the second FCI test, the different dates of administration were a result of
variations in class pacing, but the surveys were given at the same point in the curricular
sequence.

44
Of the 42 questions on the test, one question is designed to help identify those
who are not reading the test by instructing them to give a certain response, 36 questions
had established “expert responses” with which to compare student responses, and 26
questions were grouped into one or more sub-categories (Appendix E) that were
established by Adams et al. (2006) for more detailed analysis.
When considering all 36 established questions, the open-inquiry class increased in
the percentage of students who agree with the expert opinion (Figure 4-8) as well as the
percentage of students who disagree with the expert opinion (Figure 4-9). This indicates
that there were less “neutral” responses. After treatment with the guided-inquiry teaching
approach, students were less likely to agree with the expert opinion and slightly less
likely to disagree.
Favorable Responses
42
43
44
45
46
47
48
49
50
Open Guided
Perc
enta
ge o
f Stu
dent
s
PrePost
Favorable responses are those that agree with the expert opinion
Figure 4-8: Pre/Post CLASS Favorable Responses

45
Unfavorable Responses
21
22
23
24
25
26
27
28
29
Open Guided
Perc
enta
ge o
f Stu
dent
s
PrePost
Unfavorable responses are those that are opposite that of the expert
Figure 4-9: Pre/Post CLASS Unfavorable Responses
Comparing the magnitude of these shifts showed that the largest change was in
those open-inquiry students who disagreed with the expert (Figure 4-10). It also
appeared that there was much greater movement in the opinions of the students
experiencing open-inquiry than those experiencing guided inquiry.
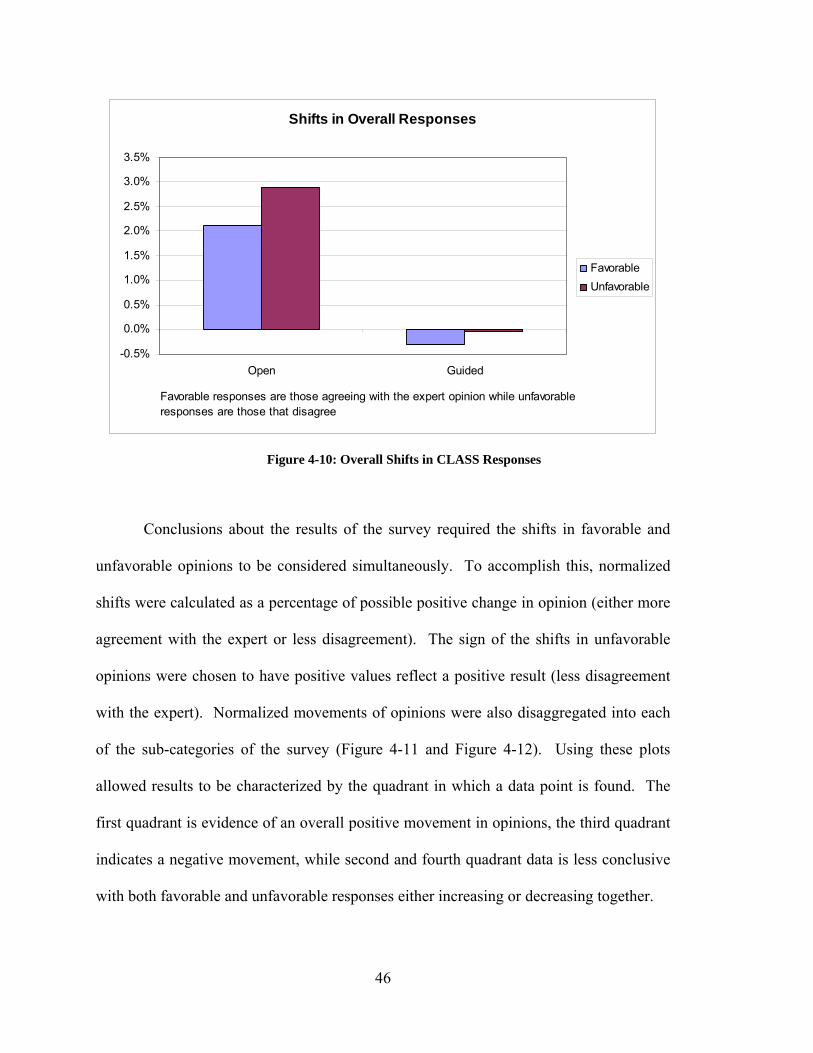
46
Shifts in Overall Responses
-0.5%
0.0%
0.5%
1.0%
1.5%
2.0%
2.5%
3.0%
3.5%
Open Guided
FavorableUnfavorable
Favorable responses are those agreeing with the expert opinion while unfavorable responses are those that disagree
Figure 4-10: Overall Shifts in CLASS Responses
Conclusions about the results of the survey required the shifts in favorable and
unfavorable opinions to be considered simultaneously. To accomplish this, normalized
shifts were calculated as a percentage of possible positive change in opinion (either more
agreement with the expert or less disagreement). The sign of the shifts in unfavorable
opinions were chosen to have positive values reflect a positive result (less disagreement
with the expert). Normalized movements of opinions were also disaggregated into each
of the sub-categories of the survey (Figure 4-11 and Figure 4-12). Using these plots
allowed results to be characterized by the quadrant in which a data point is found. The
first quadrant is evidence of an overall positive movement in opinions, the third quadrant
indicates a negative movement, while second and fourth quadrant data is less conclusive
with both favorable and unfavorable responses either increasing or decreasing together.
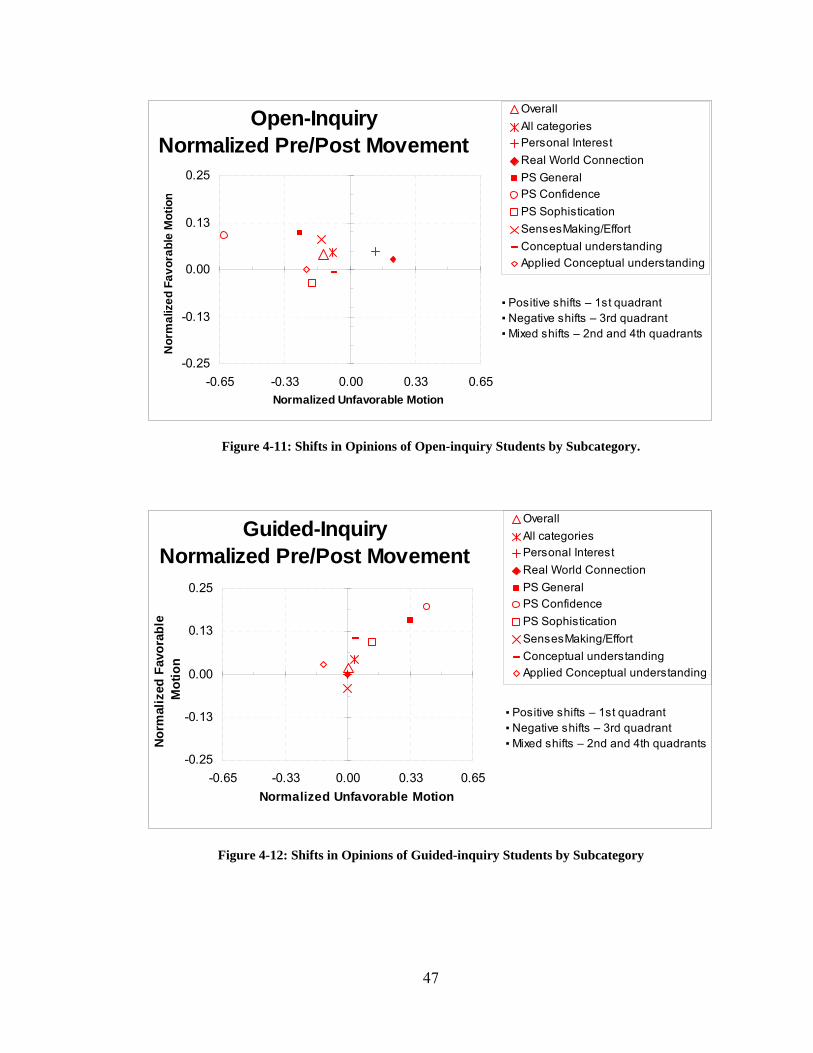
47
Open-InquiryNormalized Pre/Post Movement
-0.25
-0.13
0.00
0.13
0.25
-0.65 -0.33 0.00 0.33 0.65Normalized Unfavorable Motion
Nor
mal
ized
Fav
orab
le M
otio
n
OverallAll categoriesPersonal InterestReal World ConnectionPS GeneralPS Confidence PS SophisticationSensesMaking/EffortConceptual understandingApplied Conceptual understanding
▪ Positive shifts – 1st quadrant▪ Negative shifts – 3rd quadrant▪ Mixed shifts – 2nd and 4th quadrants
Figure 4-11: Shifts in Opinions of Open-inquiry Students by Subcategory.
Guided-InquiryNormalized Pre/Post Movement
-0.25
-0.13
0.00
0.13
0.25
-0.65 -0.33 0.00 0.33 0.65Normalized Unfavorable Motion
Nor
mal
ized
Fav
orab
le
Mot
ion
OverallAll categoriesPersonal InterestReal World ConnectionPS GeneralPS Confidence PS SophisticationSensesMaking/EffortConceptual understandingApplied Conceptual understanding
▪ Positive shifts – 1st quadrant▪ Negative shifts – 3rd quadrant▪ Mixed shifts – 2nd and 4th quadrants
Figure 4-12: Shifts in Opinions of Guided-inquiry Students by Subcategory
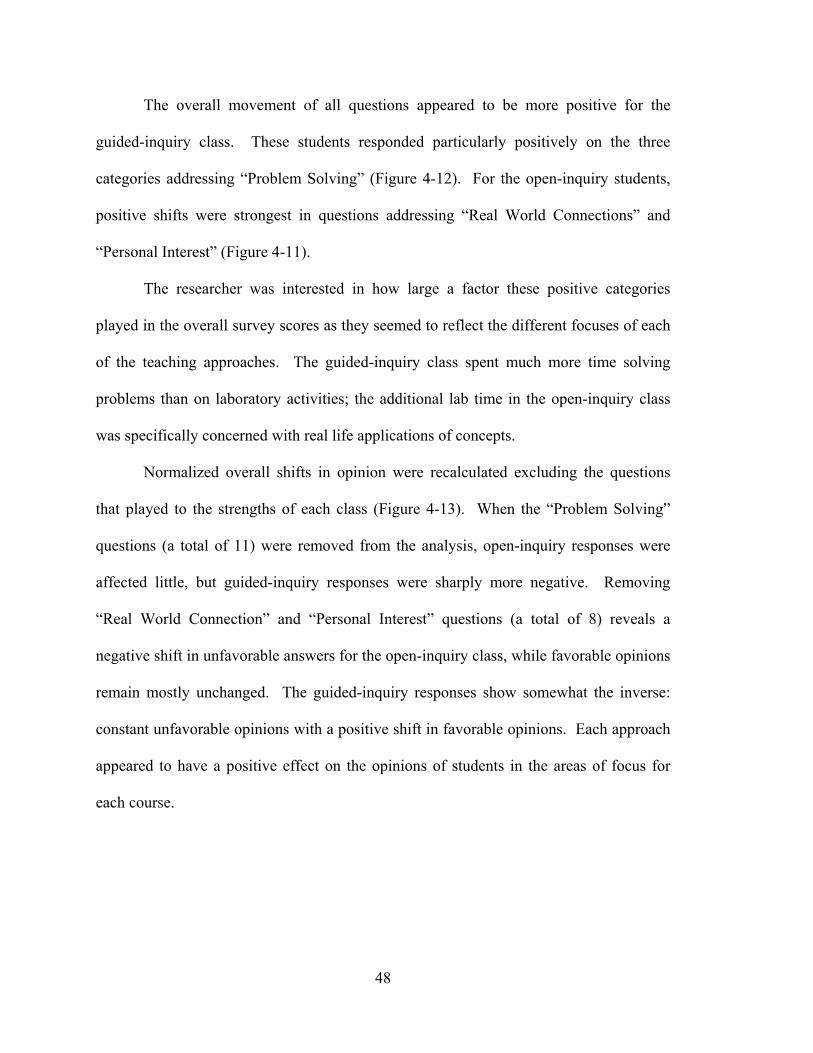
48
The overall movement of all questions appeared to be more positive for the
guided-inquiry class. These students responded particularly positively on the three
categories addressing “Problem Solving” (Figure 4-12). For the open-inquiry students,
positive shifts were strongest in questions addressing “Real World Connections” and
“Personal Interest” (Figure 4-11).
The researcher was interested in how large a factor these positive categories
played in the overall survey scores as they seemed to reflect the different focuses of each
of the teaching approaches. The guided-inquiry class spent much more time solving
problems than on laboratory activities; the additional lab time in the open-inquiry class
was specifically concerned with real life applications of concepts.
Normalized overall shifts in opinion were recalculated excluding the questions
that played to the strengths of each class (Figure 4-13). When the “Problem Solving”
questions (a total of 11) were removed from the analysis, open-inquiry responses were
affected little, but guided-inquiry responses were sharply more negative. Removing
“Real World Connection” and “Personal Interest” questions (a total of 8) reveals a
negative shift in unfavorable answers for the open-inquiry class, while favorable opinions
remain mostly unchanged. The guided-inquiry responses show somewhat the inverse:
constant unfavorable opinions with a positive shift in favorable opinions. Each approach
appeared to have a positive effect on the opinions of students in the areas of focus for
each course.
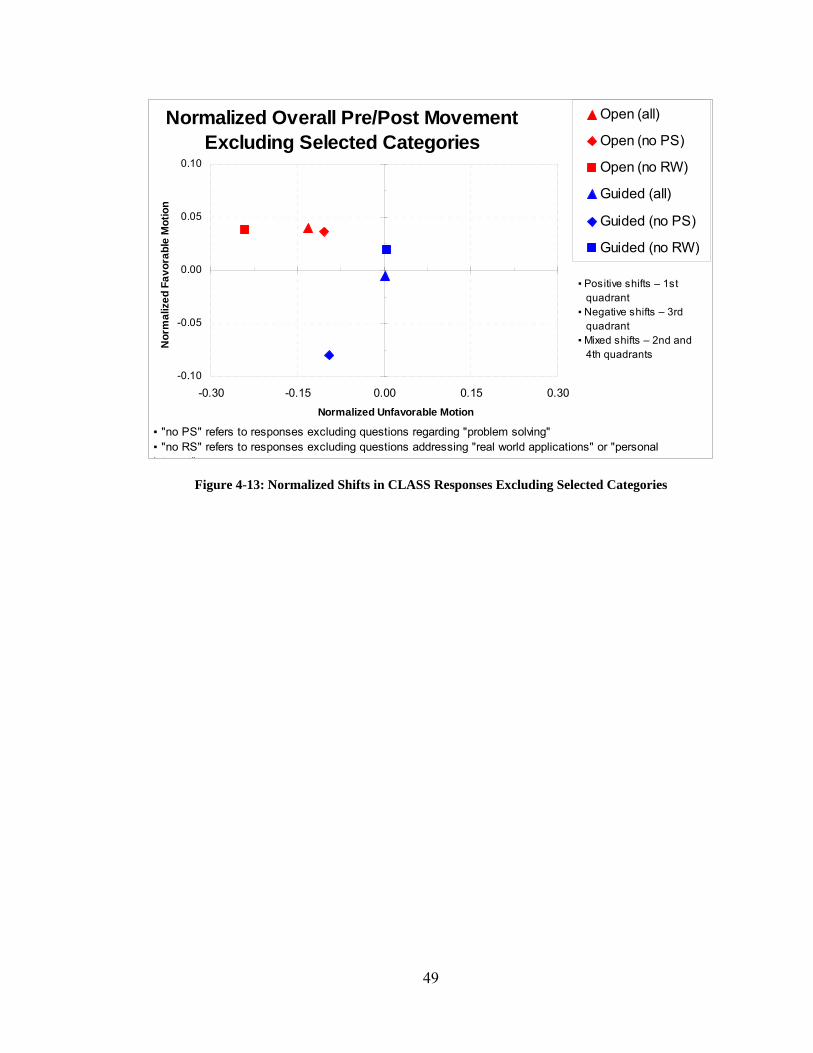
49
Normalized Overall Pre/Post MovementExcluding Selected Categories
-0.10
-0.05
0.00
0.05
0.10
-0.30 -0.15 0.00 0.15 0.30Normalized Unfavorable Motion
Nor
mal
ized
Fav
orab
le M
otio
n
Open (all)
Open (no PS)
Open (no RW)
Guided (all)
Guided (no PS)
Guided (no RW)
▪ Positive shifts – 1st quadrant▪ Negative shifts – 3rd quadrant▪ Mixed shifts – 2nd and 4th quadrants
▪ "no PS" refers to responses excluding questions regarding "problem solving"▪ "no RS" refers to responses excluding questions addressing "real world applications" or "personal i t t"
Figure 4-13: Normalized Shifts in CLASS Responses Excluding Selected Categories

50

51
5 Conclusions
A Comparison of two different student-centered approaches was needed to further
the understanding of the effect of different levels of inquiry on student learning and
attitudes. Five science teachers were surveyed and the classes were given average ratings
of 2.9 and 4.4 (a difference of 1.5) for the guided and open-inquiry approaches on the
science inquiry matrix (Table 1-1). Students in both treatments were drawn from the
same population and were taught by the same instructor. The methods employed were
distinguished as guided-inquiry (MIP) and open-inquiry (Roth), where the primary
difference was the time spent solving computational problems being replaced with lab
investigations that originated with the students. Though time spent on each topic for the
two treatments was not identical, the ordering of content was the same and the pacing
was relatively similar.
5.1 Conclusions Relevant to Research Question 1
The first question was to investigate potential statistically and practically
significant differences in the short-term and long-term scored responses of students in
one type of open and guided-inquiry high school physics classrooms. The guided-inquiry
approach followed the “Modeling Instruction Program” developed at Arizona State
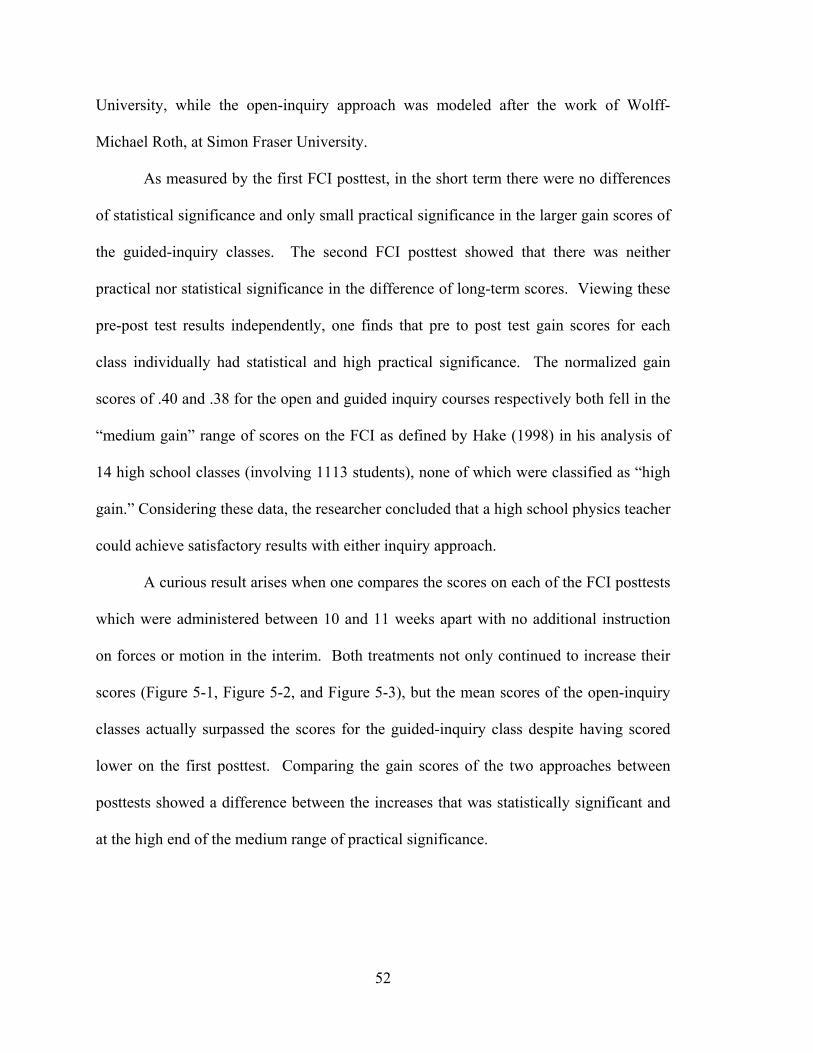
52
University, while the open-inquiry approach was modeled after the work of Wolff-
Michael Roth, at Simon Fraser University.
As measured by the first FCI posttest, in the short term there were no differences
of statistical significance and only small practical significance in the larger gain scores of
the guided-inquiry classes. The second FCI posttest showed that there was neither
practical nor statistical significance in the difference of long-term scores. Viewing these
pre-post test results independently, one finds that pre to post test gain scores for each
class individually had statistical and high practical significance. The normalized gain
scores of .40 and .38 for the open and guided inquiry courses respectively both fell in the
“medium gain” range of scores on the FCI as defined by Hake (1998) in his analysis of
14 high school classes (involving 1113 students), none of which were classified as “high
gain.” Considering these data, the researcher concluded that a high school physics teacher
could achieve satisfactory results with either inquiry approach.
A curious result arises when one compares the scores on each of the FCI posttests
which were administered between 10 and 11 weeks apart with no additional instruction
on forces or motion in the interim. Both treatments not only continued to increase their
scores (Figure 5-1, Figure 5-2, and Figure 5-3), but the mean scores of the open-inquiry
classes actually surpassed the scores for the guided-inquiry class despite having scored
lower on the first posttest. Comparing the gain scores of the two approaches between
posttests showed a difference between the increases that was statistically significant and
at the high end of the medium range of practical significance.
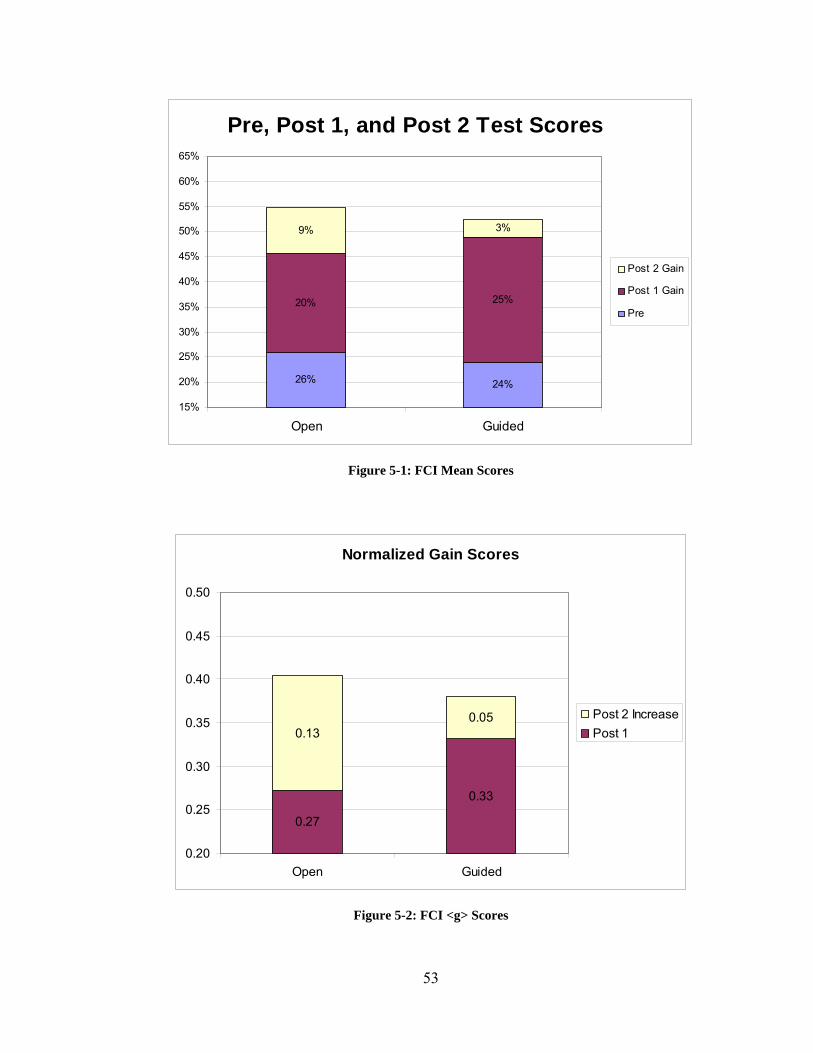
53
Pre, Post 1, and Post 2 Test Scores
26% 24%
20% 25%
9% 3%
15%
20%
25%
30%
35%
40%
45%
50%
55%
60%
65%
Open Guided
Post 2 Gain
Post 1 Gain
Pre
Figure 5-1: FCI Mean Scores
Normalized Gain Scores
0.27
0.33
0.130.05
0.20
0.25
0.30
0.35
0.40
0.45
0.50
Open Guided
Post 2 IncreasePost 1
Figure 5-2: FCI <g> Scores

54
Percent of Students Reaching Newtonian Threshold (60%)
18%
29%
30%17%
0%
10%
20%
30%
40%
50%
60%
Open Guided
Post 2 GainPost 1
Figure 5-3: Student Achieving Newtonian Thinking as Measured by the FCI
The increased scores of both treatments is likely explained by the fact that the
students had a chance to review the content on the FCI before posttest 2 and not before
posttest 1. Additionally, while the content on the FCI was not studied explicitly between
the two posttests, some of the concepts were incorporated in the study of later material.
Yet neither of these explanations addresses the fact that the increase in scores was
significantly greater for the open-inquiry group. This could possibly be the result of a
more structured review experience tying together ideas that had previously remained
somewhat nebular for the open-inquiry students. Also, the instructor did notice a greater
decrease in focus and motivation for the guided-inquiry students as the end of the school
year approached.
55
The CRT (state core) gave a confirmation of the effectiveness of the two inquiry
approaches. Mean percentage scores of 74% and 68% for the open and guided-inquiry
classes were both above the 2007 state and district averages of 63% and 65%, though
comparison should remain cursory as these averages include a much more varied student
population as well as teachers employing a range of methodologies. In comparing the
guided and open-inquiry treatments, the CRT served as a secondary measure of short-
term learning and indicated a greater mean score for the open-inquiry students that was
barely statistically significant and of medium practical significance. While encouraging
to the researcher, the CRT findings taken with the null result of the more robust FCI
exam made it difficult to conclude that one treatment had a more positive effect on scored
responses addressing student understanding of physics concepts.
5.2 Conclusions Relevant to Research Question 2
The second question addressed differences in survey responses regarding student
attitudes towards physics. Both treatments were found to have somewhat unfavorable
effects on students’ opinions: the open-inquiry class increased both in responses agreeing
and disagreeing with the expert opinion, with a greater increase in responses opposite of
the expert. The guided-inquiry class decreased both in responses agreeing and
disagreeing with the expert opinion, with a greater decrease for responses in agreement
with the expert. Additionally, the increases in agreement and disagreement of the open-
inquiry students were greater than the decreases of the guided-inquiry students, indicating
that the open-inquiry treatment had a more polarizing effect on the attitudes of students
towards physics. From these results one may conclude that the open-inquiry class

56
required the students to confront physics in such a way as to lead to stronger opinions
being formed than those of the guided-inquiry students.
Opinions on sub-categories did appear to be influenced by the specific focus of
each class. When removing questions regarding “problem solving” from the guided-
inquiry responses, large shifts in decreased agreement and increased disagreement were
observed. This means that most positive opinions that the guided-inquiry students had
towards physics were related to their confidence in their problem solving abilities.
Similarly, when questions addressing “real world connections” and “personal interest”
were removed from the analysis of open-inquiry responses, a large increase in
disagreement with the expert was found. This would indicate that the progress in
opinions towards physics made by the open-inquiry students dealt with relating physics to
themselves and seeing physics in the world around them. It was thus difficult to conclude
that one treatment had a more positive overall influence on students’ attitudes towards
physics, but it was clear that the differing approaches affected opinions in distinct ways.
5.3 Comparing with Previous Research
The researcher came to similar conclusions as Faulkner (1992) concerning the
learning of students exposed to differing levels of inquiry. Both studies found the
varying levels to be equally effective. The current study did diverge with Faulkner in its
findings relating to changes in student opinions following the treatments. Faulkner
(1992) reported no difference in attitudes whereas the researcher found that students in an
open-inquiry classroom were pushed away from neutral opinions while those in the
guided-inquiry treatment were pushed towards them.

57
5.4 Observations
While finding little of measurable significance in this study, the experience was a
significant one for the instructor and the students participating in the study. When,
comparing the significant time in desks working problems during the guided-inquiry
class with the chaos that often accompanied the planning of a new lab investigation in the
open-inquiry treatment, the researcher was surprised that each class ended up at nearly
the same place academically and that both classes were relatively successful. This result
gave the instructor the freedom to choose a greater diversity of instructional methods
with confidence in their effectiveness. The researcher felt that this was of critical
importance in helping instructors renew their enthusiasm for teaching and avoid
stagnation in a single methodology.
After the experience, the researcher also felt that the question when comparing
student-centered approaches was not so much about how much structure a classroom had,
but more about where the structure was placed in the learning process. Students need to
be given some degree of direction as they are highly unlikely to spontaneously uncover
Newton’s laws of motion. The choice appears to be to let them initially wander a bit and
then formalize and apply their experience, or to teach them new concepts rather directly
followed by giving them the freedom to investigate applications.
5.5 Internal Validity Issues
To increase the validity of this study, a number of variables could have been
controlled more effectively. The fact that the teacher involved was also acting as the
researcher necessarily introduces additional biases into the administration of the
58
treatments as well as the conclusions drawn from the findings. Another difficulty with
the instructor was that he had prior familiarity with the guided-inquiry approach but
absolutely no experience teaching with open-inquiry.
The slight pacing differences of the two treatments meant that both groups did not
spend exactly equal amounts of time on each physics concept. Additionally, there were
a few students who switched from one class to the other and most students were generally
aware that the instructor was employing two different teaching approaches. While data
included only students isolated to one treatment for the entire year, diffusion effects were
possible as the students were located in the same school and likely interacted with
members of the other treatment outside of class.
5.6 Recommendations
While both student-centered approaches were found to adequately teach
introductory physics concepts to high school students in these four classes, the high
school in which this study was conducted serviced an area of high-socioeconomic status
where students generally have a great degree of academic support and motivation.
Similar research in other populations (minority, lower-income, or non-college bound
students) is needed. A population with less academic support might react to the varying
levels of student responsibility completely differently than the students involved in this
study.
It was observed in the open-inquiry classroom of the current study, as in that
conducted by Roth, that considerable time was needed for the students to acclimatize to
the redistribution of responsibilities in the classroom. For this reason, it is suggested that
59
future studies avoid comparison of inquiry levels taught over the short-term. Time must
be given for the students to become enculturated when they are introduced into a new
environment.
Other research might focus more precisely on the qualifications of the teacher.
The physics instructor administering the treatments in this study had no formal training in
either teaching approach. He did have two years experience employing guided-inquiry
methods while having virtually no experience working in an open-inquiry classroom.
Perhaps having a traditional teacher who is not experienced in either approach attempt a
similar experiment would yield more valid results.
The researcher also feels that effective classroom practice is largely dependent on
the subject being taught and the individualities of the teacher (in addition to the student
population). Investigation of differing levels of inquiry in other disciples or within
physics with numerous instructors administering the treatments would continue to probe
the outcomes of student-centered approaches.

60
61
References
Adams, A. D. 1997. Students’ Beliefs, Attitudes, and Conceptual Change in a Traditional and a Constructivistic High School Physics Classroom. Ed. D. diss., University of Houston.
Adams, W. K., K. K. Perkins, N. Podolefsky, M. Dubson, N. D. Finkelstein, and C. E
Wieman. 2006. Phys. Rev ST: Phys. Educ. Res. 2(1). See http://class.colorado.edu
Barrett, K. R., B. L. Bower, and N. C. Donovan. 2007. Teaching Styles of Community
College Instructors. The American Journal of Distance Education 21(1): 37-49. Bencze, J. L. 2000. Democratic constructivist science education: enabling egalitarian
literacy and self-actualization. Journal of Curriculum Studies 32(6): 847-865. Bruner, J. S. 1961. The art of discovery. Harvard Educational Review 31: 21–32. Chall, J. S. 2000. The Academic Achievement Challenge: What Really Works in the
Classroom? New York: Guilford Publications. Chomy, J. J. 1998. Comparison of High School Physics Students’ Achievement in a
Traditional Classroom to Student is a Discovery Based Classroom. Masters thesis, Michigan State University.
Cohen, J. 1988. Statistical power analysis for the behavioral sciences (2nd ed.).
Hillsdale, NJ: Erlbaum. Costenson, K., and A.E Lawson. 1986. Why isn’t inquiry used in more classrooms? The
American Biology Teacher 48(3): 150-158. Cronbach, L. J., and R. E. Snow. 1977. Aptitudes and instructional methods: A
handbook for research on interactions. New York: Irvington. Dana, L. A. 2001. The Effects of the Level of Inquiry of Situated Secondary Science
Laboratory Activities on Students’ Understanding of Concepts and the Nature of Science, Abilities to use Process Skills and Attitudes Toward Problem Solving. Ph. D. diss., University of Massachusetts Lowell.

62
Dykstra, D. I. Jr. 2005. Teaching Introductory Physics to College Students. Edited by
C. T. Fosnot. Constructivism Theory, Perspectives, and Practice. New York: Teachers College Press.
Ellis, E. S., L. A. Worthington, and M. J. Larkin. 1994. Research Synthesis on Effective
Teaching Principles and the Desighn of Quality Tools for Educators: National Center to Improve the Tools of Educators. EDRS, ED 386 854.
Faulkner, S. P. 1992. The influence of instructional strategy on cell concept learning and
science attitude by fifth and sixth-grade children. Ph. D. diss, University of Southern Mississippi.
Fielding, G. D., E. Kameenui, and R. Gersten. 1983. A Comparison of an Inquiry and a
Direct Instruction Approach to Teaching Legal Concepts to Secondary School Students. Journal of Educational Research 76(5): 287-293.
Foos, A. 2003 Linking the level of inquiry (guided versus open) to learning objectives.
Presentation at the 37th Annual Meeting of the North-Central Section of the Geological Society of America, March 24-25.
Fradd, S. H., O. Lee, F. X. Sutman, and M. K. Saxton, 2001. Promoting science literacy
with English language learners through instructional materials development: A case study. Bilingual Research Journal 25(4): 479-501.
Fosnot, C. T., ed. 2005. Constructivism Theory, Perspectives, and Practice. New York:
Teachers College Press. Hake, R. 1998. Interactive-engagement versus traditional methods: A six-thousand-
student survey of mechanics test data for introductory physics courses. American Journal of Physics 66(1): 64-74.
Hestenes, D., M. Wells, and G. Swackhamer. 1992. Force concept inventory. Physics
Teacher 30: 141-158. Kirschner, P. A., J. Sweller, and R. E. Clark. 2006. Why minimal guidance during
instruction does not work: an analysis of the failure of constructivist, discovery, problem-based, experiential, and inquiry-based teaching. Educational Psychologist 41(2): 75–86.
Klahr, D., and M. Nigam. 2004. The equivalence of learning paths in early science
instruction: Effects of direct instruction and discovery learning. Psychological Science 15: 661–667.
63
Maor, D. 1991. Development of student inquiry skills: A constructivist approach in a computerized classroom environment. Paper presented at the Annual Meeting of the National Association for Research in Science Teaching, Lake Geneva, WI.
Mayer, R. 2004. Should there be a three-strikes rule against pure discovery learning?
The case for guided methods of instruction. American Psychologist 59: 14–19. McDermott, L. C. and the Physics Education Group at the University of Washington.
1996. Physics by Inquiry. Vol. 1,2. New York: John Wiley and Sons, Inc. McDermott, L. C. and the Physics Education Group. 1996. Physics by Inquiry. Seattle,
WA:University of Washington. On-line. Available from Internet, http://www.phys.washington.edu/groups/peg/pbi.html, accessed 14 July 2008.
Modeling Instruction Program, Arizona State University. 2002. Index of /Modeling-
pub/Mechanics_curriculum. On-line. Available from Internet, http://modeling.asu.edu/Modeling-pub/Mechanics_curriculum/, accessed 25 June 2008.
National Research Council. 1996. National Science Education Standards. Washington,
DC: National Academy Press. Papert, S. 1980. Mindstorms: Children, computers, and powerful ideas. New York:
Basic Books. Porter, A.C., B.F. Birman, and M. S. Garet. 2000. Does Professional Development
Change Teaching Practice? Results From a Three-Year Study. See "Executive Summary."
Roth, W. M. 1994. Experimenting in a Constructivist High School Physics Laboratory.
Journal of Research in Science Teaching, 31(2): 197-223. Roth, W. M. Email to author. 16 July 2007. Shulman, L., and E. Keisler, eds. 1966. Learning by discovery: A critical appraisal.
Chicago: Rand McNally. Steffe, L., and J. Gale, eds. 1995. Constructivism in education. Hillsdale, NJ: Lawrence
Erlbaum Associates, Inc. Sweller, J. 2003. Evolution of human cognitive architecture. Edited by B. Ross. Vol.
43, The psychology of learning and motivation. San Diego, CA: Academic. Trowbridge, L. W., R. W. Bybee, and J. C. Powell. 2000. Teaching Secondary School
Science: Strategies for Developing Scientific Literacy. New Jersey: Prentice-Hall.

64
von Glaserfeld, E. 2005. Introduction: Aspects of Constructivism. Constructivism
Theory, Perspectives, and Practice. Edited Catherine Twomey Fosnot. New York: Teachers College Press.
Walker, M. 2007. Teaching inquiry-based science. Online teaching manual. Available
from Internet, http://worlddeer.org/Markwalker/, accessed 6 June 2008.

65
APPENDICES

66
67
Appendix A. MIP Lab Sample
Modified Atwood's machine lab
Apparatus wheeled carts dynamics carts glider wood ramps PASCO tracks airtracks pulleys with clamps balance for mass measurement hangers for slotted weights (or equivalent) spring scales (newton calibration) photogates ULI Timer, Logger Pro, or Data Studio software Graphical Analysis
Pre-lab discussion • Allow a suspended mass to tow a cart (glider) across the track; ask
students to observe its motion. We've already established that a force is required to produce an acceleration. We just haven't quantified the relationship. Rather than brainstorming general observations, ask them to identify other factors that might affect the acceleration of the cart. To proceed, the list must include mass, amount of friction, and amount of force used to tow cart.
• Ask them for ideas on how to minimize the effect of friction. After some discussion, they will hopefully come to the idea of inclining the ramp slightly to compensate for friction.
• Ask them how to measure the acceleration of the cart. While they cannot measure it directly, there are at least two ways to do determine the acceleration. One can calculate it from rearrangement of the kinematical model Δx = 1
2 at2 . (Note: The use of this model requires the assumption that acceleration is constant. The rationale for such an assumption could be based on an "extra credit" lab.) Another method is to allow a picket fence affixed to the cart to pass through a photogate. The slope of the velocity vs time graph yields the acceleration.
• The dependent variable is the acceleration of the cart. • The independent variables are the mass of the cart/hanger system and the
force used to pull the cart.

68
• Make sure to stress that the mass that is being accelerated is the total mass of the system (the cart and hanging mass are connected, so must accelerate at the same rate).
Lab performance notes • Use small mass hangers (e.g. 5g) and change by 10 to 20g increments. • Increase cart mass by 0.2 - 0.5 kg increments. • Adjust the angle of incline so that the cart can move at a constant speed
with a very small initial push. • Convince students that they must transfer mass from the cart to the hanger
in order to keep the total mass constant when they vary the force. • Convert the hanging mass to newtons. • See sample graphs in Figures 1, 2, and 3.
Figure 1 Figure 2 Figure 3
Post-lab discussion • Since the units of slope are not intuitive, focus on proportionalities. • Discuss the combination of two proportionalities into one:
a∝Fnet a∝1m
⇒ a∝Fnet
m
• Turn the proportionality into an equation; rearrange to solve for k.
a = kFnet
m⇒ k =
maFnet
• Substitute values from regression line to solve for k. With luck, students'
values should cluster around 1.0. Now is the time to point out that the slope of force of gravity vs mass (9.8 N/kg) and the slope of velocity vs time (9.8 m/s2 ) have the same numerical value due to the way the newton was defined.
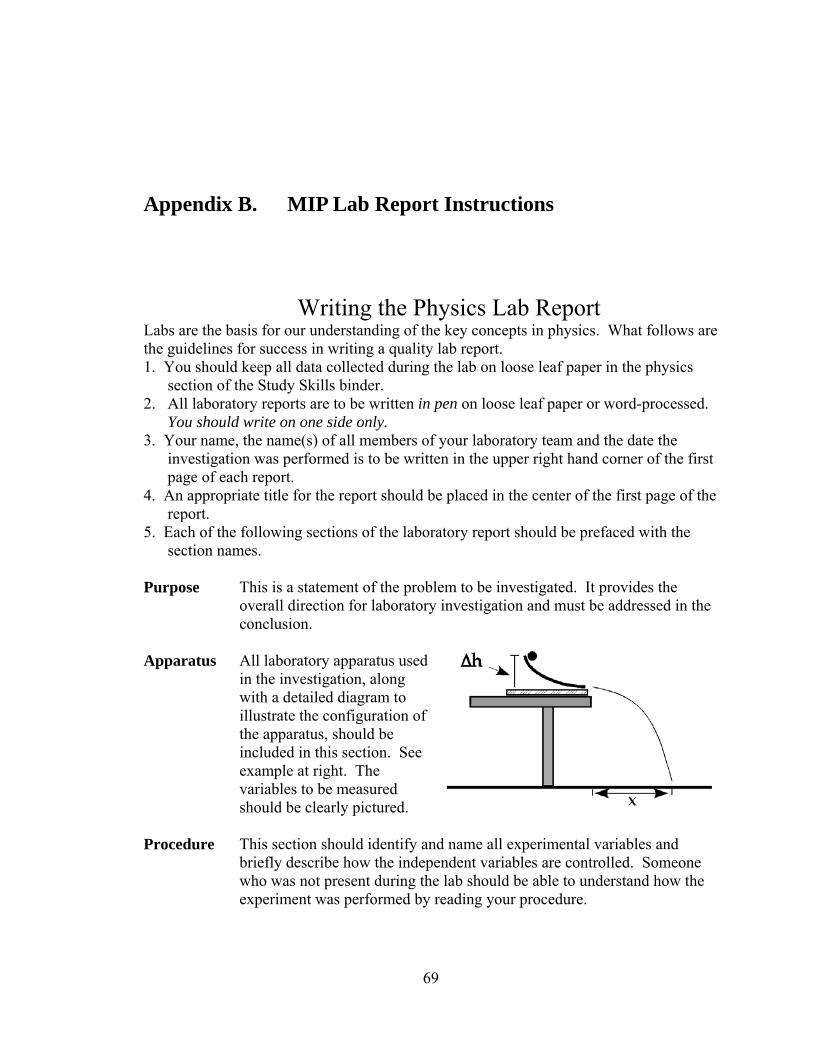
69
Appendix B. MIP Lab Report Instructions
Writing the Physics Lab Report Labs are the basis for our understanding of the key concepts in physics. What follows are the guidelines for success in writing a quality lab report. 1. You should keep all data collected during the lab on loose leaf paper in the physics
section of the Study Skills binder. 2. All laboratory reports are to be written in pen on loose leaf paper or word-processed. You should write on one side only. 3. Your name, the name(s) of all members of your laboratory team and the date the
investigation was performed is to be written in the upper right hand corner of the first page of each report.
4. An appropriate title for the report should be placed in the center of the first page of the report.
5. Each of the following sections of the laboratory report should be prefaced with the section names.
Purpose This is a statement of the problem to be investigated. It provides the
overall direction for laboratory investigation and must be addressed in the conclusion.
Apparatus All laboratory apparatus used in the investigation, along with a detailed diagram to illustrate the configuration of the apparatus, should be included in this section. See example at right. The variables to be measured should be clearly pictured.
Procedure
This section should identify and name all experimental variables and briefly describe how the independent variables are controlled. Someone who was not present during the lab should be able to understand how the experiment was performed by reading your procedure.
70
Data Data consists only of those values measured directly from the experimental apparatus. No values obtained by way of mathematical manipulations or interpretations of any kind may be included in this section of the report. Data should consist of as many trials as judgement would indicate necessary. The units for physical measurements (kg, m, s, etc.) in a data table should be specified in column heading only.
Evaluation of Data
This section should include all graphs, analysis of graphs, and post laboratory calculations. State each formula, and if necessary, identify the symbols used in the formula. If repetitive calculations are to be performed, substitute only one set of data into each formula and then construct a table of values for all additional calculated values. Be certain that your final calculated values are expressed to the correct number of significant figures. Do not show your arithmetic calculations.
Conclusion In the conclusion you must do the following: a) State the relationship between the variables identified in the purpose in
a clear, concise English sentence. b) When a mathematical expression can be derived from graphical
analysis, write it, making sure to include the appropriate units. State the meaning of the slope and discuss the significance of the y-intercept (when appropriate).
c) Describe any new terms that arise as a result of your evaluation of data.
d) When your results differ from what is expected, provide a plausible explanation.
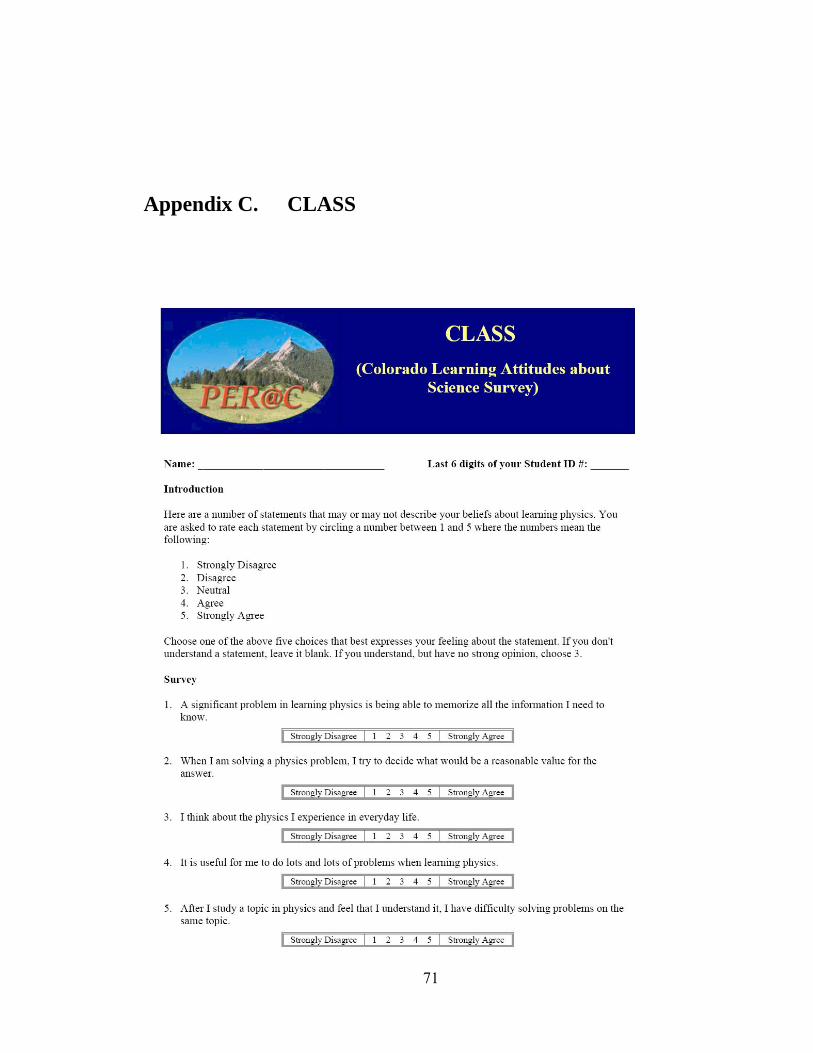
71
Appendix C. CLASS

72
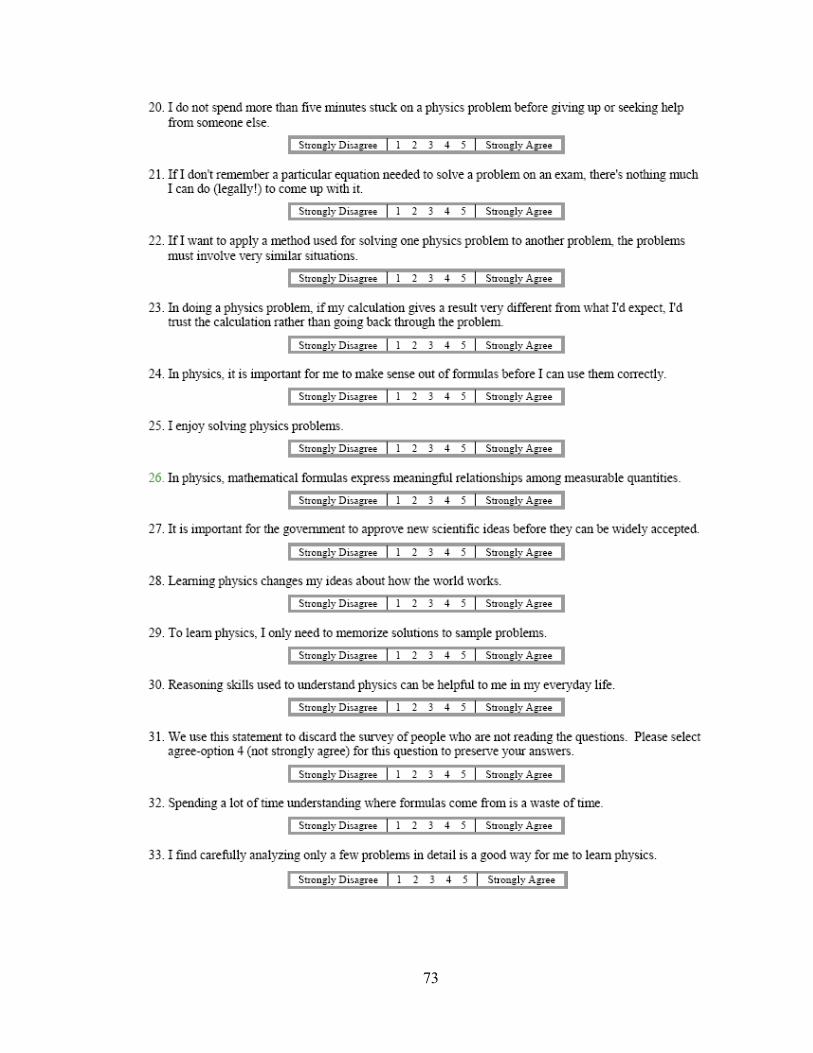
73
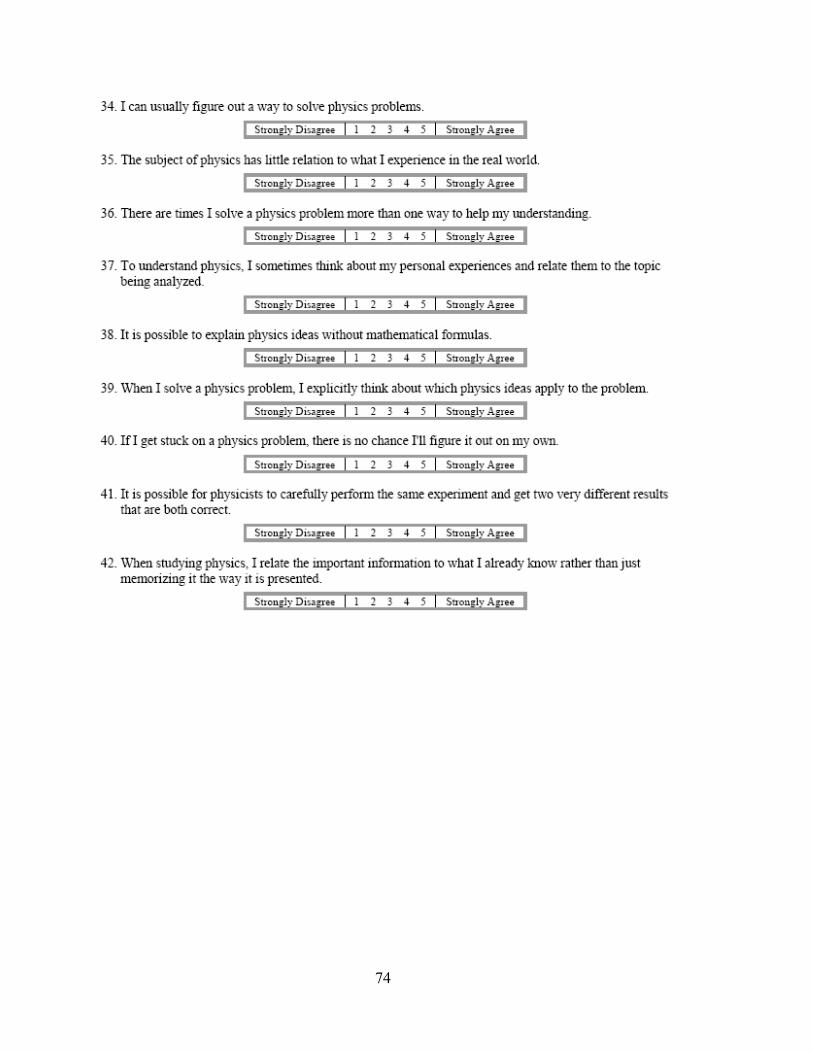
74

75
Appendix D. CLASS Expert Responses
Question Expert Opinion
1. A significant problem in learning physics is being able to memorize all the information I need to know.
Disagree
2. When I am solving a physics problem, I try to decide what would be a reasonable value for the answer.
Agree
3. I think about the physics I experience in everyday life. Agree
4. It is useful for me to do lots and lots of problems when learning physics. N/A
5. After I study a topic in physics and feel that I understand it, I have difficulty solving problems on the same topic.
Disagree
6. Knowledge in physics consists of many disconnected topics. Disagree
7. As physicists learn more, most physics ideas we use today are likely to be proven wrong.
N/A
8. When I solve a physics problem, I locate an equation that uses the variables given in the problem and plug in the values.
Disagree
9. I find that reading the text in detail is a good way for me to learn physics. N/A
10. There is usually only one correct approach to solving a physics problem. Disagree
11. I am not satisfied until I understand why something works the way it does. Agree
12. I cannot learn physics if the teacher does not explain things well in class. Disagree
13. I do not expect physics equations to help my understanding of the ideas; they are just for doing calculations.
Disagree
14. I study physics to learn knowledge that will be useful in my life outside of school.
Agree
15. If I get stuck on a physics problem on my first try, I usually try to figure out a different way that works.
Agree
16. Nearly everyone is capable of understanding physics if they work at it. Agree
17. Understanding physics basically means being able to recall something you've read or been shown.
Disagree
18. There could be two different correct values for the answer to a physics problem if I use two different approaches.
Disagree
19. To understand physics I discuss it with friends and other students. Agree
20. I do not spend more than five minutes stuck on a physics problem before giving up or seeking help from someone else.
Disagree
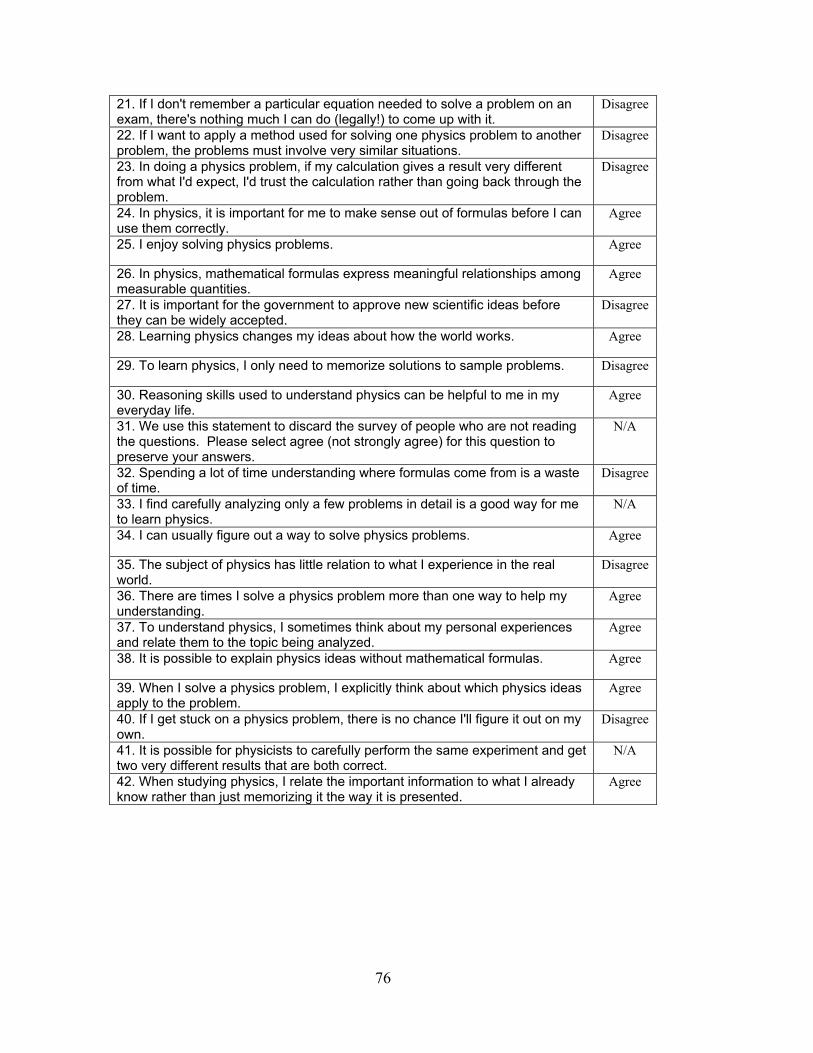
76
21. If I don't remember a particular equation needed to solve a problem on an exam, there's nothing much I can do (legally!) to come up with it.
Disagree
22. If I want to apply a method used for solving one physics problem to another problem, the problems must involve very similar situations.
Disagree
23. In doing a physics problem, if my calculation gives a result very different from what I'd expect, I'd trust the calculation rather than going back through the problem.
Disagree
24. In physics, it is important for me to make sense out of formulas before I can use them correctly.
Agree
25. I enjoy solving physics problems. Agree
26. In physics, mathematical formulas express meaningful relationships among measurable quantities.
Agree
27. It is important for the government to approve new scientific ideas before they can be widely accepted.
Disagree
28. Learning physics changes my ideas about how the world works. Agree
29. To learn physics, I only need to memorize solutions to sample problems. Disagree
30. Reasoning skills used to understand physics can be helpful to me in my everyday life.
Agree
31. We use this statement to discard the survey of people who are not reading the questions. Please select agree (not strongly agree) for this question to preserve your answers.
N/A
32. Spending a lot of time understanding where formulas come from is a waste of time.
Disagree
33. I find carefully analyzing only a few problems in detail is a good way for me to learn physics.
N/A
34. I can usually figure out a way to solve physics problems. Agree
35. The subject of physics has little relation to what I experience in the real world.
Disagree
36. There are times I solve a physics problem more than one way to help my understanding.
Agree
37. To understand physics, I sometimes think about my personal experiences and relate them to the topic being analyzed.
Agree
38. It is possible to explain physics ideas without mathematical formulas. Agree
39. When I solve a physics problem, I explicitly think about which physics ideas apply to the problem.
Agree
40. If I get stuck on a physics problem, there is no chance I'll figure it out on my own.
Disagree
41. It is possible for physicists to carefully perform the same experiment and get two very different results that are both correct.
N/A
42. When studying physics, I relate the important information to what I already know rather than just memorizing it the way it is presented.
Agree
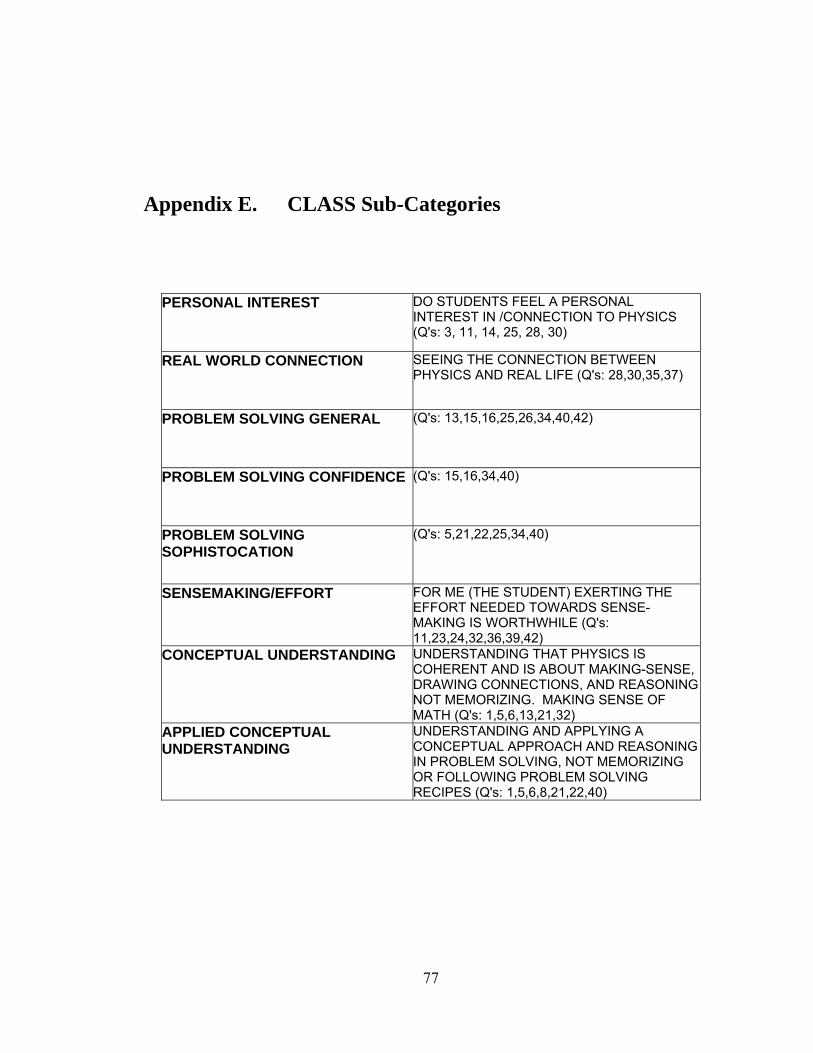
77
Appendix E. CLASS Sub-Categories
PERSONAL INTEREST DO STUDENTS FEEL A PERSONAL INTEREST IN /CONNECTION TO PHYSICS (Q's: 3, 11, 14, 25, 28, 30)
REAL WORLD CONNECTION SEEING THE CONNECTION BETWEEN PHYSICS AND REAL LIFE (Q's: 28,30,35,37)
PROBLEM SOLVING GENERAL (Q's: 13,15,16,25,26,34,40,42)
PROBLEM SOLVING CONFIDENCE (Q's: 15,16,34,40)
PROBLEM SOLVING SOPHISTOCATION
(Q's: 5,21,22,25,34,40)
SENSEMAKING/EFFORT FOR ME (THE STUDENT) EXERTING THE EFFORT NEEDED TOWARDS SENSE-MAKING IS WORTHWHILE (Q's: 11,23,24,32,36,39,42)
CONCEPTUAL UNDERSTANDING UNDERSTANDING THAT PHYSICS IS COHERENT AND IS ABOUT MAKING-SENSE, DRAWING CONNECTIONS, AND REASONING NOT MEMORIZING. MAKING SENSE OF MATH (Q's: 1,5,6,13,21,32)
APPLIED CONCEPTUAL UNDERSTANDING
UNDERSTANDING AND APPLYING A CONCEPTUAL APPROACH AND REASONING IN PROBLEM SOLVING, NOT MEMORIZING OR FOLLOWING PROBLEM SOLVING RECIPES (Q's: 1,5,6,8,21,22,40)

78
79
Appendix F. Physics Final Review
I. General Motion
a. Position – your location b. Distance – how far you have gone c. Displacement – how far you have gone and in what direction d. Speed – how fast your location is changing e. Velocity – how fast your location is changing and in what direction f. Acceleration – how fast your velocity is changing
i. There is acceleration when you 1. speed up 2. slow down 3. change direction
II. Newton’s Laws of Motion
a. 1st – An object in motion will remain in motion (or an object at rest will remain at rest) unless acted on by a net force
i. If forces are balanced (Fnet=0), the motion of an object does not change. It will be either:
1. at rest (not moving) 2. moving, but at a constant speed
b. 2nd
i. If forces are unbalanced (Fnet≠0), the object will accelerate (speed up or slow down)
1. How much it accelerates depends on the mass of the object and the strength of the force (F=ma)
c. 3rd – For every action there is an equal and opposite reaction i. All forces are an interaction between two objects. Each object
pushes or pulls on the other with the same amount of force, but in the opposite direction
III. Identifying Forces
i. Any objects that are touching will exert forces on each other ii. A few forces can act without objects touching (gravity,
electromagnetic forces) iii. Mass vs. Weight
1. Mass is how much stuff (matter) there is, it does not change (you have the same mass on the moon)
80
Fg
2. Weight is how much gravity is pulling on your mass (Fg), it does change if you leave Earth (you weigh less on the moon)
iv. Net Force (Fnet) - what is left over after subtracting forces in opposite directions
v. Friction 1. Two types:
a. static friction – keeps objects that are not moving from starting to move (eg – a car parked on a hill)
i. can vary depending on the force trying to move the object
b. kinetic friction – slows down moving objects, always pushes in the direction opposite of motion
i. is constant for given surfaces, doesn’t change with increased speed
2. The strength of both types are determined by the types of surfaces involved (given by μ) and how hard the surfaces are pushing on each other (given by FN)
IV. Circular Motion
a. All objects travelling in a circle are accelerating because their direction is changing
i. The direction of the acceleration is always towards the center of the circle
b. All objects travelling in a circle have a Fnet acting towards the center of the circle
i. This force pushing/pulling towards the center is known as the centripetal force
ii. If the centripetal force is removed, the object will immediately travel in a straight line
V. Projectiles
a. When an object is moving in 2 dimensions, you can treat each dimension completely separately
b. With negligible (so small it can be ignored) air resistance, a projectile has no forces acting on it in the horizontal (X) direction, and only gravity acting on it in the vertical (Y) direction
c. The force diagram for every projectile is:
d. Every projectile has constant velocity (no acceleration) in the horizontal direction and constant acceleration (due to gravity) in the vertical direction
e. All projectiles follow parabolic paths f. All projectiles fall at the same rate, regardless of mass or horizontal
velocity