Embed Size (px)
Citation preview

COMPARISON OF FACIAL FEATURE EXTRACTION ON
STRESS AND NORMAL USING PRINCIPAL COMPONENT
ANALYSIS METHOD
(CASE STUDY OF INFORMATICS ENGINEERING STUDENTS
BATAM STATE POLITECHNICAL)
Mira Chandra Kirana, S.T., M.T*, Yogsal Ramadhan Putra
*
*Batam State Polytechnic
Informatics Engineering Program
Parkway Street, Batam Centre, Batam 29461, Indonesia
E-mail: [email protected], [email protected]
Abstract
Face is included in one person's biometric characteristics that are unique. By looking at a person's face can be known
whether stress or not. To determine the value of the stress on the face we conducted a comparative analysis of the
extracted facial features between normal face and stress face using image processing technology.
This study using Principal Component Analysis method used for extraction of features so we can know the features
of each facial image data. To identify the facial image stres and image normal we researchers used questionnaires
Depression Anxiety Stress Scale (DASS). At the final stage of the comparison of the extracted face normal and
stress. The results of the analysis graph of the image data on the face that stress has a percentage above average
image amounted to 50.38% and the percentage below the average image amounted to 49.63%, while the data of face
images normal have a percentage above average image to 43.81% and the percentage image below the average to
56.19%.
Keyword: Feature Extraction, image processing, Principal Component Analysis, Depression Anxiety Stress
Scale.
1 Introduction
Student is a person who is in the process of studying
and enrolled is undergoing education in one form of
college consisting of academic, polytechnic, high
school, institute and university [1]. Students are also
required to complete their studies within the time
specified in each college. It also applies to students
majoring in Informatics Engineering studying at the
State Polytechnic of Batam.
The fact to complete the study at Batam State
Polytechnic is not easy, so the students are asked to
keep learning harder. The one of the requirements for
graduation of D3 and D4 program of Informatics
Engineering Department in Batam State Polytechnic is
complete the final project. Students are advised to
complete it within 1 (one) semester. In the final stages,
students will face trial as a determinant of the end of
this course. If the student does not pass the hearing then
it must repeat. That is one of the reasons why students
can not complete the study on time because they have
to repeat the course of this Final Project.
From the level of the number of graduates of students
majoring in regular Informatics Engineering and
employees who take the final course. Students of
Informatics Engineering in the year 2013/2014 who
follow the final assignment are 250, 230 graduated
with 92% graduation rate, and 2014/2015 year is 249,
graduated 212 with graduation rate 85,2%, and year
2015 / 2016 totaled 250, graduated amounted to 209
with a pass rate of 83.6%. Based on these data it can be

concluded that the level of the number of graduates of
students majoring in Informatics Engineering from the
year 2013/2014 to 2015/2016 decreased by 8.4%.
According to Dwi Ninda, a student of Informatics
Engineering class of 2013 said that obstacles or
difficulties when doing the final assignment are lack of
time management, lack of understanding on chosen
method, fear of meeting with supervisor, and difficult
in algorithm implementation. Students also often avoid
the process of guidance due to lack of ready work of
the Final Project. This problem is included in one of the
indications of stress symptoms that are often
experienced by the final grade students.
To identify end-stage students who are under stress
Then the required comparison of the results of the
results of experiencing stress and normal use of image
processing technology (image processing) on the
image of the student's face by the method of Principal
Component Analysis (PCA). Principal Component
Analysis (PCA) is a technique that can be used for face
recognition and pattern recognition of an image [2].
First discovered by Karl Pearson in 1901 and used in
the field of biology. For validation of stress
determination and normal use of questionnaires
Depression Anxiety Stress Scale (DASS). DASS is a
set of subjective scale to measure the emotional state of
depression, anxiety, and stress. DASS using standard
instruments with depression alpha coefficient 0.947,
0.0897 anxiety and stress 0.933 so that the instrument
is reliable. [3]
2 Basic Theory
A. Measurement Scale DASS (Depression Anxiety
Stress Scale)
Dass Measurement Scale (Depression Anxiety Stress
Scale) were pioneered by Lovibond (1995) [4] is tools
that have been standard and does not need to test its
validity again. DASS consists of 42 items of questions
that describe the level of stress and anxiety. DASS is a
set of three self-report scales designed to measure the
negative emotional state of depression, anxiety and
stress. The DASS is built not only as a set of scales to
measure the conventionally defined emotional state,
but to advance the process of defining, understanding,
and measuring the ubiquitous and clinically significant
emotional states typically described as depression,
anxiety and stress.
B. Digital Image
Digital images are representative of the image taken by
the machine with the approach based on sampling and
quantization. The sampling states the size of the boxes
arranged in rows and columns. In other words, the
sampling in the image stating the size of the size of the
pixels (dots) in the image, and the quantization declare
the value of the brightness levels are expressed in terms
of gray level (grayscale) in accordance with the total of
binary bits used by the machine, in other words
quantization on image Indicates the number of colors
present in the image. [5]
C. Image processing
Image processing (Image Processing) is the process of
taking the pixels in a digital image for a particular
purpose. At the beginning of this image processing is
done to improve the image quality, but with the
development of the computing world is characterized
by the increasing capacity and speed of computer
processes and the emergence of computing sciences
that allow humans to retrieve information from an
image. [6]
D. Feature Extraction
Feature Extraction or retrieval feature extraction is a
characteristic or feature of the image that will be the
value obtained will be analyzed for further processing
[7]. Feature extraction is done by counting the number
of dots or pixels encountered in each check, which
checks carried out in various directions tracing checks
on the Cartesian coordinates of the digital image is
analyzed, namely vertical, horizontal, right diagonal
and left diagonal. Extraction features tend to identify
traits that can form a good representation of objects, so
as to distinguish between categories of objects with
variations in tolerance. [8]
E. Principal Component Analysis
Principal Component Analysis (PCA) or
Karhunen-Loeve transformation is a classical linear
technique for reducing data dimensions. [9] The PCA
technique selects an optimal base that can be used to
represent an image vector given by the eigenspace

formed from nonzero eigen values of the covariance
matrix of the entire image. Using a base formed by the
eigenspace can be done dimensional reduction by
performing a linear transformation of a space
Dimension into a lower space dimension. To determine
the lower dimension with minimum error, information
loss can be done by selecting the largest number of
eigenvalues from the high-dimensional space. This
stage is a general description of a method called
Principal Component Analysis. [10]
Figure 1 PCA Feature Extraction Algorithm
Figure 1 is a Principal Component Analysis algorithm
used for face recognition as the image feature
extraction training data.
3 Research Methodology
A. Research Design
Figure 2 Flow of Research Process
Figure 2 shows that this research process starts from
a. Literature Collection
At this stage collect literature related to the
problems it has to assist in supporting the process
of building and designing the system so it can run
well.
b. Problem Analysis
At this stage mengalilis problems about stress that
occurs in students majoring in Informatics
Engineering Piliteknik Negeri Batam. The
method used is DASS questionnaire.
c. Analysis and Design Research
At this stage begin to analyze and design with
certain considerations for easy to use and
understood by the user.
d. Implementation
At this stage, the implementation of the results of
the analysis and design into a system. The
following process flow or flowchart.
Figure 3 Flow Implementation
Figure 3 shows that in order to perform feature
extraction process on the system begins by reading the
facial image of the normal stress and then detects faces
and doing cropping face. The next stage converts RGB
values 24-bit color to grayscale having 8-bit color.
After going through the earlier stages (pre - processing)
and then do the facial feature extraction using principal
component analysis method. The last stage is to
compare the results of facial expressions of facial
features of students who are identified stress and
normal.

e. Testing
At this stage of testing in order to identify any
problems or errors that occur in the system so it
can run as expected.
f. Results and Evaluation Analysis
At this stage, the comparative analysis of the
facial features of facial features between the
identified face image and the stress and normal.
g. Withdrawal Conclusion
At this stage obtained the results so that the
comparison can be concluded and the success rate
of the system in the wake.
B. Hardware and Software
The hardware and software used in this study was
1. Hardware; Intel (R) Core ™ i7-4510U CPU @
2.00GHz, 8GB DDR3 RAM Memory, 1 TB hard
drive and screen settings with 1366x768 resolution.
2. Software; Windows 10, Ms. Excel 2016, Ms. Word
2016 and Matlab R2015a.
C. Population and Sample
Population is the whole subject or the totality of
research subjects that can be people, objects, or
something in which can be obtained and or can provide
information (data) research. The sample is part of the
number and characteristics possessed by that
population, or a small portion of the population
members taken according to certain procedures so as to
represent the population.
1. Population
The population in this study are all final year
students majoring in Informatics Engineering
State Polytechnic of Batam.
2. Sample
Sampling using accidental sampling technique
where the sampling is done by taking the case or
the respondent who happen to be there for 3
weeks in September 2016 which was in Batam
Polytechnic Campus. Based on these findings
obtained the number of respondents as many as
80 students.
D. Materials Research
The material of this research is the image of the final
student level of Informatics Engineering Department
of Batam State Polytechnic with resolution 2304x4096
stored in jpeg format.
E. Data Collection Technique
Data collection techniques is a way used by researchers
to obtain data in a study. In this study used data
collection techniques by means of questionnaires and
documentation.
1. Questionnaire
Questionnaires that contain questions to explore
stress on final-level students of informatics
techniques of the Batam State Polytechnic. This
questionnaire measured using 42 Depression
Anxiety Stress Scale (DASS 42) from Lovibond
and Lovibond (1995). Questionnaires of 42
questions with choice never, sometimes, often and
always, but in this study only selected
questionnaires that measure the stress of a number
of 14 questions. So that later this questionnaire
data will be calculated value and categorized
between student’s stress and normal.
2. Face Image Taking
Facial image acquisition during and after the
students fill out a questionnaire DASS. Where
distance of respondent with camera as far as 1
(one) meter with ordinary face expression is flat.
F. Data Processing Technique
Based on the data or research material that is obtained
in the form of 40 images of faces of students who
identified stress and 40 images of faces of students who
are identified as normal. The data will then be
processed or processed using Matlab to obtain the
feature extraction results in each image.
Here's the flow of data processing:
1. Pre-Processing
At this stage, the initial image of the face will be put
into matlab then the image of the detected face with
Viola-Jones method. Once a face is detected, crop and
change the face of this type of RGB to Grayscale types.
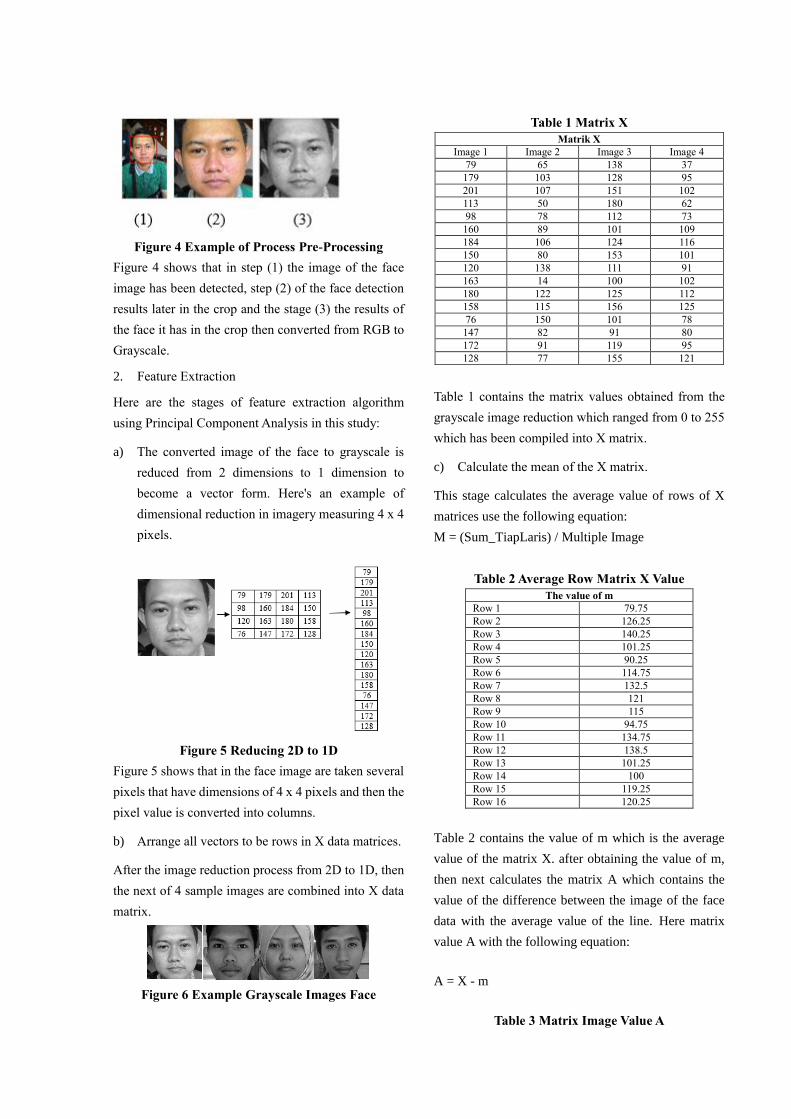
Figure 4 Example of Process Pre-Processing
Figure 4 shows that in step (1) the image of the face
image has been detected, step (2) of the face detection
results later in the crop and the stage (3) the results of
the face it has in the crop then converted from RGB to
Grayscale.
2. Feature Extraction
Here are the stages of feature extraction algorithm
using Principal Component Analysis in this study:
a) The converted image of the face to grayscale is
reduced from 2 dimensions to 1 dimension to
become a vector form. Here's an example of
dimensional reduction in imagery measuring 4 x 4
pixels.
Figure 5 Reducing 2D to 1D
Figure 5 shows that in the face image are taken several
pixels that have dimensions of 4 x 4 pixels and then the
pixel value is converted into columns.
b) Arrange all vectors to be rows in X data matrices.
After the image reduction process from 2D to 1D, then
the next of 4 sample images are combined into X data
matrix.
Figure 6 Example Grayscale Images Face
Table 1 Matrix X Matrik X
Image 1 Image 2 Image 3 Image 4
79 65 138 37
179 103 128 95
201 107 151 102
113 50 180 62
98 78 112 73
160 89 101 109
184 106 124 116
150 80 153 101
120 138 111 91
163 14 100 102
180 122 125 112
158 115 156 125
76 150 101 78
147 82 91 80
172 91 119 95
128 77 155 121
Table 1 contains the matrix values obtained from the
grayscale image reduction which ranged from 0 to 255
which has been compiled into X matrix.
c) Calculate the mean of the X matrix.
This stage calculates the average value of rows of X
matrices use the following equation:
M = (Sum_TiapLaris) / Multiple Image
Table 2 Average Row Matrix X Value
The value of m
Row 1 79.75
Row 2 126.25
Row 3 140.25
Row 4 101.25
Row 5 90.25
Row 6 114.75
Row 7 132.5
Row 8 121
Row 9 115
Row 10 94.75
Row 11 134.75
Row 12 138.5
Row 13 101.25
Row 14 100
Row 15 119.25
Row 16 120.25
Table 2 contains the value of m which is the average
value of the matrix X. after obtaining the value of m,
then next calculates the matrix A which contains the
value of the difference between the image of the face
data with the average value of the line. Here matrix
value A with the following equation:
A = X - m
Table 3 Matrix Image Value A

Matrik A
Image 1 Image 2 Image 3 Image 4
-0.75 -14.75 58.25 -42.75
52.75 -23.25 1.75 -31.25
60.75 -33.25 10.75 -38.25
11.75 -51.25 78.75 -39.25
7.75 -12.25 21.75 -17.25
45.25 -25.75 -13.75 -5.75
51.5 -26.5 -8.5 -16.5
29 -41 32 -20
5 23 -4 -24
45.75 -13.25 -17.25 -15.25
45.25 -12.75 -9.75 -22.75
19.5 -23.5 17.5 -13.5
-25.25 48.75 -0.25 -23.25
47 -18 -9 -20
52.75 -28.25 -0.25 -24.25
7.75 -43.25 34.75 0.75
Table 3 contains the value of matrix A which is the
value of pixel difference with the center point on the
image of face data. This value is used to find the value
of L. covariance matrix.
d) Calculate L Covariance Matrix
At this stage to find the L covariance matrix using the
following equation:
L = A 'x A
The following covariance matrix values have been
calculated using table equation 3:
Table 4 Covariance Matrix Value L
Covariance Matrix L
L1 L2 L3 L4
22447.69 -13080.1 593.9375 -9961.56
-13080.1 14475.19 -7788.81 6393.688
593.9375 -7788.81 13475.19 -6280.31
-9961.56 6393.688 -6280.31 9848.188
e) Calculate the eigenvalue (V) and eigenvector (D)
of the matrix L.
At this stage to find the value of eigen value and eigen
vector of matrix L using the formula in matlab as
follows:
[V, D] = eig (L)
V is the eigenvector and D is the eigen value.
Table 5 Vector Eigenvalues
Eigen Vektor V
V1 V2 V3 V4
-0.5 -0.05985 0.538953 -0.67524
-0.5 -0.65353 0.150188 0.54804
-0.5 -0.04009 -0.81866 -0.27963
-0.5 0.753468 0.129516 0.406831
f) Calculates Ehe eigenfaces Value
In this process, the eigenfaces value is the face value of
the facial image. This value is calculated using the
following equation:
Eigenfaces = A x V
Table 6 Facial Image Eigenfaces Value
Eigenfaces
Eigenface1 Eigenface2 Eigenface3 Eigenface4
1.77E-14 -24.8617 -55.8431 -41.2577
-1.56E-14 -11.5787 19.45786 -61.5636
-8.45E-15 -11.1573 13.99307 -77.8104
5.14E-14 0.059081 -70.9172 -74.0101
7.37E-15 -6.32748 -17.7029 -25.0464
-3.76E-15 10.3389 31.03209 -43.1609
-8.24E-15 2.144718 28.59765 -53.6337
2.73E-14 8.706599 -19.3154 -59.1364
-3.33E-14 -33.2532 6.315325 0.583303
-1.92E-14 -4.87772 34.81381 -39.5342
-1.85E-14 -11.1263 27.50813 -44.0711
1.19E-14 3.31735 -9.0948 -36.4319
-4.00E-14 -47.8563 -9.09348 34.37781
-1.35E-14 -5.75802 27.40498 -47.2209
-8.56E-15 -2.95656 21.25084 -60.8967
4.78E-14 26.97306 -30.6699 -38.3479
g) Calculate the PCA Value
At this stage after the eigenfaces are obtained, do the
data reduction using PCA where the reduction results
in the reduction of data dimension, so the dimension of
data that has nonessential characteristics will be
eliminated. The following equations are used to find
the face PCA value of the face:
PCA = Eigenfaces' x A
Table 7 Value of PCA Face Image Data
PCA
Image 1 Image 2 Image 3 Image 4
-1.85E-12 -7.24E-12 8.77E-12 3.15E-13
-324.868 -3547.36 -217.622 4089.847
8357.36 2328.914 -12694.6 2008.364
-26544.7 21544.29 -10992.7 15993.15
G. Data Presentation
Of the face image data identified students who had
normal stress and the features extracted using Principal
Component Analysis method is then compared to
determine the differences between the data. To display
data comparison of the data presentation of data used is
graph.
Here is an example of data presentation in this
research:

Figure 7 Example of Average Graph PCA Value of
Stress Face
Figure 7 shows the mean value of the PCA matrix in
the student's face that was identified as stress.
4 Results and Discussion
A. Testing
Table 8 Testing of Feature Extraction Application
N
o
Function Testing
Case Testing
Data Expected
results Results
obtained
1
Conducti
ng the
process of
pre-proce
ssing
Enter
image
data Imagery
Image
pre-proce
ssing
successfu
lly
Image
pre-proces
sing
successful
ly
2
Perform
feature
extraction
process
using
PCA
Enter
image
data
Results
of
Pre-Proce
ssing
image
Data
successfu
lly
extracted
Data
successful
ly
extracted
3
Displays
feature
extraction
data in
graphical
form
Feature
extractio
n data has
been
processed
PCA
feature
extractio
n data
Display
graphs
according
to feature
extractio
n data
Display
graphs
according
to feature
extraction
data
B. Pre-Processing
In the pre-processing process aims to prepare a decent
data used for further processing. Starting from image
data that has a resolution of 2304x4096 pixels and then
done face detection using Viola-Jones method. Face
detection results will be in the crop and resize to a size
of 400x400 pixels. The last stage of this process is to
change the type of RGB image into grayscale image
type.
Figure 8 Results of Stress Image Pre-Processing
Figure 8 (a) 5 initial stress image with a resolution of
2304x4096 pixels and has a RGB image type (b) image
that has been through the process of pre-processing
which only focus on the face with a resolution of
400x400 pixels and has a grayscale image type.
C. Graphic Per Image
Figure 9 Graph of Stress Image 13
Figure 9 shows the pattern of feature extraction results
from the stress image 13 with the highest value of
9.0365e + 08 and the lowest value is -3.6308e + 07.
Figure 10 Normal Image Graph 23
Figure 10 shows the pattern of feature extraction
results from normal image 23 with the highest value of
5.8646e + 08 and the lowest value is -1.5681e + 08.
-1,00E+04
0,00E+00
1,00E+04
Citra 1 Citra 2 Citra 3 Citra 4
Average Graph of PCA Value of Stress Face
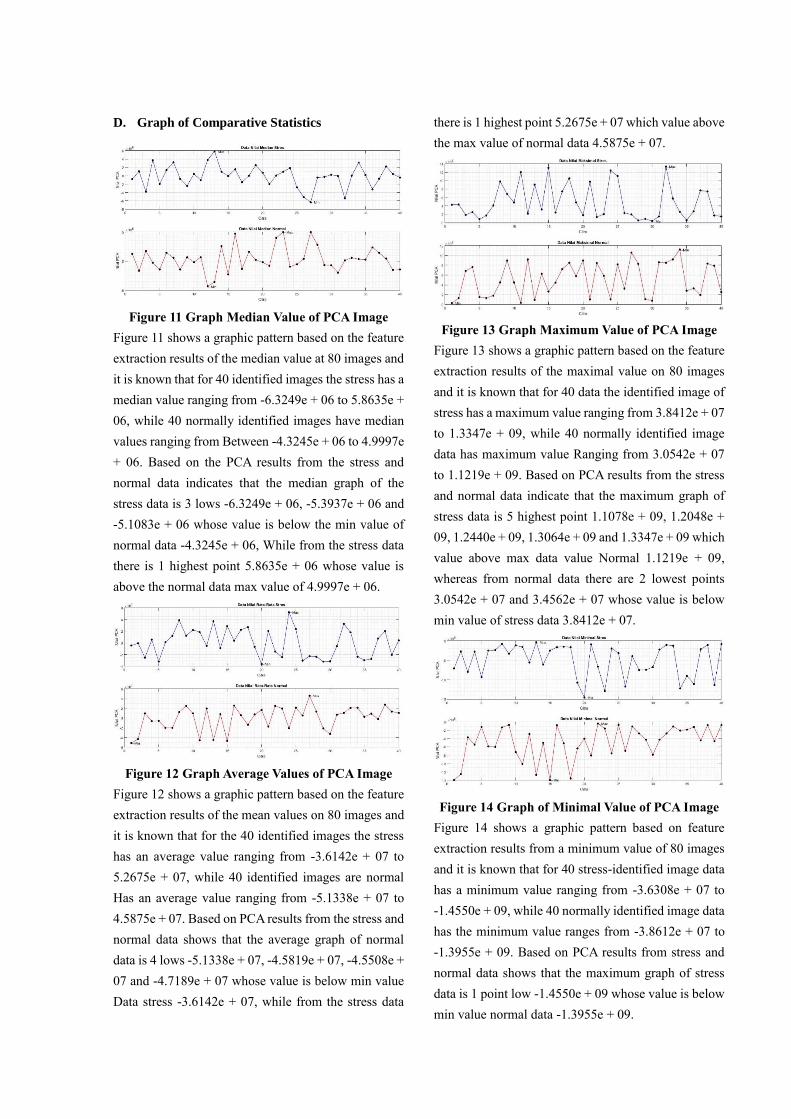
D. Graph of Comparative Statistics
Figure 11 Graph Median Value of PCA Image
Figure 11 shows a graphic pattern based on the feature
extraction results of the median value at 80 images and
it is known that for 40 identified images the stress has a
median value ranging from -6.3249e + 06 to 5.8635e +
06, while 40 normally identified images have median
values ranging from Between -4.3245e + 06 to 4.9997e
+ 06. Based on the PCA results from the stress and
normal data indicates that the median graph of the
stress data is 3 lows -6.3249e + 06, -5.3937e + 06 and
-5.1083e + 06 whose value is below the min value of
normal data -4.3245e + 06, While from the stress data
there is 1 highest point 5.8635e + 06 whose value is
above the normal data max value of 4.9997e + 06.
Figure 12 Graph Average Values of PCA Image
Figure 12 shows a graphic pattern based on the feature
extraction results of the mean values on 80 images and
it is known that for the 40 identified images the stress
has an average value ranging from -3.6142e + 07 to
5.2675e + 07, while 40 identified images are normal
Has an average value ranging from -5.1338e + 07 to
4.5875e + 07. Based on PCA results from the stress and
normal data shows that the average graph of normal
data is 4 lows -5.1338e + 07, -4.5819e + 07, -4.5508e +
07 and -4.7189e + 07 whose value is below min value
Data stress -3.6142e + 07, while from the stress data
there is 1 highest point 5.2675e + 07 which value above
the max value of normal data 4.5875e + 07.
Figure 13 Graph Maximum Value of PCA Image
Figure 13 shows a graphic pattern based on the feature
extraction results of the maximal value on 80 images
and it is known that for 40 data the identified image of
stress has a maximum value ranging from 3.8412e + 07
to 1.3347e + 09, while 40 normally identified image
data has maximum value Ranging from 3.0542e + 07
to 1.1219e + 09. Based on PCA results from the stress
and normal data indicate that the maximum graph of
stress data is 5 highest point 1.1078e + 09, 1.2048e +
09, 1.2440e + 09, 1.3064e + 09 and 1.3347e + 09 which
value above max data value Normal 1.1219e + 09,
whereas from normal data there are 2 lowest points
3.0542e + 07 and 3.4562e + 07 whose value is below
min value of stress data 3.8412e + 07.
Figure 14 Graph of Minimal Value of PCA Image
Figure 14 shows a graphic pattern based on feature
extraction results from a minimum value of 80 images
and it is known that for 40 stress-identified image data
has a minimum value ranging from -3.6308e + 07 to
-1.4550e + 09, while 40 normally identified image data
has the minimum value ranges from -3.8612e + 07 to
-1.3955e + 09. Based on PCA results from stress and
normal data shows that the maximum graph of stress
data is 1 point low -1.4550e + 09 whose value is below
min value normal data -1.3955e + 09.

E. Average Analysis
Table 9 Average Analysis
Table 9 shows the data on the number of values of
feature extraction results that are more and less than the
average value per image. It is known that the
percentage of stress data more than the average is
50.38% and the percentage less than the average is
49.63%. While the percentage of normal data that is
more than the average is 43.81% and the percentage
less than the average is 56.19%.
F. Graphical Pattern Analysis
In the graphical pattern analysis stage to determine the
PCA value of an image is a rising graphic pattern, the
descending graph or irregular graph can use the
following rules.
Table 10 Pattern Rules
Table 10 shows the rules for determining the PCA
value as an up, down, or irregular pattern.
Table 11 Graphical Pattern Analysis
Table 11 shows the number of graphic patterns of 40
stress data with upgraded graphic pattern of 4 data with
10% percentage, down pattern graph is 12 data with
30% percentage and irregular graphic pattern is 24 data
with percentage 60%. While the graphic pattern of 40
normal data with the graphic pattern rose by 1 data
with 2.5% percentage, the pattern of down graphics
amounted to 7 data with the percentage of 17.5% and
the pattern of irregular graphs amounted to 32 data
with percentage of 80%.
5. Conclusions
Based on the results of analysis and testing it can be
concluded as follows.
1. Pre-processing the image data, producing images
that focus on the face with a grayscale image type
and resolution of 400x400 pixels image. PCA
results based on statistical analysis are median,
average, maximal and minimal. The median stress
score is between -6.3249e + 06 to 5.8635e + 06,
normal median value between -4.3245e + 06 to
4.9997e + 06. While the average score is between

-3.6142e + 07 to 5.2675e + 07, the normal average
is between -5.1338e + 07 to 4.5875e + 07. While
the maximum value of stress between 3.8412e + 07
to 1.3347e + 09, the maximum value of normal
between 3.0542e + 07 to 1.1219e + 09. While the
minimum value of stress between -3.6308e + 07 to
-1.4550e + 09, the minimum normal value between
-3.8612e + 07 to -1.3955e + 09.
2. Facial feature extraction comparison results using
Principal Component Analysis (PCA) is
a. Based on the mean analysis of the facial identity
data of the identified stress has a percentage
above the average per image of 50.38% and the
percentage below the average per image of
49.63%, while the normal face image data has a
percentage above the average per image as big
as 43.81% and a percentage below the average
per image of 56.19%.
b. Based on the analysis of the pattern of the facial
image data, the identified stress has a
percentage of irregular pattern of 60%, while
the normal identifiable face image has an
irregular pattern percentage of 80%.
Bibliography
[1] Hartaji, Damar A. (2012). Motivasi Berprestasi Pada
Mahasiswa yang Berkuliah Dengan Jurusan Pilihan Orangtua.
Fakultas Psikologi Universitas Gunadarma.
[2] Suriakin, M., Bulkis , K., & IGP , S. W. (2014). Ekstrasi Ciri
Wajah Manusia Menggunakan Algoritma Principal
Component Analysis (PCA) Untuk Sistem Pengenalan Wajah.
Dielektrika, ISSN 2086-9487.
[3] Henry, J. D., & Crawford, J. R. (2005). The short-form version
of the Depression Anxiety Stress Scales (DASS-21): Construct
validity and normative data in a large non-clinical sample.
British Journal of Clinical Psychology, 227-239.
[4] Lovibond, S.H & Lovibond, P.F. 1995. Manual for the
Depression Anxiety Stres Scales. The Psychology Foundation
of Australia Inc.
[5] Basuki, A. (2005). Metode Numerik dan Algoritma
Komputasi. Yogyakarta: ANDI.
[6] Arymurthy A. M dan Setiawan S. (1992). Pengantar
Pengolahan Citra, PT Elex Media Komputindo Jakarta.
[7] Pratiwi. (2014). Metode Ekstrasi Ciri 2DPCA Pada Pengenalan
Citra Wajah Dengan Matlab. Jurnal Teknologi, 1-5.
[8] Umale, C., & Vaidya, A. (2016). Feature Extraction
Techniques and Classification Algorithms for EEG Signals to
detect Human Stress - A Review. International Journal of
Computer Applications Technology and Research, 08 - 14.
[9] Utami, E., & Wulanningrum, R. (2014). Penggunaan Principal
Component Analysis dan Euclidean Distance untuk
Identifikasi Citra Tanda Tangan. IPTEK-KOM, 1-16.
[10] Nimas, S. (2012). Perbandingan Ukuran Jarak pada Pengenalan
Wajah Berbasis Principal Component Analysis. Penelitian
Institut Teknologi Surabaya.


![6OXP$UHDVLQ(DVW :DUD6XE 'LVWULFWV 6RXWK6XODZHVLp2m.polibatam.ac.id/wp-content/uploads/2018/02/Makalah_Forum... · brings many impacts to the urban community's own life patterns [2]](https://img.dokumen.tips/doc/110x75/5caa795c88c993123c8b880c/6oxpuhdvlqdvw-dud6xe-lvwulfwv-brings-many-impacts-to-the-urban-communitys.jpg)