Embed Size (px)
Citation preview

COMPARISON OF EXPERIMENTAL AND COMPUTATIONAL SHIP AIR WAKES FOR YP CLASS PATROL CRAFT*
Murray R. Snyder,† Joshua P. Shishkoff,‡ Franklin D. Roberson,§ Martin C. McDonald,§ Cody J. Brownell,**
sa Luznik,Luk ,§§
†† David S. Miklosovic,‡‡ John S. BurksUnited States Naval Academy, Annapolis, MD 21402
Hyung Suk Kang,***
Johns Hopkins University, Baltimore, MD 21218
Colin H. Wilkinson Zenetex LLC, Patuxent River, MD 20670
Abstract
This paper provides second year results from a multi-year research project that involves a systematic investigation of ship air wakes using an instrumented United States Naval Academy (USNA) YP (Patrol Craft, Training). The objective is to validate and improve Computational Fluid Dynamics (CFD) tools that will be useful in determining ship air wake impact on naval rotary wing vehicles. This project is funded by the Office of Naval Research and includes extensive coordination with Naval Air Systems Command. Currently, ship launch and recovery wind limits and envelopes for helicopters are primarily determined through at-sea in situ flight testing that is expensive and frequently difficult to schedule and complete. The time consuming and potentially risky flight testing is required, in part, because computational tools are not mature enough to adequately predict air flow and wake data in the lee of a ship with a complex superstructure. The top-side configuration of USNA YPs is similar to that of a destroyer or cruiser, and their size (length of 108 ft and above waterline height of 24 ft) allows for collection of air wake data that is in the same order of magnitude as that of modern naval warships, an important consideration in aerodynamic modeling. A dedicated YP has been modified to add a flight deck and hangar structure to produce an air wake similar to that on a modern destroyer. Three axis acoustic anemometers, fog generators and an Inertial Measurement Unit (IMU) have been installed. Repeated testing on the modified YP is being conducted in the Chesapeake Bay, which allows for the collection of data over a wide range of wind conditions. Additionally, a scale model of the modified YP has been constructed for testing in the 42×60×102 inch USNA wind tunnel. Significant wind tunnel measurements are scheduled for fall 2010. Comparison of YP in situ test data with wind tunnel data will be useful for validation of wind tunnel test methods and scale effects, as well as CFD models that could help predict ship air wake effects. The project involves USNA midshipmen who are participating in test planning, collecting and analyzing data, and in CFD modeling, providing the midshipmen with valuable professional and research experience. Additionally, the flight deck has been designed to allow operation of a 400-500 lb class rotary wing Unmanned Aerial Vehicle for direct measurement of the dynamic interface between the ship and helicopter. Summary of Important Interim Conclusions: 1. Good velocity component correlation exists between in situ and CFD data for the YP bow mounted reference anemometer. 2. Excellent repeatability has been observed for normalized in situ data collected for a given relative wind situation during different underway data collection periods. 3. Good comparison is shown between normalized in situ and CFD data over the flight deck for a headwind and for wind 15° off the starboard bow.
* Presented at the American Society of Naval Engineers, Launch and Recovery Symposium 2010, Arlington, VA, December 8-9, 2010. † Permanent Military Professor, Mechanical Engineering Department, corresponding author ([email protected]). ‡ Ensign, US Navy. § Midshipman, US Navy. ** Assistant Professor, Mechanical Engineering Department. †† Assistant Professor, Mechanical Engineering Department. ‡‡ Associate Professor, Aerospace Engineering Department. §§ Visiting Professor, Aerospace Engineering Department. *** Associate Research Scientist, Mechanical Engineering Department.
ASNE Launch & Recovery Symposium

Report Documentation Page Form ApprovedOMB No. 0704-0188
Public reporting burden for the collection of information is estimated to average 1 hour per response, including the time for reviewing instructions, searching existing data sources, gathering andmaintaining the data needed, and completing and reviewing the collection of information. Send comments regarding this burden estimate or any other aspect of this collection of information,including suggestions for reducing this burden, to Washington Headquarters Services, Directorate for Information Operations and Reports, 1215 Jefferson Davis Highway, Suite 1204, ArlingtonVA 22202-4302. Respondents should be aware that notwithstanding any other provision of law, no person shall be subject to a penalty for failing to comply with a collection of information if itdoes not display a currently valid OMB control number.
1. REPORT DATE 2010 2. REPORT TYPE
3. DATES COVERED 00-00-2010 to 00-00-2010
4. TITLE AND SUBTITLE Comparison of Experimental and Computational Ship Air Wakes for YPClass Patrol Craft
5a. CONTRACT NUMBER
5b. GRANT NUMBER
5c. PROGRAM ELEMENT NUMBER
6. AUTHOR(S) 5d. PROJECT NUMBER
5e. TASK NUMBER
5f. WORK UNIT NUMBER
7. PERFORMING ORGANIZATION NAME(S) AND ADDRESS(ES) United States Naval Academy,Annapolis,MD,21402
8. PERFORMING ORGANIZATIONREPORT NUMBER
9. SPONSORING/MONITORING AGENCY NAME(S) AND ADDRESS(ES) 10. SPONSOR/MONITOR’S ACRONYM(S)
11. SPONSOR/MONITOR’S REPORT NUMBER(S)
12. DISTRIBUTION/AVAILABILITY STATEMENT Approved for public release; distribution unlimited
13. SUPPLEMENTARY NOTES Launch & Recovery Symposium 2010, Dec 8-9, 2010, Arlington, VA.
14. ABSTRACT This paper provides second year results from a multi-year research project that involves a systematicinvestigation of ship air wakes using an instrumented United States Naval Academy (USNA) YP (PatrolCraft, Training). The objective is to validate and improve Computational Fluid Dynamics (CFD) tools thatwill be useful in determining ship air wake impact on naval rotary wing vehicles. This project is funded bythe Office of Naval Research and includes extensive coordination with Naval Air Systems Command.Currently, ship launch and recovery wind limits and envelopes for helicopters are primarily determinedthrough at-sea in situ flight testing that is expensive and frequently difficult to schedule and complete. Thetime consuming and potentially risky flight testing is required, in part, because computational tools are notmature enough to adequately predict air flow and wake data in the lee of a ship with a complexsuperstructure. The top-side configuration of USNA YPs is similar to that of a destroyer or cruiser, andtheir size (length of 108 ft and above waterline height of 24 ft) allows for collection of air wake data that isin the same order of magnitude as that of modern naval warships, an important consideration inaerodynamic modeling. A dedicated YP has been modified to add a flight deck and hangar structure toproduce an air wake similar to that on a modern destroyer. Three axis acoustic anemometers, foggenerators and an Inertial Measurement Unit (IMU) have been installed. Repeated testing on the modifiedYP is being conducted in the Chesapeake Bay, which allows for the collection of data over a wide range ofwind conditions. Additionally, a scale model of the modified YP has been constructed for testing in the42?0?02 inch USNA wind tunnel. Significant wind tunnel measurements are scheduled for fall 2010.Comparison of YP in situ test data with wind tunnel data will be useful for validation of wind tunnel testmethods and scale effects, as well as CFD models that could help predict ship air wake effects. The projectinvolves USNA midshipmen who are participating in test planning, collecting and analyzing data, and inCFD modeling, providing the midshipmen with valuable professional and research experience.Additionally, the flight deck has been designed to allow operation of a 400-500 lb class rotary wingUnmanned Aerial Vehicle for direct measurement of the dynamic interface between the ship and helicopter.
15. SUBJECT TERMS
16. SECURITY CLASSIFICATION OF: 17. LIMITATION OF ABSTRACT Same as
Report (SAR)
18. NUMBEROF PAGES
10
19a. NAME OFRESPONSIBLE PERSON
a. REPORT unclassified
b. ABSTRACT unclassified
c. THIS PAGE unclassified
Standard Form 298 (Rev. 8-98) Prescribed by ANSI Std Z39-18
Notation
CAD = Computer Aided Design CFD = Computational Fluid Dynamics IMU = Inertial Measurement Unit LCS = Littoral Combat Ship USNA = United States Naval Academy YP = Patrol Craft, Training α = Angle of Attack β = Relative Wind Angle
Introduction
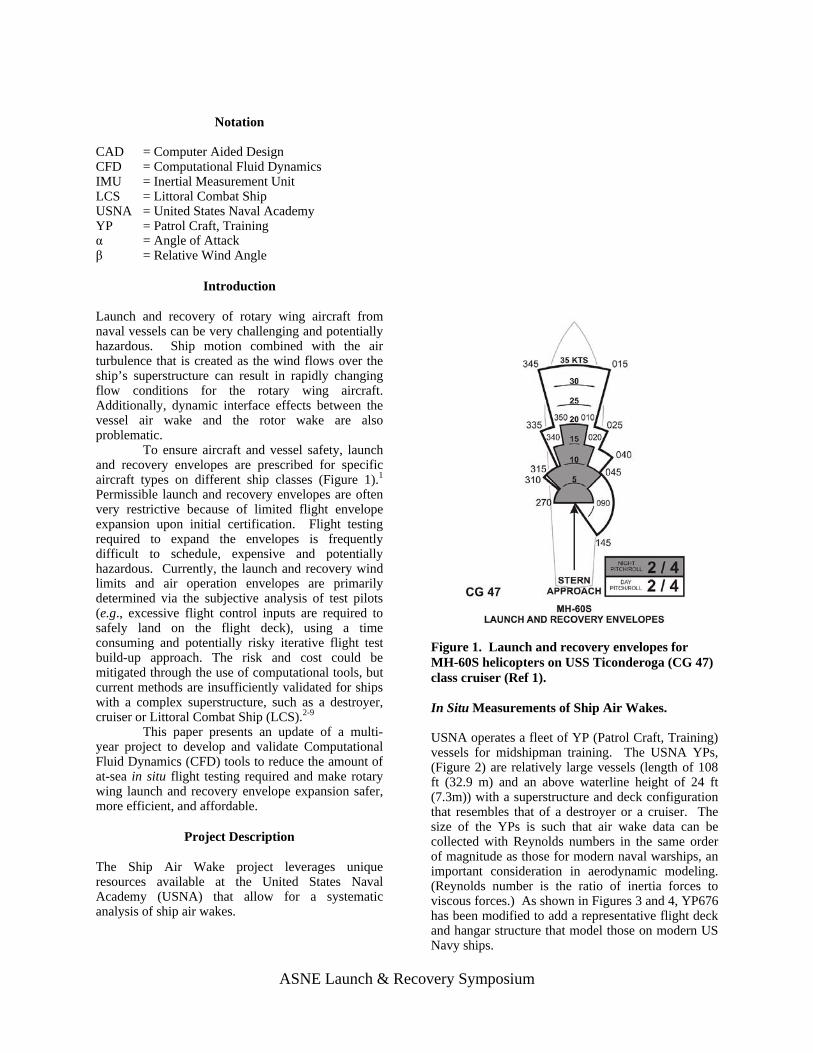
Launch and recovery of rotary wing aircraft from naval vessels can be very challenging and potentially hazardous. Ship motion combined with the air turbulence that is created as the wind flows over the ship’s superstructure can result in rapidly changing flow conditions for the rotary wing aircraft. Additionally, dynamic interface effects between the vessel air wake and the rotor wake are also problematic. To ensure aircraft and vessel safety, launch and recovery envelopes are prescribed for specific aircraft types on different ship classes (Figure 1).1 Permissible launch and recovery envelopes are often very restrictive because of limited flight envelope expansion upon initial certification. Flight testing required to expand the envelopes is frequently difficult to schedule, expensive and potentially hazardous. Currently, the launch and recovery wind limits and air operation envelopes are primarily determined via the subjective analysis of test pilots (e.g., excessive flight control inputs are required to safely land on the flight deck), using a time consuming and potentially risky iterative flight test build-up approach. The risk and cost could be mitigated through the use of computational tools, but current methods are insufficiently validated for ships with a complex superstructure, such as a destroyer, cruiser or Littoral Combat Ship (LCS).2-9
This paper presents an update of a multi-year project to develop and validate Computational Fluid Dynamics (CFD) tools to reduce the amount of at-sea in situ flight testing required and make rotary wing launch and recovery envelope expansion safer, more efficient, and affordable.
Project Description
The Ship Air Wake project leverages unique resources available at the United States Naval Academy (USNA) that allow for a systematic analysis of ship air wakes.
Figure 1. Launch and recovery envelopes for MH-60S helicopters on USS Ticonderoga (CG 47) class cruiser (Ref 1). In Situ Measurements of Ship Air Wakes. USNA operates a fleet of YP (Patrol Craft, Training) vessels for midshipman training. The USNA YPs, (Figure 2) are relatively large vessels (length of 108 ft (32.9 m) and an above waterline height of 24 ft (7.3m)) with a superstructure and deck configuration that resembles that of a destroyer or a cruiser. The size of the YPs is such that air wake data can be collected with Reynolds numbers in the same order of magnitude as those for modern naval warships, an important consideration in aerodynamic modeling. (Reynolds number is the ratio of inertia forces to viscous forces.) As shown in Figures 3 and 4, YP676 has been modified to add a representative flight deck and hangar structure that model those on modern US Navy ships.
ASNE Launch & Recovery Symposium

Ultrasonic anemometers have been installed to allow for direct measurement of wind velocity and direction over the flight deck (Figure 5). The anemometers are the Applied Technology Inc. “A” style three-velocity component model with a 5.91 inch path length and a measurement accuracy of ± 1.18 inch/sec. The anemometers are connected to a data packer unit that allows up to eight different anemometers to be sampled concurrently at up to 20 Hz, which is the sample rate for the current measurements.
Figure 2. Unmodified USNA YP (Patrol Craft, Training).
Figure 3. YP676 with added flight deck.
Figure 4. YP676 added hangar-like superstructure modification.
Figure 5. Ultrasonic anemometers installed on YP676 flight deck. To estimate the reference or “true” wind (i.e. the wind minimally impacted by flow over the ship), one anemometer is mounted 3.5 feet forward and 7.0 feet above the ship’s bow (Figure 6). Placement of the reference anemometer was based upon CFD flow simulations that showed this is an accessible location which was expected to have minimal disturbance to the incoming wind due to the ship hull and superstructure. Currently six anemometers are installed on YP676; eventually eight anemometers will be installed. Other supporting data collected simultaneously with velocity measurements include ship pitch and roll (Crossbow Inertial Measurement Unit model VG600), temperature and atmospheric pressure. In addition, real time meteorological data from the Thomas Point meteorological station (NOAA—National Data Buoy Center—Station TPLM2), which is in close proximity to the underway testing area, is also collected.
ASNE Launch & Recovery Symposium

Figure 6. Bow mounted reference anemometer. Wind Tunnel Measurements Wind tunnel tests of a 4% scale model of the YP will commence in USNA’s large wind tunnel (42 × 60 × 120 inch test section) in October 2010. Figure 7 shows the hull and basic superstructure while Figure 8 shows detail being added to the model. Wind tunnel tests of the detailed model will primarily be conducted at a wind tunnel velocity of 300 ft/sec. This velocity allows matching of Reynolds number between the 4% scale model and the actual YP with a seven knot (nm/hr) wind over deck. An important feature of the present research is the ability to match Reynolds number between the wind tunnel, the in situ measurements and numerical simulations.
Figure 7. YP hull and basic superstructure in USNA large wind tunnel.
Figure 8. Detail being added to YP model. Computational Fluid Dynamics Simulations Numerical simulations have been performed by USNA midshipmen with parallel processing using both Cobalt,10 a commercial CFD code, and the NASA USM3Dns11,12 code. Both codes use an unstructured tetrahedral grid. As shown in Figure 9, the unstructured grid allows for finer resolution where greater variation in air flow is expected. The tetrahedral grid is divided into partitions with communication between these partitions accomplished through the use of Message Passing Interface. Such partitioning speeds up the solution generation by allowing an individual processor to solve the flow field in a limited number of tetrahedrons.
Figure 9. Unstructured YP surface grid.
ASNE Launch & Recovery Symposium

Interim Results
As of the submission of this paper, 14 underway test periods in the Chesapeake Bay have been completed. Additionally, midshipmen interns have performed CFD analysis for both 7 and 20 knots of wind over deck. CFD analysis, using a grid size of approximately 20 million tetrahedrons, was performed for a head wind and for crosswind from the starboard bow from 15, 30, 45, 60, 75 and 90°. Underway Measurements
Using up to six anemometers simultaneously, in situ data has been collected for a head wind, and a crosswind 15 or 30° off the starboard bow. Data has been collected for the bow reference anemometer and for anemometers mounted directly above the flight deck at various heights. During data collection real time data output is continuously monitored to ensure desired relative wind is approximately maintained and that data quality is satisfactory. This information is displayed on the YP’s bridge such that the ship’s helmsman can take real time corrective action to adjust ship heading. Analysis of Reference Anemometer Data
As mentioned previously, reference measurements are taken above and forward of the YP bow. The reference anemometer data is analyzed to ensure data sampling above the stern flight deck on the YP is conducted under a known, specified flow scenario. The relative wind angle β is measured from the bow, increasing to 90° when off the starboard beam. Due to the nature of field data collected while underway in the Chesapeake Bay, there are inevitable fluctuations in the air flow incident upon the ship. Additionally, the reference measurements, which are taken approximately seven feet above and three and half feet forward of the uppermost portion of the YP’s bow, see effects from the ship and do not accurately represent the undisturbed free stream flow. Figure 10 shows in situ reference anemometer data for a headwind (β=0°) which includes 34 data sets collected over multiple underway test periods with mean wind velocity in the range of 8-23 knots. The vertical bars represent 95% confidence bands defined as ± 2 standard deviations from the mean. While the mean flow is primarily horizontal, a small but consistent vertical flow component is observed with the incident wind averaging an angle of attack α of 5.10°. The positive α indicates the vertical flow is in the upward direction. Time-averaged CFD solutions computed at 7 and 20 knots, similarly, show α of 4.97° and 3.89°, respectively.
A similar match is observed for β=15° (wind from 15 degrees off the starboard bow). Figure 11 shows this underway data which indicates α=5.95°; corresponding time-averaged CFD solutions show α of 5.61° and 5.30°, respectively, for 7 and 20 knots incident winds. The close agreement in flow direction between in situ and CFD simulations indicates that the CFD provides an accurate flow solution near the front of the YP. This is graphically shown in Figures 12 to 14, wherein the black vectors show the in situ data and the white vectors show the 7 knot time-averaged CFD solution (note that the white vectors have a 7 knots magnitude while the black vector exhibit the average magnitude seen in the 34 data sets).
Figure 10. Variation in relative wind β and angle of attack α for β=0° data from multiple underway test periods.
Figure 11. Variation in relative wind β and angle of attack α for β=15° data from multiple underway test periods.
ASNE Launch & Recovery Symposium

Figure 12. β=0° bow reference anemometer data (black vector) vs. 7 knot CFD flow visualization (white vectors; 7 knots = 141 inches/sec).
Figure 13. β=0° bow reference anemometer data (black vector) vs. 7 knot CFD flow visualization (white vectors; 7 knots = 141 inches/sec).
Figure 14. β=15° bow reference anemometer data (black vector) vs. 7 knot CFD flow visualization (white vectors; 7 knots = 141 inches/sec).
Repeatability and Scaling of Flight Deck In Situ Data Collection Incoming flow conditions significantly vary between different sampling periods depending on the daily weather conditions (wind speed and direction, atmospheric pressure and temperature, and wavelength and height). The YP676 operating conditions (engine rpm, ship’s speed and craft master's skill level at maintaining a given relative wind component) also vary. Data repeatability is tested qualitatively in two points of view: the first is the mean velocities above the flight deck; with the other being turbulence quantities including Reynolds shear stresses. To confirm the repeatability on different underway test periods, velocity measurements are performed at the same measurement locations above the deck, e.g., at x/H=2.15, y/H=0 (centerline of the deck) at three different heights of z/H=0.28, 0.67 and 1.07, where H is the hanger height (59 inches), x is the distance aft of the hanger, y is the distance to starboard of the centerline and z is the height above the deck. The un-scaled velocity vectors on the (x,z)-plane are shown in Figure 15 (a). The red and green vectors were sampled on different days with the corresponding mean stream wise bow velocities of 239 inch/sec and 298 inch/sec, respectively. Although there is good agreement in flow angle between the two data sets, the effect of the difference in incoming velocity magnitude is clear. However, when the velocity components are scaled with their corresponding mean stream wise bow velocities, the two data sets agree well each other, as shown in Figure 15(b).
ASNE Launch & Recovery Symposium

ASNE Launch & Recovery Symposium
Figure 15. Comparison of data collected on two different days (red and green). (a) Un-scaled velocity vectors; (b) Scaled velocity vectors. Data repeatability can also be analyzed from convergence of turbulence statistics, particularly the Reynolds shear stress,13 which is the mean shear stress of the fluctuating components of velocity (e.g. ⟨u’w’⟩ where u’ is a fluctuating horizontal component and w’ is the fluctuating vertical component). Figure 16 shows the mean in situ Reynolds shear stress collected during numerous underway data collection periods. Figure 16 shows that a majority of the sampled sets converge after approximately two minutes. A few sampled data sets, however, do not show convergence until well past six minutes of continuous sampling. These sets likely correspond to measurements with large fluctuations in relative wind conditions and or ship motion. A related concern for underway testing is determination of the time necessary to collect data for a given crosswind condition. Typical data collection periods, for a given β, last approximately 25 minutes. After excluding data taken when the reference anemometer indicates relative wind is greater than ± 5° of the desired wind angle, typically five to 10
minutes are data are available for analysis. Figure 16 shows that in situ data convergence should occur within the sample window. Due to computational limitations, and based upon prior NAVAIR experience, 30 seconds of flow simulations are averaged to provide the time-averaged CFD results presented in this paper.
igure 16. In situ Reynolds shear stress running
omparison Between In Situ Flight Deck Data
ver 14 separate underway test periods, in situ
the in situ data, rmaliz
large ircula
e 19 show both in situ data and CFD mulati
Fmean ⟨u’w’⟩ vs. time. Cwith CFD Simulations Ovelocity data has been collected over the flight deck at 22 different x,y plane positions and at various z heights above a given x,y position. Figures 17 to 19 compare no ed and rescaled to the bow reference anemometer mean velocity, to the 7 knots time-averaged CFD data. The black vectors are the normalized and rescaled in situ data whilst the white vectors and color back scale are the 7 knots CFD simulation results. Multiple black vectors at a given sampling location show the repeatable of results collected on different underway test periods. Figures 17 and 18 clearly show arec tion zone that forms behind the aft end of the hanger structure for both β=0° and β=15°. This recirculation zone is well captured by both the in situ data and CFD simulation. Of note, flow vectors, black for in situ data and white for CFD, show very good correlation between in situ data and the corresponding CFD simulation. Flow fields downstream of this large recirculation zone also correspond well between in situ data and CFD simulation. Figursi on for a horizontal plane 17 inches above the flight deck (z/H=0.289) for β=15°. Again, one can observe good correlation between in situ data and CFD simulation.

Figure 17. β=0° centerline (y/H = 0) normalized in situ ta (black vectors) vs. 7 knots time-averaged CFD
dadata (white vectors and color scale; 7 knots = 141 inches/sec).
Figure 18. β=15° starboard side (y/H = 0.6) normalized data (black vectors) vs. 7 knots time-averaged in situ CFD data (white vectors and color scale; 7 knots = 141 inches/sec).
ASNE Launch & Recovery Symposium

Figure 19. β=15° horizontal plane (z/H = 0.289) normalized in situ data (black vectors) vs. 7 knots time-averaged CFD data (white vectors and color scale; 7 knots = 141 inches/sec).
Conclusions Future Work
In our prior update to the Ship Air Wake project,14 we noted the following preliminary conclusions:
Extensive in situ underway tests commenced during the summer of 2010. Since wind velocity data can only be collected in a few locations at a time (e.g. limited to eight anemometers) frequent underway tests are required to cover all areas of interest above and around the flight deck. In addition to correlation with CFD results, the identification and quantification of predicted flow structures in the vicinity of the flight deck, for example those found by Tinney and Ukeiley,15 as shown in Figure 20, will be evaluated. Eventually data will also be collected horizontally away from the flight deck through the use of anemometers mounted on extendable and rotatable sampling booms.
1. Initial CFD analysis was useful in determination of sensor placement on YP676. 2. Turbulent kinetic energy is significantly greater in the superstructure wake than in the free stream wind. 3. Minor ship pitch and roll motions have negligible impact on the superstructure air wake. 4. Spatial velocity correlations show, as predicted by initial CFD analysis, a distinctive shear layer present aft of the superstructure with the largest scale turbulent eddy approximately the same size as the height of the superstructure.
Future in situ tests will also likely include tethered and/or boom-mounted scale rotary wing aircraft to allow for measurement of dynamic interface effects.
In this paper we are able to make the following additional conclusions:
After completion of extensive wind tunnel measurements at the Naval Academy, the 4% YP model will be available for tests in other, larger wind tunnels, which will allow for investigation of wall interference effects and correction methods.
1. CFD simulations and in situ measurements at the bow reference anemometer show good agreement for the induced vertical velocity component arising from the ship interference effects. 2. Over 14 separate underway test periods, good measurement repeatability has been observed. 3. For both β=0° and β=15°, good comparison is observed between normalized in situ and CFD simulation data for numerous locations above the flight deck. Of note, similar large scale flow structures are observed in both data sets.
ASNE Launch & Recovery Symposium

Figure 20. Flow over 3-D backward-facing step (adapted from Tinney and Ukeiley (Ref. 13)). Acknowledgements This research is supported by the Office of Naval Research via the Young Investigator Program (Principal Investigator Murray Snyder). Program Officer is Mr. John Kinzer. Midshipmen summer internships at NAVAIR 4.3.2.1 were funded, in part, by the Department of Defense High Performance Computing Modernization Program Office. References 1. NAVAIR 00-08T-122, Helicopter operating procedures for air-capable ships NATOPS manual. 2. Guillot, M.J. and Walker, M.A., “Unsteady analysis of the air wake over the LPD-16,” AIAA 2000-4125: 18th Applied Aerodynamics Conference, August 2000. 3. Guillot, M.J., “Computational simulation of the air wake over a naval transport vessel,” AIAA Journal, Vol. 40, (10), 2002. 4. Lee, D., Horn, J.F., Sezer-Uzol, N., and Long, L.N, “Simulation of pilot control activity during helicopter shipboard operations,” AIAA 2003-5306: Atmospheric Flight Mechanics Conference and Exhibit, August 2003. 5. Carico, D., “Rotorcraft shipboard flight test analytic options,” Proceedings 2004 IEEE Aerospace Conference, Vol. 5, (6), March 2004. 6. Lee, D., Sezer-Uzol, N., Horn, J.F., and Long, L.N., “Simulation of helicopter ship-board launch and recovery with time-accurate airwakes,” Journal of Aircraft, Vol. 42, (2), March-April 2005. 7. Geder, J., Ramamurti, R. and Sandberg, W.C.,
“Ship airwake correlation analysis for the San Antonio Class Transport dock Vessel,” Naval Research Laboratory paper MRL/MR/6410-09-9127, May 2008. 8. Polsky, S., Imber, R., Czerwiec, R., & Ghee, T., "A Computational and Experimental Determination of the Air Flow Around the Landing Deck of a US Navy Destroyer (DDG): Part II", AIAA-2007-4484: 37th AIAA Fluid Dynamics Conference and Exhibit, June 2007. 9. Roper, D.M., Owen, I., Padfield, G.D. and Hodje, S.J., “Integrating CFD and pilot simulations to quantify ship-helicopter operating limits,” Aeronautical Journal, Vol. 110, (1109), 2006. 10. Strang, W.Z., Tomaro, R.F., and Grismer, M.J., "The Defining Methods of Cobalt60: A Parallel, Implicit, Unstructured Euler/Navier-Stokes Flow Solver," AIAA-99-0786: 37th Aerospace Sciences Meeting and Exhibit, January 1999. 11. Frink, N., “Upwind scheme for solving the Euler equations on unstructured tetrahedral meshes,” AIAA Journal, Vol. 30, (1), 1992. 12. Frink, N., “Tetrahedral unstructured Navier-Stokes method for turbulent flow,” AIAA Journal, Vol. 36, (11), 1998. 13. Pope, S., Turbulent Flows, Cambridge University Press, 2000, pp. 83-95. 14. Snyder, M.R., Burks, J.S., Brownell, C.J., Luznik, L., Miklosovic, D.S., Golden, J.H., Hartsog, M.E., Lemaster, G.E., Roberson, F.D., Shishkoff, J.P., Stillman, W.P. and Wilkinson, C.H. “Determination of shipborne helicopter launch and recovery limitations using computational fluid dynamics,” 66th American Helicopter Society Annual Forum, May 2010. 15. Tinney, C.E. and Ukeiley, L.S., “A study of a 3-D double backward-facing step,” Experiments in Fluids, Vol. 47, 2009.
ASNE Launch & Recovery Symposium