Embed Size (px)
Citation preview

Comparison of electrostatic and photon pressure force references at the nanonewton level
Gordon Shaw1, Julian Stirling2, John Kramar3, Paul Williams4, Matthew Spidell4, Richard Mirin5
1 Mass and Force Group, Quantum Measurement Division 3 Nanoscale Metrology Group, Engineering Physics Division 4 Sources and Detectors Group, Applied Physics Division 5 Quantum Nanophotonics Group, Applied Physics Division
U.S. National Institute of Standards and Technology (NIST)
2 Department of Physics, University of Bath
Abstract
This work describes a metrological comparison between nanonewton force references derived
from an electrostatic force balance and photon pressure from laser optical power in the 1-Watt
range. An Electrostatic Force Balance is used to measure photon pressure force in the 10
nanonewton range from the reflection of a laser from a low (approximately 10-5) loss III-V
semiconductor distributed Bragg reflector mirror while the power of the reflected beam was
simultaneously monitored with a traceable thermopile detector. This work demonstrates a method
to link mass, force and laser power within the International System of Units with explicit treatment
of absorption, diffuse reflection, and a detailed uncertainty analysis. Additionally, it demonstrates
a viable method to scale this force continuously using a pulsed laser technique while maintaining
the constant thermal load necessary for precision measurement of nanonewton forces with a
mechanical balance.
Introduction
Nanonewton forces are frequently encountered in micro- to nanoscale mechanical testing [1–5].
However, very few of the calibration methods currently available for this force range provide the
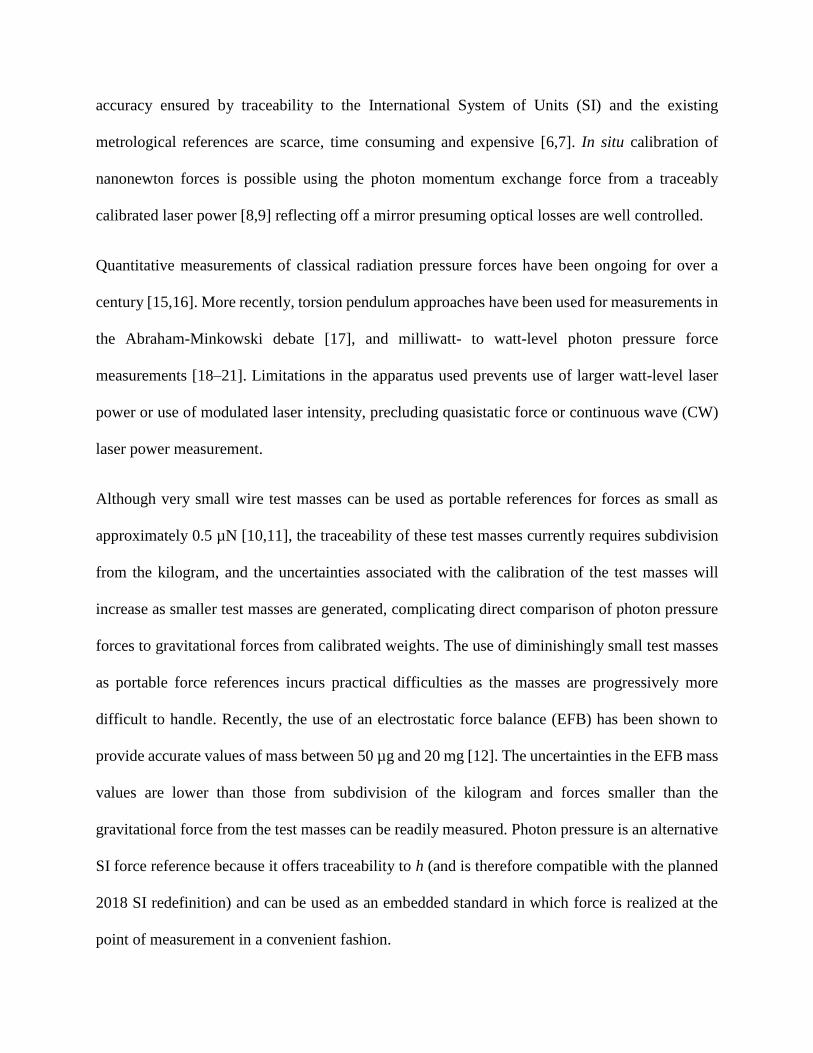
accuracy ensured by traceability to the International System of Units (SI) and the existing
metrological references are scarce, time consuming and expensive [6,7]. In situ calibration of
nanonewton forces is possible using the photon momentum exchange force from a traceably
calibrated laser power [8,9] reflecting off a mirror presuming optical losses are well controlled.
Quantitative measurements of classical radiation pressure forces have been ongoing for over a
century [15,16]. More recently, torsion pendulum approaches have been used for measurements in
the Abraham-Minkowski debate [17], and milliwatt- to watt-level photon pressure force
measurements [18–21]. Limitations in the apparatus used prevents use of larger watt-level laser
power or use of modulated laser intensity, precluding quasistatic force or continuous wave (CW)
laser power measurement.
Although very small wire test masses can be used as portable references for forces as small as
approximately 0.5 µN [10,11], the traceability of these test masses currently requires subdivision
from the kilogram, and the uncertainties associated with the calibration of the test masses will
increase as smaller test masses are generated, complicating direct comparison of photon pressure
forces to gravitational forces from calibrated weights. The use of diminishingly small test masses
as portable force references incurs practical difficulties as the masses are progressively more
difficult to handle. Recently, the use of an electrostatic force balance (EFB) has been shown to
provide accurate values of mass between 50 µg and 20 mg [12]. The uncertainties in the EFB mass
values are lower than those from subdivision of the kilogram and forces smaller than the
gravitational force from the test masses can be readily measured. Photon pressure is an alternative
SI force reference because it offers traceability to h (and is therefore compatible with the planned
2018 SI redefinition) and can be used as an embedded standard in which force is realized at the
point of measurement in a convenient fashion.

Traceable laser power measurements in the 0.1 W to 10 W range are available from commercial
detectors and are typically characterized at low frequency as an average power, even for pulsed
laser techniques [13]. Typically, at power levels exceeding 1 mW, radiometers measuring thermal
rise are preferred due to the uncertainty contributions of the attenuators required for photovoltaics.
Recent advances provide evidence that traceable optical power measurements can be used to obtain
accurate measurement of small forces and vice-versa [9,14] through precision measurement of
photon pressure forces from the reflection of laser light. In this paradigm, photon momentum
exchange force, Fp, depends on incident optical power, P, divided by the speed of light, c, and is
the sum of the forces from the processes of specular reflection, absorption and diffuse reflection.
For the purposes of the current work, we assume coherent light with negligible divergence at an
incident angle, θ.
Previous work has used multiple reflections of a coherent laser to produce a measurable force from
two opposing mirrors, each connected to a separate electromagnetic force compensation balance
[23]. Although SI traceability is extensively discussed, the actual traceability paths for the force
and laser power measurements is not explained, nor is an uncertainty analysis undertaken. In
addition, there is a critical oversight apparent in Figure 8 of [23]. Light from the laser used in the
work is clearly visible in the pictures shown. This indicates diffuse reflectance of the incident light.
This may originate either at the mirror surface or the mirror backside due to mirror transmission;
the effects of this light are not captured in the analysis. Any light not reflected by the mirrors in
this experiment may either be absorbed or diffusely scattered with an unknown angular
distribution, in the latter case it may reflect multiple times within the etalon. As a result, this
approach underestimates the force applied to the balance by the measured laser power, as is evident
in the experimental data.

In specular reflection, photon momentum from the ingoing and outgoing light is transmitted
directly to the reflecting surface without loss. The classical photon momentum force for such a
process is 2PRcosθ/c where R is the mirror reflectance. For absorption of photons by a mirror
without re-emission, the photon momentum from the incoming light as it arrives at the absorber is
PAcosθ/c where A is absorbance. We also separate the contributions to the total force from diffuse
reflectance either from the mirror surface, or of the light transmitted by the reflector and scattered
by the back side of the mirror. In this work, we will refer to this diffuse reflectance as scattering,
and it is distinct from the process of specular reflection. The effects of photoluminescence, inelastic
scattering and multi-photon processes [24] are assumed to be negligible. We decompose the
scattering into components describing the photon momentum force from incoming light absorbed
by the reflector that is scattered, and the outgoing re-emitted scattered light as characterized using
the scattered laser power Sin and Sout(Ω), respectively. These two components are separated
because they may have different angular distributions. The photon momentum force from the
fraction of incoming light that scatters is incident at a fixed angle for the collimated laser beams
used in the current experiment. As a result, the photon momentum force from this light is, similarly
to absorption, PSincosθ/c. The photon momentum force from the outgoing scattered light depends
on the distribution of the emitted scattered light over solid angle Ω. The resulting photon
momentum exchange force is PSout(Ω). Hence, the total photon momentum force can be written
𝐹𝑝 =𝑃𝑐𝑜𝑠𝜃
𝑐(2𝑅 + 𝐴 + 𝑆in + 𝑆out(Ω)/𝑐𝑜𝑠𝜃) (1).
Here, we demonstrate the use of an Electrostatic Force Balance (EFB) to measure photon pressure
force from a 1 W laser. The EFB measurements are collected simultaneously with in situ optical
power measurements from a thermopile detector. The calibrated thermopile power value, Pm, can

be used to calculate the expected photon pressure force for comparison with the EFB. This work
is a direct comparison between a primary reference for force and a secondary reference for optical
power, providing a portable alternative method for SI comparisons of mass, force and laser power
references.
Experimental Methods
The National Institute of Standards and Technology (NIST) EFB is an electromechanical balance
system that uses SI electrical units to provide a traceable electrostatic force, balancing an external
force to be calibrated. More detailed descriptions of the instrument are available in previous work
[12]. Briefly, the balance consists of a 4-bar parallelogram linkage that suspends the inner cylinder
of a 2-element concentric cylinder capacitor, as illustrated in Fig. 1. A buckling spring attached to
the free arm of the 4-bar linkage reduces the balance mechanism stiffness to approximately 0.001
N/m. All measurements are performed in a vacuum of 10-4 Pa, rendering radiometric and
photophoretic forces negligible. The electrostatic force, Fe, acting between the cylinders with an
externally-applied voltage, V, is
𝐹e =1
2
𝑑𝐶
𝑑𝑧(𝑉 + 𝑉𝑠)
2 (2),
where the gradient of capacitance, C, with the position of the movable inner electrode with respect
to the fixed outer electrode, z, is measured in a separate experiment. Vs is a contact potential
resulting from small differences in work function between the two gold-coated electrode surfaces
and surface adsorbates. The effect of this small potential (~10 mV) can be removed by performing
the force measurement using opposite polarities for V and then averaging the result. The EFB is

operated as a null balance; maintaining a constant z as external forces are applied requires feedback
control of V, and hence, Fe. Position is measured with a dual-column reference Michaelson
interferometer, which is traceable to the stabilized HeNe interferometer laser frequency. Voltage
is measured with a Keysight 3458A digital voltmeter and is traceable to a Josephson junction array.
The capacitance is determined with a 3-terminal capacitance measurement that rejects all
capacitance to ground (particularly, the grounded components of the balance, and the vacuum
chamber), isolating only the capacitance between the inner and outer cylinders. The Andeen-
Hagerling capacitance bridge used was calibrated traceably to the NIST calculable capacitor.
Previous work has shown the agreement between the EFB force measurements and a gravitational
force from a 1 mg mass calibrated traceably to the international prototype kilogram within a 8x10-
6 relative standard uncertainty [12].
For the purposes of the photon pressure measurement, several modifications were made to the EFB
as illustrated in Fig 1. An aluminum optical breadboard was placed in the vacuum chamber to
isolate the EFB from the heat produced by the laser optics and detectors. An extension of the free
end of the 4-bar linkage mounted on a tip-tilt stage protrudes through a slot in this thermal barrier.
Two Distributed Bragg Reflector (DBR) mirrors are attached to the top and bottom of the
extension’s end. The kinematics of the 4-bar linkage constrain the extension to rectilinear motion,
and relative corner loading errors are bounded to be < 1X10⁻⁵ of the measured force.
Two different photon momentum force measurements were carried out as shown in Fig. 2. In the
first, an optical switch directs a laser beam to either the top or bottom DBR mirror, generating an
upward or downward force on the EFB from a single reflection. In the second, an additional pair
of DBR mirrors was added to produce 4 reflections on each EFB mirror. Since the EFB is
configured to determine the change in sequentially applied forces, it measures the scalar sum of

the photon momentum forces from the top and bottom reflections. In addition, this approach
presents a thermal load that is approximately constant. Experiments that intermittently blocked the
laser incident on the balance caused thermal expansion in the mechanism resulting in mechanical
drift from the time varying heat load. In the current approach, the averaging time used in the force
measurement is decreased until a limit is reached (approximately 30 seconds) where further
reduction no longer influences measured force, i.e., where the measurement time is much shorter
than the balance’s thermal time constant.
The DBR was grown using molecular beam epitaxy (MBE) on a semi-insulating GaAs
substrate. The epilayer structure consisted of pairs of AlAs and GaAs layers. This quarter wave
stack is designed to give a maximum reflectivity of 99.993% at a center wavelength of 1363 nm
for a 10-degree angle of incidence.
A fiber-coupled 1363 nm Raman laser was used to generate the photon pressure force. The laser
passed through a fiber optical isolator and a beam splitter used to divert 4 % of the light to a
detector monitoring laser output power to verify the stability of the laser output power during an
experiment. The beam then passed into an optical switch where the light could be directed to two
different fiber outputs. These fiber outputs coupled into a vacuum chamber where the laser was
launched into free space with two separate collimators. The experimental configuration is
illustrated in Fig. 2. The optical switch output alternated between projecting the laser onto the top
and bottom DBR mirror on the EFB extension. This produced a differential force measurement
from the photon pressure acting in two different directions on the balance.
To align the photon momentum exchange force vector with the EFB force vector, a common
reference was established. The electrostatic force measurement axis was aligned to the local

gravitational vector within 1 milliradian using a precision bubble level while setting up the EFB.
The plate to which the DBR mirrors were attached at the end of the EFB extension was also aligned
to gravity within 2 milliradians using a smaller bubble level and the tip-tilt stage on the EFB
extension. The parallelism of the DBR mirror surfaces on the opposite sides of the plate was less
than 1 milliradian as determined by measuring the total thickness of the structure with calipers.
Subsequently, the fiber collimators were adjusted with tip-tilt stages so that the laser spot emerging
from a pinhole attached to the collimator reflected off the DBR mirror and back into the pinhole.
This established that the initial angle of incidence of the laser was perpendicular to the DBR mirror
surface within 7 milliradians. An optical lever was used to characterize the characteristics of the
tip-tilt stages attached to the fiber collimators, and these were adjusted to yield an incident angle
of 0.140 radians for the single reflection experiment and 0.083 radians for the multi-reflection
experiment.
A calibrated thermopile detector measured the power of the reflected light when the top fiber was
active, and a beam dump terminated the laser path when the bottom fiber was active. The calibrated
detector was aligned such that the incident beam was approximately perpendicular to its surface.
To position the detector, a small aperture was placed over its surface, and the unit was positioned
with an XYZ translation stage until the measured power was maximized.
Calibration of the reference thermopile system was performed against NIST standard calorimeters
which are in-turn electrically calibrated and traceable to SI units through electrical standards.
During calibrations, the same 1363 nm Raman fiber laser used during the photon momentum
experiments was employed. Due to an atmospheric water line coinciding with the laser line,
calibration activity included measurement and correction for absorption. As the thermopile head
was used in vacuum, its performance under vacuum and atmospheric pressure were measured.

With the water line corrected for, no change in calibration factor was observed. The detector
appears well compensated for the increased temperature rise (<10 °C) caused by loss of convective
cooling at pressures as low as 0.1 Pa. Below this pressure, larger changes in detector responsivity
were noted and may warrant further study in the future.
Results
Prior to the photon momentum force determination, the optical switch’s splitting ratio and the
difference in transmission in the vacuum feedthroughs were characterized. For the single reflection
experiment, the top and bottom fiber collimators were both aligned to be incident on the calibrated
detector, and the beam dump was mounted on an automated translation stage. The incident laser
power was measured while one of the collimators was blocked, and the optical switch used to
direct light to alternating collimators. There was a small amount of switch crosstalk (approximately
-20 dB). This procedure was repeated in air and in vacuum to determine the total change in optical
power as the beam was switched between the two fibers. The laser power was tracked by the laser
power monitoring detector and was constant to within 0.5 %. The results of the experiment are
summarized in Table 1 where β=ΔPbottom/ΔPtop, where ΔPbottom and ΔPtop are changes in power
measured in air and vacuum when switching between the bottom and top fiber outputs respectively.
The differential measurement of power is used to subtract baseline drift. Each experiment was
performed three times over the course of several hours, and the results are presented as the mean
and standard deviation of the three trials. The parameter β is subsequently used to calculate the
amount of power incident on the lower side of the EFB mirror from the laser power measured at
the thermopile detector during force measurements. This factor is unchanged by the transition to

vacuum within experimental uncertainty. For the multiple reflection experiment, the switching
ratio was measured by swapping the optical fibers at their vacuum feedthroughs and performing
force measurements. The same photon pressure force was observed within approximately 0.3 %
before and after swapping, indicating that the effect of the optical path from the feedthrough on
impacted the total laser power delivered to the balance within this tolerance. There is a substantial
change in the optical switching ratio between the single and multiple reflection experiments. This
appears to have been caused by a change in the orientation of the optical switching board within
its custom enclosure between the experiments. The stability of the measured optical power and
EFB force indicates the switching ratio was stable within the single and multi-reflection
experiments.
The DBR mirror properties were also characterized. For this experiment, the laser intensity from
the top fiber collimator was measured by the calibrated detector (aligned as described above) with
the laser reflected off the DBR mirror surface, Pr, and directly incident on the detector, Pd. The
results of this test are shown in Table 2. The observed reflectivities are relatively low compared to
those expected. This is due to the presence of other peaks in the Raman laser outside the DBR’s
optical stop band. In addition to the pump laser at 1090 nm, there are other peaks at approximately
1148 nm, 1207 nm, and 1284 nm. This light is transmitted through the GaAs substrate and can be
observed with a handheld infrared (IR) viewer as it is scattered from the unpolished backside of
this substrate. It is unclear what fraction of the light incident on the wafer backside is absorbed,
what fraction is diffusely scattered, and what the distribution of the scattered light is. This is
discussed further below. The effect was effectively eliminated for the multiple bounce experiments
by using 1350 nm long pass filters, as spectrometer measurements indicate negligible loss at 1363

nm for the mirrors used. After the filters were added, the scattered light on the mirror surface was
no longer visible with the handheld IR viewer.
Fig. 3 shows representative experimental data for the single and multiple reflection experiment.
The data analysis excludes the first three hours of the measurement to accommodate thermal
equilibration at the beginning of the trial. The force shown is the change in the electrostatic force
applied to the capacitor necessary to maintain a constant balance position as the radiation pressure
force was applied to either the top or the bottom of the EFB DBR mirror. The laser power incident
on the two sides of the EFB mirror were slightly different, as is shown in the optical switch splitting
ratio data of Table 1. This causes the temperature to change slightly (about 0.5 °C after sufficient
time for temperature equilibration) depending on whether the bottom or top fiber collimator is
active, likely due to some absorption of the stray peaks of the Raman laser and the heating of the
thermopile detector and beam dump. In order to minimize the effect of the temperature changes,
individual measurements were performed as quickly as possible as described above). The
individual experiments are then repeated over the course of several hours. Because only one of the
fiber switch outputs is recorded by the thermopile detector, and the other output goes to a beam
dump after reflecting from the EFB DBR mirror (cf. Figure 1), the total change in optical power
from the differential photon pressure force, ΔPb, can be calculated using
Δ𝑃𝑏 = Δ𝑃m(1 + 𝛽) (3)
where ΔPm is the power measured with the thermopile during the force measurement. In the multi-
reflection measurement, a small amount of beam spillage was discovered after the conclusion of
the experiment. Approximately 0.015 W of the final reflected laser spot missed the mirror, as
measured with the thermopile detector. This was added as a correction to ΔPm in Eq. 3. The results
of the laser power measurement are shown in Table 3. The vacuum values of β from Table 1 were
used to calculate ΔPb according to whether the data were collected in the single or multiple-
reflection configuration.
The use of a fast optical switch (switching time is approximately 200 ns) also enables measurement
of radiation pressure forces from a pulsed source as long as the switch is much faster than the
mechanical time constant of the balance (approximately 30 seconds). The duty cycle of the pulses
can then be used to continuously tune the differential force on the balance by switching the laser
between the top and bottom mirrors such that measured balance force is directly proportional to
the pulse duty cycle. This approach was implemented in the multi-reflection configuration
illustrated in Fig. 2B. The optical switch was controlled using a pulsed waveform with a frequency
of 1 kHz and a rise time of less than 100 ns. The balance force was measured first with the laser
incident on the top side of the balance at full continuous power and then with the pulsed force
acting on the balance. The difference between these two measurements is the force shown in Fig.
4 and indicates a high degree of linearity between the measured balance force and the pulse duty
cycle (coefficient of determination for a linear regression fit is 0.9996.) A similar result was
obtained for the power measured simultaneously by the thermopile reference detector. This
indicates that we can continuously and deterministically vary the photon pressure forced over the
entire range of the optical power within the limits of the dynamic range dictated by the switching
time. This method keeps the thermal load approximately constant. Limiting thermal drift is
advantageous, as temperature changes caused by modulating the input optical power easily cause
measurement inaccuracies in precision electromechanical balances
Discussion

Measurement of laser power by force measurement or vice-versa requires quantification of the
relative effects of reflection, absorption and scattering. In the single reflection measurement
described above, only part of the light causing the total photon momentum exchange force reaches
the detector. The reflectance of the DBR mirror was measured using the Raman laser at
approximately the same incident angle as used in the force measurement. Assuming reflectance is
the average of the two measurements (see Table 2) and that their uncertainties add in quadrature,
R = 0.959(6) for the single reflection experiment. The light not undergoing specular reflection is
either scattered or absorbed. This light is likely attributable to stray peaks in the Raman laser as
described above. These were effectively eliminated from the measurement in the multiple
reflection experiment using longpass filters and therefore contribute negligibly to the calculated
force in those experiments. The reflectance of the DBR mirrors can be accounted for using
𝑃𝑏 = 𝑃𝑅𝑛 (4).
where n is the total number times the beam is reflected before impinging on the photodetector.
Substituting this into Equations (1) and (3) and summing over the number of reflections incident
on the balance mirror yields an expression for the photon pressure force calculated from the
measured laser power
𝐹𝑝 =Δ𝑃𝑏𝑐𝑜𝑠𝜃
𝑐(2𝑅 + 𝐴 + 𝑆in + 𝑆out(Ω)/𝑐𝑜𝑠𝜃)∑ 𝑅−(𝑛−2𝑞)𝑟
𝑞=0 (5),
where r is one less than the total number of reflections on mirrors attached to the force measuring
part of the EFB, such that r = (n-1)/2 for our parallel flat mirror etalon configuration.

To bound the magnitude of the effect of absorption and scattering on Fp, we posit two limiting
cases. In one case (the upper limit), all the non-reflected incident light is scattered in a direction
parallel to the EFB force measurement axis, yielding an absorbance of A=0 and scattering factors
𝑆in = 𝑆out(Ω) = 1 − 𝑅 (6).
The other limiting case (the lower limit) is that all the non-reflected incident light is absorbed, so
that
𝐴 = 1 − 𝑅 (7).
This is equivalent to the case where all the stray light scatters perpendicular to the force
measurement axis. In the case of the upper limit for the single reflection experiment (i.e., n=1), Fp
= 15.94 nN, and for the lower limit Fp = 15.61 nN. For the purposes of the current measurement,
we take the value of the calibration to be the mean of the upper and lower limiting cases, and
estimate a type B uncertainty for the absorbed and scattered light that is one half the difference
between the upper and lower cases so that our final value for Fp is (15.77 ± 0.80) nN at a coverage
factor of k = 2 [22] for the single reflection experiment, and the uncertainty is provided by the
analysis below.
When measured using monochromatic 1363 nm light using a spectrometer, the mirror reflectivity
was high enough that it could not be reliably measured. Assuming the nominal reflectivity is
correct, the 7 reflections of the laser in the multireflection experiment will cause a change of less
than 0.1% in the laser intensity. The multiple reflection force can be calculated setting n = 7 , R
=1 and A = Sin = Sout = 0 in Equation (5). In this approximation, the expression simplifies to
𝐹p =2𝑅(𝑟+1)Δ𝑃𝑏𝑐𝑜𝑠𝜃
𝑐 (8)
Using this approach, the predicted photon momentum force for the multiple reflection experiment
is (55.8 ± 3.0) nN. The uncertainties reported for both forces are the combined expanded
uncertainties. These two measurements agree with the values determined with the EFB at a
coverage factor of 2.
We note, however, that both measurements of Fp are approximately 4 % lower than the EFB force
measurement. This indicates there is still an error in our assumptions causing a systematic
underestimate of Fp. The thermopile detectors used to determine Pm were calibrated in air but used
in the vacuum chamber with the EFB. We currently have conflicting results as to whether the
vacuum or electronic feedthroughs to the vacuum chamber affect the thermopile detector
calibration, so a detailed characterization of the effects of vacuum on the detector may be necessary
in the future to reduce uncertainty and improve the comparison. The longer-term repeatability of
the optical switching ratio will also be investigated further in future work. The effects of back-
reflected light and blackbody radiation from the detector and beam dump were minimized using
an aperture but can be further minimized by placing the detector and beam dump outside the
vacuum chamber, although this presents a different set of difficulties.
The uncertainty analyses for the measurement of photon pressure force using the thermopile laser
power determinations are shown in Table 4 for the single and multireflection case. The uncertainty
from mirror absorption and scattering dominates the single reflection experiment. The spatial
nonuniformity in the thermopile detector affects several of the measurements. The thermopile
detector was used to measure β, R, and Pm, and required a separate repositioning in each of these
cases, and must be counted twice for R, as this measurement required repositioning twice. This
accounts for 0.04 in the combined relative expanded uncertainty. The uncertainty in reflectivity
for the multireflection experiment is taken as the specified coating reflectivity raised to the seventh

power (i.e., the number of reflections in that experiment.) The EFB force measurement uncertainty
analysis appears elsewhere [12], and is nearly identical, except for the change in corner loading
uncertainty mentioned in the experimental section of this paper, and the statistical uncertainty
shown in Table 3. The statistical uncertainties (repeatabilities over three measurements as shown
in Table 3) of both the balance force and detector reading are an order of magnitude smaller than
the combined uncertainties shown in Table 4, and the uncertainty in balance force is limited by
statistical uncertainty. This indicates that substantial improvement is possible if systematic
uncertainty can be reduced. In the current work, the uncertainty of SI-traceable nanonewton photon
pressure force measurement stands at 5 %. The current methodology can be used to calibrate one
W laser power sources using force measurements with uncertainties useful for a commercial
secondary calibration lab. It can be used as a nanonewton force calibration method with sufficient
accuracy and precision for most micro- and nano-mechanical testing. In addition, since all
calibrations involved in measuring the photon pressure forces are traceable to the SI, the photon
pressure force itself can be considered an SI traceable value as well.
Conclusion
A precision measurement of photon pressure force has been carried out using the NIST
electrostatic force balance. Relative repeatabilities as low as 0.04 % are demonstrated for the
measurement of a nanonewton-level photon momentum exchange force from a 1 W laser. The
absolute accuracy of the EFB measurements is linked to fundamental constants through SI-
traceable electrical units (voltage and capacitance) and dimensional units (displacement).
However, a cross-check to radiometric transfer standards at 1 W is presently limited to

approximately 5 % uncertainty by the spatial nonuniformity of the reference thermopile. These
limitations can be improved with suitable improvements in transfer standards, improvement in the
repeatability of the laser alignment on the reference detector, or the use of a separate detector for
each reflection pathway. A possible discrepancy less than the uncertainty may exist as well and
may be clarified by a refinement in the method. An approach using a pulsed laser allows for
continuous tuning of the photon pressure force over the operational range with a high degree of
linearity to pulse duty cycle, allowing continuous variation of the low-frequency force produced
on the balance.
Acknowledgements
The authors thank NIST Scientists John Lehman for helpful discussions on experimental
technique, Joseph T. Hodges for calculation of water vapor absorption line characteristics, as well
as Ari Feldman and Todd Harvey for DBR mirror fabrication.
NIST Disclaimer: This article is authored by employees of the U.S. federal government and is not subject to
copyright. Commercial equipment and materials are identified in order to adequately specify certain procedures. In
no case does such identification imply recommendation or endorsement by the National Institute of Standards and
Technology, nor does it imply that the materials or equipment identified are necessarily the best available for the
purpose.
References
[1] Clausen-Schaumann H, Rief M, Tolksdorf C and Gaub H E 2000 Mechanical stability of
single DNA molecules. Biophys. J. 78 1997–2007
[2] Munevar S, Wang Y and Dembo M 2001 Traction force microscopy of migrating normal
and H-ras transformed 3T3 fibroblasts. Biophys. J. 80 1744–57

[3] Sweetman A, Jarvis S, Danza R, Bamidele J, Gangopadhyay S, Shaw G A, Kantorovich L
and Moriarty P 2011 Toggling Bistable Atoms via Mechanical Switching of Bond Angle
Phys. Rev. Lett. 106 136101
[4] Lee G-H, Cooper R C, An S J, Lee S, van der Zande A, Petrone N, Hammerberg A G, Lee
C, Crawford B, Oliver W and others 2013 High-strength chemical-vapor–deposited
graphene and grain boundaries Science 340 1073–1076
[5] Smith D T and Pratt J R 2015 Measurement of the Gold-Gold Bond Rupture Force at 4 K
in a Single-Atom Chain Using Photon-Momentum-Based Force Calibration ResearchGate
26
[6] Gates R S and Pratt J R 2006 Prototype cantilevers for SI-traceable nanonewton force
calibration Meas. Sci. Technol. 17 2852–60
[7] Kim M-S, Pratt J R, Brand U and Jones C W 2012 Report on the first international
comparison of small force facilities: a pilot study at the micronewton level Metrologia 49
70–81
[8] Wilkinson P R, Shaw G A and Pratt J R 2013 Determination of a cantilever’s mechanical
impedance using photon momentum Appl. Phys. Lett. 102 184103-184103–3
[9] Melcher J, Stirling J, Cervantes F G, Pratt J R and Shaw G A 2014 A self-calibrating
optomechanical force sensor with femtonewton resolution Appl. Phys. Lett. 105 233109
[10] Madec T, Mann G, Meury P-A and Rabault T 2007 Micro-mass standards to calibrate the
sensitivity of mass comparators Metrologia 44 266–74
[11] Mettler Toledo 2014 Traceability with Microgram Weights Mass Standards Down to 0.05
mg
[12] Shaw G A, Stirling J, Kramar J A, Moses A, Abbott P, Steiner R, Andrew Koffman, Pratt J
R and Kubarych Z J 2016 Milligram mass metrology using an electrostatic force balance
Metrologia 53 A86
[13] Rodney W. Leonhardt Calibration Service for Low-level Pulsed-Laser Radiometers at 1.06
um: Pulse Energy and Peak Power - sp250_64a.pdf
[14] Williams P A, Hadler J A, Lee R, Rogers K, Simonds B, Spidell M. Stephens A, Feldman
A and Lehman J, 2017 Portable, high-accuracy, non-absorbing laser power measurement at
kilowatt levels by means of radiation pressure Opt. Express 25 4382-92
[15] Nichols E F and Hull G F 1901 A Preliminary Communication on the Pressure of Heat and
Light Radiation Phys. Rev. Ser. I 13 307–20
[16] Nichols E F and Hull G F 1903 The pressure due to radiation.(second paper.) Phys. Rev.
Ser. I 17 26

[17] Jones R V and Leslie B 1978 The Measurement of Optical Radiation Pressure in
Dispersive Media Proc. R. Soc. Lond. Math. Phys. Eng. Sci. 360 347–63
[18] Mossavi K, Hewitson M, Hild S, Seifert F, Weiland U, Smith J R, Lück H, Grote H,
Willke B and Danzmann K 2006 A photon pressure calibrator for the GEO 600
gravitational wave detector Phys. Lett. A 353 1–3
[19] Mueller F, Heugel S and Wang L J 2008 Femto-Newton light force measurement at the
thermal noise limit Opt. Lett. 33 539–41
[20] Nesterov V, Mueller M, Frumin L L and Brand U 2009 A new facility to realize a
nanonewton force standard based on electrostatic methods Metrologia 46 277–82
[21] Agatsuma K, Friedrich D, Ballmer S, DeSalvo G, Sakata S, Nishida E and Kawamura S
2014 Precise measurement of laser power using an optomechanical system Opt. Express 22
2013–30
[22] Taylor B N and Kuyatt C E 1994 NIST Technical Note 1297
[23] Vasilyan S, Frölich T and Manske E 2017 Total momentum transfer produced by the
photons of a multi-pass laser beam an evident avenue for optical and mass metrology Opt.
Express 17 20798-816
[24] Wherrett B S 1984 Scaling rules for multiphoton interband absorption in semiconductors J.
Opt. Soc. Am. B 1 67-72

Figures and tables
9
1
2
3
4
5 6
7 8
10
11
12
9
Figure 1. EFB configuration. Left schematic: Balance mechanism (1), inner capacitor cylinder (2), outer
capacitor cylinder (3), buckling spring (4), tip-tilt stage (5), EFB photon pressure force extension (6),
aluminum thermal barrier (7), DBR mirrors (8), stabilized He-Ne laser (9), differential Michaelson
interferometer (10), EFB base (11), vacuum system enclosure, dashed line (12). Right: photograph of
apparatus, numbers shown correspond to the same components in the schematic.
1
6
2
7

Figure 2. A: Single reflection experimental schematic. Fiber coupled Raman laser (1), fiber isolator (2),
4 % fiber beamsplitter (3), laser power monitoring detector (4), optical switch (5), fiber-coupled
collimators on tip-tilt stages (6), calibrated detector on xyz translation stage (7), beam dump (8), EFB
extension (9), DBR mirrors on top and bottom sides of EFB extension (10), thermal barrier (11), vacuum
enclosure represented by dashed line (12). Yellow lines (13) indicate fiber optic cables. B: Multiple
reflection schematic outline.
1
2
3
4
5 6
6
7
8
9
10 11
12
A
B
13

Figure 3. Time series data of Fe (electrostatic force, left axis red data) and ΔPm (measured optical power,
right axis blue data) for single reflction (A) and multiple reflection (B) experiment.
A
B

Figure 4. Electrostatic force as a function of optical switching duty cycle. Line shows linear least squares
fit to data points. Error bars indicate standard deviation of multiple force measurements performed
during an experiment.

Table 1. Measurement of optical switching ratio, β. Parentheses indicate one standard deviation for
measured laser powers. This uncertainty is the quadrature sum of the two uncertainties in laser power used
for the calculation of β.
Collimator Air (single) Vacuum (single) Vacuum (multiple)
ΔPtop / W 0.889(2) 0.915(1) 0.939(2)
ΔPbottom / W 1.572(3) 1.622(2) 1.260(1)
β 1.768(4) 1.773(2) 1.320(4)

Table 2. DBR mirror reflectivity measurements. Uncertainties noted in parentheses are the standard
deviation of three measurement trials for ΔPr and ΔPd; the uncertainty in R is the quadrature sum of the
uncertainty in those two terms.
Mirror ΔPr / W ΔPd / W R
DBR 1 0.972(4) 1.010(2) 0.962(4)
DBR 2 0.966(4) “ 0.956(4)

Table 3. Measured electrostatic force, laser power and associated uncertainties. Uncertainties noted in
parentheses are the standard deviation of multiple force measurements within a trial for the force
measurements, and the quadrature sum of the uncertainty in measured power and β for laser power
measurements. urel is relative expanded uncertainty.
Single Reflection Multiple Reflections
Trial Fe / nN ΔPb / W Fe / nN ΔPb / W
1 16.54(47) 2.31243(390) 58.26(49) 2.09688(629)
2 16.62(40) 2.31307(439) 58.3(1.0) 2.09836(654)
3 16.62(41) 2.31329(444) 58.3(1.0) 2.10506(762)
Mean 16.59 2.31293 58.288 2.10010
Repeatability 0.046 0.00045 0.024 0.0044
urel (k=2) 0.0055 0.00039 0.00082 0.0042

Parameter u single u multiple Type Notes
β 0.001 0.002 A
0.01 0.01 B From thermopile spatial nonuniformity
ΔPm 0.0002 0.002 A
0.01 0.01 B From thermopile spatial nonuniformity
0.007 0.007 B Laser alignment
stray light 0 0.014 B
R 0.004 0.001 A
0.01 0.00 B From thermopile spatial nonuniformity
(counted twice)
absorption/
scattering
0.01 0 B
K 0.005 0.005 Thermopile calibration uncertainty
Relative
Combined
Expanded
Uncertainty
0.05 0.04
Table 4. Uncertainty analysis from photon pressure force measurement using thermopile
reference detector to calculate force. Uncertainty components are shown as relative uncertainties.