Embed Size (px)
Citation preview

122
ITB J. Eng. Sci. Vol. 40, No. 2, 2008, 122-144
Comparison of Eight Month Coastal Polluted Porcelain
and Epoxy Resin Outdoor Insulators
1Waluyo,
2Ngapuli I. Sinisuka,
2Parouli M. Pakpahan,
2Suwarno &
3Maman A. Djauhari
1Doctoral Student, Power Electric Scientific Group, STEI 2Academic Staff, Power Electric Scientific Group, STEI
3Research Group on Statistics, Department of Mathematics
Bandung Institute of Technology, Jl. Ganesha No. 10 Bandung 40132 Indonesia
Abstract. This study presents the experimental results of eight months naturally
coastal polluted outdoor porcelain and epoxy resin insulators. The experiments
were leakage current and applied high voltage measurements used a two-channel
storage digital oscilloscope, in the hermetically sealed chamber, where
temperature, humidity, pressure and applied voltage could be adjusted and
measured simultaneously. The leakage current waveforms were analyzed using FFT and the relation to environmental parameters were analyzed using
correlation matrix of multivariate statistical tools. It was also conducted SEM
and EDAX tests.
Base on the correlation coefficient matrix, the humidity contributed to leakage
current amplitude and phase angle on the porcelain insulator were very
significant, with the correlation coefficient were 0.60 and -0.68 respectively.
Whereas, on polluted epoxy resin insulator, the humidity did not influence to
leakage current and phase angle considerably. Generally, the surface became
rougher than the new one. The most three chemical elements in pollutants were
chlorine, silicon and ferrum.
Keywords: epoxy resin; humidity; insulator; leakage current; phase angle; porcelain.
1 Introduction
Overhead transmission or distribution lines are widely used in present power
system to transmit electric power from generation stations to customer points. Their proper function depends to a large extent on the insulation system with
the supporting structures [1]. The performance of outdoor insulators, as main
insulating materials, is affected by some parameters. One of these parameters is environmental pollution, whether its severity or chemical compositions.
The pollution flashover process of insulators is greatly influenced by the
insulator’s surface properties. Two surface conditions are recognised, either
hydrophilic or hydrophobic. A hydrophilic surface is generally associated with ceramic insulators, such as porcelain insulators, whereas a hydrophobic surface

Polluted Porcelain and Epoxy Resin Outdoor Insulators 123
is generally associated with polymeric insulators. Under wet conditions – such
as rain, mist, etc., hydrophilic surfaces will wet out completely so that an
electrolyte film covers the insulator [2].
One can summarise the whole process as an interaction between the insulator, pollutants, wet conditions, and applied voltage. Thus, for a better understanding
of insulator pollution, wetting and the flashover process, some terms should be
studied. Some terms related to this case are the local climate and environmental (pollution) conditions surrounding the insulator with emphasis on wetting,
pollution sources and type of pollution, and leakage current flowing over the
surface of insulator [2].
The performance of insulator under contaminated conditions is the underlying factor that determines insulation design for outdoor application. Contamination
play an important role in every outdoor insulator application. This fact was
recognized since the very beginning of outdoor power delivery. Today, there are standardized contamination test for porcelain and glass insulators, but not for
composite insulators. There are instances where discrepancies between
laboratory predictions and field experience arise. Thus, it is important to have a good understand the advantages and limitations of laboratory testing, in order to
develop more sensible tests for ceramic and nonceramic insulators [3].
One of typical source of insulator pollutants is marine or coast [4]. Indonesia
has the longest of coastal line in the world. Usually, a coastal region is passed through by electric power transmission or distribution lines, including
switchyard. Thus, it is important to take a sample of polluted porcelain insulator
as ceramic sample, and epoxy resin insulator as non-ceramic sample from a place near the coast for research. Nevertheless, the environmental variation of
humidity, temperature and pressure were simulated in the laboratory.
The objectives of research are to obtain the comparison of leakage current
properties between eight-month coastal polluted porcelain and epoxy resin insulators on various relative humidities, temperatures, pressures and applied
voltages. These properties are amplitudes, waveforms and phase angles of
leakage current. They are tools of assessment of outdoor insulator performance. The relations among the properties to environmental parameters are analyzed
using correlation coefficient matrix of multivariate statistical tool. Thus, it can
be understood how much each variable influence to another. As addition, it is presented SEM test results of specimen insulator surfaces and pollutants, and
chemical element analysis of pollutants using EDAX.

124 Waluyo, et al.
2 Experimental and Analysis Methods
These experiments were conducted on two 20 kV outdoor insulators. One type
was porcelain, and another one was epoxy resin. The insulators were naturally coastal polluted, which have been installed at PLN switchyard of Pangandaran,
West Java, just around 600 m from the beach, on December 15th, 2006, and then
taken on August 21st, 2007.
Both insulators were tested in a hermetically sealed chamber, where temperature, humidity, pressure and applied high voltage could be adjusted and
measured simultaneously. The size of the chamber was 120 cm x 150 cm x 120
cm (WxHxD). The measurements of leakage current and applied high voltage waveforms used a 100 MHz two-channel storage digital oscilloscope. The
measured data could be recorded and transferred to a computer using USB
(Universal Serial Bus) and could be saved in softcopy form. The data could be read and saved in Excel and Bitmap forms. The schematic diagram of
experimental setup is shown on Figure 1.
Figure 1 Schematic diagram of experimental setup.
Furthermore, the leakage current waveforms were analyzed using fast Fourier transform, so that it would be obtained amplitudes of harmonics. Finally, total
harmonic distortion (THD) is defined as the total ratio of the harmonic
component amplitudes and the fundamental amplitudes, which it can be expressed as below [5].
1
~
2
2
I
I
THDn
n
(1)
where In is nth appear harmonic amplitudes, which in this case it is first to
thirteenth odd harmonics, because they appeared dominantly. Otherwise, I1 is fundamental harmonic amplitude.

Polluted Porcelain and Epoxy Resin Outdoor Insulators 125
Thus, the frequency spectra were obtained on various conditions of insulators.
These implementations used the Danielson-Lanczos method [6]. Whereas the
relation of leakage current properties to environmental parameters were
analyzed using correlation coefficient matrix of multivariate statistical tools. The correlation matrix is derivation of covariance matrix to understand how
much level of correlation among variables or parameters, as follows [7,8].
n
j
yjxj yxn
YXCov1
1, (2)
Thus, the components of correlation coefficient matrix as below.
yx
yx
YXCov
.
,, (3)
where X and Y are variables X and Y respectively, that is covariance between
variable X and Y, xj and yj are jth data of X and Y variables respectively, x and
y are mean data of X and Y variables, x and y are data variance of X and Y variables respectively.
The values of correlation matrix components are between -1 up to 1. If a value
close to -1, it represents that one parameter highly influences to another, but it is reciprocal property. Otherwise, if a value close to 1, it reveals that one
parameter highly proportional influences to another. Finally, if a value close to
zero, it is minor in dependency.
It is also shown the test results of SEM (scanning electron microscope) for both
new-clean and polluted insulator specimens, and pollutants stuck on insulator
surfaces. Besides that, it is indicated the major chemical element contained in the pollutants using EDAX (Energy Dispersive Analysis of X-rays) tests.
3 Result and Discussion
3.1 Polluted Porcelain Insulator
In this manuscripts, it is shown two main conditions of leakage current
measurement results as sample, i.e. dry and wet conditions. In dry hermetically
sealed chamber condition, as first sample, the waveform of typical leakage current measurement in bitmap form is shown on Figure 2. This waveform was
obtained on condition of relative humidity, temperature, pressure and maximum
applied voltage were 71%, 42.4oC, 0.2 kPa and 55.4 kV respectively. This
waveform is not so significantly different from that the previous dry condition

126 Waluyo, et al.
of new-clean porcelain insulator. Thus, in dry condition, the pollutants stuck on
porcelain insulator surface did not influence leakage current significantly.
Figure 2 Bitmap form of applied voltage and leakage current waveforms of dry
polluted porcelain insulator.
Whereas Figure 3 is Excel graphical form of applied voltage and leakage
current waveforms of polluted insulator on that condition. The applied voltage is pure sinusoidal waveform, that the magnitude values are mentioned on the
right side. Otherwise, the magnitude values of leakage current wave are
indicated on the left side. Based on this leakage current waveform, it will be
analyzed the frequency spectrum using fast Fourier transform.
-0.05
-0.04
-0.03
-0.02
-0.01
0
0.01
0.02
0.03
0.04
0.05
0 10 20 30 40 50 60 70 80 90 100
TIME (ms)
LE
AK
AG
E C
UR
RE
NT
(m
A)
-60
-48
-36
-24
-12
0
12
24
36
48
60
AP
PL
IED
VO
LT
AG
E (
kV
)
LEAKAGE CURRENT (mA) APPLIED VOLTAGE (kV)
Figure 3 Excel graphical form voltage and leakage current waveforms of dry
polluted porcelain insulator.
V = applied voltage I = leakage current

Polluted Porcelain and Epoxy Resin Outdoor Insulators 127
Figure 4 shows the frequency spectrum of leakage current waveform of Figure
3. On this condition, the first to thirteenth odd harmonics are 80.15%, 0.97%,
17.94%, 5.2%, 0.27%, 1.6%, 0.39% respectively compared to the leakage
current amplitude. The third harmonic is very small, so that it still operated normally. Otherwise, the total harmonic distortion (THD) is 23%, so that it is
also normal condition.
0
0.005
0.01
0.015
0.02
0.025
0.03
0.035
0 100 200 300 400 500 600 700 800 900 1000
F (Hz)
CO
MP
LE
X (
mA
)
Figure 4 Frequency spectrum of leakage current waveforms of Figure 3.
On other condition, Figure 5 shows bitmap form of leakage current and applied
voltage waveforms on polluted insulator due to 99%, 26oC, -0.8 kPa and 10.9
kV of relative humidity, temperature, pressure and maximum applied voltage
respectively. Furthermore, Figure 6 is its Excel graphical form. This is as sample of wet condition.
Figure 5 Bitmap form of applied voltage and leakage current waveforms of wet
polluted porcelain insulator.
V = applied voltage I = leakage current

128 Waluyo, et al.
The applied voltage is pure sinusoidal waveform, that the magnitude values are
mentioned on the right side. Otherwise, the magnitude values of leakage current
wave are indicated on the left side. In this condition, the phase difference
between leakage current and applied voltage waves is 12.2 degree. This drastically reduces rather than that the new-clean porcelain insulator. In other
word, the leakage current wave tends to close for coinciding close to pure
sinusoidal waveforms. This means that the insulator was significantly more resistive compared to previous one.
-0.15
-0.1
-0.05
0
0.05
0.1
0.15
0 10 20 30 40 50 60 70 80 90 100
TIME (ms)
LE
AK
AG
E C
UR
RE
NT
(m
A)
-15
-10
-5
0
5
10
15
AP
PL
IED
VO
LT
AG
E (
kV
)
LEAKAGE CURRENT (mA) APPLIED VOLTAGE (kV)
Figure 6 Applied voltage and leakage current waveforms of wet polluted
porcelain insulator.
Based on this leakage current waveform, it will be analyzed the frequency
spectrum using fast Fourier transform. Figure 7 represents the frequency
spectrum of leakage current waveform on Figure 12. The first to thirteenth odd harmonics are 95.15%, 1.11%, 5.1%, 0.97%, 0.52%, 0.77% and 0.36%
respectively compared to leakage current amplitude. The total harmonic
distortion (THD) is only 6%. These reasonable due to the leakage current waveform tends to close pure sinusoidal wave. This is the most resistive and
conductive among previous conditions. The resistive condition is indicated by
the phase difference between leakage current and applied voltage waves, and THD are very small. Whereas, the conductive condition is indicated by high
amplitude of leakage current.

Polluted Porcelain and Epoxy Resin Outdoor Insulators 129
0
0.02
0.04
0.06
0.08
0.1
0.12
0 100 200 300 400 500 600 700 800 900 1000
F (Hz)
CO
MP
LE
X (
mA
)
Figure 7 Frequency spectrum of leakage current waveforms of Figure 6
The behaviours of parameters on the measurements of polluted porcelain
insulator are shown on Table 1. Based on this correlation matrix, the relative humidity considerably influences to the maximum leakage current magnitude
and the phase difference between leakage current and applied voltage. These are
60% and -68% respectively. This gives explanation that the relative humidity
enhanced the maximum leakage current very significantly. This is also supported by the negative value of correlation component between applied
voltage and leakage current. This indicates that the leakage current is
dominantly influenced by relative humidity, rather than applied voltage, although the leakage current existence due to applied voltage technically. As
addition, the relative humidity influences to phase difference also considerably,
that the correlation coefficient is -68%. The phase difference will reduce as the relative humidity increases. First to last columns are maximum applied voltage,
maximum leakage current, relative humidity, temperature, pressure, phase
difference between leakage current and applied voltage waves, cosine of phase
difference, first to thirteenth odd harmonics, and total harmonic distortion (THD) respectively. The actual data of pressure in chamber were positive and
negative. The positive pressure means the chamber was compressed, and the
negative pressure means the chamber was sucked, using electric pumps. Generally, on the actual data, the phase difference between leakage current and
applied voltage will reduce as the relative humidity increases. Table 1 express
the correlation matrix among variables of measurements on the coastal polluted insulator.

130 Waluyo, et al.
Table 1 The levels of correlation among parameters on the polluted porcelain
insulator.
Otherwise, the leakage current amplitude influences to phase angle very significantly, that is -90%. The phase angle will reduce as the leakage current
amplitude increases. Base on above explanation, the leakage current of polluted
insulator is dominantly influenced by relative humidity. Furthermore, the leakage current magnitude affects to phase angle very significantly. This
indicates that on high relative humidity, the polluted insulator had resistive-
capacitive non-linear characteristic property. This was occurred due to porcelain
insulator property susceptible to pollution and humidity.
Generally, the leakage current amplitude will reduce as temperature rises.
Technically, a high temperature existence will reduce the relative humidity, that
the leakage current magnitude will consequently reduce. The high temperature also raise the phase angle. In other word, in high temperature, the insulators will
be more capacitive rather than in low temperature, due to relative humidity.
However, the rate of capacitive property to the temperature was higher on polluted insulator rather than that on new-clean insulator.
Nevertheless, usually the magnitude value of phase angle is higher on the new-
clean porcelain insulator rather than on the polluted one, in same condition of
relative humidity. This is also indicated that the polluted insulator was more resistive than the new-clean one.
Practically, on this -4 up to 5 kPa range, the pressure did not influence to
leakage current or phase angle. This is indicated by components of matrix correlated to pressure parameter as very low value. The complete data of

Polluted Porcelain and Epoxy Resin Outdoor Insulators 131
measurements on coastal polluted porcelain insulator on this condition are
shown on Table 2.
Table 2 The recapitulation of coastal-polluted porcelain insulator
experimental data.

132 Waluyo, et al.
3.2 Polluted Epoxy Resin Insulator
Like as porcelain insulator, on the epoxy resin insulator, it is also shown two main conditions of leakage current measurement results, i.e. dry and wet
conditions. In this case, the sample of dry condition was 49.6 kV, 27.6oC, 68%,
and 0 kPa of applied voltage, temperature, relative humidity and pressure
respectively. In dry hermetically sealed chamber condition, the waveform of typical leakage current measurement of epoxy resin insulator in Bitmap form
shown on Figure 8. This waveform is not so significantly different from that the
previous dry condition of new-clean epoxy resin insulator. Thus, in dry condition, the pollutant stuck on porcelain insulator surface did not influence
leakage current significantly.
Figure 8 Bitmap form of applied voltage and leakage current waveforms of dry
polluted epoxy resin insulator.
Whereas Figure 9 is Excel graphical form of applied voltage and leakage
current waveforms of polluted epoxy resin insulator on Figure 8 condition. The
applied voltage is pure sinusoidal waveform, that the magnitude values are mentioned on the right side. Otherwise, the magnitude values of leakage current
wave are indicated on the left side. On this condition, the amplitude of leakage
current and phase difference between leakage current and applied voltage are 96
A and 76.8 degree respectively. It is indicated that the leakage current is very low, and the phase angle is so large. Thus, the insulator property is still capacitive. Based on this leakage current waveform, it will be analyzed the
frequency spectrum using fast Fourier transform.
V = applied voltage I = leakage current

Polluted Porcelain and Epoxy Resin Outdoor Insulators 133
-0.12
-0.1
-0.08
-0.06
-0.04
-0.02
0
0.02
0.04
0.06
0.08
0.1
0.12
0 10 20 30 40 50 60 70 80 90 100
TIME (ms)
LE
AK
AG
E C
UR
RE
NT
(m
A)
-60
-40
-20
0
20
40
60
AP
PL
IED
VO
LT
AG
E (
kV
)
LEAKAGE CURRENT (mA) APPLIED VOLTAGE (kV)
Figure 9 Excel graphical form voltage and leakage current waveforms of dry
polluted epoxy resin insulator.
Figure 10 shows the frequency spectrum of leakage current waveform of Figure 9. In this condition, the first to thirteenth odd harmonics are 82.9%, 0.1%,
17.7%, 5.9%, 0.6%, 1.4%, 0.3% respectively, compared to the leakage current
amplitude. The third harmonic is very small, so that it still operated normally.
Otherwise, the total harmonic distortion (THD) is 22.6%, so that it is also normal condition.
0
0.01
0.02
0.03
0.04
0.05
0.06
0.07
0.08
0 100 200 300 400 500 600 700 800 900 1000
F (Hz)
HA
RM
ON
ICS
(m
A)
Figure 10 Frequency spectrum of leakage current waveforms of Figure 9.
On the other condition, Figure 11 shows Bitmap form of leakage current and
applied voltage waveforms on polluted epoxy resin insulator due to 50.4kV, 99%, 24
oC, 0 kPa of applied voltage, relative humidity, temperature and
pressure respectively. Furthermore, Figure 12 is its Excel graphical form. This
is as sample of wet condition.

134 Waluyo, et al.
Figure 11 Bitmap form of applied voltage and leakage current waveforms of
wet polluted epoxy resin insulator.
-0.1
-0.08
-0.06
-0.04
-0.02
0
0.02
0.04
0.06
0.08
0.1
0 10 20 30 40 50 60 70 80 90 100
TIME (ms)
LE
AK
AG
E C
UR
RE
NT
(m
A)
-60
-40
-20
0
20
40
60
AP
PL
IED
VO
LT
AG
E (
kV
)
LEAKAGE CURRENT (mA) APPLIED VOLTAGE (kV)
Figure 12 Excel graphical form voltage and leakage current waveforms of wet
polluted epoxy resin insulator.
The applied voltage is pure sinusoidal waveform, that the magnitude values are
mentioned on the right side. Otherwise, the magnitude values of leakage current
wave are indicated on the left side. On this condition, the amplitude of leakage current and phase difference between leakage current and applied voltage are 92
A and 68.9 degree respectively. It is indicated that the leakage current is very low, and the phase angle is just small difference, that is just around 7.9 degree
lower than that the dry one. Thus, the insulator property is also still capacitive.
This is also supported by indication of leakage current which still so far from sinusoidal waveform. Based on this leakage current waveform, it will be
analyzed the frequency spectrum using fast Fourier transform.
V = applied voltage I = leakage current

Polluted Porcelain and Epoxy Resin Outdoor Insulators 135
0
0.01
0.02
0.03
0.04
0.05
0.06
0.07
0.08
0 100 200 300 400 500 600 700 800 900 1000
F (Hz)
HA
RM
ON
ICS
(m
A)
Figure 13 Frequency spectrum of leakage current waveforms of Figure 12.
Figure 13 shows the frequency spectrum of leakage current waveform of Figure 12. In this condition, the first to thirteenth odd harmonics are 85.7%, 0.8%,
18.4%, 6.6%, 0.9%, 1.6% and 0.4% respectively, compared to the leakage
current amplitude. The third harmonic is very small, so that it still operated
normally. However, the first harmonic is fairly small higher rather than the dry one. Thus, actually it can be concluded that on the epoxy resin insulator in
condition, the leakage current is fairly smaller influenced by wet relative
humidity condition than that the porcelain one. Otherwise, the total harmonic distortion (THD) is 22.9%, nearly same as the dry one, so that it is also normal
condition.
Table 3 The levels of correlation among parameters on the polluted epoxy
resin insulator.

136 Waluyo, et al.
The behaviors of parameters on the measurements of polluted epoxy resin
insulator are shown on Table 3. First to last columns are maximum applied
voltage, maximum leakage current, relative humidity, temperature, pressure,
phase difference between leakage current and applied voltage waves, cosine of phase difference, first to thirteenth odd harmonics, and total harmonic distortion
(THD) respectively. The actual data of pressure in chamber were positive and
negative. The positive pressure means the chamber was compressed, and the negative pressure means the chamber was sucked, using electric pumps. Based
on this correlation matrix, the relative humidity did not significant to influence
to the leakage current magnitude and the phase difference between leakage
current and applied voltage. These are only 25% and -8% respectively. This gives explanation that the relative humidity enhanced the maximum leakage
current and reduced phase angle slightly. Otherwise, the applied voltage
influenced to the leakage current was still considerable, that is 82%.
Table 4 The recapitulation of coastal-polluted epoxy resin insulator
experimental data.

Polluted Porcelain and Epoxy Resin Outdoor Insulators 137
This phenomenon occurred due to epoxy resin insulator surface made water
droplets of humidity tend to be small spots, rather than to spread out or blot.
Thus, on this condition, the leakage current was still dominated by applied
voltage. Furthermore, the leakage current magnitude determined the magnitude of harmonics. Generally, the harmonics have a high correlation to the leakage
current amplitude. Otherwise, the complete recapitulation data of measurements
on polluted epoxy resin insulator on this condition are shown on Table 4.
3.3 Test Results of SEM and EDAX
3.3.1 New and Clean Specimens
Visual inspections on insulator specimen surfaces and sticky pollutants on
insulator surfaces were conducted using SEM (scanning electron microscope).
The tested insulator specimens were exactly same materials as the insulator
samples accordingly. Whereas the pollutants were removed or scraped using a cutter from insulator sticky pollutants.
A qualitative estimation of the extent of degradation can be made by visual
inspection alone and these can be examined in detail by SEM. Cracks and pits can easily be observed on the surfaces. SEM imaging can, therefore, provide a
qualitative estimate of both the type and extent of a degradation [9].
Figure 14 Typical SEM test result on the surface of new-clean porcelain
insulator specimen.
Figure 14 shows a surface of new-clean porcelain insulator specimen using
SEM with magnification 2000 times. It is seen that the surface is very smooth. Whereas Figure 15 shows the magnifying surface of new-clean epoxy resin
insulator specimen. The magnifying level is same as previous, i.e. 2000 times to
the actual condition.

138 Waluyo, et al.
Figure 15 Typical SEM test result on the surface of new-clean porcelain
insulator specimen.
It is seen the new-clean epoxy resin insulator specimen surface is rougher than the porcelain one. It is reasonable that on porcelain surface was coated by
glazing [3]. Whereas, the epoxy resin surface was coated by silicone-based
mould for providing of hydrophobic surface [4].
3.3.2 Coastal Polluted Porcelain Insulator Specimen
Figure 16(a) and 16(b) show typical SEM test results of polluted specimen. The
specimen was one piece, however, the taking picture was twice. These show that the surface rather different from the new-clean one (Figure 14). Typically
the surface became dirty, and fairly rougher. This is reasonable due to existence
of pollutant on the surface of specimen.
(a)

Polluted Porcelain and Epoxy Resin Outdoor Insulators 139
(b)
Figure 16 Typical SEM test result on the surface of polluted porcelain
insulator specimen.
However, generally the surface was still smooth. This mean the glazing of
porcelain surface was not significant influenced by environmental conditions on
this coastal area.
Figure 17 Typical SEM test result of pollutant on polluted porcelain insulator.
Figure 17 shows a typical SEM test result of pollutant on polluted porcelain insulator. The pollutant was scraped from the polluted porcelain insulator
surface. It is seen that the pollutant not so clayey, because it was scraped from
the insulator glaze, that the nearly all of glaze part was not included by scraping.
Besides that, due to the glaze was very hard, so that the pollutant did not mix with it physically or chemically.

140 Waluyo, et al.
Table 5 Test result of EDAX on pollutant of porcelain insulator surface.
No. Elements First Test
(%)
Second
Test (%)
Everage
(%)
1 Cl 28.82 34.01 31.42
2 Si 20.29 13.34 16.82
3 Fe 14.81 17.78 16.30
4 Ca 13.38 15.10 14.24
5 Na 10.97 10.60 10.79
6 Al 8.79 4.84 6.82
7 K 2.94 4.33 3.64
Table 5 shows the list of major chemical elements of EDAX test result
contained in the pollutant scraped from the polluted porcelain insulator surface.
This is reasonable the most dominant pollutant found was Chlorine, due to effect of marine. This is also most agreement with the previous one. Typically
this elemen t is in some composition forms, such as NaCl, AlCl3, CaCl2, KCl
and MgCl2 [2].
The second one is Silicon that usually in form of SiO2. Generally, this
compound is from dust of soil, that soil is mostly contained of Silicon. Whereas,
Ferrum is supposed origin from metals around insulator, soil or stone, including concrete.
3.3.3 Coastal Polluted Epoxy Resin Insulator Specimen
Figure 18(a) and 18(b) show typically SEM test result of polluted epoxy resin insulator specimen. The surfaces were rougher rather than the new-clean one.
This is caused by two parameters, one is pollutant stuck on the surface and
another one due to scratch or pits. As the property of the siliconed epoxy resin surface, the smoothness of surface will be reduced due to environmental effects,
including sun ray. Thus, it is reasonable that the polluted epoxy resin insulator
be rougher rather than the polluted porcelain insulator specimen.
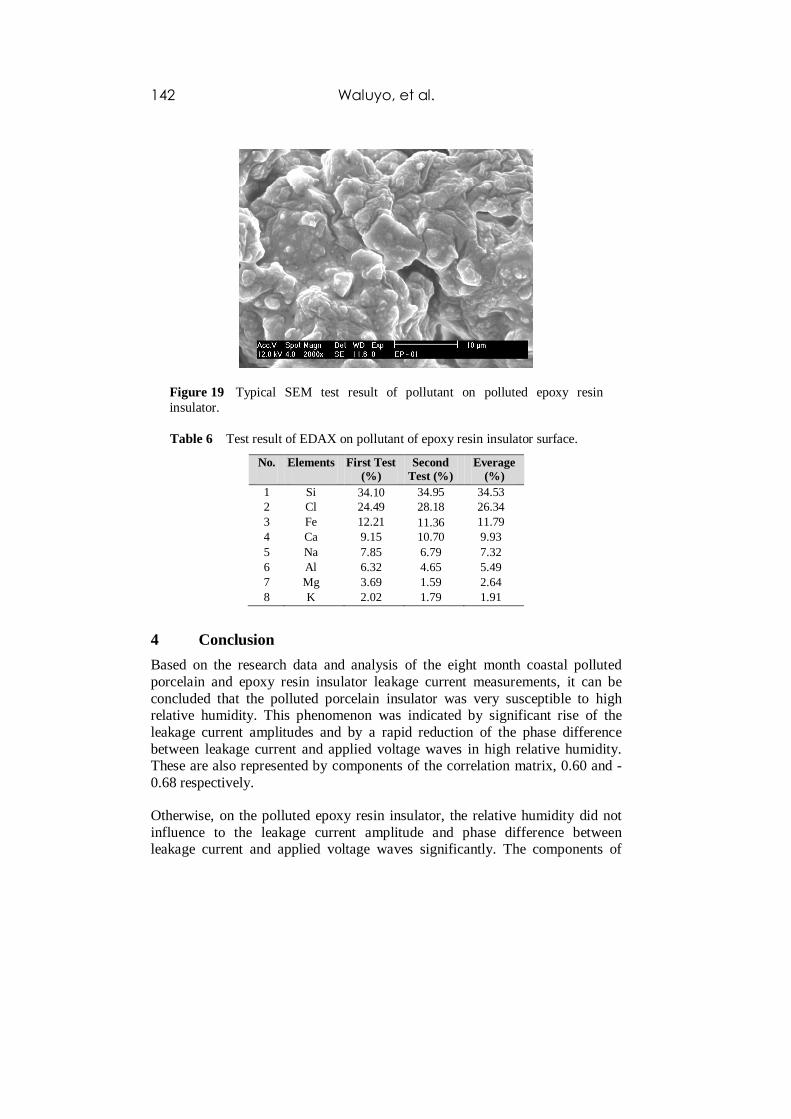
Whereas, Figure 19 shows the SEM test result of pollutant scraped from epoxy resin insulator surface. It is seen the pollutant is more clayey compared to the
pollutant scraped from polluted porcelain insulator. This phenomenon was
caused by the pollutant mixed to the silicone coating on insulator surface. This was naturally occurred or manually occurred when scraped the pollutant.

Polluted Porcelain and Epoxy Resin Outdoor Insulators 141
(a)
(b)
Figure 18 Typical SEM test result on the surface of polluted epoxy resin insulator specimen.
Otherwise, Table 6 shows test result of EDAX on pollutant of epoxy resin
insulator surface. Although the most chemical compound was silicon chemical
element. Chlorine was still major element of pollutant. This Chlorine was
usually in composition of NaCl, MgCl2, AlCl3, KCl and CaCl2. Silicon chemical element became the most was caused by soil dust and/or added by insulator
material itself.
142 Waluyo, et al.
Figure 19 Typical SEM test result of pollutant on polluted epoxy resin
insulator.
Table 6 Test result of EDAX on pollutant of epoxy resin insulator surface.
No. Elements First Test
(%)
Second
Test (%)
Everage
(%)
1 Si 34.10 34.95 34.53
2 Cl 24.49 28.18 26.34
3 Fe 12.21 11.36 11.79
4 Ca 9.15 10.70 9.93
5 Na 7.85 6.79 7.32
6 Al 6.32 4.65 5.49
7 Mg 3.69 1.59 2.64
8 K 2.02 1.79 1.91
4 Conclusion
Based on the research data and analysis of the eight month coastal polluted
porcelain and epoxy resin insulator leakage current measurements, it can be
concluded that the polluted porcelain insulator was very susceptible to high relative humidity. This phenomenon was indicated by significant rise of the
leakage current amplitudes and by a rapid reduction of the phase difference
between leakage current and applied voltage waves in high relative humidity. These are also represented by components of the correlation matrix, 0.60 and -
0.68 respectively.
Otherwise, on the polluted epoxy resin insulator, the relative humidity did not
influence to the leakage current amplitude and phase difference between leakage current and applied voltage waves significantly. The components of

Polluted Porcelain and Epoxy Resin Outdoor Insulators 143
correlation matrix are only 0.25 and -0.08 respectively. Thus, it is concluded
that the polluted epoxy resin insulator more immune to contamination rather
than the porcelain insulator.
Based on the test results of SEM, the epoxy resin insulator specimen surface was rougher than the porcelain one. This was occurred due to the epoxy resin
surface had been coated by silicone, otherwise the porcelain surface had been
coated by glaze, due to the glaze more endurable than silicone. Whereas the most chemical element of pollutant was Chlorine, due to influence of coast or
marine, and followed by Silicon due to influence of surrounding soil and/or
insulators theirselves.
Acknowledgment
Authors herewith respectfully offer thanks to scholarship of Postgraduate
Education of Indonesia Government and PLN Research and Development, for supporting this research.
References
[1] Fernando, M.M.A.R., Performance for Non-ceramic Insulators in Tropical Environments, PhD Dissertation, Department of Electric Power
Engineering, Chalmers University of Technology, Goteborg-Sweden,
pp.1-2, 1999. [2] Vosloo, W.L., A Comparison of the Performance of High-Voltage
Insulator Materials in a Severely Polluted Coastal Environment, PhD
Dissertation, Department of Electrical and Electronic Engineering,
University of Stellenbosch, South Africa, March, pp.9-10, 2002. [3] Gorur, R.S., Cherney, E.A., Burnham, J.T., Outdoor Insulators Ravi S.
Gorur, Inc., Phoenix, Arizona, USA, pp.37, 145, 1999.
[4] Vosloo, W.L., Macey, R.E., Toureil, C. de, The Practical Guide to Outdoor High Voltage Insulators, Crown Publications CC.,
Johannesburg, South Africa, pp.36-37, 67, 2004.
[5] Suwarno, Leakage Current Waveforms of Outdoor Polymeric Insulators and Possibility of Application for Diagnostics of Insulator Conditions,
Journal of Electrical Engineering & Technology, The Korean Institute of
Electrical Engineering, 1(1), pp.114-119, 2006.
[6] OriginLab Co., Origin V75 User's Manual, OriginLab Corporation, MA, USA, pp.601-611, 2003.
[7] Anderson, T.W., An Introduction to Multivariate Statistical Analysis,
Second Edition, John Wiley & Sons, pp.18,489, 1984. [8] Whittaker, J., Graphical Models in Applied Multivariate Statistics, John
Wiley & Sons, pp.17,48-51, 1996.
144 Waluyo, et al.
[9] Liu, H., Cash, G., Birthwhistle, D., George, G., Characterization of a
Severely Degraded Silicone Elastomer HV Insulator –an Aid to
Development of Lifetime Assessment Techniques, IEEE Transactions on
Dielectrics and Electrical Insulation, Vol.12, No.3, pp.481, 485, June 2005.