Embed Size (px)
Citation preview
1
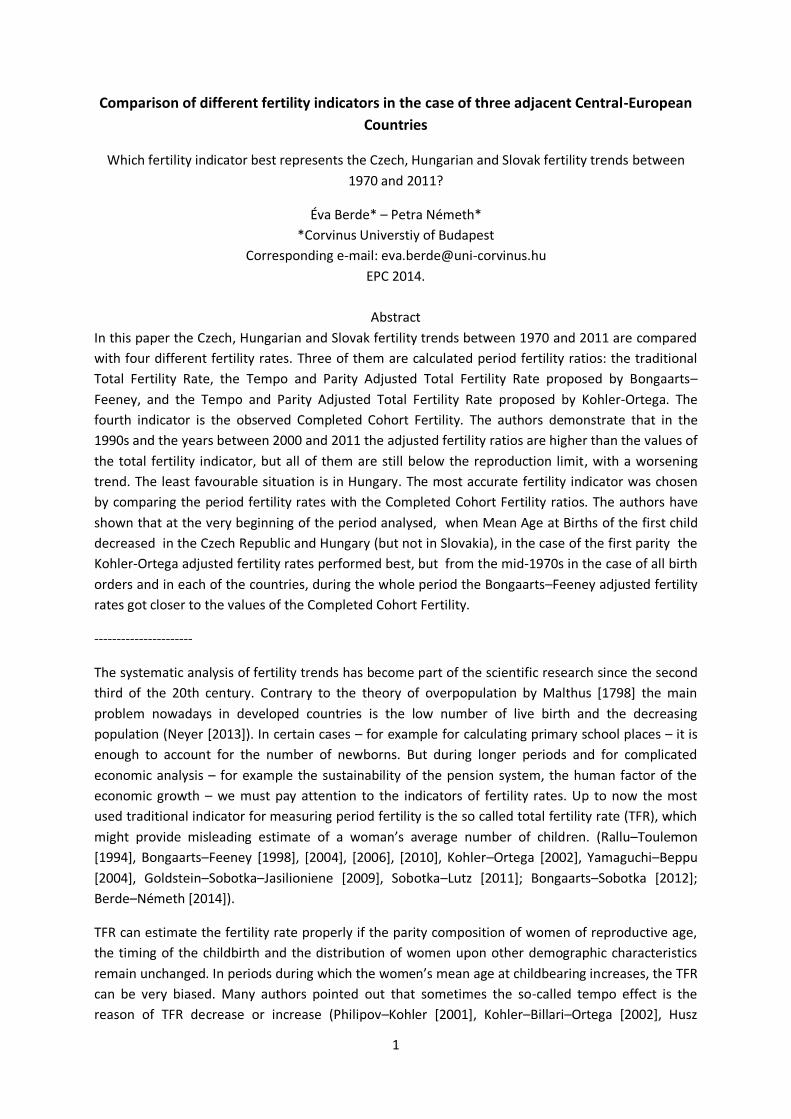
Comparison of different fertility indicators in the case of three adjacent Central-European
Countries
Which fertility indicator best represents the Czech, Hungarian and Slovak fertility trends between
1970 and 2011?
Éva Berde* – Petra Németh*
*Corvinus Universtiy of Budapest
Corresponding e-mail: [email protected]
EPC 2014.
Abstract
In this paper the Czech, Hungarian and Slovak fertility trends between 1970 and 2011 are compared
with four different fertility rates. Three of them are calculated period fertility ratios: the traditional
Total Fertility Rate, the Tempo and Parity Adjusted Total Fertility Rate proposed by Bongaarts–
Feeney, and the Tempo and Parity Adjusted Total Fertility Rate proposed by Kohler-Ortega. The
fourth indicator is the observed Completed Cohort Fertility. The authors demonstrate that in the
1990s and the years between 2000 and 2011 the adjusted fertility ratios are higher than the values of
the total fertility indicator, but all of them are still below the reproduction limit, with a worsening
trend. The least favourable situation is in Hungary. The most accurate fertility indicator was chosen
by comparing the period fertility rates with the Completed Cohort Fertility ratios. The authors have
shown that at the very beginning of the period analysed, when Mean Age at Births of the first child
decreased in the Czech Republic and Hungary (but not in Slovakia), in the case of the first parity the
Kohler-Ortega adjusted fertility rates performed best, but from the mid-1970s in the case of all birth
orders and in each of the countries, during the whole period the Bongaarts–Feeney adjusted fertility
rates got closer to the values of the Completed Cohort Fertility.
----------------------
The systematic analysis of fertility trends has become part of the scientific research since the second
third of the 20th century. Contrary to the theory of overpopulation by Malthus [1798] the main
problem nowadays in developed countries is the low number of live birth and the decreasing
population (Neyer [2013]). In certain cases – for example for calculating primary school places – it is
enough to account for the number of newborns. But during longer periods and for complicated
economic analysis – for example the sustainability of the pension system, the human factor of the
economic growth – we must pay attention to the indicators of fertility rates. Up to now the most
used traditional indicator for measuring period fertility is the so called total fertility rate (TFR), which
might provide misleading estimate of a woman’s average number of children. (Rallu–Toulemon
[1994], Bongaarts–Feeney [1998], [2004], [2006], [2010], Kohler–Ortega [2002], Yamaguchi–Beppu
[2004], Goldstein–Sobotka–Jasilioniene [2009], Sobotka–Lutz [2011]; Bongaarts–Sobotka [2012];
Berde–Németh [2014]).
TFR can estimate the fertility rate properly if the parity composition of women of reproductive age,
the timing of the childbirth and the distribution of women upon other demographic characteristics
remain unchanged. In periods during which the women’s mean age at childbearing increases, the TFR
can be very biased. Many authors pointed out that sometimes the so-called tempo effect is the
reason of TFR decrease or increase (Philipov–Kohler [2001], Kohler–Billari–Ortega [2002], Husz

2
[2006], Goldstein–Sobotka–Jasilioniene [2009], Frejka et al. [2011], Sobotka–Lutz [2011], Bongaarts–
Sobotka [2012], Faragó [2012], Berde-Németh [2014]). In Hungary since the eighties the TFR
dropped back partly because of the presence of the tempo effect. However younger women did not
totally give up childbirth (Spéder [2006], Spéder–Kamarás [2008], Pongrácz T.-né [2011], Szalma
[2011], Kapitány–Spéder [2012], Kamarás [2012]), at older ages they try to realize at least some of
their childbearing intentions. When these children are born some increase of the TFR can be
experienced (tempo effect).
First Norman Ryder (Ryder [1956] [1964], [1980]) drew attention to the tempo effect in the middle of
the last century. Since then some new fertility indicators were constructed, which calculate the
average number of live-born children per women with adjustment of the tempo effect (Bongaarts–
Feeney [1998], [2004], [2006], Kohler–Ortega [2002], Yamaguchi–Beppu [2004]). The estimation of
the fertility indicators – which uses cross-section data to calculate the fertility behaviour of females
during their whole reproductive age have other distortions besides the tempo effect. These
distortions depend on the changes of the data structure and its variation over time. The newest
fertility indicators have not only corrected the tempo effect but also pay attention to the parity
composition of the female population (Kohler–Ortega [2002], Bongaarts–Feeney [2004], [2006],
Yamaguchi–Beppu [2004]).
The different fertility indicators give different pictures about a country’s fertility trend. It can happen
that the difference between the values of the indicators may be as large as 40 percent or more (see
Berde–Németh [2014] Figure 6). It is hard to decide which type of fertility indicator may be the best
in the above mentioned cases. By comparing Completed Cohort Fertility with the calculated period
fertility rates we may obtain an estimate of how well each indicator performs.
Apart from studying methodological questions about different fertility rates our paper’s main focus is
the Hungarian fertility trend. We accomplish the trend analysis by comparing fertility series of
Hungary to those in the Czech Republic and Slovakia, because the history and economy of these
three Central-European countries are very similar. We reveal that fertility indicators based on
different methodologies and the Completed Cohort Fertility rate vary very analogously in the three
countries. The time series of fertility rates indicate that fertility has dropped in each of the three
countries in the last two decades. Additionally, the most critical fertility situation is in Hungary.
However even the worst fertility values of Hungary are not as bad as would be suggested by the
traditional TFR. Tempo and parity adjusting of the TFR help us to get closer to real tendencies.
Our paper consists of three parts. First we compare the Czech, Hungarian and Slovak fertility trends
using Total Fertility Rates, the Tempo and Parity Adjusted Total Fertility Rates proposed by Bongaarts
and Feeney [2004, 2006] and the Tempo, Parity and Age Adjusted Total Fertility Rates introduced by
Kohler and Ortega [2002]. We also show that the three main fertility indicators represent more or
less similar differences in each country, except for the very beginning of the analysed period. Second
we analyse the relationship between the Completed Cohort Fertilities and the two corrected fertility
rates. Finally we draw our conclusions and point out areas requiring further research.

3
Hungarian fertility trends in comparison with Czech and Slovak data1
The Czech Republic, Hungary and Slovakia have many similarities with regard to their history and
development (Matysiak [2011]). The same is true of their fertility trends ( Sobotka [2003], Goldstein–
Sobotka–Jasilioniene [2009], Berde-Németh [2014]) too, which here are represented for the periods
between 1970 and 2011 by their different period fertility rates in Figure 1, and in addition Appendix 1
contains the figures for corrected fertility ratios. The period fertility indicators we use for the
analysis are the traditional Total Fertility Rate (TFR) (Kuczynski [1932]), the Tempo and Parity
Adjusted Fertility Rate proposed by Bongaarts – Feeney (TFRp*) (Bongaarts–Feeney [2004], [2006])
and the Tempo and Parity Adjusted Fertility Rate proposed by Kohler and Ortega (Kohler and Ortega
[2002]).
Figure 1. The Total Fertility Rates (TFR), the Kohler – Ortega Tempo and Parity Adjusted Total Fertility
Rates (PATFR*), and the Bongaarts – Feeney Tempo and Parity Adjusted Total Fertility Rates (TFRp*)
in the Czech Republic (A), Hungary (B) and Slovakia (B) (upper graphs), and the mean average at
birth and its change (lower graphs)
1 The sources of all data used here and in the next chapter are: raw data came from the Human Fertitlity Database [2014], except for Czech data in 2011, Czech Statistical Office [2013], Hungarian data in 2010-2011, Hungarian Statistical Office[2010], [2011], [2012], and Slovak data in 2010, 2011, Statistical Office of the Slovak Republic [2010], [2011], [2012]. The calculation of the different adjusted fertility rates ( based on the methodology described Jasilione et. al. [2012]) is our own work.
-0.2
-0.1
0
0.1
0.2
0.3
0.4
24
25
26
27
28
29
30
19
70
19
71
19
72
19
73
19
74
19
75
19
76
19
77
19
78
19
79
19
80
19
81
19
82
19
83
19
84
19
85
19
86
19
87
19
88
19
89
19
90
19
91
19
92
19
93
19
94
19
95
19
96
19
97
19
98
19
99
20
00
20
01
20
02
20
03
20
04
20
05
20
06
20
07
20
08
20
09
20
10
20
11
Ye
ar
Ye
ar
mean age at birth (left axis)
change in the mean age at birth (rigthaxis)
1
1.2
1.4
1.6
1.8
2
2.2
2.4
2.6
19
70
19
71
19
72
19
73
19
74
19
75
19
76
19
77
19
78
19
79
19
80
19
81
19
82
19
83
19
84
19
85
19
86
19
87
19
88
19
89
19
90
19
91
19
92
19
93
19
94
19
95
19
96
19
97
19
98
19
99
20
00
20
01
20
02
20
03
20
04
20
05
20
06
20
07
20
08
20
09
20
10
20
11
TFR
Czech Republic (A) TFR
PATFR*
TFRp*

4
1.2
1.4
1.6
1.8
2
2.2
2.4
19
70
19
71
19
72
19
73
19
74
19
75
19
76
19
77
19
78
19
79
19
80
19
81
19
82
19
83
19
84
19
85
19
86
19
87
19
88
19
89
19
90
19
91
19
92
19
93
19
94
19
95
19
96
19
97
19
98
19
99
20
00
20
01
20
02
20
03
20
04
20
05
20
06
20
07
20
08
20
09
20
10
20
11
TFR
Hungary (B) TFR
PATFR*
TFRp*
-0.2
-0.1
0.0
0.1
0.2
0.3
24
25
26
27
28
29
30
19
70
19
71
19
72
19
73
19
74
19
75
19
76
19
77
19
78
19
79
19
80
19
81
19
82
19
83
19
84
19
85
19
86
19
87
19
88
19
89
19
90
19
91
19
92
19
93
19
94
19
95
19
96
19
97
19
98
19
99
20
00
20
01
20
02
20
03
20
04
20
05
20
06
20
07
20
08
20
09
20
10
20
11
Ye
arYe
ar
mean age at birth (left axis)
change in the mean age at birth (rigth axis)

5
As we see in the upper parts of Figure 1 in the first half of the period between 1970 and 2011, with
only a few exceptions, TFR reaches the highest values in each of the three countries. In tendency the
TFR is definitely the highest graph between 1970 and 1980, later in 1981 the Hungarian, in 1983 the
Czech and in 1986 the Slovak TFR line goes below the graphs of adjusted period fertility rates. Except
for one year of one country of the three (the Slovak data in 1990 and even in this case only with a
very slight difference) the TFR remains the lowest line. The graphs of PATFR* and TFRp* approach
each other over the whole period and in each country.
If we look at the lower part of each graph, we can see that the mothers’ mean age at birth (MAB)
begins to increase in each country in that our nearby years, when the TFR line falls below the graphs
of TFRp* and PATFR* in each country. This coincidence makes a conjecture that the decline of TFR in
neither country was exclusively caused by the quantum decrease in the number of new-borns, but
postponing having children also belongs to the factors behind the low numbers of TFR. Since Ryder
[1956] first dealt with the postponement of having children this topic has become one of the most
often analysed facts in the literature (Bongaarts–Feeney [1998], Kohler–Philipov [2001], Kohler–
Billari–Ortega [2002], Ortega–Kohler [2002], Sobotka [2004a], Husz [2006], Goldstein–Sobotka–
Jasilioniene [2009], Frejka et al. [2011], Sobotka–Lutz [2011], Bongaarts–Sobotka [2012], MYRSKYLÄ –
GOLDSTEIN. – YENHSIN [2013], Berde–Németh [2014]). The crucial role of the mean average age at birth
regarding Hungary is shown in Berde-Németh [2014], where the estimated linear regression between
the increase of MAB and the ratio of TFR for the first parity in Hungary obtained a very high multiple
correlation coefficient, the square of the multiple correlation coefficients was 0,745. A similar strong
linear regression is shown for the Czech Republic between 1970 and 2008 in Bongaarts - Sobotka
[2012].
If we analyse the connection between the figures for TFRp* and PATFR*, we can see that PATFR*
mostly remains higher than TFRp* until the year when TFR is – with a few exceptions, as we
mentioned previously - the greatest among the three period fertility indicators. The explanation of
this fact can probably be found in the way the PATFR* is constructed. If the PATFR* has a low (high)
value for a certain parity, it stays low (high) for the next parity too, because in the fertility table only
those women could bear a second child, who have already born the first, and those who have born
the second, can have the third and so on. The values of different parities for TFRp* however are
much more independent from each other, because TFRp* relates the number of the second children
to all women without two children – i.e. with no child, or with one child - in the age group, and so on.
Due to this method biases in the same direction are not cumulated.
All the explanations about the different fertility indicators are only important if they help us to get
closer to the answer to the next question: how many babies are expected on average from one
woman during her whole life? In Graph 1, regarding Czech, Hungarian and Slovak women living in
recent years, the answer to this question is: fewer and fewer babies. The relative decrease in the
Czech Republic may be slightly smaller than in the two other countries, and it also looks like at the
end of the period analysed the least favourable situation is in Hungary. Altogether from 1995, in
each of the three countries all the values of the two tempo and parity adjusted indicators are below
2.1, which is regarded as the reproduction (or replacement) limit (Chesnais [2000], Sobotka [2004b])
in modern market economies.

6
The decrease in the figure for the fertility ratio could be caused by the consequences of the delayed
economic crisis (Bongaarts–Sobotka [2012], VID [2012], Goldstein et al. [2013], Berde–Németh [2014]),
but if we analyse the mean average years at birth (MAB) data on the lower parts of Graph 1, it is
evident that the tendency in the change of the MAB must be among the causes. At the end of the
period the increase in the MAB slowed down, probably because women got very close to the end of
their fertility period. Basically there was almost nowhere to delay any more their decision to have a
baby, if they wished to give life to more than one child. Further research is needed to provide a clear
explanation of the situation, but one fact is evident even now: the hopes regarding the change in
fertility trends in the three countries are completely mistaken. The slight increase in TFR values in the
previous decade due only to the retardation of the postponement effect, which has very little further
opportunities, and politicians should continue to be preoccupied by the decrease in the size of their
populations.
The adjusted period fertility indicators definitely show much more perfectly the real fertility quantum
than the traditional TFR. But how much more perfectly? And which one of the two tempo and parity
adjusted total fertility rates performs better? A posteriori we can find out - at least in the case of
countries like those we analyse here and where statistical recording of the population has been well-
developed for a long time – the value of the completed cohort fertility rate (CFR) (See Human
Fertility Database [2014]). However, the question is still not so easy to answer because we must
decide what we should compare with what, and the method of evaluating the results also raises
some problems. In the next section we suggest a way to answer these questions, and at the same
time we compare the CFR ratios of the countries analysed with the values of tempo and parity
adjusted period fertility indicators.
Differences between the various fertility rates
After women of a cohort have finished their fertility period, and if the country has accurate fertility
records2, we can calculate the ‘real’ fertility ratio of the cohort. However this so-called Completed
Cohort Fertility (CFR), which shows how many children an average woman gave birth to, does not
help policy-makers to introduce the best measures for increasing (or decreasing) the number of
children born, because it is too late to intervene. CFR is good for describing what happened in the
past, but cannot tell us what must be done now, and also has very little use when we try to model
future developments using different scenarios. It can, however, help in describing and evaluating the
actual situation indirectly. If we compare CFR with the period fertility indicators, which are calculated
upon the cross-sectional data of a given year, we can deduce which period fertility must be used to
get closest to the real fertility rate.
In times when the inner structure of the female population – regarding different features of
childbearing, such as parity and the age of the mother, also mortality, migration and so on – is not
changing significantly, both the TFR and the two parity and tempo adjusted period fertility ratios
predict accurately the average total number of children of a mother. But when something in the
structural composition changes the correct fertility ratio must be controlled for this change as
2 The Human Fertility Database [2014] contains suitable Czech and Slovak data from 1935, and the Hungarian
figures are from 1937.
7
TFRp* and PATFR* do. Both of these indicators take into consideration the parity composition of
mothers (the order of birth of the child) in the year observed and also make correction for the
change in the mean age at birth, i.e. for the tempo effect. The construction of the two adjusted
indicators differs (Bongaarts–Feeney [1998] Equation (3) page 278; Kohler és Philipov [2001]
Equation (11) page 8), so their values are not equal as we saw in figure 1. Until about the second
third of the 1980s, TFRp* and PATFR* are quite close to each other, and in this relatively quiet time
large changes are not observed in the mean age at births (MAB), as we see in the lower graphs of
Figure 1. However, in the last third of the 1980s in each of the three countries a steep fall began in
TFR3, and also a rise in MAB, and the differences between the values of TFRp* and PATFR* became
larger and larger. The difference began to contract from the second half of the 2000s.
To find out which of the two adjusted fertility indicators performs better, we compared CFR with
TFRp* and PATFR* first in two time periods, leaving out the beginning years of our researched time,
then we did a separate calculation for the left first few years. For the comparison we applied a
method similar to that used by Bongaarts–Sobotka [2012], and we also used some methodology
written in Caselli–Vallin–Wunsch [2006], and Myrskyla–Goldstein–Yenhsin [2013]. It is not
immediately obvious which year of period fertility must be compared with which CFR value. For
example, women born in 1955 according to the presently used statistics could already have given
birth when they were aged 15 (earlier births are included for this age), and their fertility period
ended in 2005, when they became 50 years old (later births are included in the 50-year-old age
group). Regarding the total fertility rate we should have used the mean age at birth of this cohort,
and compared CFR with the period fertility rates of this year. Considering each order of births, parity
fertility ratios must be added up, which could level off, and in such a way conceal some mistakes and
the conclusion could be false. It seems to be more appropriate to compare the CFR by parities with
the adjusted period fertility indicators. For example, if the cohort born in 1955 in a country give birth
on average to their first child at the age of 25 (or at the age of 24.7 or 25.3), i. e. in 1980, then the
first parity value of the period indicators calculated for the year 1980 must be compared with the
first parity component of CFR.
We did this comparison only for the first, second and third birth orders, the other birth orders
represented only a very negligible part of the fertility rates in each of the three countries we
analysed (Goldstein–Sobotka–Jasilioniene [2009], Kapitány–Spéder [2012]). It is possible to carry out
the comparison until the year for which, the latest CFR exists for the first birth order. For example if
we want to calculate the fertility rate in 2003, and if we assume the cohort which obtained their
MAB for the first birth in 2003 was born in 1973, then we still must wait until 2023, when this cohort
finishes their fertility period, to really learn the MAB and the number for the CFR.
If we wish to take into consideration only the second and third parity CFR, and we estimate that the
cohort which obtained their MAB for the second birth in 2003 was born in 1970, we must wait until
2020 to find out the real data. This means 3 years less, than in the original plan. Because in the
period when MAB increases due the way the TFRp* and PATFR* are constructed, these two period
fertility rates differ very slightly with regard to the first parity, the differences of first parity values of
3 This late (in comparison with western European countries) and accelerated decrease in TFR happened in many other former communist countries, such as Estonia, Latvia, Lithuania, Poland, Russia, Slovenia and, Ukraine. (Eurostat [2014], Goldstein–Sobotka–Jasilioniene [2009]).
8
the two period fertility indicators must be smaller than the differences in the case of the second and
third parities.
We can shorten the waiting time even more, if we are interested in the births that have taken place
by the time the women are aged 40 year. In the previous example in the case of the second birth we
must wait only until 2010, to find out the real data. Unfortunately collecting and elaborating data
takes time, so for example in the Human Fertility Database [2014] the latest year when observed
fertility numbers are given is 2011 for the Czech, 2009 for the Hungarian and for the Slovak data.
However, our aim, to compare CRF with TFRp* and PATFR*, is not really prevented by the delay in
data collection.
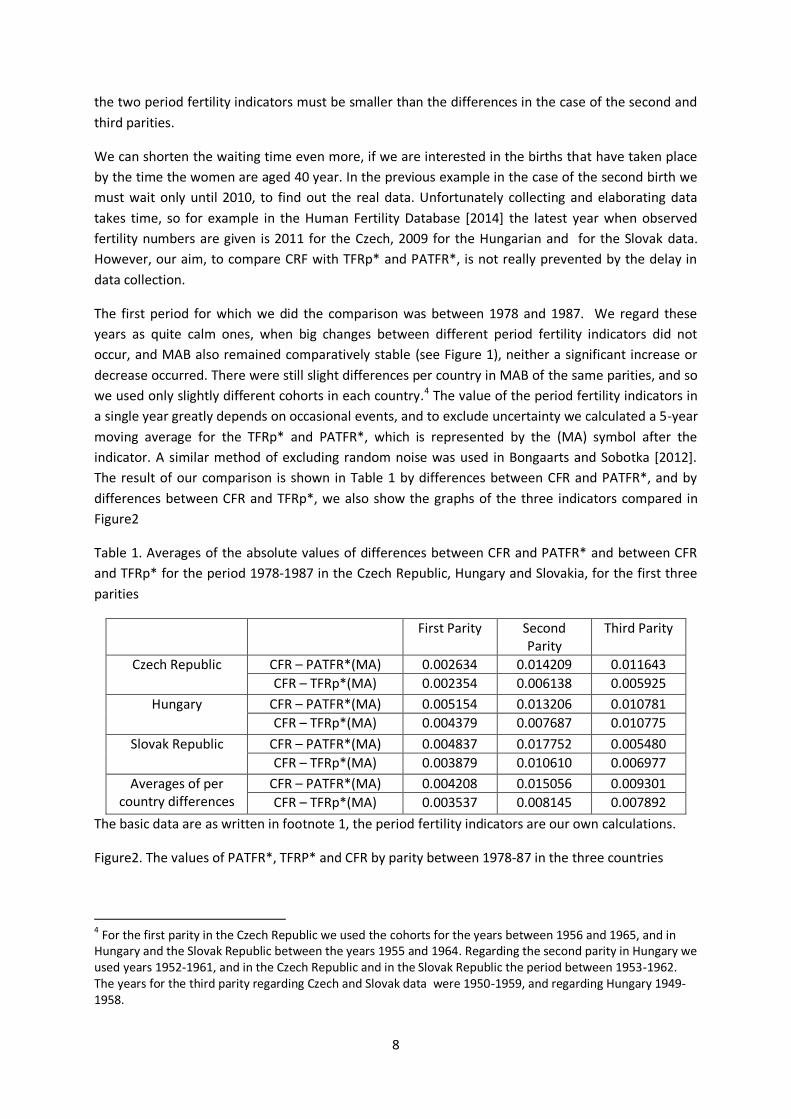
The first period for which we did the comparison was between 1978 and 1987. We regard these
years as quite calm ones, when big changes between different period fertility indicators did not
occur, and MAB also remained comparatively stable (see Figure 1), neither a significant increase or
decrease occurred. There were still slight differences per country in MAB of the same parities, and so
we used only slightly different cohorts in each country.4 The value of the period fertility indicators in
a single year greatly depends on occasional events, and to exclude uncertainty we calculated a 5-year
moving average for the TFRp* and PATFR*, which is represented by the (MA) symbol after the
indicator. A similar method of excluding random noise was used in Bongaarts and Sobotka [2012].
The result of our comparison is shown in Table 1 by differences between CFR and PATFR*, and by
differences between CFR and TFRp*, we also show the graphs of the three indicators compared in
Figure2
Table 1. Averages of the absolute values of differences between CFR and PATFR* and between CFR
and TFRp* for the period 1978-1987 in the Czech Republic, Hungary and Slovakia, for the first three
parities
First Parity Second Parity
Third Parity
Czech Republic
CFR – PATFR*(MA) 0.002634 0.014209 0.011643
CFR – TFRp*(MA) 0.002354 0.006138 0.005925
Hungary
CFR – PATFR*(MA) 0.005154 0.013206 0.010781
CFR – TFRp*(MA) 0.004379 0.007687 0.010775
Slovak Republic
CFR – PATFR*(MA) 0.004837 0.017752 0.005480
CFR – TFRp*(MA) 0.003879 0.010610 0.006977
Averages of per country differences
CFR – PATFR*(MA) 0.004208 0.015056 0.009301
CFR – TFRp*(MA) 0.003537 0.008145 0.007892
The basic data are as written in footnote 1, the period fertility indicators are our own calculations.
Figure2. The values of PATFR*, TFRP* and CFR by parity between 1978-87 in the three countries
4 For the first parity in the Czech Republic we used the cohorts for the years between 1956 and 1965, and in Hungary and the Slovak Republic between the years 1955 and 1964. Regarding the second parity in Hungary we used years 1952-1961, and in the Czech Republic and in the Slovak Republic the period between 1953-1962. The years for the third parity regarding Czech and Slovak data were 1950-1959, and regarding Hungary 1949-1958.

9
0.92
0.93
0.93
0.94
0.94
0.95
0.95
1978 1979 1980 1981 1982 1983 1984 1985 1986 1987
Czech Republic, birth order 1
CCFR1 PATFR*1(MA) TFRp*1(MA)
0.76
0.77
0.78
0.79
0.8
0.81
0.82
0.83
0.84
1978 1979 1980 1981 1982 1983 1984 1985 1986 1987
Czech Republic, birth order 2
CCFR2 PATFR*2(MA) TFRp*2(MA)
0.20
0.22
0.24
0.26
0.28
0.30
0.32
1978 1979 1980 1981 1982 1983 1984 1985 1986 1987
Czech Republic, birth order 3
CCFR3 PATFR*3(MA) TFRp*3(MA)
0.9
0.905
0.91
0.915
0.92
0.925
0.93
0.935
0.94
1978 1979 1980 1981 1982 1983 1984 1985 1986 1987
Hungary, birth order 1
CCFR1 PATFR*1(MA) TFRp*1(MA)
0.7
0.71
0.72
0.73
0.74
0.75
0.76
1978 1979 1980 1981 1982 1983 1984 1985 1986 1987
Hungary, birth order 2
CCFR2 PATFR*2(MA) TFRp*2(MA)
0.17
0.18
0.19
0.2
0.21
0.22
0.23
0.24
0.25
1978 1979 1980 1981 1982 1983 1984 1985 1986 1987
Hungary, birth order 3
CCFR3 PATFR*3(MA) TFRp*3(MA)

10
Source: as written in footnote 1. The period fertility indicators are our own calculations.
Table 1 shows less differences between CFR and TFRp* than between CFR and PATFR* in each
country and regarding each parity. This means that in ‘peaceful’ times, where there are not big
changes in the fertility trends, as in the period 1978-87 in our three countries, the Boongarts –
Feeney tempo and parity adjusted period fertility rate performed better than the Kohler – Ortega
indicator. It is worthy of note that differences in the case of the 2nd and 3rd parities are greater than
the differences of the first parities. Because in TFRp* and PATFR* the values of the parity indicators
are added together, the total period fertility indicators are very sensitive to the components of the
second and third parities. From Table 1 we can see that the Coler-Ortega PATFR is much more
unreliable than the Boongarts – Feeney TFRp*. We think that this great sensitivity is due to the way
the PATFR* is constructed, because fertility tables inherit biases of the lower parity to the higher
parities. Calculating the next parity the TFRp* begins the process again, so previous errors could not
be passed on.
The accuracy of period fertility indicators is much crucial in periods when the fertility trend and the
structure of the female population – for example when postponement becomes longer - are
changing, than in stable periods. Such a period occurred in the history of the three countries from
1993-97. The forces for change increased between 1988 and 1992, but they did not reach the level of
the years 1993-97. The transition continued after 1997 too, however CFR values do not exist for this
late period yet. For the years from 1993-97 there are no CFR ratios for the first parity yet, nor for the
whole fertility period of the women in the case of the second and third parity. We could have used
CFR for the second and third parity taking into consideration the latest available year - as Boongarts –
Sobotka [2012] did - , and substitute the missing years’ data with the proper part of TFR. Instead we
used CFR until the 40th year of women, and calculated PATFR* and TFRp* also until the 40th year of
women. We use the notation after the symbol of the indicator ‘40’, to signal that only data are taken
into consideration that include 40-year-old and younger women. In some cases, it was impossible to
0.88
0.89
0.9
0.91
0.92
1978 1979 1980 1981 1982 1983 1984 1985 1986 1987
Slovakia, birth order 1
CCFR1 PATFR*1(MA) TFRp*1(MA)
0.75
0.76
0.77
0.78
0.79
0.8
0.81
0.82
1978 1979 1980 1981 1982 1983 1984 1985 1986 1987
Slovakia, birth order 2
CCFR2 PATFR*2(MA) TFRp*2(MA)
0.3
0.32
0.34
0.36
0.38
0.4
0.42
1978 1979 1980 1981 1982 1983 1984 1985 1986 1987
Slovakia, birth order 3
CCFR3 PATFR*3(MA) TFRp*3(MA)

11
find a cohort the MAB of which belonged to the year needed between 1993-1997. This also
happened in the case of the second and the third parity and was caused by the rapid structural
changes of the period. In these times we took the average CFR40 of the two adjacent cohorts, the
MAB of which was just before and after the relevant year.
The result of our comparison is shown in Table 2 by the differences between CFR40 and PATFR*40,
and by differences between CFR40 and TFRp*40. The trends of the three indicators are represented
in Figure3.
Table 2. Averages of absolute values of differences between CFR40 and PATFR*40 and between
CFR40 and TFRp*40 in the period 1993-1997 in the Czech Republic, Hungary and Slovakia, by the
second and third parities
Second
Parity Third Parity
Czech Republic CFR40 – PATFR*40(MA) 0.038392 0.051421
CFR40 – TFRp*40(MA) 0.037999 0.014328
Hungary CFR40 – PATFR*40(MA) 0.038559 0.060083
CFR40 – TFRp*40(MA) 0.017378 0.006381
Slovak Republic CFR40 – PATFR*40(MA) 0.031766 0.063525
CFR40 – TFRp*40(MA) 0.003918 0.016633
Averages of per country
differences
CFR40 – PATFR*40(MA) 0.036239 0.058343
CFR40 – TFRp*40(MA) 0.019765 0.012447
The basic data are as written in footnote 1, the period fertility indicators are our own calculations.
Figure 3. Graphs of CFR40, PATFR*40, and TFRp*40 by parity in the years 1993-97 in the three
countries.
0.6
0.62
0.64
0.66
0.68
0.7
0.72
0.74
0.76
0.78
1993 1994 1995 1996 1997
Czech Republic, birth order 2
CCFR40_2 PATFR*40_2(MA) TFRp*40_2(MA)
0.05
0.07
0.09
0.11
0.13
0.15
0.17
0.19
0.21
0.23
1993 1994 1995 1996 1997
Czech Republic, birth order 3
CCFR40_3 PATFR*40_3(MA) TFRp*40_3(MA)

12
Source: as written in footnote 1.
It can be seen from Table 2 and Figure 3, that TFRP*40 in each country is closer to CFR40, than
PATFR*(40) in the case of both the second and third parity. The average of the differences of CFR40-
TFRp*40 is about 55 % of the differences of CFR40-PATFR*40 regarding the second parity, and it is
about only 20 % in the case of the third parity. It is evident that altogether TFRp* performs better
than PATFR* in the Table 2 too, not only in Table 1. However, differences in Table 2 are greater than
in Table 1, which is due to the fact that during the time when the structure of the female population
changes even TFRp* cannot calculate the exact fertility rate. Further research is needed to discover
what corrections should be made to improve the accuracy of the fertility indicators.
To demonstrate that TFRp* doesn`t provide the best estimate in every situation we are going to look
at the period between 1970 and 1977. We calculated the CFR for this period employing the same
method we had used previously, and received a contradictory result. The results can be seen in
Figure 4.
0.5
0.55
0.6
0.65
0.7
0.75
1993 1994 1995 1996 1997
Hungary, birth order 2
CCFR40_2 PATFR*40_2(MA) TFRp*40_2(MA)
0.1
0.12
0.14
0.16
0.18
0.2
0.22
0.24
0.26
1993 1994 1995 1996 1997
Hungary, birth order 3
CCFR40_3 PATFR*40_3(MA) TFRp*40_3(MA)
0.56
0.58
0.6
0.62
0.64
0.66
0.68
0.7
0.72
1993 1994 1995 1996 1997
Slovakia, birth order 2
CCFR40_2 PATFR*40_2(MA) TFRp*40_2(MA)
0.1
0.12
0.14
0.16
0.18
0.2
0.22
0.24
0.26
0.28
1993 1994 1995 1996 1997
Slovakia, birth order 3
CCFR40_3 PATFR*40_3(MA) TFRp*40_3(MA)

13
Figure 4. CFR, PATFR* and TFRp* for the first parity in the Czech Republic, Hungary and Slovakia in
the period between 1970 and 1977.
Source: as written in footnote 1.
In the period between 1970 and 1977 both in the Czech Republic and Hungary PATFR* performed
better for the first parity than TFRp*, but in Slovakia TFRp* is still the best. If we look at the MAB for
the birth order 1 using figure 5, then we can find the explanation.
Figure 5. The MAB values for the first parity in the three countries between 1969 and 1978
Source: as written in footnote 1.
Between 1970 and 1977 in Hungary the mean age for the birth order 1 fell continuously, in the Czech
Republic it both rose and fell, while in Slovakia it increased and then remained almost constant. The
MAB changes have a crucial role in the correction factor for both of the corrected period fertility
0.92
0.93
0.93
0.94
0.94
0.95
0.95
1970 1971 1972 1973 1974 1975 1976 1977
Czech Rebublic, birth order 1
CCFR1 PATFR*1(MA) TFRp*1(MA)
0.87
0.88
0.89
0.90
0.91
0.92
0.93
0.94
1970 1971 1972 1973 1974 1975 1976 1977
Hungary, birth order 1
CCFR1 PATFR*1(MA) TFRp*1(MA)
0.88
0.89
0.89
0.90
0.90
0.91
0.91
0.92
0.92
1970 1971 1972 1973 1974 1975 1976 1977
Slovakia, birth order 1
CCFR1 PATFR*1(MA) TFRp*1(MA)
22.2
22.3
22.4
22.5
22.6
22.7
22.8
22.9
1969 1970 1971 1972 1973 1974 1975 1976 1977 1978
Cz Hun Sk

14
rates. As a general rule, if the MAB increases, then the correction raises the original fertility number,
and a falling MAB also lowers the fertility ratio. However the correction in the case of PATFR*
depends on the age of mothers, and also on the standard deviation of the childbearing age, but in
the case of TFRp* the correction factor is the same for all ages. When MAB rises the correction factor
helps to reveal the real fertility rate of the younger generations, and does not have a strong effect on
the older generation, where fertility numbers are low. However when MAB falls the value of the
TFRp* for the younger generation is distorted due to the correction, which is either negligible, or
could even raise the value of the indicator in the case of PATFR*. We think that during the time
when MAB increases, TFRp* always performs better, but in times of decreasing mean average ages
the PATFR* is the best, at least regarding the first parity. Table 3 below shows however, that these
conclusions could be disputed in the cases of higher birth orders. In spite of the fact that MAB values
for the second and third births show very similar tendencies as the MAB in the same country for the
first birth, TFRp* performs better in each of the three countries for the second and third parities.
Table 3. Averages of the absolute values of differences between CFR and PATFR* and between CFR
and TFRp* for the period 1970-1977 in the Czech Republic, Hungary and Slovakia, for the first three
parities
First Parity Second
Parity Third Parity
Czech Republic CFR – PATFR*(MA) 0.003918 0.020410 0.054809
CFR – TFRp*(MA) 0.004147 0.012946 0.022726
Hungary CFR – PATFR*(MA) 0.012500 0.029060 0.049782
CFR – TFRp*(MA) 0.014559 0.018155 0.017444
Slovak Republic CFR – PATFR*(MA) 0.008869 0.018897 0.024957
CFR – TFRp*(MA) 0.006231 0.007261 0.01509
Averages of per
country differences
CFR – PATFR*(MA) 0.008429 0.022789 0.043183
CFR – TFRp*(MA) 0.008312 0.012787 0.018420
The basic data are as written in footnote 1, the period fertility indicators are our own calculations.
As our results show, there is no straightforward rule to tell us which of the two period indicators
performs better in all circumstances. In Table 4 below, we summarize the strengths, weaknesses,
opportunities and the threats of the two tempo and parity adjusted period fertility indicators,
borrowing this generally used tool from economics.

15
Table 4. The SWOT analysis of the two tempo and parity adjusted fertility indicators
TFRp*
Strengths Weaknesses Opportunities Threats
During birth
postponement periods
it produces the real
quantum of births.
It could give false
values when MAB
decreases.
Introducing into the
correction factor the
age of the mother
could improve the
performance of this
indicator.
A correct quantum
number cannot be
expected if
postponement of birth
behaviour is reversed.
PATFR*
In addition to MAB
correction it depends
on the age of the
mother and the
standard deviation of
childbearing age too.
The mistake in
calculation of a rate
regarding a certain
parity is passed on to
the next parities
Could be used instead
of TFRp* when MAB
continuously
decreases.
The fertility table
brings too much
rigidity into
calculations.
In spite of the fact that Table 3 shows that using these two indicators involves a number of
drawbacks, we still recommend calculating them instead of TFR when large changes in the structure
of the female population have occurred. During child postponement we suggest using TFRp*, and in
the very rare cases when MAB continuously decreases, we recommend further investigation before
choosing the method of calculating period fertility rates.
Conclusions
In our paper we have analysed the fertility trends in three adjacent Central-European countries, in
the Czech Republic, Hungary and Slovakia between 1970 and 2011. These three countries have a very
similar history, and it is not surprising that many similarities have been found regarding the number
of children women have and their age at childbirth. The general tendency in each country was the
continuous decrease of fertility ratios, with a few, short, exceptional periods, and an even steeper
decrease at the very end of the time interval examined.
Looking at only the traditional Total Fertility Rate (TFR) some policy-makers mistakenly recognized a
reverse or recovery in the fertility trend of the three countries in the 2000s. However, taking into
consideration the adjusted fertility ratios, we found that the quantum factor of birth further
decreased. Contrary to some Western European countries, there is no sign of climbing out of the
fertility hole. Still the picture is not as tragic as might be thought using only TFR ratios. The
postponement of birth from the beginning of the third third of the 1980s has accelerated and
resulted in the ‘lowest low’ (Kohler – Billari – Ortega [2002], Sobotka [2004b]) TFR, but the
Bongaarts – Feeney Tempo and Parity Adjusted Fertility Rates (TFRp*) and the Kohler - Ortega
Tempo and Parity Adjusted Fertility Rates (PATFR*) show that if we consider the whole fertility
period of women they still intend to give birth to more children than the TFR forecasts. However, the

16
steep fall at the end of the period analysed really gives cause for concern, even if changes in 2-3
years cannot be regarded as significant statistically.
In addition to comparing and evaluating the Czech, Hungarian and Slovak fertility behaviour in the
recent past we also aimed to judge the performance of the different adjusted fertility ratios. Both the
TFRp* and PATFR* take into consideration the distribution of the female population upon parity of
their child in the year of observation, and also controls for the expected timing of child births, i.e.
uses tempo correction. When women have finished their fertility period and we can use the
observed, so-called Completed Cohort Fertility (CFR), it helps us to find out which corrected period
fertility indicator performs better. In spite of the fact that CFR could be used only after a cohort has
finished all of its fertility events, it still proves to be an effective tool to evaluate the accuracy of
fertility rates for a past date. We explained in detail how CFR could be compared with TFRp* and
PATFR*.
The tempo correction of PATFR* is more sophisticated and avoids the undervaluation of the fertility
rate in times when Mean Age at Birth decreases. However, this advantage of the PATFR* indicator is
counterbalanced by the frequent errors due to the way that this ratio is constructed. When
calculating PATFR* we use the fertility table for women, where a mistake in the ratio regarding a
certain parity is passed on by all the higher level parities, and altogether it could lead to a false result.
Calculation of TFRp* avoids this problem, the count of the different parity ratios is independent from
each other, and in most of the cases TFRp* performs better than PATFR*. So we suggest that TFRp*
should be used mostly, with the exception of times when MAB permanently decreases, which case
needs further consideration. We also intend to continue our research in this direction, to find a more
sophisticated method of correction in the case of TFRp*, to be able to compound the advantages of
each indicator and to avoid the pitfalls of both methods.

17
Appendix 1
The Kohler – Ortega Tempo and Parity Adjusted Total Fertility Rates (PATFR*), and the Bongaarts –
Feeney Tempo and Parity Adjusted Total Fertility Rates (TFRp*) in Czech Republic, Hungary and
Slovakia between 1970 and 2011
Year
PATFR* TFRp*
Czech Republic
Hungary Slovakia Czech
Republic Hungary Slovakia
1970 2.046 1.839 2.474 2.026 1.860 2.574
1971 2.068 1.813 2.427 2.013 1.844 2.518
1972 2.041 1.846 2.393 2.001 1.867 2.475
1973 2.259 2.038 2.435 2.120 1.893 2.494
1974 2.363 2.454 2.485 2.167 2.069 2.474
1975 2.305 2.232 2.559 2.154 2.066 2.441
1976 2.279 2.085 2.505 2.158 1.996 2.447
1977 2.234 2.041 2.353 2.144 1.961 2.381
1978 2.243 1.922 2.350 2.151 1.890 2.330
1979 2.142 1.935 2.305 2.126 1.892 2.284
1980 2.079 1.952 2.290 2.086 1.914 2.268
1981 2.053 1.960 2.249 2.074 1.952 2.281
1982 1.986 1.933 2.181 2.054 1.929 2.236
1983 2.001 1.898 2.206 2.049 1.910 2.237
1984 2.049 1.911 2.152 2.053 1.919 2.220
1985 2.084 2.085 2.218 2.080 2.040 2.242
1986 2.057 2.096 2.255 2.080 2.069 2.224
1987 2.044 1.983 2.185 2.047 2.004 2.195
1988 2.050 1.954 2.158 2.061 1.983 2.191
1989 1.963 1.911 2.114 2.014 1.988 2.142
1990 1.967 1.978 2.044 2.001 2.034 2.143
1991 1.945 2.037 2.052 1.967 2.037 2.117
1992 1.900 1.924 2.101 1.932 1.988 2.125
1993 2.013 1.903 2.068 2.013 1.996 2.137
1994 1.980 1.910 1.861 2.029 1.986 2.044
1995 1.814 1.838 1.703 2.001 1.972 1.926
1996 1.719 1.670 1.703 1.915 1.891 1.927
1997 1.666 1.632 1.675 1.870 1.844 1.973
1998 1.533 1.664 1.600 1.828 1.855 1.909
1999 1.517 1.585 1.655 1.819 1.837 1.879
2000 1.599 1.656 1.518 1.869 1.880 1.806
2001 1.581 1.663 1.430 1.831 1.868 1.690
2002 1.532 1.645 1.571 1.776 1.800 1.722
2003 1.610 1.630 1.530 1.774 1.804 1.714
2004 1.683 1.664 1.617 1.801 1.808 1.725
2005 1.723 1.591 1.645 1.807 1.740 1.739
2006 1.752 1.607 1.667 1.782 1.747 1.715
2007 1.788 1.494 1.666 1.842 1.661 1.709
2008 1.760 1.498 1.656 1.815 1.658 1.704

18
2009 1.663 1.650 1.822 1.739 1.718 1.702
2010 1.684 1.470 1.989 1.767 1.620 1.734
2011 1.682 1.243 1.461 1.673 1.461 1.626
Source: as written in footnote 1.
References
BERDE É. – NÉMETH P. [2014]: Az alacsony magyarországi termékenység
új megközelítésben. [Low Hungarian Fertility Revisited] Statisztikai Szemle 92. évf. 3. szám pp.
253–275.
BONGAARTS, J. – FEENEY, G. [1998]: On the Quantum and Tempo of Fertility. Population and
Development Review. Vol. 24. No. 2. pp. 271–291.
BONGAARTS, J. – FEENEY, G. [2004]: The Quantum and Tempo of Life-Cycle Events. The Mortality Tempo
Workshop sponsored by the Max Planck Institute for Demographic Research and the Population
Council. 18–19 November. New York.
BONGAARTS, J. – FEENEY, G. [2006]:: The Tempo and Quantum of Life Cycle Events. In: Vienna Yearbook
of Population Research 2006. pp. 115–151.
BONGAARTS, J. – FEENEY, G. [2010]: When is a Tempo Effect a Tempo Distortion? Genus 66(2): 1–15.
BONGAARTS, J. – SOBOTKA, T. [2012]: A Demographic Explanation for the Recent Rise in European
Fertility. Population and Development Review. Vol. 38. No. 1. pp. 83–120.
CASELLI, G. – VALLIN, J. – WUNSCH, G. [2006]: Demography - Analysis and Synthesis: A Treatise in Population. Elsevier, Amsterdam.
CHESNAIS, J.-C. [2000]: Determinants of Below Replacement Fertility. In: Below Replacement Fertility. Population Bulletin of the United Nations, Special Issue 1999, 40/41 pp. 126-136.
CZECH STATISTICAL OFFICE [2013]: Demographic Yearbook of the Czech Republic 2012. Praha. EUROSTAT [2014]: Statistics, Population and Social Condition, Population.
http://epp.eurostat.ec.europa.eu/portal/page/portal/population/data/database. (Downloaded at 10th March 2014)
FARAGÓ M. [2011]: Paritásfüggő összetett termékenységi mutatók Magyarországon és különbségeik dekompozíciója. [Parity dependent fertility indicators in Hungary and decomposition of their
differences] Közgazdasági Szemle, LVIII. évf., 2011. november 970–993. FREJKA, T. – LESTHAEGHE, R. – SOBOTKA, T. – ZEMAN, K. [2011]: Postponement and Recuperation in Cohort
Fertility: New Analytical and Projection Methods and their Application. European Demographic
Research Papers. No. 2. Vienna Vienna Institute of Demography. Vienna
GOLDSTEIN, J. R. – SOBOTKA, T. – JASILIONIENE, A. [2009]: The End of Lowest-Low Fertility? Population and
Development Review. Vol. 35. No. 4. pp. 663–700.
GOLDSTEIN, J. R. – KREYENFELD, M. – JASILIONIENE, A. – ÖRSAL, D. K. [2013]: Fertility Reactions to the ‘Great Recession’ in Europe: Recent Evidence from Order-specific Data. Demographic Research Volume 29 (4) pp. 85-104.
HUMAN FERTILITY DATABASE [2014]: Data for the Czech Republic, Hungary and Slovakia. Max Planck Institute for Demographic Research (Germany) and Vienna Institute of Demography (Austria). Available at www.humanfertility.org (Downloaded at January 2014)
HUSZ I. [2006]: Iskolázottság és gyermekvállalás időzítése. [Educational Level and Timing of Birth]
Demográfia. 49. évf. 1. sz. 46–67.
JASILIONIENE, A. – JDANOV,D. A. – SOBOTKA,T. – ANDREEV, E. M. – ZEMAN,K. – SHKOLNIKOV, V. M. [2012]: Methods Protocol for the Human Fertility Database. http://www.humanfertility.org/Docs/methods.pdf
HUNGARIAN STATISTICAL OFFICE [2010, 2011, 2012]: Demographic Yearbook. KSH. Budapest.

19
HUSZ I. [2006]: Iskolázottság és gyermekvállalás időzítése. [Low Educational Attainment Leads to
Many Children? About Some Regional and Ethnic Aspects of High Fertility] Demográfia. 49. évf. 1.
sz. 46–67.
KAMARÁS F. [2012]: Társadalmi helyzetkép. [Situation of Hungarian Society.] Népesedési helyzet.
Központi Statisztikai Hivatal. Budapest.
KAPITÁNY B. – SPÉDER ZS. [2012]: Gyermekvállalás. [Childbearing] In: Őri P. – Spéder Zs. (szerk.):
Demográfiai Portré 2012. [Demographic Portrait 2012] KSH Népességtudományi Kutatóintézet.
Budapest. 31–43.
KOHLER, H.-P. – ORTEGA, J. A. [2002]: Tempo-Adjusted Period Parity Progression Measures, Fertility
Postponement and Completed Cohort Fertility. Demographic Research. Vol. 6. No. 6. pp. 92–144.
KOHLER, H. P. – BILLARI, F. C. – ORTEGA, J. A. [2002]: The Emergence of Lowest-Low Fertility in Europe
During the 1990s. Population and Development Review. Vol. 28. No. 4. pp. 641–680.
KUCZYNSKI, R. R. [1932]: Fertility and Reproduction. New York: Falcon Press, 1932, 94P. MALTHUS, T. [1798]: An Essay on the Principle of Population. Printed for J. Johnson, in St. Paul’s
Church-Yard, London.
MATYSIAK, A. [2011]: Fertility Developments in Central and Eastern Europe: The Role of Work–Family Tensions. Demográfia, 2011. Vol. 54. No. 5. English Edition, 7–30.
MYRSKYLÄ, M. – GOLDSTEIN, J. R. – YENHSIN A. C. [2013]: New Cohort Fertility Forecasts for the Developed World: Rises,Falls, and Reversals. Population and Development Review 39(1) pp. 31–56.
NEYER, G. [2013]: Welfare States, Family Policies and Fertility in Europe. The Demography of Europe.
Springer Netherlands, pp. 29–53.
ORTEGA, J. A. – KOHLER. H.-P. [2002]: Measuring Low Fertility: Rethinking Demographic Methods.
MPIDR Working Paper 2002-001, Max Planck Institute for Demographic Research, Rostock
PHILIPOV, D. –KOHLER, H.-P. [2001]: Tempo Effects in the Fertility Decline in Eastern Europe: Evidence
from Bulgaria, the Czech Republic, Hungary, Poland and Russia. European Journal of Population
17(1): 37–60.
PONGRÁCZ T.-NÉ [2011]: A demográfiai értékrend változásában szerepet játszó főbb népesedési
folyamatok. [The Relevant Population Processes which are Playing Role in the Change of the
Demographic Values] In: Pongrácz T.-né (szerk.): A családi értékek és a demográfiai magatartás
változásai. [Changes of the Familiy Values and the Demographic Behavior] KSH
Népességtudományi Kutatóintézetének kutatási jelentései 91. KSH Népességtudomány
Kutatóintézet. Budapest. 17–37.
Rallu, J.-l. – Toulemon, l. [1994]: Period Fertility Measures: The Construction of Different Indices and
their Application to France, 1946–89. Population, An English Selection, 6: pp. 59–94.
RYDER, N. B. [1956]: Problems of Trend Determination during a Transition in Fertility. Milbank
Memorial Fund Quarterly. Vol. 34. No. 1. pp. 5–21.
RYDER, N. B. [1964]: The Process of Demographic Translation. Demography. Vol. 1. No. 1. pp. 74–82.
RYDER, N. B. [1980]: Components of Temporal Variations in American Fertility. In: Hiorns, R. W. (eds.):
Demographic Patterns in Developed Societies, Symposia of the Society for the Study of Human
Biology. Taylor and Francis Ltd. London. pp. 15–54.
SOBOTKA, T. [2003]: Re-Emerging Diversity: Rapid Fertility Changes in Central and Eastern Europe After the Collapse of the Communist Regimes. Population, 58e année, n°4-5, 2003 pp. 451-485.
SOBOTKA, T. [2004a]: Postponement of childbearing and low fertility in Europe. PhD Thesis, University of Groningen. Amsterdam, Dutch University Press.
SOBOTKA T. [2004b]: Is Lowest-Low Fertility in Europe Explained by the Postponement of Childbearing? Population and Development Review. Vol. 30, No. 2, Jun., 2004. pp. 195-220.

20
SOBOTKA, T. – LUTZ, W. [2011]: Misleading Policy Messages Derived from the Period TFR: Should We
Stop Using it? Comparative Population Studies–Zeitschrift für Bevölkerungswissenschaft. Vol. 35.
No. 3. (2010). pp. 637–664.
SPÉDER ZS. [2006]: Mintaváltás közben. A gyermekvállalás időzítése az életútban, különös tekintettel a
szülő nők iskolai végzettségére és párkapcsolati státusára. [Towards a New Fertility Regime. The
Timing of Childbearing in the Life Course, the Effects of Partnership Types and Educational
Differences] Demográfia. 2006. 49. évf. 2–3. szám 113–149.
SPÉDER, ZS. – KAMARÁS, F. [2008]: Hungary: Secular Fertility Decline with Distinct Period Fluctuations.
Demographic Research. Vol. 19. No. 18. pp. 599–664.
STATISTICAL OFFICE OF THE SLOVAK REPUBLIC [2008–2012]: Population Change in the Slovak Rebublic 2008–2012. Bratislava.
SZALMA I. [2011]: A munkaerő-piaci helyzet hatása az első tartós párkapcsolat kialakítására és a
szülővé válásra Magyarországon. [The Effect of Labour Market Position on the Formation of the
First Partnership and Transition to Parenthood in Hungary] PhD-thesis. Budapesti Corvinus
Egyetem, Szociológiai Doktori Iskola. Budapest.
VID [2012]: European Demographic Data Sheet 2012. Wittgenstein Centre, Vienna Institute of Demography (VID), International Institute for Applied Systems Analysis (IIASA). http://www.oeaw.ac.at/vid/datasheet/index.html
YAMAGUCHI, K. – BEPPU, M. [2004]: Survival Probability Indices of Period Total Fertility Rate. Discussion
Paper Series 2004-01, The Population Research Centre, NORC & The University of Chicago.
http://www.src.uchicago.edu/prc/pdfs/yamagu04.pdf.