Embed Size (px)
Citation preview
International Journal of Recent Engineering Research and Development (IJRERD) ISSN: 2455-8761
www.ijrerd.com || Volume 04 – Issue 04 || April 2019 || PP. 21-38
21 | P a g e www.ijrerd.com
Comparison of Detection and Height Sizing Ability of Planar
Defect in Thick Wall Weld Steel Between PAUT and TOFD
Techniques
Chanvich Rungrueng1, Asa Prateepasen2 Department of Production Engineering, King Mongkut’s University of Technology Thonburi, 126 Pracha Uthid
Rd, Bangmod , Thung-Khru, Bangkok 10140
Abstract: Pressure vessels with thick wall steel materials in-service used in Refinery industries generally suffers
potential failures from planar defects, then they must be strictly inspected by Law and Standards throughout their
life cycle to guarantee for safe operation. This research aims to compare the detection ability and height sizing
accuracy of Phased array ultrasonic testing (PAUT) and Time of flight diffraction (TOFD) methods in order to
determine which technique is more suitable for detection and height sizing small planar defects. Three flaw sizes
were mocked up around the acceptable size of ASME Section VIII Division 2 Code, which are at smaller
acceptable size, at rejected size and over the rejected size for both on surface and under surface respectively. The
results show that for the Small under surface planar defects, TOFD is better than tip back diffraction technique of
PAUT in detection and height sizing. TOFD is also able to size smaller defects. Defects high under 5 mm. are not
blind in TOFD method whereas it is not clearly distinguished by tip back diffraction technique and lead to easily
misinterpretation. For Surface planar defects, tip back diffraction technique exhibits similar accuracy results
compared to TOFD and can also size small defects. Tip back diffraction technique trends to provide the undersize,
especially defects at surfaces because of the broad saturated signal area. Moreover, PAUT should not be used as a
stand-alone scanning technique, in case of requiring high reliability on height sizing such as Fitness-for-service
calculation or Engineering Critical Assessment (ECA) analysis and a combination of PAUT and TOFD is
recommended.
Keywords: Ultrasonic testing (UT), Phased array ultrasonic testing (PAUT), Time of flight diffraction (TOFD),
Planar defect, Height sizing. Tip back diffraction, Pressure vessel.
1. Introduction
Pressure vessels with thick wall steel materials have been used in Refinery industries undergo both operation
changes and hydrocarbon environments or sour service while in-service [1]. These steel pressure vessels operate
in low to ambient temperatures with hydrocarbon environments or sour service. The design temperature for steel
pressure vessel materials typically range from -48 C to AMB. The welding of these thick wall steels [2-3] during
maintenance activities or prolonged exposure of the steel to hydrocarbon or sour service conditions can be leading
to deleterious effects such as embrittlement or loss of toughness. Hence, vessels constructed with the thick wall
carbon steels, cracking triggered by ductile-to-brittle transition temperature region, unwanted brittle
microstructures [4] or hydrogen diffusion [5] into the heat effected zone (HAZ) coinciding with high residual
stresses, represents a potentially catastrophic failure.
For decades, Radiographic Testing (RT) has been applied as the primary NDE method to examine and
evaluate the thick wall steel pressure vessel condition during equipment Shutdown and Major Turnaround Projects
which most of the time its period has been relatively short in order to minimize the downtime cost. But main
disadvantages of radiography (RT) are time consuming, costly and potential hazard to health associated with the
ionizing radiations which are the basis of RT method. Currently, Ultrasonic Test (UT) as an alternative method to
radiography [6-8], has been accepted and widely applied for in-serviced pressure vessel inspection in industries.
Furthermore, ASME Section VIII Div. 1 & 2 [6] and Local Law & Regulations [8] have been accepting these two
UT techniques including phased array ultrasonic test (PAUT) and time-of-flight diffraction (TOFD) in replacing
the conventional radiography (RT) method for welding inspection of steel pressure vessels.
Acceptance criteria [9-10] for planar defects (e.g. cracks or lack of side wall fusion) of these 2 UT
techniques based on the fundamental principle of fracture mechanic which requires knowing the accurate data on
defect size/dimension for acceptance or rejection consideration. Therefore, the selection of a proper UT technique
in detection and sizing the flaw dimension is very essential. A minor error in flaw detection and sizing can be
leading to wrong judgment and can cause for catastrophic failure on equipment during in service. Anmol Birring
[11], there are numerous UT techniques in detection, determining and sizing planar defects such as Amplitude
International Journal of Recent Engineering Research and Development (IJRERD)
ISSN: 2455-8761
www.ijrerd.com || Volume 04 – Issue 04 || April 2019 || PP. 21-38
22 | P a g e www.ijrerd.com
ratio, dB drop likes 6 dB or 20 dB drops, and tip diffraction techniques likes TOFD and Tip back diffraction [12].
Many years, PAUT has been most popular and widely used for planar defect detection and sizing that
applicable for steel pressure vessel inspection but however there had been many cases in the past found that
inspection results reported by PAUT were questioned and it could not be used as a reference for Fitness-For-
Service (FFS) calculations or Engineering Critical Assessment (ECA) analysis. Currently, there is higher potential
and demanding to use TOFD in replacing PAUT and RT for thick weld steel pressure vessel inspection because it
is another UT method that has been accepted by Standards for the Statutory Inspection and in applying FFS and
ECA analysis which requires the high reliability of UT method.
Recent studies [12,13,14,15,16,17] concluded that sizing accuracy by amplitude-drop was not good
enough and generally inadequate for Fitness – For - Service (FFS) calculation. Olympus NDT [13], sizing should
be performed and based on non-amplitude (time- of-flight-diffraction) technique in case of Fitness-For-Service
Propose or Engineering Critical Assessment (ECA) analysis. TOFD has provided the most accurate results in
measuring and determining the sizing of different types of planar defects with its accuracy (±0.3 mm) [13].
However [13-14], TOFD success relies on many set-up parameters and TOFD should not be stand-alone quick
scanning UT method. TOFD is somewhat difficult to interpret and has some limitations for surface open defects
due to dead zones or having poor resolution for some significant small defects and some planar defects were not
be detected (high as 3 mm and 5 mm) with sizing accuracy is low as ±4 mm [13,15] which are very concern for
in-service thick wall pressure vessel inspection that some planar defect likes fatigue cracking and hydrogen
induced cracking are potentially started from small flaw and connected to steel surface.
Olympus NDT [13], how dose PAUT fit for FFS and ECA concept of safety case, monitoring, and
disposition compare with TOFD? PAUT has specific advantages compare with TOFD; focused beam with high
signal to noise ratio (SRN), interpretation easy and straightforward, multiple beam with high resolution, data
analysis is significant easier than for TOFD, and data can be plotted in 2D/3D for analysis. PAUT using tip back
diffraction technique can size to similar accuracies to TOFD, sizing accuracy ~0.5 mm though careful practices
[12] and can size smaller planar defect. However, a reliable planar defects sizing based on tip-echo techniques of
PAUT method depends on a suitable specimen thickness, phase array probe frequency, damping, and bandwidths
as well as material quality [13]. Tip back diffraction technique, height sizing can be done by simply measuring
the vertical distance between the images of the peak amplitude from diffracted echoes. Measuring the distance
between tip to tip echoes has provided the high accuracy, but however measuring the distance between tip to
reflect peak echo from a defect corner is potential to provide less reliable and accuracy, especially in case of small
open planar defects. In practice, small flaw sizes can be easily overestimated by several millimeters [13] and these
also can have a very deleterious impact on the inspection results.
Therefore, it is unclear if tip diffraction technique such as PAUT by tip back diffraction and TOFD is
applicable for small planar defects, especially small open planar defects on surfaces [19-22]. Some blinded defects
(high as below 5 mm) with sizing accuracy is low as formerly mentioned by TOFD technique [13,15] will be
studied and compared with tip back diffraction technique of PAUT and if only stand-alone PAUT method is still
enough to provide the satisfactory accuracy result for FFS and ECA analysis which requires very high reliability
of UT height sizing method.
This paper covers the work performed on a detailed study comparing the accuracy in detection and high
sizing ability for planar defects in thick wall weld steel between PAUT and TOFD. Three flaw sizes were mocked
up around the acceptable size of ASME Section VIII Division 2 Code, which are at smaller acceptable size, at
rejected size and over the rejected size for both surfaces and subsurface. The objective is to determine which UT
technique is more suitable in detection and height sizing planar defects, especially small open planar defects on
surfaces of thick weld steel and this research result can be benefit for industries in selection of proper UT
techniques for the Statutory Inspection as LAW and for the planar defect height sizing and growth monitoring for
Fitness-For-Service (FFS) calculations or Engineering Critical Assessment (ECA) analysis.
2. Theories
2.1 Planar defects and acceptance criteria [7,9,23].
Flaw types in a weld are categorized into two major types including planar and volumetric defects.
Because planar defects as per ASME Section VIII Div.1 UG Appendix 12 [7] such as cracks and lack of side wall
fusion (LF) are more harmful and come with higher risks than volumetric defects, thereby in-service equipment
inspection has been mostly focused on planar defects. Fracture Mechanic’s theory refers to a vital specialization
within solid mechanics in which the presence of defects was assumed. Defects can be voids, dents on the surface or
internal pores. Fractures are typically initiated at tip of the planar defect; stress is concentrated at the tip of the
defects under the loads and propagates catastrophically through the structure. Crack tip parameter describes the
severity of a failure by showing the ability of a material to resist a fracture. To study the size of a defect (a) and
International Journal of Recent Engineering Research and Development (IJRERD)
ISSN: 2455-8761
www.ijrerd.com || Volume 04 – Issue 04 || April 2019 || PP. 21-38
23 | P a g e www.ijrerd.com
stress under the load (σ) affected to the fracture, it can be formulated in the expression for stress intensity factor
(K) as follow:
𝐾1 = 𝑌𝜎√𝜋𝑎
Written as:
K1: Stress intensity factor, K1C: Stress intensity factor at critical stress Material can resist a fracture when K1 is less than K1C. This property is called fracture toughness. Both
PAUT and TOFD techniques are mainly applied in the principle of UT requirements for fracture-mechanics based
acceptance criteria as per ASME Section V Article 4, MANDATORY APPENDIX IX [9] by considering flaw
through-wall dimension and the length of flaw. These values are determined for using in the flaw rejection or
acceptance. Therefore, the selection of a proper UT technique in detection and determining flaw dimensions is
very essential for this concept. Minor errors in flaw sizing could be leading to wrong judgment and decision and
could be causing for catastrophic failure on equipment during in service.
2.2 NDE Methods.
2.2.1 Phased Array Ultrasonic Testing (PAUT) [13-14, 24]
Phased array ultrasonic technology was adapted from the medical field to the industrial sector at the
beginning of the 1980s. By the mid of 1980s, piezocomposite materials were developed and made available to
manufacture the complex-shaped phase array probes. Phased array ultrasonic testing (PAUT) is an advanced UT
method. The term phased refers to the timing, while the term array refers to the multiple elements as illustrated
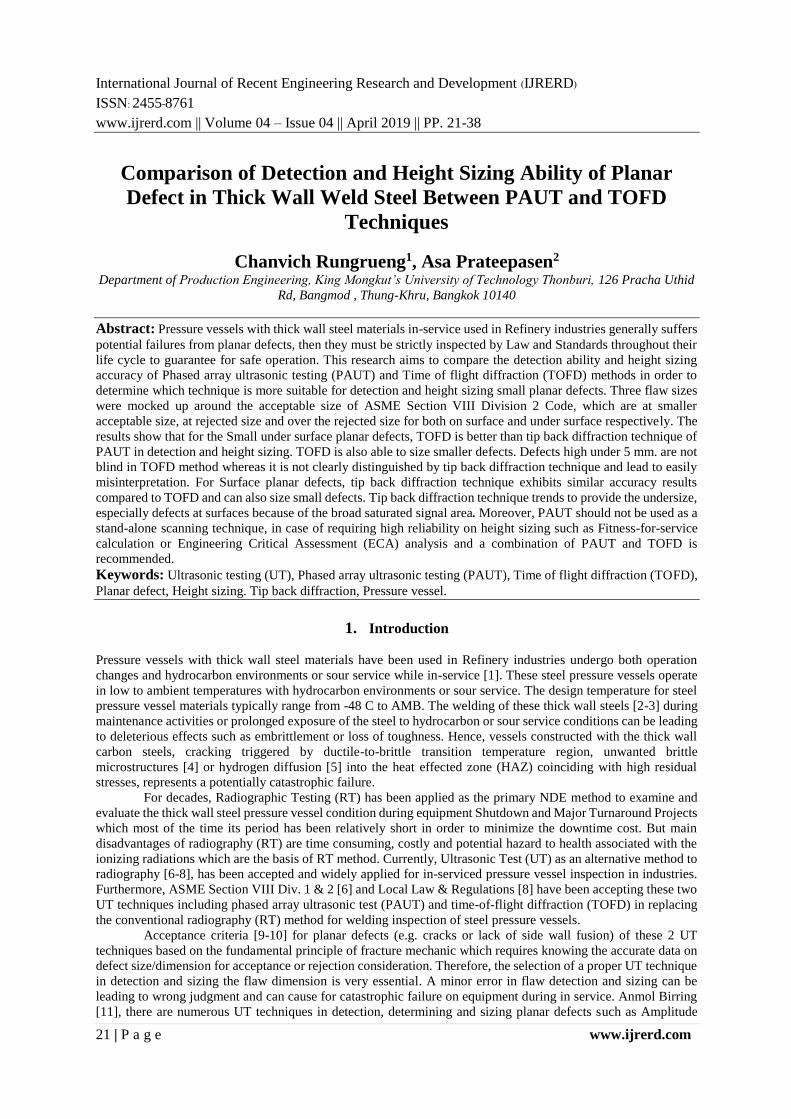
in Figure 1. A phased array system utilizes the wave physics principle of phasing. It varies the time between a
series of outgoing ultrasonic pulses in such a way that the individual wave fronts generated by each element in
the array combine with each other. This action adds or cancels energy in a predictable way that effectively steers
and shapes the sound beam. This is accomplished by pulsing the individual probe elements at slightly different
times. The numbers of elements in a probe can be 8, 16, 32, 64 and 128. Each piezoelectric element in the probe
is adjusted (focal lows) by computer-controlled excitation. Elements are pulsed into groups of 4 to 32 elements
in order to improve effective sensitivity by increasing aperture, which then reduces unwanted beam spreading
and enables shaper focusing. A probe can be focused and swept the beams at 45 to 75 degrees electronically
without moving. The PAUT probe can spread signal emissions across a wider range of frequencies, allowing a
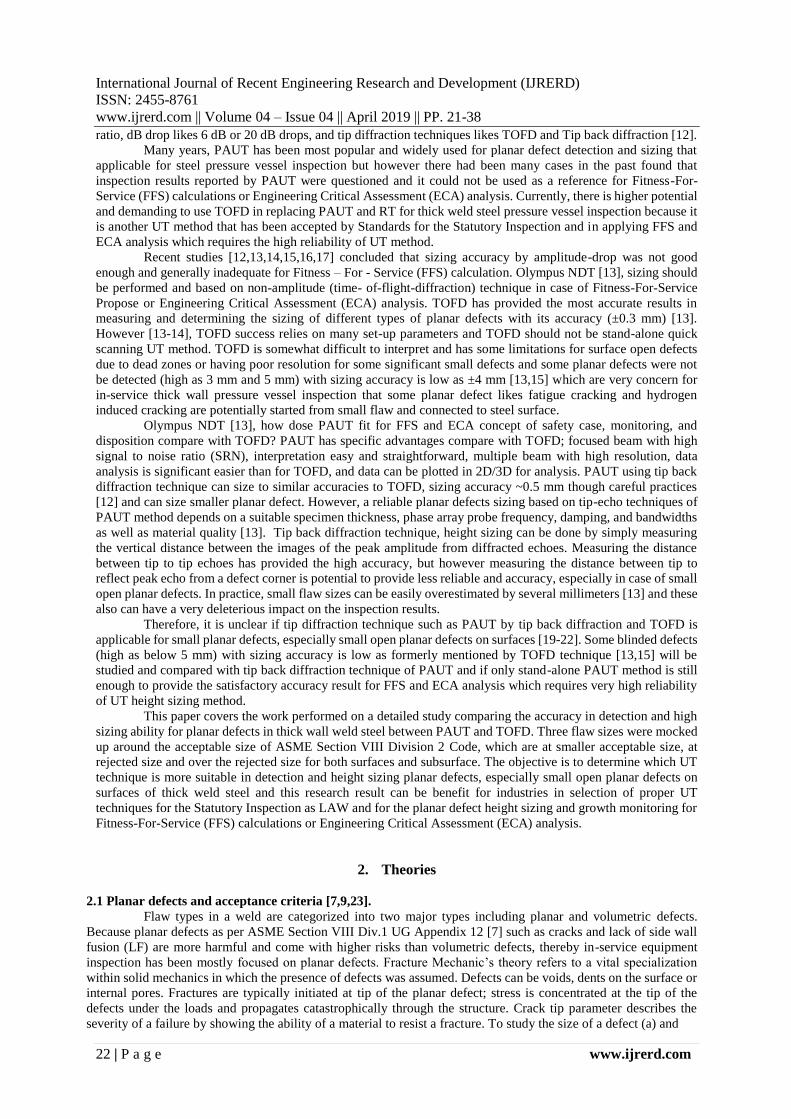
wider area of coverage. Data from multiple beams is combined to create a visual image such as A scan, B scan,
C scan, D scan and S scan as in Figure 2. The PAUT display is in 2D or 3D, allowing the operator to see the flaw
location and measure its size.
Figure 1: Basic components of a phased array system [14]
Figure 2: Example of PAUT display; A Scan, B Scan, C Scan and S Scan
(1)
International Journal of Recent Engineering Research and Development (IJRERD)
ISSN: 2455-8761
www.ijrerd.com || Volume 04 – Issue 04 || April 2019 || PP. 21-38
24 | P a g e www.ijrerd.com
2.2.2 Time of Flight Diffraction (TOFD) [13-14,25]
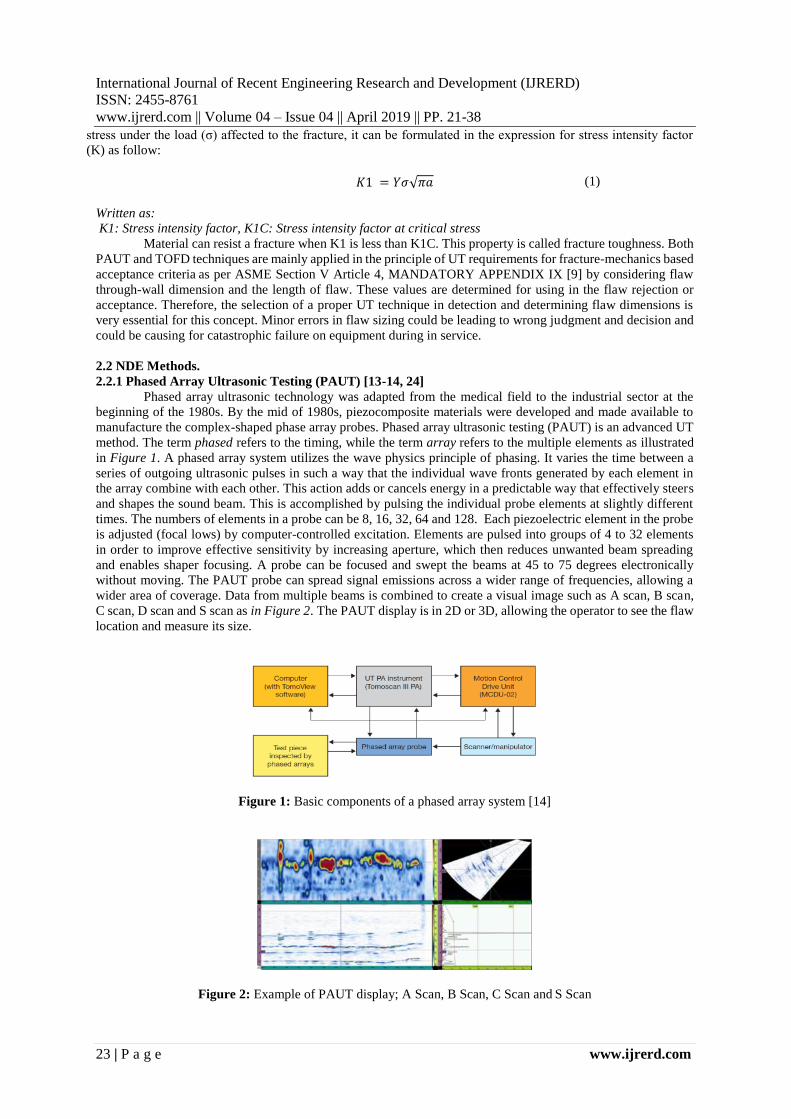
Time of flight diffraction is an advanced method of UT. TOFD technique is based on the diffraction of
ultrasonic waves from the tips or edges of flaw as shown in Figure 3. It is different from UT and PAUT which
are based on the signal amplitude reflection from the interface of flaw [24]. TOFD usually uses longitudinal
waves for the primary detection. In addition to energies diffracted by defects, the TOFD method will also detect
a surface (lateral) wave traveling directly between the probes and also a back-wall reflection from energies that
reach the back of the test piece. Defects on the upper and lower surfaces are difficult to detect due to the dead
zone in the lateral wave and because of the dead zone in the back-wall signal.
Figure 3: Principle of Time of Flight Diffraction (TOFD) [14]
TOFD uses 2 probes (Transmitter and Receiver) placed on each side of the weld. A transmitter sends
the ultrasonic beam into the material. When beam comes into contact with the tip of a flaw or crack, it is diffracted,
and energy is sent to the receiver. The flaw is the signals between the lateral wave and back wall echo, as shown
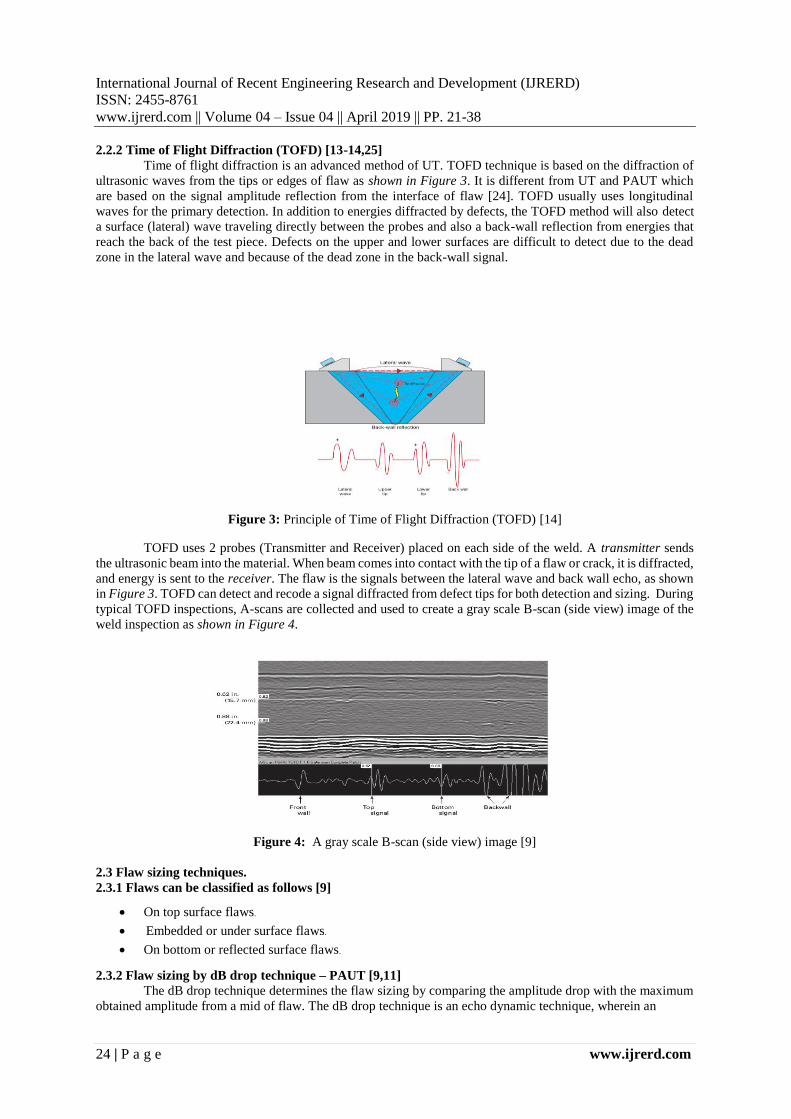
in Figure 3. TOFD can detect and recode a signal diffracted from defect tips for both detection and sizing. During
typical TOFD inspections, A-scans are collected and used to create a gray scale B-scan (side view) image of the
weld inspection as shown in Figure 4.
Figure 4: A gray scale B-scan (side view) image [9]
2.3 Flaw sizing techniques.
2.3.1 Flaws can be classified as follows [9]
• On top surface flaws. • Embedded or under surface flaws. • On bottom or reflected surface flaws.
2.3.2 Flaw sizing by dB drop technique – PAUT [9,11]
The dB drop technique determines the flaw sizing by comparing the amplitude drop with the maximum
obtained amplitude from a mid of flaw. The dB drop technique is an echo dynamic technique, wherein an
International Journal of Recent Engineering Research and Development (IJRERD)
ISSN: 2455-8761
www.ijrerd.com || Volume 04 – Issue 04 || April 2019 || PP. 21-38
25 | P a g e www.ijrerd.com
ultrasonic probe is moved across the flaws and the amplitude profile is related to the flaw size. This technique is
highly dependent on the beam width and the level of reflected signal amplitude, if not corrected for longer metal
paths, will result in over-sizing of small defects. PAUT improves the dB drop sizing technique by reducing the
beam spreading and enabling sharper focusing.
𝑆 = 20 𝑙𝑜𝑔(𝑉1
𝑉2) = 20 𝑙𝑜𝑔(
𝐴1
𝐴2) [𝑑𝐵]
Written as: S: The difference in sound intensity expressed in decibels (dB), V1, V2, A1 and A2: Two different
voltage or sound amplitude measurements.
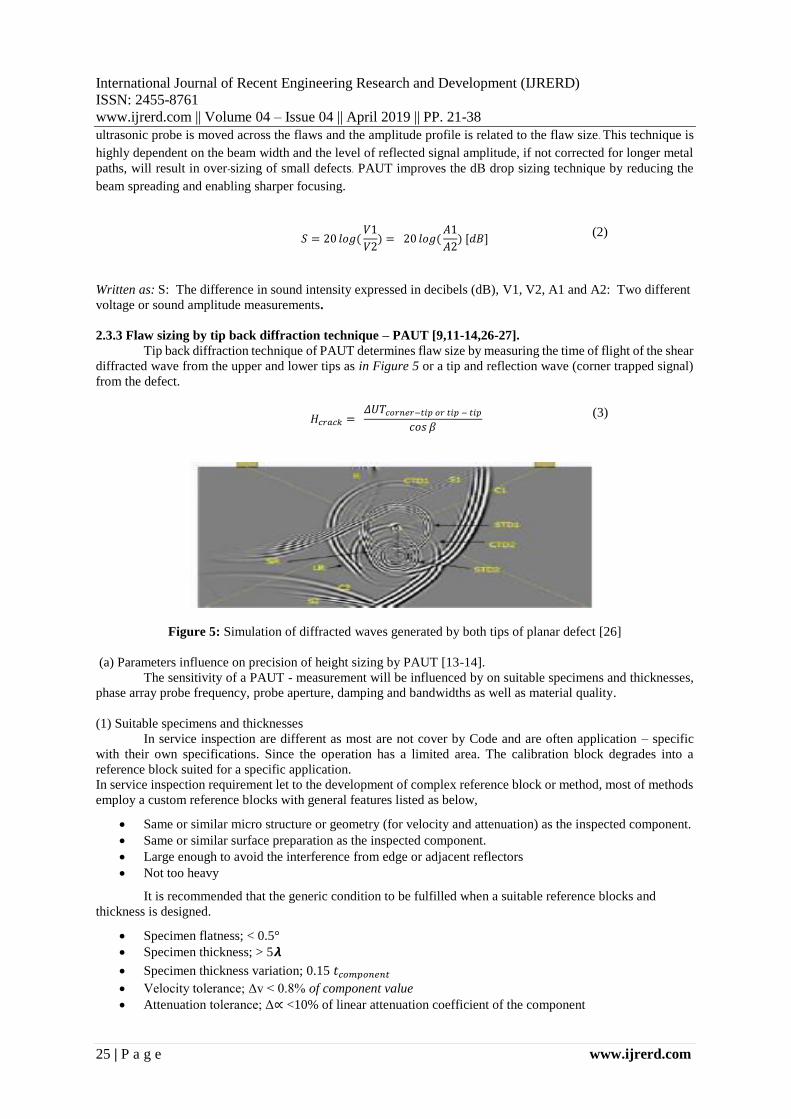
2.3.3 Flaw sizing by tip back diffraction technique – PAUT [9,11-14,26-27].
Tip back diffraction technique of PAUT determines flaw size by measuring the time of flight of the shear
diffracted wave from the upper and lower tips as in Figure 5 or a tip and reflection wave (corner trapped signal)
from the defect.
𝐻𝑐𝑟𝑎𝑐𝑘 = 𝛥𝑈𝑇𝑐𝑜𝑟𝑛𝑒𝑟−𝑡𝑖𝑝 𝑜𝑟 𝑡𝑖𝑝 − 𝑡𝑖𝑝
𝑐𝑜𝑠 𝛽
Figure 5: Simulation of diffracted waves generated by both tips of planar defect [26]
(a) Parameters influence on precision of height sizing by PAUT [13-14].
The sensitivity of a PAUT - measurement will be influenced by on suitable specimens and thicknesses,
phase array probe frequency, probe aperture, damping and bandwidths as well as material quality.
(1) Suitable specimens and thicknesses
In service inspection are different as most are not cover by Code and are often application – specific
with their own specifications. Since the operation has a limited area. The calibration block degrades into a
reference block suited for a specific application.
In service inspection requirement let to the development of complex reference block or method, most of methods
employ a custom reference blocks with general features listed as below,
• Same or similar micro structure or geometry (for velocity and attenuation) as the inspected component.
• Same or similar surface preparation as the inspected component.
• Large enough to avoid the interference from edge or adjacent reflectors
• Not too heavy
It is recommended that the generic condition to be fulfilled when a suitable reference blocks and
thickness is designed.
• Specimen flatness; < 0.5°
• Specimen thickness; > 5𝞴
• Specimen thickness variation; 0.15 𝑡𝑐𝑜𝑚𝑝𝑜𝑛𝑒𝑛𝑡
• Velocity tolerance; Δv < 0.8% of component value
• Attenuation tolerance; Δ∝ <10% of linear attenuation coefficient of the component
(2)
(3)

International Journal of Recent Engineering Research and Development (IJRERD)
ISSN: 2455-8761
www.ijrerd.com || Volume 04 – Issue 04 || April 2019 || PP. 21-38
26 | P a g e www.ijrerd.com
(2) Phase array probe frequency
In the selection of PAUT probe, there were many frequencies available for selection. The best probe
frequency for high sensitivity should be high frequency probe however if it was too high frequency, it could affect
the thick wall steel material especially for some small defects at surface due to less depth penetration of wave
energy could cause for low detection ability whereas if too low probe frequency, it could cause for less sensitivity
and resolution, so the probe frequency should be optimized for a suitable thickness.
(3) Probe aperture
Number of element and probe size also could affect the sensitivity, higher number of element with bigger
probe size provide better sensitivity for height sizing because of narrow beam and producing small focal spot.
Focal spot size depends on probe active aperture (A or D), wavelength (𝞴) and focal length (F). Focusing is
limited to the near field of the phased array probe.
𝐹𝑜𝑐𝑎𝑙 𝑠𝑝𝑜𝑡 𝑠𝑖𝑧𝑒 = 𝐹𝜆
𝐴𝑜𝑟 1.02
𝐹𝑐
𝑓𝐷
(4) Bandwidth (damping)
Bandwidth (BW) is the frequency range within a given time limits and can be calculated by,
𝐵𝑊(𝐻𝑧) = 𝑓𝑈−6𝑑𝐵 − 𝑓𝐿−6𝑑𝐵
𝐵𝑊(%) = 100% · (𝑓𝑈−6𝑑𝐵 − 𝑓𝐿−6𝑑𝐵)
𝑓𝑐
Narrow bandwidth (15-30%) best for detection
Medium bandwidth (31-75%) detection and sizing
High bandwidth (76-110%) best for sizing
Phase array probes typically have a broad bandwidth and piezocomposite material which phase array
probes are made of provides high sizing performance.
(5) Material quality
One of the critical feature for height sizing measurement is the metallurgical structure. The ultrasonic
velocity is a major factor for time base calibration, attenuation coefficient and sizing. Difference in material
quality will affect to height sizing performance by differs in ultrasonically velocity in the material. If input
velocity is a higher value than the actual value, the sizing value will have a higher value than the actual value. If
the input velocity is lower, the sizing value will decrease. The programmed (or block velocity) must be within ±
80 m/s of the actual test piece material for ±1 mm height.
(b) Sensitivity (Se) of PAUT; the ratio between the output and input voltage for specific set up.
𝑆𝑒 = 20 𝑙𝑜𝑔10 · 𝑉𝑜𝑢𝑡
𝑉𝑖𝑛 [𝑑𝐵]
2.3.4 Flaw sizing by TOFD [9,11-13,22,25-27]
TOFD detect and recode signal diffracted from defect tips for both detection and sizing. The flaw is the
signals between lateral wave and back wall echo as showing in Figure 12 -13.
(a) Flaw height determination - Flaw height (thru-wall dimension) is determined as follows [9,25]: (1) Top surface open or connected flaws: The height of a top open flaw is determined by the distance between the
top- surface lateral wave and the lower-tip diffracted signal. (b) Embedded flaws (subsurface): The height of an embedded flaw is determined by (1) the distance between the
upper-tip diffracted signal and the lower-tip diffracted signal as Figure 5 or can be calculated by,
𝐷 = [(𝑐(𝑡𝑑1 + 𝑡𝑝)
2)2 − 𝑠2]
1/2
(8)
(4)
(5)
(6)
(7)
International Journal of Recent Engineering Research and Development (IJRERD)
ISSN: 2455-8761
www.ijrerd.com || Volume 04 – Issue 04 || April 2019 || PP. 21-38
27 | P a g e www.ijrerd.com
𝐻𝑑 𝑜𝑟 𝐿 = [(𝑐(𝑡𝑑2 + 𝑡𝑝)
2)2 − 𝑠2]
1/2
− 𝐷
(2) Bottom or reflected surface open flaws: The height of a bottom-surface connected flaw is determined by the
distance between the upper tip diffracted signal and the back wall signal.
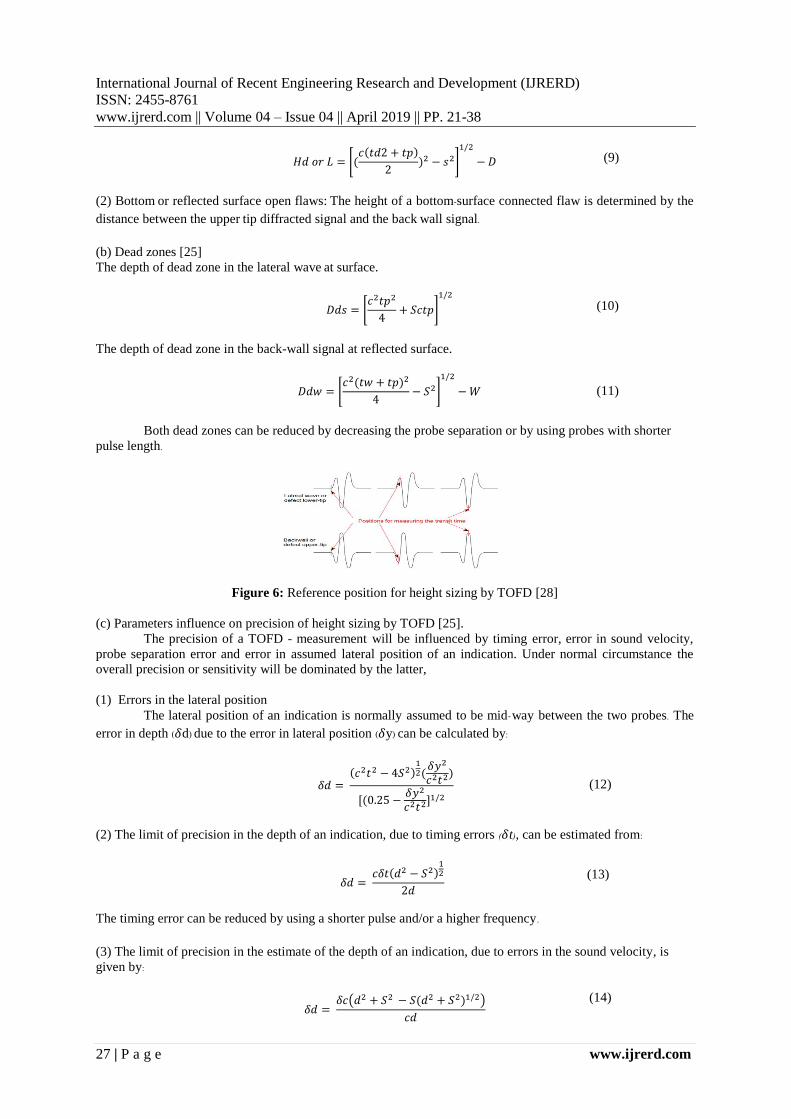
(b) Dead zones [25]
The depth of dead zone in the lateral wave at surface.
𝐷𝑑𝑠 = [𝑐2𝑡𝑝2
4+ 𝑆𝑐𝑡𝑝]
1/2
The depth of dead zone in the back-wall signal at reflected surface.
𝐷𝑑𝑤 = [𝑐2(𝑡𝑤 + 𝑡𝑝)2
4− 𝑆2]
1/2
− 𝑊
Both dead zones can be reduced by decreasing the probe separation or by using probes with shorter
pulse length.
Figure 6: Reference position for height sizing by TOFD [28]
(c) Parameters influence on precision of height sizing by TOFD [25].
The precision of a TOFD - measurement will be influenced by timing error, error in sound velocity,
probe separation error and error in assumed lateral position of an indication. Under normal circumstance the
overall precision or sensitivity will be dominated by the latter,
(1) Errors in the lateral position
The lateral position of an indication is normally assumed to be mid-way between the two probes. The
error in depth (𝛿d) due to the error in lateral position (𝛿y) can be calculated by:
𝛿𝑑 = (𝑐2𝑡2 − 4𝑆2)
12(
𝛿𝑦2
𝑐2𝑡2)
[(0.25 −𝛿𝑦2
𝑐2𝑡2]1/2
(2) The limit of precision in the depth of an indication, due to timing errors (𝛿t), can be estimated from:
𝛿𝑑 = 𝑐𝛿𝑡(𝑑2 − 𝑆2)
12
2𝑑
The timing error can be reduced by using a shorter pulse and/or a higher frequency.
(3) The limit of precision in the estimate of the depth of an indication, due to errors in the sound velocity, is
given by:
𝛿𝑑 = 𝛿𝑐(𝑑2 + 𝑆2 − 𝑆(𝑑2 + 𝑆2)1/2)
𝑐𝑑
(9)
(10)
(11)
(12)
(13)
(14)

International Journal of Recent Engineering Research and Development (IJRERD)
ISSN: 2455-8761
www.ijrerd.com || Volume 04 – Issue 04 || April 2019 || PP. 21-38
28 | P a g e www.ijrerd.com
This error is reduced if the probe separation is reduced. Independent calibration of the velocity by measurement
of the delay of the back wall echo, with a known wall thickness, greatly reduces this error.
(4) Errors in the distance between the index points (𝛿s) will result in errors in depth-measurement. The error in
depth 𝛿d can be calculated by:
𝛿𝑑 = 𝛿𝑆(𝑑2 + 𝑆2 − 𝑆)
𝑑
It should be noted that errors in probe separation can arise from both measurement errors in the distance
between the probes, as well as errors in the index point calibration.
(d) The spatial resolution (R) is a function of depth and can be calculated by:
𝑅 = (𝑐2(𝑡𝑑 + 𝑡𝑝)2/4 − 𝑆2)1/2 − 𝑑
tp is the length of the acoustic pulse and td is the time-of-flight at depth d. The resolution increases with
increasing depth and can be improved by decreasing the probe separation or the acoustic pulse length.
(e) TOFD probe frequency
UT based on reflected echo which requiring a minimum level of signal amplitude for processing and
demonstration. Whereas, TOFD based on diffraction echo therefore even a small signal from the tip of defect can
be detected by TOFD. Sound wave penetration is not a major concern in TOFD, thus higher probe frequency is
recommended for height sizing by TOFD for the best sensitivity.
3. Experimental Procedure
3.1 Equipment and test plate
3.1.1 Ultrasonic instrument: Omiscan-MX2 (Omiscan 32:128); UT machine for both PAUT and TOFD
experiments was the same UT brand name and model machine as shown in Figure 8. The UT machine brand
name was Olympus and the Model was Omiscan - MX2.
3.1.2 Probe (Olympus)
PAUT: 5L64-A2, 5 MHz, 64 Elements, Pitch 0.6 mm, Wedge 33°.
TOFD: IM-10-3, 10 MHz, Single Element, Element size 3 mm, Wedge 70°.
3.1.3. Test Plate.
Prepare 2 test plates, material: A537 Class 1 with 240 x 300 x 28.6t mm and use Electrical Discharge
Machining (EDM) creating vertical planar flaws on surface (located at fusion line) and at subsurface (located
approximately at mid thickness region). Test plates contained EDM notches oriented to simulate flaws parallel to
the weld centerline and major groove faces as guided by ASME Section V Article 4, MANDATORY APPENDIX
IX. Flaw sizes were calculated as per specimen thickness and covered three sizes including smaller acceptable
size, at rejected size and over the rejected size as in Table 1. Welding process was SMAW with double V groove
weld. Surface roughness was as rolled condition. Surface was 0.5° incline max.
Figure 7: A macro etched specimens for actual defect height measurement.
Table 1: Size and Location of designed vertical planar flaws.
(15)
(16)
Flaw Location Size of vertical planar flaws (mm)
Parallel On surface 10(A) 6(B) 4(C) 2.5(D) 1.5(E)
Parallel Under surface 1.5(G) 2.5(H) 4(I) 6(J) 10(K)
International Journal of Recent Engineering Research and Development (IJRERD)
ISSN: 2455-8761
www.ijrerd.com || Volume 04 – Issue 04 || April 2019 || PP. 21-38
29 | P a g e www.ijrerd.com
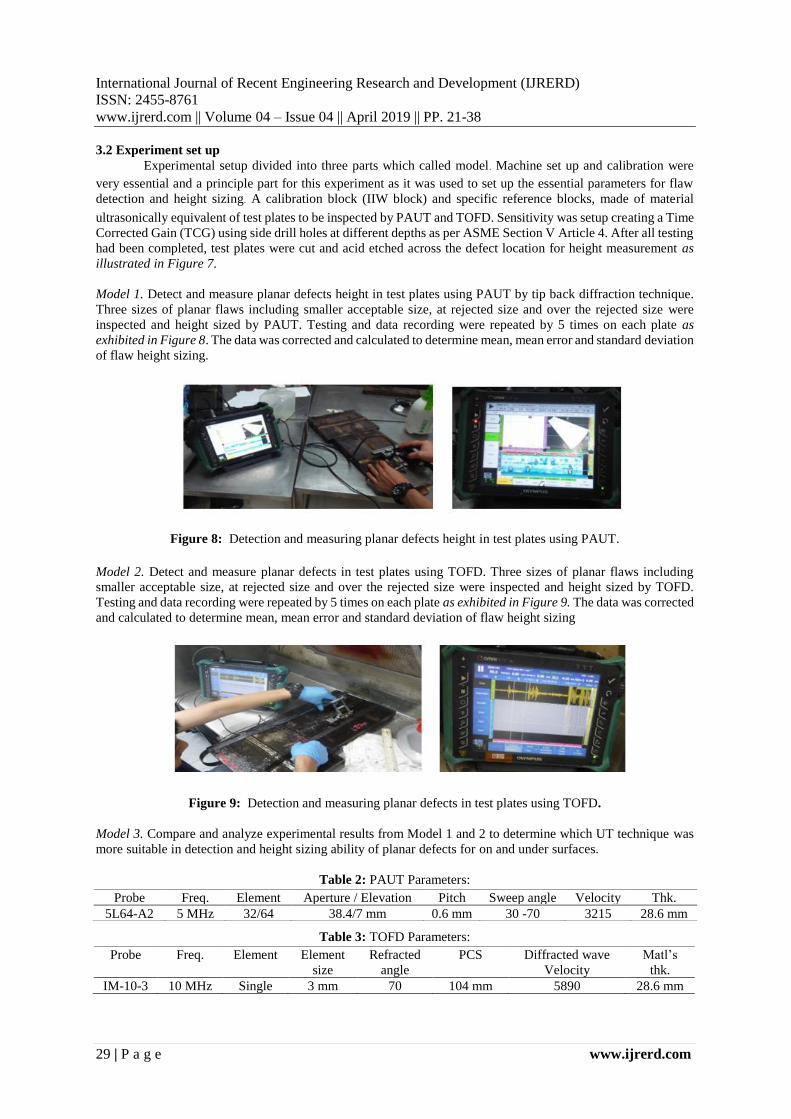
3.2 Experiment set up
Experimental setup divided into three parts which called model. Machine set up and calibration were
very essential and a principle part for this experiment as it was used to set up the essential parameters for flaw
detection and height sizing. A calibration block (IIW block) and specific reference blocks, made of material
ultrasonically equivalent of test plates to be inspected by PAUT and TOFD. Sensitivity was setup creating a Time
Corrected Gain (TCG) using side drill holes at different depths as per ASME Section V Article 4. After all testing
had been completed, test plates were cut and acid etched across the defect location for height measurement as
illustrated in Figure 7.
Model 1. Detect and measure planar defects height in test plates using PAUT by tip back diffraction technique.
Three sizes of planar flaws including smaller acceptable size, at rejected size and over the rejected size were
inspected and height sized by PAUT. Testing and data recording were repeated by 5 times on each plate as
exhibited in Figure 8. The data was corrected and calculated to determine mean, mean error and standard deviation
of flaw height sizing.
Figure 8: Detection and measuring planar defects height in test plates using PAUT.
Model 2. Detect and measure planar defects in test plates using TOFD. Three sizes of planar flaws including
smaller acceptable size, at rejected size and over the rejected size were inspected and height sized by TOFD.
Testing and data recording were repeated by 5 times on each plate as exhibited in Figure 9. The data was corrected
and calculated to determine mean, mean error and standard deviation of flaw height sizing
Figure 9: Detection and measuring planar defects in test plates using TOFD.
Model 3. Compare and analyze experimental results from Model 1 and 2 to determine which UT technique was
more suitable in detection and height sizing ability of planar defects for on and under surfaces.
Table 2: PAUT Parameters:
Table 3: TOFD Parameters:
Probe Freq. Element Aperture / Elevation Pitch Sweep angle Velocity Thk.
5L64-A2 5 MHz 32/64 38.4/7 mm 0.6 mm 30 -70 3215 28.6 mm
Probe Freq. Element Element
size
Refracted
angle
PCS Diffracted wave
Velocity
Matl’s
thk.
IM-10-3 10 MHz Single 3 mm 70 104 mm 5890 28.6 mm
International Journal of Recent Engineering Research and Development (IJRERD)
ISSN: 2455-8761
www.ijrerd.com || Volume 04 – Issue 04 || April 2019 || PP. 21-38
30 | P a g e www.ijrerd.com
4. Results & Discussion
Model 1. 4.1 Flaw detection and height sizing by phased array ultrasonic test (PAUT)
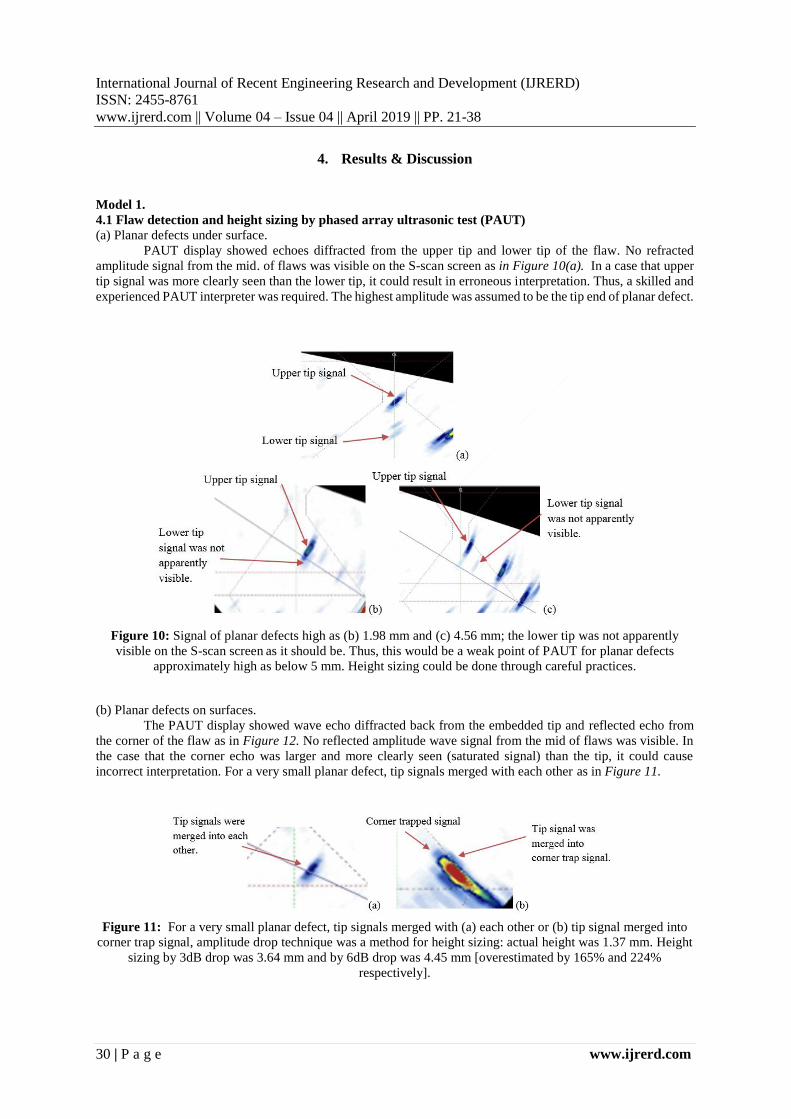
(a) Planar defects under surface.
PAUT display showed echoes diffracted from the upper tip and lower tip of the flaw. No refracted
amplitude signal from the mid. of flaws was visible on the S-scan screen as in Figure 10(a). In a case that upper
tip signal was more clearly seen than the lower tip, it could result in erroneous interpretation. Thus, a skilled and
experienced PAUT interpreter was required. The highest amplitude was assumed to be the tip end of planar defect.
Figure 10: Signal of planar defects high as (b) 1.98 mm and (c) 4.56 mm; the lower tip was not apparently
visible on the S-scan screen as it should be. Thus, this would be a weak point of PAUT for planar defects
approximately high as below 5 mm. Height sizing could be done through careful practices.
(b) Planar defects on surfaces.
The PAUT display showed wave echo diffracted back from the embedded tip and reflected echo from
the corner of the flaw as in Figure 12. No reflected amplitude wave signal from the mid of flaws was visible. In
the case that the corner echo was larger and more clearly seen (saturated signal) than the tip, it could cause
incorrect interpretation. For a very small planar defect, tip signals merged with each other as in Figure 11.
Figure 11: For a very small planar defect, tip signals merged with (a) each other or (b) tip signal merged into
corner trap signal, amplitude drop technique was a method for height sizing: actual height was 1.37 mm. Height
sizing by 3dB drop was 3.64 mm and by 6dB drop was 4.45 mm [overestimated by 165% and 224%
respectively].
International Journal of Recent Engineering Research and Development (IJRERD)
ISSN: 2455-8761
www.ijrerd.com || Volume 04 – Issue 04 || April 2019 || PP. 21-38
31 | P a g e www.ijrerd.com
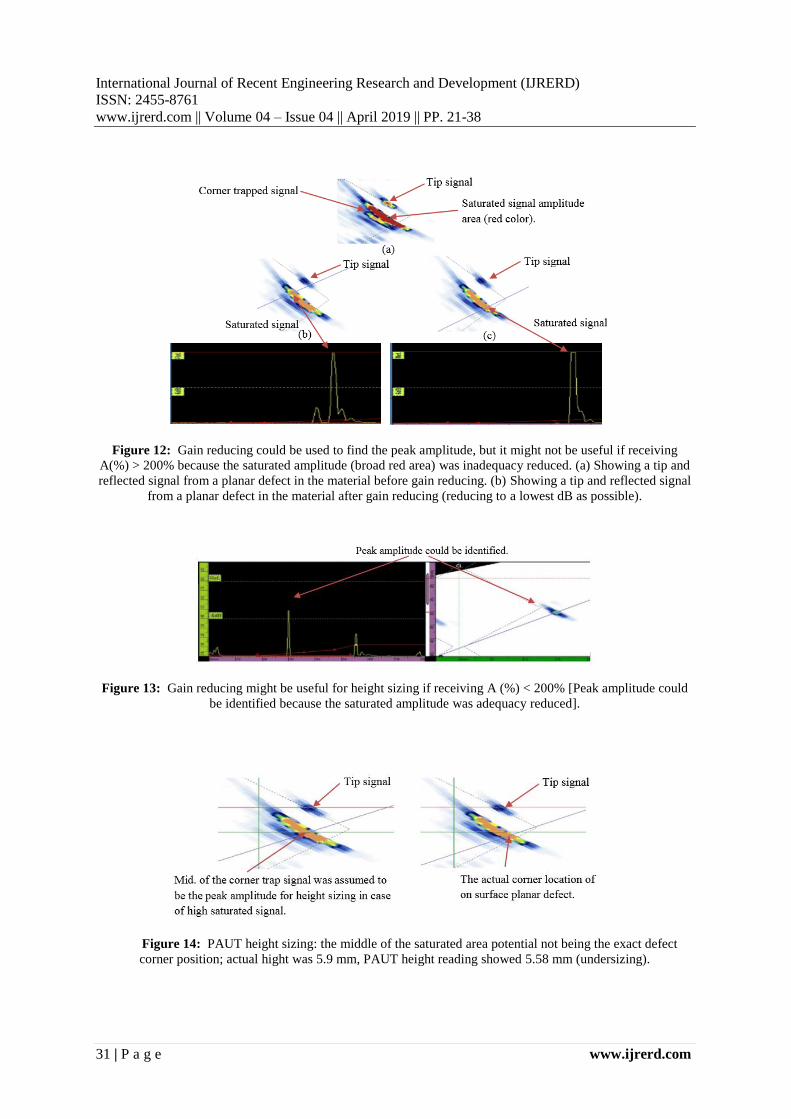
Figure 12: Gain reducing could be used to find the peak amplitude, but it might not be useful if receiving
A(%) > 200% because the saturated amplitude (broad red area) was inadequacy reduced. (a) Showing a tip and
reflected signal from a planar defect in the material before gain reducing. (b) Showing a tip and reflected signal
from a planar defect in the material after gain reducing (reducing to a lowest dB as possible).
Figure 13: Gain reducing might be useful for height sizing if receiving A (%) < 200% [Peak amplitude could
be identified because the saturated amplitude was adequacy reduced].
Figure 14: PAUT height sizing: the middle of the saturated area potential not being the exact defect
corner position; actual hight was 5.9 mm, PAUT height reading showed 5.58 mm (undersizing).

International Journal of Recent Engineering Research and Development (IJRERD)
ISSN: 2455-8761
www.ijrerd.com || Volume 04 – Issue 04 || April 2019 || PP. 21-38
32 | P a g e www.ijrerd.com
Model 2.
4.2 Flaw detection and height sizing by time of flight diffraction technique (TOFD)
The diffracted signals from flaw tips were displayed between the lateral and back-wall reflected waves
as in Figure 15. Defects on the top and bottom surfaces were difficult to detect due to the dead zone in the lateral
wave and because of the dead zone in the back wall signal. Flaw location and height sizing could have some
errors due to TOF locus [13], since the time of diffracted waves depended on the flaw position relative to probes.
The best flaw position for accurate height sizing was the middle between probes. Coupling, surface roughness
and alignment could also cause some errors on height sizing as in Figure 16. Speed of scanning must be carefully
controlled for data recieval and the digitization process. In spite of these limitations, TOFD was fould to be an
accurate UT technique for defect height sizing as in Tables 4,5 and 6 and Figures 21-22. Since the conditions
and parameters must be properly selected and controlled, stand-alone fast scanning by TOFD method was not
recommended. This UT technique should be used as a method for reconfirmation or used in combination with
PAUT. TOFD should also be used as a suitable method for crack growth monitoring.
Figure 15: Signals and height sizing by TOFD.
Figure 16: Missed TOFD data and error due to coupling, surface roughness and alignment during scanning.
4.3 Limitation of PAUT and TOFD on small planar defects.
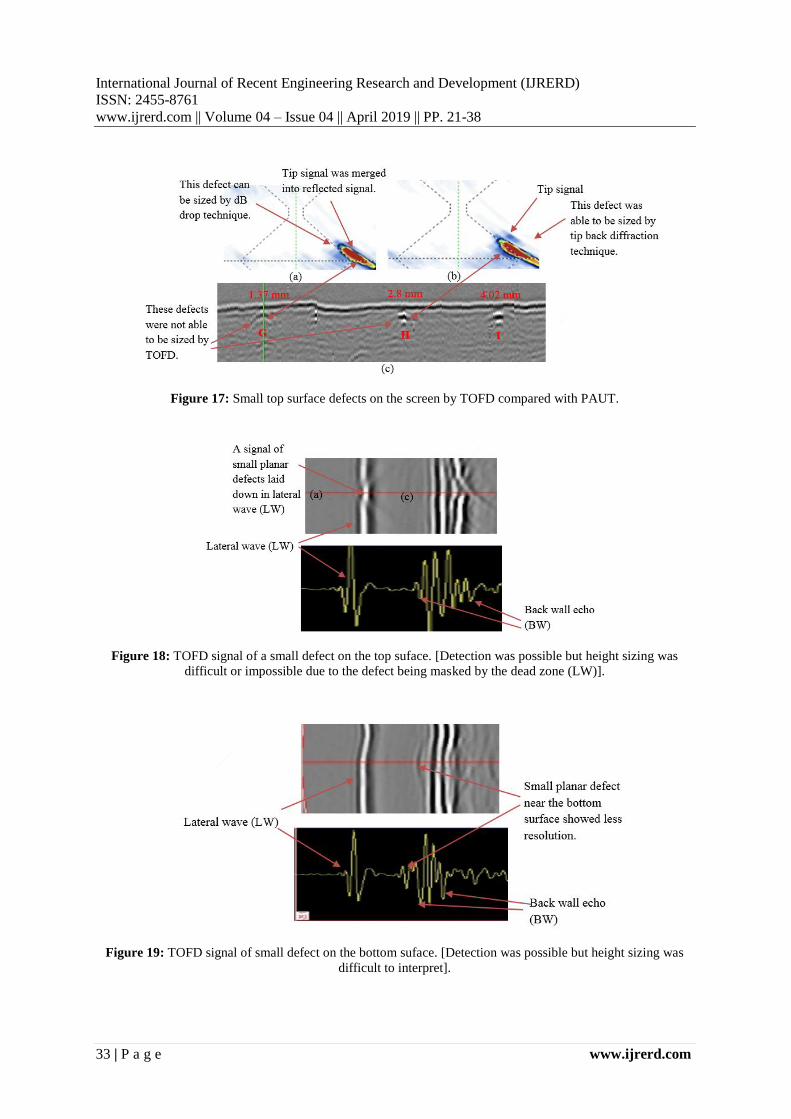
On surface small planar defect “G” (high as 1.37 mm) could be detected by TOFD but was not able to
be sized due to being masked by dead zones as in Figure 17 (c). For tip back diffraction technique, small planar
defect “G” (high as 1.37 mm) could be detected and also was not able to be sized due to tip signals being merged
with each other as in Figure 17 (a). The only method for height sizing for this defect was dB drop technique.
However, sizing by dB drop technique on a very small planar defect on surface resulted in some error (oversizing
about 200% by 6 dB drop) due to strong signal amplitude from the corner leading to missed interpretation.
On surface planar defect “H” (high as 2.8 mm) was not able to be sized by TOFD, whereas PAUT by
tip back diffraction was able to size with good accuracy as in Figure 17 (b)(c) and Table 5-6, thus PAUT by back
diffraction technique could size smaller on surface planar defect. However, in the case of under surface planar
defects, TOFD could size smaller planar defects. The height sizing accuracy using TOFD for under surface was
also high as in Table 4.
International Journal of Recent Engineering Research and Development (IJRERD)
ISSN: 2455-8761
www.ijrerd.com || Volume 04 – Issue 04 || April 2019 || PP. 21-38
33 | P a g e www.ijrerd.com
Figure 17: Small top surface defects on the screen by TOFD compared with PAUT.
Figure 18: TOFD signal of a small defect on the top suface. [Detection was possible but height sizing was
difficult or impossible due to the defect being masked by the dead zone (LW)].
Figure 19: TOFD signal of small defect on the bottom suface. [Detection was possible but height sizing was
difficult to interpret].
Data Error

International Journal of Recent Engineering Research and Development (IJRERD)
ISSN: 2455-8761
www.ijrerd.com || Volume 04 – Issue 04 || April 2019 || PP. 21-38
34 | P a g e www.ijrerd.com
Model 3.
4.4 Comparison of detection and height sizing ability for planar defects.
Figure 20: TOFD and PAUT could detect all defects, thus TOFD was not blinded for small defects high below
5 mm. however height sizing by TOFD was limited for some small defects. [defects high as (1) 1.37 mm, (2)
2.8 mm, (3) 4.02 mm, (4) 5.9 mm, (5) 9.67 mm repectivly and (6) 4 mm (trasverse flaw)].
Table 4: Under surface defects [Standard Deviation: tip back diffraction ±0.2 mm and TOFD ±0.12 mm].
No. Designed
flaw height
(mm)
Actual
flaw
height(2)
(mm)
Mean height
[5 repeated scans]
(mm)
Mean error (%) Different
[Individual max. or
min. height – actual
height] (mm)
PAUT(1) TOFD PAUT TOFD PAUT TOFD
1 1.5 1.37(3) detected 1.38 - 1% - -0.11
2 2.5 1.5 1.75 1.53 17% 2% 0.47 0.11
3 4 1.98 2.01 1.91 2% -4% 0.20 -0.13
4 6 4.56 4.23 4.71 -7% 3% -0.35 0.38
5 10 9.56 9.27 9.42 -3% -1.5% -0.43 -0.30
International Journal of Recent Engineering Research and Development (IJRERD)
ISSN: 2455-8761
www.ijrerd.com || Volume 04 – Issue 04 || April 2019 || PP. 21-38
35 | P a g e www.ijrerd.com
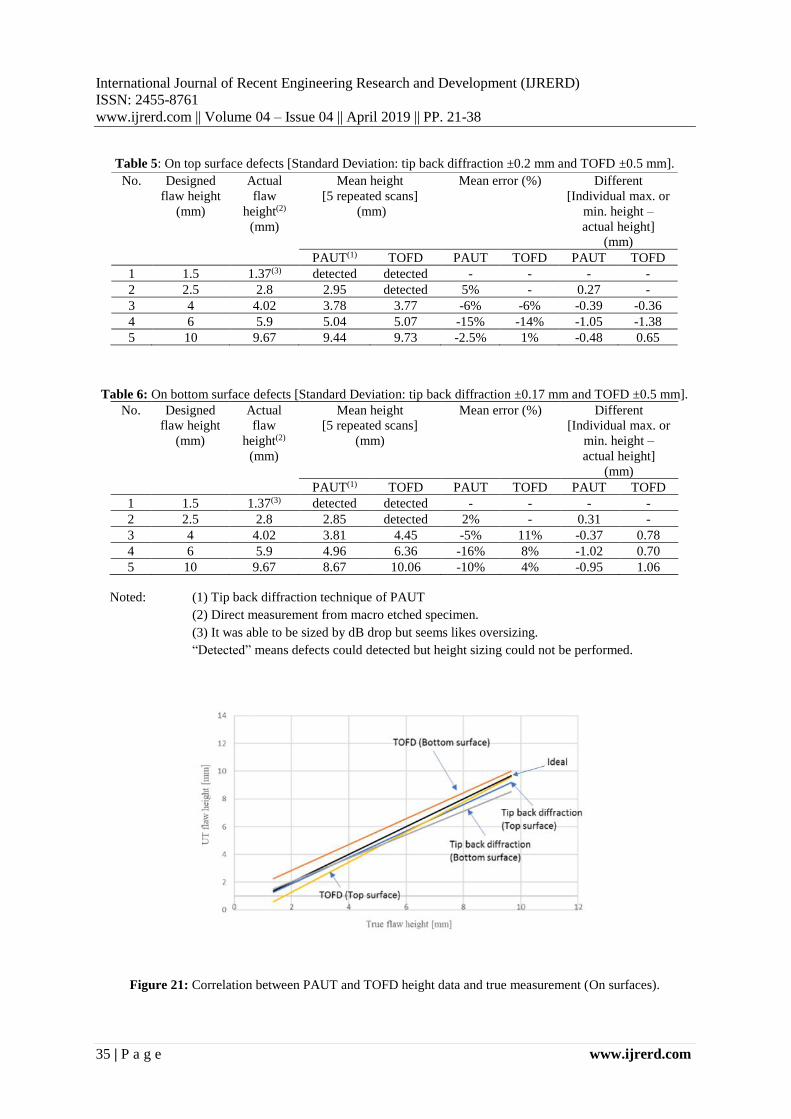
Table 5: On top surface defects [Standard Deviation: tip back diffraction ±0.2 mm and TOFD ±0.5 mm].
Table 6: On bottom surface defects [Standard Deviation: tip back diffraction ±0.17 mm and TOFD ±0.5 mm].
Figure 21: Correlation between PAUT and TOFD height data and true measurement (On surfaces).
No. Designed
flaw height
(mm)
Actual
flaw
height(2)
(mm)
Mean height
[5 repeated scans]
(mm)
Mean error (%) Different
[Individual max. or
min. height –
actual height]
(mm)
PAUT(1) TOFD PAUT TOFD PAUT TOFD
1 1.5 1.37(3) detected detected - - - -
2 2.5 2.8 2.95 detected 5% - 0.27 -
3 4 4.02 3.78 3.77 -6% -6% -0.39 -0.36
4 6 5.9 5.04 5.07 -15% -14% -1.05 -1.38
5 10 9.67 9.44 9.73 -2.5% 1% -0.48 0.65
No. Designed
flaw height
(mm)
Actual
flaw
height(2)
(mm)
Mean height
[5 repeated scans]
(mm)
Mean error (%) Different
[Individual max. or
min. height –
actual height]
(mm)
PAUT(1) TOFD PAUT TOFD PAUT TOFD
1 1.5 1.37(3) detected detected - - - -
2 2.5 2.8 2.85 detected 2% - 0.31 -
3 4 4.02 3.81 4.45 -5% 11% -0.37 0.78
4 6 5.9 4.96 6.36 -16% 8% -1.02 0.70
5 10 9.67 8.67 10.06 -10% 4% -0.95 1.06
Noted: (1) Tip back diffraction technique of PAUT
(2) Direct measurement from macro etched specimen.
(3) It was able to be sized by dB drop but seems likes oversizing.
“Detected” means defects could detected but height sizing could not be performed.
International Journal of Recent Engineering Research and Development (IJRERD)
ISSN: 2455-8761
www.ijrerd.com || Volume 04 – Issue 04 || April 2019 || PP. 21-38
36 | P a g e www.ijrerd.com
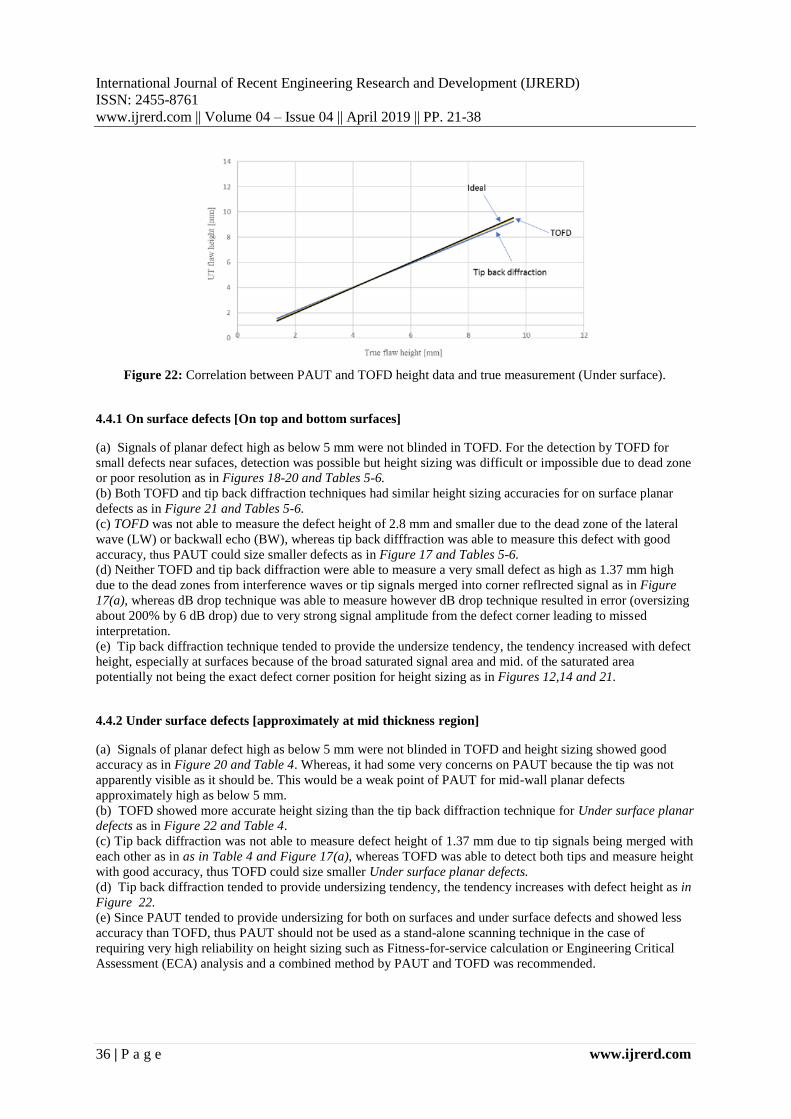
Figure 22: Correlation between PAUT and TOFD height data and true measurement (Under surface).
4.4.1 On surface defects [On top and bottom surfaces]
(a) Signals of planar defect high as below 5 mm were not blinded in TOFD. For the detection by TOFD for
small defects near sufaces, detection was possible but height sizing was difficult or impossible due to dead zone
or poor resolution as in Figures 18-20 and Tables 5-6.
(b) Both TOFD and tip back diffraction techniques had similar height sizing accuracies for on surface planar
defects as in Figure 21 and Tables 5-6.
(c) TOFD was not able to measure the defect height of 2.8 mm and smaller due to the dead zone of the lateral
wave (LW) or backwall echo (BW), whereas tip back difffraction was able to measure this defect with good
accuracy, thus PAUT could size smaller defects as in Figure 17 and Tables 5-6.
(d) Neither TOFD and tip back diffraction were able to measure a very small defect as high as 1.37 mm high
due to the dead zones from interference waves or tip signals merged into corner reflrected signal as in Figure
17(a), whereas dB drop technique was able to measure however dB drop technique resulted in error (oversizing
about 200% by 6 dB drop) due to very strong signal amplitude from the defect corner leading to missed
interpretation.
(e) Tip back diffraction technique tended to provide the undersize tendency, the tendency increased with defect
height, especially at surfaces because of the broad saturated signal area and mid. of the saturated area
potentially not being the exact defect corner position for height sizing as in Figures 12,14 and 21.
4.4.2 Under surface defects [approximately at mid thickness region]
(a) Signals of planar defect high as below 5 mm were not blinded in TOFD and height sizing showed good
accuracy as in Figure 20 and Table 4. Whereas, it had some very concerns on PAUT because the tip was not
apparently visible as it should be. This would be a weak point of PAUT for mid-wall planar defects
approximately high as below 5 mm.
(b) TOFD showed more accurate height sizing than the tip back diffraction technique for Under surface planar
defects as in Figure 22 and Table 4.
(c) Tip back diffraction was not able to measure defect height of 1.37 mm due to tip signals being merged with
each other as in as in Table 4 and Figure 17(a), whereas TOFD was able to detect both tips and measure height
with good accuracy, thus TOFD could size smaller Under surface planar defects.
(d) Tip back diffraction tended to provide undersizing tendency, the tendency increases with defect height as in
Figure 22.
(e) Since PAUT tended to provide undersizing for both on surfaces and under surface defects and showed less
accuracy than TOFD, thus PAUT should not be used as a stand-alone scanning technique in the case of
requiring very high reliability on height sizing such as Fitness-for-service calculation or Engineering Critical
Assessment (ECA) analysis and a combined method by PAUT and TOFD was recommended.
International Journal of Recent Engineering Research and Development (IJRERD)
ISSN: 2455-8761
www.ijrerd.com || Volume 04 – Issue 04 || April 2019 || PP. 21-38
37 | P a g e www.ijrerd.com
5. Conclusions
5.1 TOFD is better technique than PAUT for height sizing of Small under surface planar defects. TOFD also
can size smaller defect.
5.2 Planar defects which of size below than 5 mm are not blind and could be detected in both TOFD and PAUT
techniques. For Under surface defects, TOFD exhibits good detection and accurate height sizing whereas it
shows some very concerns on detection in the case of PAUT because the tip is not apparently visible as it
should be. Therefore, it could be easily misinterpreted on the height sizing.
5.3 TOFD and tip back diffraction techniques show similar height sizing accuracies for on surface planar
defects.
5.4 Tip back diffraction technique could size smaller on surface planar defects with good accuracy, so PAUT is
better than TOFD for height sizing of small on surface planar defects.
5.5 Tip back diffraction technique tends to provide the undersizing tendency, especially defects on surfaces
because of the broad saturated signal area and the middle of the saturated area potential not being the exact
defect corner position causing height sizing is difficult to interpret. The undersizing tendency increases with
defect height.
5.6 PAUT shall not be used as a stand-alone scanning technique in the case of requiring high reliability on
height sizing such as Fitness-for-service calculation or Engineering Critical Assessment (ECA) analysis. A
combined method by PAUT and TOFD is recommended.
5.7 TOFD shall be not suitable as a stand-alone fast scanning technique or in replacing the PAUT method.
TOFD should be used as a confirmation method for known cracks or crack growth monitoring.
5.8 Planar defect height sizing by ultrasonics (UT) requires special skills and suitable equipment performance
with experienced personnel. Therefore, procedure, equipment performance and personnel skills must be
demonstrated before starting a job.
References
[1] R. Molica N, D. Cerniglia, P. Lombardo, S. Pecoraro, A. Infantino, “Detection characterization and sizing
of hydrogen induce cracking in pressure vessel using phase array ultrasonic data processing”, 21 st
European Conference on Fracture, ECF21, Catania, Italy, pp. 581-588, 2016.
[2] K. Pandey, R. “Analysis of cracking in LPG Horton spherical vessel”. Engineering Failure Analysis -
ENG FAIL ANAL 12, pp. 376-386, 2005.
[3] M .A .Khattak, A .Mukhtar and K .Azam Khan, “Common Root Causes of Pressure Vessel Failures”,
Journal of Advanced Research in Applied Mechanics ISSN (online): 2289-7895 | Vol. 21, No. 1, pp. 22-
37, 2016.
[4] American Petroleum Institute (API), “Brittle Fracture”, API RP 571 Damage Mechanisms Affecting Fixed
Equipment in the Refining Industry, 2011.
[5] American Petroleum Institute (API), “Hydrogen Embrittlement (HE)”, API RP 571 Damage Mechanisms
Affecting Fixed Equipment in the Refining Industry, 2011.
[6] DEP Specification, “UT in leu of RT for Code Construction of Pressure Equipment” DEP 31.22.00.12 –
Gen, Shell Group Companies, 2017.
[7] American Society of Mechanical Engineer, ASME Section VIII Div. 1&2, The American Society of
Mechanical Engineers, USA, 2017.
[8] Notification of the Ministry of Energy (No. 135/33), Thailand, B.E. 2560, 2017.
[9] American Society of Mechanical Engineer, “ASME Section V Nondestructive Testing Article 4-
Ultrasonic Testing Method for Welds”, he American Society of Mechanical Engineers (ASME), USA,
2017.
[10] Anmol Birring, “Fracture Mechanics – based Acceptance Criteria and Discontinuity Sizing with Phase
Array”, Material Evaluation , Vol.76 , No.9, ASNT, pp. 1173-1176, 2018.
[11] Anmol Birring, “Sizing Discontinuities by Ultrasonics”, Material Evaluation, Vol.68, No.11 ASNT, pp
1208-1215, 2010.
[12] M. Moles, “Accurate Defect Sizing using Phased Array and Signal Processing”, Olympus NDT, Canada;
L. Wesley, T. Sinclair, University of Toronto, 2009.
International Journal of Recent Engineering Research and Development (IJRERD)
ISSN: 2455-8761
www.ijrerd.com || Volume 04 – Issue 04 || April 2019 || PP. 21-38
38 | P a g e www.ijrerd.com
[13] Olympus NDT, “Advances in Phased Array Ultrasonic Technology Applications,” Olympus NDT,
January 2007.
[14] Olympus NDT, “Introduction to Phased Array Ultrasonic Technology and Application” Olympus NDT
R/D Tech, 2010.
[15] J.M. Farley, N.S. Goujon, B.W.O. Shepherd, “CRITICAL EVALUATION OF TOFD FOR SEARCH
SCANNING”, Mitsui Babcock, Renfrew, UK, 2004.
[16] Kim Young-Gil and associates, “Practical Application of Tip Diffraction to Crack Sizing”, 12th A-PCNDT
2006- Asia- Pacific Conderfernce on NDT, Auckland, New Zealand, 2006.
[17] A. Golshami ekhlas, E. Ginzel, M. Sorouri, “Sizing and evaluation of planar defects based on Surface
Diffracted Signal Loss Technique by ultrasonic phase array”, Material Research Institute, Waterloo,
Ontario, Canada, pp. 1-9, 2017.
[18] Michael MOLES and Simon LABBE, “A Completed Solution for Weld Inspection – Phase Arrays and
Diffraction Sizing”, ASNT Fall Conference and Quality Testing Show 2007, pp. 228-234, 2007.
[19] Lester W. Schmerr and Associates “Ultrasonic Flaw Sizing – An Overview”, Research Journal of Applied
Sciences, Engineering and Technology 4(24): pp. 5525-5533, 2012.
[20] Sony Baby, T. Balasubramanian, R. J. Pardikar, M. Palaniappan & R. Subbaratnam, “Time of Flight
Diffraction (TOFD) Technique for Accurate Sizing of Surface Breaking Cracks”, Department of Physics,
Reginal Engineering College, Tiruchirappalli, India, 2002.
[21] Mustafa Gonulal, “Is TOFD Blind for ID and OD Surface?”, 25th ASNT Research Symposium
Summaries and Abstracts, pp. 58-62, 2016.
[22] K. Manjula, K. Vijayarekha, B. Venkatraman and Durga Karthik, “Ultrasonic Time of Flight Diffraction
Technique for Weld Defects: A Review”, Research Journal of Applied Sciences, Engineering and
Technology 4(24), pp. 5525-5533, 2012.
[23] Jirapong kasivitamnuay , “Fracture Mechanic” , Bangkok: Faculty of Engineering Chulalongkorn
University, 2010.
[24] Asa Prateepasen, “Non-destructive Testing in Welds and Researches”, Revised edition, 2011.
[25] BS EN 583-6, “Time-of-flight diffraction technique as a method for detection and sizing of
discontinuities”, Non-destructive testing, Ultrasonic examination, 2008.
[26] G. Nardoni, M. Certo, P. Nardoni, M. Feroldi , D. Nardoni, “ Experimental determination of
discrimination criteria between volumetric and plana defects by means of ultrasonic pulse echo/ phase
array technique based on the ratio of diffracted echoes in welding examination” , 18th World Conference
on Nondestructive Testing, 2012.
[27] G. Nardoni, M. Certo, P. Nardoni, M. Feroldi , D. Nardoni, “ Sizing the height of discontinuities, their
characterization in planar / volumetric by phase array technique based on diffraction echoes”, MINDTCE
09: Malaysia International NDT Conference and Exhibition, 2009. [28] N S Goujon, “Safety implications of TOFD for in-manufacture inspections”, MitsuiBabcock Energy Limited
for the Health and Safety Executive, (RESEARCH REPORT 433), pp. 55, 2006.


![VERN OM LIVET - menneskeverd.no€¦ · t 63c?d055 63c?d055 . . /01023450)63127084) >010d)@5)205)7jd)?1@440?) >0d)ib)5x20=3b0d0)i>) 4i1?04c01?010)@c)@7id5e (05)0d)?])c3453b)@5)205)0d)1i01)?i>)?0d)>0110?4010](https://img.dokumen.tips/doc/110x75/5f62eabbb1a4a1200247e2de/vern-om-livet-t-63cd055-63cd055-0102345063127084-010d52057jd1440.jpg)


