Embed Size (px)
Citation preview

This article was downloaded by: [McGill University Library]On: 02 October 2014, At: 14:22Publisher: Taylor & FrancisInforma Ltd Registered in England and Wales Registered Number: 1072954 Registeredoffice: Mortimer House, 37-41 Mortimer Street, London W1T 3JH, UK
Road Materials and Pavement DesignPublication details, including instructions for authors andsubscription information:http://www.tandfonline.com/loi/trmp20
Comparison of conventional, polymer,and rubber asphalt mixtures usingviscoelastic continuum damage modelWaleed A. Zeiadaab, B. Shane Underwooda, Tina Pourshamsc,Jeffrey Stempiharc & Kamil E. Kalousha
a Department of Civil and Environmental Engineering, ArizonaState University, PO Box 875306, Tempe, AZ 85287-5306, USAb Civil Engineering Department, Mansoura University, Egyptc Arizona Department of Transportation, 1221 N. 21st Ave,Phoenix, AZ 85009, USAPublished online: 08 May 2014.
To cite this article: Waleed A. Zeiada, B. Shane Underwood, Tina Pourshams, Jeffrey Stempihar &Kamil E. Kaloush (2014) Comparison of conventional, polymer, and rubber asphalt mixtures usingviscoelastic continuum damage model, Road Materials and Pavement Design, 15:3, 588-605, DOI:10.1080/14680629.2014.914965
To link to this article: http://dx.doi.org/10.1080/14680629.2014.914965
PLEASE SCROLL DOWN FOR ARTICLE
Taylor & Francis makes every effort to ensure the accuracy of all the information (the“Content”) contained in the publications on our platform. However, Taylor & Francis,our agents, and our licensors make no representations or warranties whatsoever as tothe accuracy, completeness, or suitability for any purpose of the Content. Any opinionsand views expressed in this publication are the opinions and views of the authors,and are not the views of or endorsed by Taylor & Francis. The accuracy of the Contentshould not be relied upon and should be independently verified with primary sourcesof information. Taylor and Francis shall not be liable for any losses, actions, claims,proceedings, demands, costs, expenses, damages, and other liabilities whatsoever orhowsoever caused arising directly or indirectly in connection with, in relation to or arisingout of the use of the Content.
This article may be used for research, teaching, and private study purposes. Anysubstantial or systematic reproduction, redistribution, reselling, loan, sub-licensing,systematic supply, or distribution in any form to anyone is expressly forbidden. Terms &

Conditions of access and use can be found at http://www.tandfonline.com/page/terms-and-conditions
Dow
nloa
ded
by [
McG
ill U
nive
rsity
Lib
rary
] at
14:
22 0
2 O
ctob
er 2
014
Road Materials and Pavement Design, 2014Vol. 15, No. 3, 588–605, http://dx.doi.org/10.1080/14680629.2014.914965
Comparison of conventional, polymer, and rubber asphalt mixtures usingviscoelastic continuum damage model
Waleed A. Zeiadaa,b∗, B. Shane Underwooda, Tina Pourshamsc, Jeffrey Stempiharc
and Kamil E. Kalousha
aDepartment of Civil and Environmental Engineering, Arizona State University, PO Box 875306, Tempe,AZ 85287-5306, USA; bCivil Engineering Department, Mansoura University, Egypt; cArizona Departmentof Transportation, 1221 N. 21st Ave, Phoenix, AZ 85009, USA
(Received 4 June 2013; accepted 9 April 2014 )
In this study, a laboratory experimental programme was conducted to compare the materialproperties and fatigue performance characteristics for reference, polymer-modified and rubber-modified gap-graded mixtures. These mixtures were placed on E18 highway between theinterchanges Järva Krog and Bergshamra in the Stockholm area of Sweden. The advancedmaterial characterisation tests included dynamic (complex) modulus for stiffness evaluationand the uniaxial tension–compression for fatigue assessment. The data were used to comparethe performance of the rubber-modified gap-graded mixture to the reference and polymer-modified gap mixtures using the viscoelastic continuum damage (VECD) approach. Differentresearchers have successfully applied the VECD model to describe the fatigue behaviour ofasphalt concrete mixtures. The damage characteristic (C–S) curves were established for eachof the three mixtures. The fatigue behaviour for the three mixtures was ranked based on theC–S curve results and the rubber-modified mixture showed the best fatigue damage resistancefollowed by the polymer-modified and reference mixtures. The VECD approach providesa more comprehensive analysis to evaluate fatigue resistance compared with the traditionalfatigue evaluation using a number of cycles at a given stiffness reduction.
Keywords: fatigue; rubber-modified; polymer-modified; dynamic modulus; viscoelasticcontinuum damage
1. IntroductionLoad-associated fatigue cracking is considered to be one of the most significant distress modes inflexible pavements besides thermal cracking and rutting. The action of repeated loading, causedby traffic-induced tensile and shear stresses in the bound layers, will eventually lead to a loss inthe structural integrity of a stabilised layer material. Fatigue cracking is a progressive distressand can be distinguished into three different stages. An early stage of fatigue cracking consistsof intermittent longitudinal wheel path cracks. An intermediate stage of fatigue cracking calledalligator cracking because the cracking pattern resembles an alligator’s skin. In some extremecases, the final stage of fatigue cracking is disintegration when potholes form.
Different test methodologies have been developed over the past few decades for measuring thefatigue behaviour of asphalt concrete mixtures. One of the most popular fatigue testing methodsis the flexural beam fatigue to measure the fatigue life of a compacted asphalt beam subjected to
∗Corresponding author. Emails: [email protected]; [email protected]
© 2014 Taylor & Francis
Dow
nloa
ded
by [
McG
ill U
nive
rsity
Lib
rary
] at
14:
22 0
2 O
ctob
er 2
014

Road Materials and Pavement Design 589
a repeated flexural bending. The AASHTO T-321 is the standard procedure for the beam fatiguetest (American Association of State Highway and Transportation Officials [AASHTO], 2008).Other fatigue tests have been developed, such as diametral (Roque & Buttlar, 1992), cantileverrotating beam (Pell & Hanson, 1973), trapezoidal fatigue (Van Dijk, 1975), direct tension ortension–compression (Raithby & Ramshaw, 1972) tests. The prediction quality of the fatigue lifeusing any of these test methods will depend on how exactly the method simulates the condition ofloading, support, stress state and environment. Moreover, selecting any of these test methods canbe influenced by the availability and cost of the equipment, in addition to ease of use (Tangella,Craus, Deacon, & Monismith, 1990).
In general, there are two main approaches that can be utilised to characterise the fatiguebehaviour of asphalt concrete mixtures: phenomenological and mechanistic. The phenomeno-logical approach usually relates the stress or strains in the hot mix asphalt layer to the number ofload repetitions that cause failure (Strategic Highway Research Program [SHRP], 1994). A mech-anistic approach is inherently more complex than the former but it is more widely accepted becauseit uses material properties based on stress–strain relationships. The mechanistic approach can beimplemented through dissipated energy (Carpenter & Shen, 2005; Van Dijk & Visser, 1977),fracture mechanics (Jacobs, Hopman & Molenaar, 1996; Majidzadeh, Kauffmann & Ramsamooj,1971) or continuum damage mechanics (CDM) (Chehab, Kim, Schapery, Witczak & Bonaquist,2002; Christensen & Bonaquist, 2005; Daniel & Kim, 2002; Kim, Lee & Little, 1997a; Kim &Little, 1990; Kutay, Gibson & Youtcheff, 2008; Mun, Chehab & Kim, 2007; Park, Kim &Schapery, 1996; Underwood, Kim & Guddati, 2010; Zhang, Sabouri, Guaddati & Kim, 2013).
A CDM approach was developed through research efforts at North Carolina State University andTexas A&M University. This approach utilises the viscoelastic correspondence principle and workpotential theory (WPT) described by Schapery (1984) to remove viscous effects in monitoringchanges in pseudo-stiffness in repeated uniaxial tensile tests. Therefore, physical variables werereplaced by pseudo-variables based on the extended elastic–viscoelastic correspondence principleto transform a viscoelastic (linear and/or nonlinear) problem to an elastic case. In 1990–1991,Schapery (1990, 1991) developed a series of damage models for elastic and viscoelastic mediabased on thermodynamics of irreversible process and work potential theories with internal statevariable to describe the evolution of micro-structural changes.
The Swedish Transport Administration, Trafikverket, has aggressively utilised asphalt-rubbermixtures on highways within Sweden to mitigate pavement distresses, such as fatigue cracking(Kaloush, Biligiri, Zeiada, Rodezno & Souliman, 2008). However, the majority of the rubber-modified pavement sections have been tested and evaluated mainly for noise and rolling resistance(Nordgren & Preinfalk, 2009). To date, adequate information regarding fatigue behaviour of theSwedish rubber-modified mixtures pertinent to its regional climatic conditions is not available.
In 2009, Arizona State University (ASU) and Trafikverket engaged in a joint effort to understandthe fundamental materials properties of the different gap-graded, unmodified and modified mix-tures placed on the E18 highway in the Stockholm area of Sweden (Kaloush et al., 2008, 2010). Aspart of this project, advanced mixture material characterisation tests were performed that includedrutting evaluation, fatigue and thermal cracking evaluation, and crack propagation phenomenonassessment. The test results and analysis of the advanced characterisation tests are presented inanother paper submitted to the 2012 asphalt-rubber conference (Kaloush et al., 2012). In 2012,the uniaxial tension–compression test was added to further evaluate fatigue damage utilising theviscoelastic and continuum damage model.
This paper presents results of the fatigue evaluation of the reference, polymer-modified andasphalt-rubber, gap-graded asphalt mixtures placed on the E18 highway in the Stockholm area ofSweden. The uniaxial tension–compression test was used along with the simplified viscoelasticcontinuum damage model (S-VECD) to evaluate resistance to fatigue damage. Substantial work
Dow
nloa
ded
by [
McG
ill U
nive
rsity
Lib
rary
] at
14:
22 0
2 O
ctob
er 2
014

590 W.A. Zeiada et al.
has been carried out elsewhere for the development of this model, and it is not the purpose ofthis paper to simply recreate what has been done elsewhere (Chehab et al., 2002; Daniel & Kim,2002; Kim et al., 1997a; Kim & Little, 1990; Park et al., 1996; Underwood, Kim & Guddati,2006; Underwood et al., 2010). Here, and for the first time, this approach is used to quantitativelycompare three alternative mixtures (asphalt-rubber, polymer-modified asphalt and a conventionalgap-graded mix) that are considered for placement on an in-service roadway. In addition, thework presented in this paper includes an experimental method involving the use of on-specimen,strain-controlled fatigue loading, which has heretofore not been used with respect to the S-VECDformulation.
2. ObjectiveThe main objective of this study was to compare fatigue behaviour of gap-graded mixtures;reference, polymer-modified and rubber-modified placed in the Stockholm area of Sweden usingthe viscoelastic and continuum damage model.
3. VECD model backgroundContinuum damage theories ignore specific micro-scale behaviours and instead characterise amaterial using macro-scale observations. The viscoelastic continuum damage (VECD) modelconsists of three concepts:
(1) The elastic–viscoelastic correspondence principle;(2) The CDM-based WPT and(3) The temperature–time superposition principle.
Schapery (1984) proposed the extended elastic–viscoelastic correspondence principle (CP), whichcan be applicable to both linear and nonlinear viscoelastic materials (Schapery, 1984). Schaperysuggested that constitutive equations for certain viscoelastic media are identical to those for theelastic cases, but stresses and strains are not necessarily physical quantities in the viscoelastic body.Instead, they are pseudo-variables in the form of convolution integrals. The uniaxial pseudo-strain(εR) is defined according to Equation (1).
εR = 1ER
∫ t
0E(t − τ)
dε
dτdτ , (1)
where ER is the reference modulus; E(t) the relaxation modulus and creep compliance, respec-tively; t the elapsed time from specimen fabrication and time of interest; τ the time when loadingbegan and ε the measured strain.
Schapery (1990) applied the method of thermodynamics of irreversible processes and theobserved phenomenon of path independence of work in damage-inducing processes to develop theWPT to describe the mechanical behaviour of elastic composite materials with growing damage(Schapery, 1990). The theory is general enough to allow for strong nonlinearities and to describea variety of mechanisms including micro- and macro-crack growth in monolithic and compositematerials. Three fundamental elements comprise the WPT: the pseudo-strain energy density func-tion (Equation (2)), the stress–pseudo-strain relationship (Equation (3)) and the damage evolutionlaw (Equation (4)).
W R = f (εR, S), (2)
Dow
nloa
ded
by [
McG
ill U
nive
rsity
Lib
rary
] at
14:
22 0
2 O
ctob
er 2
014

Road Materials and Pavement Design 591
σ = ∂W R
∂εR, (3)
dSdt
=(
−∂W R
∂S
)α
. (4)
The WPT specifies an internal state variable (S) to quantify damage, which is defined as any micro-structure changes that result in stiffness reduction. Kim, Lee and Little (1997b) characterised thegrowing damage for a controlled-strain testing mode through the following constitutive equations(Equations (5) and (6)) (Kim et al., 1997b):
W R = 12 C(S)(εR)2, (5)
σ = IC(S)εR, (6)
where I is the initial pseudo-stiffness, and C is the normalised pseudo-stiffness by dividing thepseudo-stiffness by I . Daniel and Kim (2002) developed a simplified numerical model to calculateS from measured data as a function of time, as shown in Equation (7) (Daniel & Kim, 2002).
S(t) =N∑
i=1
[− I
2(Ci − Ci−1)(ε
R)2]α/(1+α)
(ti − ti−1)1/(1+α). (7)
Chehab et al. (2002) and Underwood et al. (2006) verified that the time–temperature superpositionprinciple at high levels of damage is equally significant (Chehab et al., 2002; Underwood et al.,2006). Based on this validation, Equation (7) can be modified to produce Equation (8).
S(ξ) =N∑
i=1
[− I
2(Ci − Ci−1)(ε
R)2]α/(1+α)
(ξi − ξi−1)1/(1+α), (8)
where ξ is the reduced time. Equations (7) or (8) can also be written in the following form:
Si+1 = Si +[− I
2(Ci − Ci−1)(ε
R)2]α/(1+α)
�ξ1/(1+α)i . (9)
Underwood et al. (2010) developed a simplified VECD modelling technique based on the analy-sis of cyclic data. This method allows for the prediction of the fatigue life of asphalt concrete atvarious strain–stress amplitudes under different temperatures using the dynamic modulus mastercurve and the cyclic fatigue data from a single temperature and single stress or strain ampli-tude (Christensen & Bonaquist, 2005). The proposed S-function takes on the form shown inEquation (10).
SN+1 = SN +[−DMR
2(CN − CN−1)(ε
R)2]α/(1+α)
(�ξi)1/(1+α)(K1)
1/(1+α), (10)
where DMR is the Dynamic Modulus Ratio = |E∗|fp/|E∗|LVE; |E∗|fp is the fingerprint (FP) mod-ulus, and |E∗|LVE is the linear viscoelastic modulus; �ξ i the change in the average reduced timebetween analysis cycles; K1 the developed functional parameter to account for the analysis ofcyclic data.
Dow
nloa
ded
by [
McG
ill U
nive
rsity
Lib
rary
] at
14:
22 0
2 O
ctob
er 2
014

592 W.A. Zeiada et al.
Also as part of this simplification the definition of normalised pseudo-stiffness was found to bedependent upon the DMR value, as indicated by Equation (11).
CN = σN
εRN × DMR
. (11)
The parameter α is believed to be a material property. It was recommended to correlate α to theslope, m in the central part of the dynamic modulus master curve for the log E(t) − log(t) rela-tionship, where α = 1/m for the stress-controlled tests and α = 1/m + 1 for the cross-head straintests (Kim et al., 1997b). The C–S curve is a unique relationship for each mixture where all the dif-ferent curves for tests conducted at different strain levels, temperatures, stress or strain-controlled,and monotonic or dynamic are supposed to collapse on only one curve named the damage char-acteristic (C–S) curve. In the analysis presented in this paper, the characterisation process wascarried out using cyclic repeated on-specimen strain-controlled experiments. The test method isdescribed in Section 5, whereas the characterisation process is briefly outlined in Section 6. TheC–S relationship can be also fitted to an analytical form represented by Equation (12), where C1and C2 are regression coefficients (Lee, 1996):
C(S) = 1 − C1(S)C2 . (12)
4. Description of the project, mixtures and specimen preparationThe test sections constructed as part of this project include: a reference mixture (ABS 16 70/100),a polymer-modified mixture (ABS 16 Nypol 50/100-75) and a rubber-modified mixture (Gap 16).Figure 1 shows the section of E18 where the project was constructed along with a schematic testsection layout. The polymer-modified mixture contained 3–6% polymer and the rubber-modifiedmixture contained approximately 20% ground tyre rubber. Base bitumen was Pen 70/100 andall mixture designs were accomplished using the Marshall method. Air voids in the field for allthree mixtures were approximately 3% (Kaloush et al., 2010). Tables 1 and 2 display the mixturecharacteristics and gradation, respectively.
The three variants of asphalt gap-graded mixtures and the associated binders were sampled fromthe project sites during construction. At the ASU laboratories, cylindrical gyratory samples werecompacted for both dynamic modulus and uniaxial tension–compression fatigue test. Two differentspecimen geometries were manufactured for each test. For the dynamic modulus test, gyratory
Figure 1. Project location and schematic of test section layout (Kaloush et al., 2010).
Dow
nloa
ded
by [
McG
ill U
nive
rsity
Lib
rary
] at
14:
22 0
2 O
ctob
er 2
014

Road Materials and Pavement Design 593
Table 1. Field mixture characteristics, Stockholm test section.
Mix Binder content (%) Air voids (%) Max. theoretical density (Gmm)
Reference ABS 16 70/100 5.9 2.6 2.4642Polymer ABS 16 Nypol 50/100-75 5.9 2.6 2.4558Rubber GAP 16 8.7 2.4 2.3588
Table 2. Average aggregate gradations, Stockholm Highway.
Sieve size (mm) Reference-gap Polymer-modified Rubber-modified
Gradation (% passing bymass of each sieve)
22.4 100 100 100
16 98 98 9811.2 65 65 68
8 38 38 444 23 23 242 21 21 220.063 10.5 10.5 7.5
Figure 2. Specimen manufacturing for uniaxial tension–compression fatigue test.
plugs were compacted into 150 mm (6 in.) diameter and 170 mm (6.7 in.) tall specimens. Then, one100 mm (4 in.) diameter sample was cored from each gyratory plug. The sample ends were sawnto arrive at typical test specimens of 150 mm in height. For uniaxial tension–compression fatiguetest, the compaction height was increased to 180 mm (7.1 in.) and the final specimen dimensionswere 150 mm (6 in.) height and 75 mm (3 in.) in diameter. Figure 2 shows cored specimens forthe uniaxial tension–compression fatigue test. The main reason to increase the compaction heightwas to allow for larger end cuts to produce a more homogeneous air void distribution, whichincreases the chances to have a middle failure in the uniaxial fatigue test.
During compaction of the uniaxial tension–compression test, a large difference in compactioneffort to achieve the target air void level was noticed between mixture types. The reference mixturerequired approximately 500 gyrations followed by the polymer-modified (∼ 160 gyrations) andthe rubber-modified (∼ 12 gyrations). This trend is reasonable given the higher binder contentof the rubber-modified mixture. However, the lower compaction effort required for the rubber-modified mixtures may influence fatigue behaviour, as discussed in a later section of this paper.
Dow
nloa
ded
by [
McG
ill U
nive
rsity
Lib
rary
] at
14:
22 0
2 O
ctob
er 2
014

594 W.A. Zeiada et al.
Figure 3. Specimen instrumentation and applied wave shape.
5. Test methods5.1. Dynamic modulus testThe dynamic modulus (|E∗|) test, per AASHTO TP 62-07 (2007) was performed in the laboratoryat five temperatures −10, 4.4, 21.1, 37.8 and 54.4◦C (14, 40, 70, 100 and 130◦F) and six loadfrequencies: 25, 10, 5, 1, 0.5 and 0.1 Hz. The stress levels were varied with the frequency tokeep the specimen response within a linear viscoelastic limit (recoverable micro-strain below 150micro-strain). The test parameter values, dynamic modulus and phase angle, were measured atdifferent temperatures and frequencies. The average dynamic modulus and phase angle valueswere summarised based on three replicates for each mixture. Figure 3 shows a typical instrumentedtest specimens and the applied wave shape.
5.2. Uniaxial tension–compression testThe first step prior to running the test included gluing end plates to the specimen using thejig, as shown in Figure 4. The applied glue is Devcon plastic steel 5 min epoxy putty. The testspecimen was then instrumented with three Linear Variable Differential Transformers (LVDTs) tomonitor material response. The uniaxial tension–compression fatigue test is conducted to evaluatethe fatigue damage of the Swedish gap-graded mixtures using the viscoelastic and continuumdamage model. A servo hydraulic testing machine was used to load the specimens under an on-specimen strain-control mode of loading. A dynamic sinusoidal strain (continuous wave) wasapplied. The test software is capable of achieving and maintaining the target on-specimen strainbased on the outputs from the three LVDTs by dynamically changing the actuator strain level tosolve the machine compliance issue. New software was developed for ASU by IPC (IndustrialProcess Control) company and is designated as UST032-v1.01b S-VECD fatigue test. The uniaxialtension–compression fatigue tests were conducted using two specimens from each mixture typewhere two different strain levels (low and high) were applied to each specimen. The uniaxialtension–compression fatigue test was run until the specimen reached 50% of its initial modulus.For a regular fatigue test, the initial modulus or stiffness is measured at cycle number 50. Inthis particular study, the initial modulus was measured at cycle number 100 as to allow enoughtime for the software to reach the target on-specimen strain. At each loading cycle, the softwarecalculates the modulus and phase angle plus the stress and strain values from the actuator and thethree LVDTs.
Dow
nloa
ded
by [
McG
ill U
nive
rsity
Lib
rary
] at
14:
22 0
2 O
ctob
er 2
014

Road Materials and Pavement Design 595
Figure 4. Specimen gluing via gluing jig.
6. Test results6.1. Dynamic modulus testThe |E∗| master curves were constructed for the three gap-graded mixtures. The shift factorsat different temperatures were first computed from the master curve of the storage modulus[E′ = |E∗| cos(φ), where φ is the phase angle in degrees] then the same values were used toconstruct the |E∗| and φ master curves. The main reason for this approach is that the storagemodulus considers both |E∗| and φ, which completely describe the material behaviour. In general,the shift factor function was modelled as a second-order polynomial (Equation (13)), while the|E∗| data at various temperatures were shifted with regard to a reference temperature of 21.1◦C(70◦F) with respect to frequency until the data merge into single smooth pattern that can bemathematically modelled by a sigmoidal function (Equation (14)).
log aT = α1T 2 + α2T + α3, (13)
Dow
nloa
ded
by [
McG
ill U
nive
rsity
Lib
rary
] at
14:
22 0
2 O
ctob
er 2
014
596 W.A. Zeiada et al.
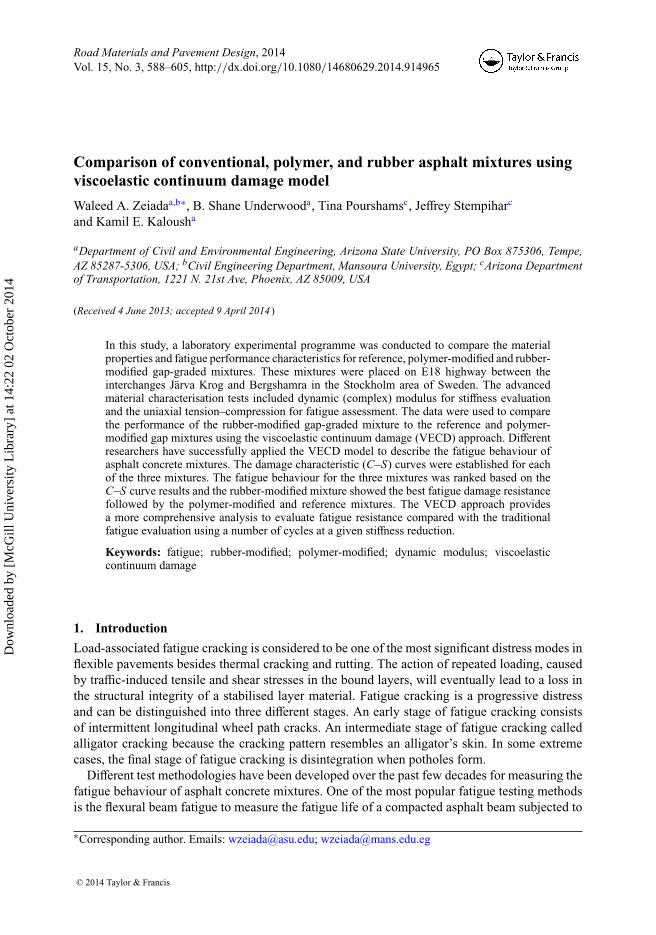
Figure 5. Dynamic modulus master curves of the Swedish gap-graded mixtures.
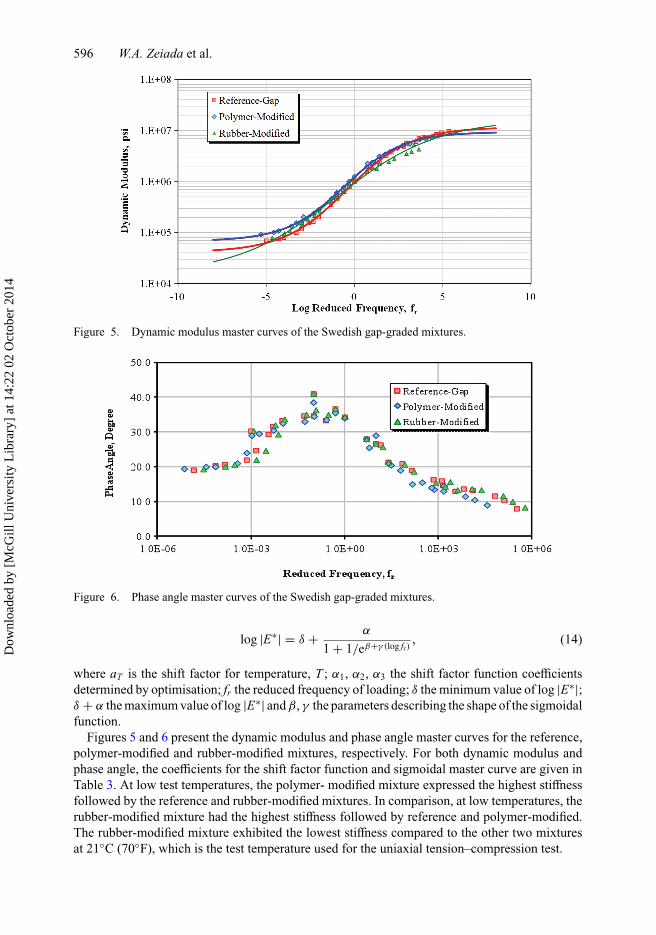
Figure 6. Phase angle master curves of the Swedish gap-graded mixtures.
log |E∗| = δ + α
1 + 1/eβ+γ (log fr), (14)
where aT is the shift factor for temperature, T ; α1, α2, α3 the shift factor function coefficientsdetermined by optimisation; fr the reduced frequency of loading; δ the minimum value of log |E∗|;δ + α the maximum value of log |E∗| and β, γ the parameters describing the shape of the sigmoidalfunction.
Figures 5 and 6 present the dynamic modulus and phase angle master curves for the reference,polymer-modified and rubber-modified mixtures, respectively. For both dynamic modulus andphase angle, the coefficients for the shift factor function and sigmoidal master curve are given inTable 3. At low test temperatures, the polymer- modified mixture expressed the highest stiffnessfollowed by the reference and rubber-modified mixtures. In comparison, at low temperatures, therubber-modified mixture had the highest stiffness followed by reference and polymer-modified.The rubber-modified mixture exhibited the lowest stiffness compared to the other two mixturesat 21◦C (70◦F), which is the test temperature used for the uniaxial tension–compression test.
Dow
nloa
ded
by [
McG
ill U
nive
rsity
Lib
rary
] at
14:
22 0
2 O
ctob
er 2
014

Road Materials and Pavement Design 597
Table 3. Summary of model coefficients.
|E∗| master curve Shift function Damage model
Mix type δ α β γ αx αy αz C1 C2 α
Reference-gap 5.466 2.453 0.234 0.538 0.00003 −0.1272 2.673 0.0013 0.516 3.93Polymer-modified 5.664 2.134 0.230 0.604 −0.00043 −0.0952 2.441 0.0034 0.435 4.09Rubber-modified 4.941 3.124 0.222 0.331 0.00055 −0.1541 3.553 0.0043 0.421 4.85
Table 4. FP modulus and uniaxial fatigue test results.
Strain FP Machine Initial CyclesMixture Specimen Air level modulus compliance stiffness Initial totype ID voids (%) (μs) (MPa) e factor (MPa) φ failure
Reference-gap SWC03 3.65 250 10,978 6.78 8609 25.3 131,830SWC02 3.82 300 10,310 6.45 7435 28.6 11,030
Polymer-modified SWP05 3.55 300 8479 5.08 6707 21.8 138,570SWP06 3.65 400 8913 5.43 6214 24.1 28,620
Rubber-modified SWR04 2.81 300 6710 4.45 5296 24.9 126,380SWR06 3.11 400 7123 4.63 5134 25.5 27,200
It can be observed from Figure 6 that the phase angle increases with decreasing reduced fre-quency till a certain point where it starts to decrease. This can be explained that at low temperatureand high loading frequency, the asphalt binder dominates the behaviour of asphalt mixtures andthe mixture is more elastic resulting in a reduced phase angle. By increasing temperature ordecreasing loading frequency, the asphalt mixture becomes more viscous as the binder becomessofter, and thus phase angle increases. This trend is observed until a point when the asphalt binderbecomes very soft and the aggregates dominate the behaviour of asphalt mixture. At this point,the asphalt mixture exhibits more elastic behaviour resulting in a decrease in phase angle.
6.2. Uniaxial tension–compression testDuring this experiment, a cylindrical asphalt concrete undergoes a controlled on-specimen straincyclic loading until the failure point. The applied stress and on-specimen axial strains are mea-sured. These values are used to calculate the pseudo-strain, Equation (1), and pseudo-secantmodulus, Equation (11), internal state damage parameter, Equation (10), and finally to constructthe damage characteristic curve and determine the coefficients of the damage function shown inEquation (12).
Two specimens from each mixture type were tested at different strain levels: 300 and 250micro-strains on the reference-gap mixture, 300 and 400 micro-strains on the rubber-modifiedand polymer-modified mixtures. However, it is important to note that one specimen from each ofthe three mixtures were tested under the same target on-specimen strain value (300 micro-strain).The results are given in Table 4.
From Table 3, it appears that the reference mixture has the highest modulus value comparedwith the modified mixture types. At 300 micro-strain levels, both polymer-modified and rubber-modified mixtures undergo higher load cycles before failure compared with the reference-gapmixture. This appears to be reasonable since for the strain-controlled test, the lower the modulusthe higher the fatigue life.
Dow
nloa
ded
by [
McG
ill U
nive
rsity
Lib
rary
] at
14:
22 0
2 O
ctob
er 2
014

598 W.A. Zeiada et al.
Moreover, the polymer-modified mixture appears to have slightly higher number of cyclesuntil failure compared to the rubber-modified mixture; however, it was expected that the rubber-modified mixtures would show relatively higher fatigue life. This might be due to the fact thatthe rubber-modified mixture required much less compaction effort (gyrations) compared withthe polymer-modified mixture to reach the target air void level. This might decrease the fatigueresistance of the rubber-modified below that was expected. Based on that, the mixture design forthe rubber-modified mixture might need to be modified to allow more voids in mineral aggregate(VMA) to accommodate the excess amount of the asphalt rubber.
7. Viscoelastic material propertiesThe viscoelastic material properties were estimated through the relaxation modulus cal-culation. The relaxation modulus values were calculated for each mixture type using theexact inter-conversion method (Park & Schapery, 1999). This method is based upon theFourier transformed relationship between storage modulus, E′, and relaxation modulus, E(t),Equation (15).
E′ = Re
{jω
∫ ∞
0E(t) e−jωt dt
}, (15)
where j is the imaginary unit and Re{x} reflects the real component of the transform. In Pronyform, the relaxation modulus is given by Equation (16).
E(t) = E∞ +N∑
m=1
Em exp−t/ρm , (16)
where E(t) is the relaxation modulus as a function of time, t (kPa); E∞ the long-time equilibriummodulus (kPa); Em the modulus of Prony term number m (kPa); ρm the relaxation time of Pronyterm m (s) and N the number of Prony terms used.
Substituting Equation (16) into Equation (15) leads to the Prony representation of E′,Equation (17).
E′(ω) = E∞ +N∑
m=1
Emω2ρ2m
ω2ρ2m + 1
. (17)
Since Equation (17) is derived based on the Prony representation of E(t), Equation (16), the Emvalues in both are equivalent. Thus, if the terms can be found from E′ data then they may be directlysubstituted into Equation (16) to predict the relaxation modulus. The E′ values can be fit to theProny representation using the collocation method. Initially, relaxation times are assumed in onedecade intervals over a range that approximates the reduced times/frequencies evaluated in thedynamic modulus test (approximately 2 × 10⁻⁸ to 2 × 10⁸ s). Then, Equation (17) is manipulatedto separate the Prony term modulus from the summation term, Equation (18), where E∞ can beestimated from the sigmoidal function of the |E∗|, since E∞ is the same for either |E∗| or E′ (e.g.E∞ is the long-time elastic response of the mixture). Finally, the Prony term moduli are solvedfor by using inverse matrix operations, as shown in Equation (19).
{E′ − E∞} =[
ω2ρ2m
ω2ρ2m + 1
]{Em}, (18)
{Em} =[
ω2ρ2m
ω2ρ2m + 1
]−1
{E′ − E∞}. (19)
Dow
nloa
ded
by [
McG
ill U
nive
rsity
Lib
rary
] at
14:
22 0
2 O
ctob
er 2
014

Road Materials and Pavement Design 599
Table 5. Prony series parameters for the Swedish gap-graded mixtures.
Mixture type Reference-gap Polymer-modified Rubber-modified
Terms ρm (s) Em (kPa) ρm (s) Em (kPa) ρm (s) Em (kPa)
1 2.00E+08 3392 2.00E+08 6109 2.00E+08 17,8712 2.00E+07 3234 2.00E+07 5343 2.00E+07 97423 2.00E+06 8322 2.00E+06 13,514 2.00E+06 23,9044 2.00E+05 18,416 2.00E+05 28,827 2.00E+05 43,3345 2.00E+04 42,175 2.00E+04 63,873 2.00E+04 84,2886 2.00E+03 99,953 2.00E+03 146,238 2.00E+03 170,7767 2.00E+02 252,445 2.00E+02 354,928 2.00E+02 366,5468 2.00E+01 692,406 2.00E+01 922,105 2.00E+01 822,7179 2.00E+00 1,941,157 2.00E+00 2,404,968 2.00E+00 1,855,53810 2.00E-01 4,361,535 2.00E-01 5,096,523 2.00E-01 3,106,01311 2.00E-02 7,667,979 2.00E-02 8,613,774 2.00E-02 5,314,34912 2.00E-03 11,958,953 2.00E-03 11,660,148 2.00E-03 8,198,16513 2.00E-04 14,272,413 2.00E-04 12,125,054 2.00E-04 11,277,60614 2.00E-05 14,052,870 2.00E-05 10,344,635 2.00E-05 13,795,24115 2.00E-06 11,862,006 2.00E-06 7,665,242 2.00E-06 15,127,48816 2.00E-07 8,988,787 2.00E-07 5,184,031 2.00E-07 15,055,26517 2.00E-08 6,568,947 2.00E-08 3,423,696 2.00E-08 14,509,193
Table 5 summarises the three asphalt mixtures’ Prony series coefficients and relaxation times. Notethat in this project the interconversion process has not been directly validated with comparisonsto experimentally determined relaxation modulus. However, the main components used in thisprocess have been validated elsewhere (Park & Kim, 2001) and successfully used in time-domainconstitutive modelling of asphalt concrete under varying temperature, rate and frequencies ofloading (Underwood et al., 2006, 2010; Daniel & Kim 2002; Schapery, 1984) for different termvalues required for relaxation modulus.
8. Damage characteristic curveThe construction of C–S curves in this paper followed the most updated procedure developedby Underwood et al. (2010) to calculate the internal state damage, S, as shown in Equation (10).The pseudo-stiffness or modulus was calculated simply by calculating the pseudo-strain fromcyclic data divided by the applied stress (Underwood et al., 2010). Then the pseudo-stiffness wasnormalised via dividing the pseudo-stiffness at each cycle by the initial pseudo-stiffness at thefirst cycle. For each mixture, two C–S curves were established from the two tested specimens.Then a single model using Equation (12) was fitted through the collapsed two curves to representthe model C–S curve for the mixture. Figure 7 demonstrates an example of the C–S curve for thepolymer-modified mixture while Figure 8 shows the C–S curves for the three mixtures together.The coefficients of these C–S curves are shown in Figure 8 and are also given in Table 3.
From Figure 8, it can be observed that the most favourably positioned damage characteristiccurves are obtained from the reference-gap and polymer-modified mixtures. A more favourabledamage characteristic curve is the one that has the greatest damage level for a given pseudo-stiffness. This condition is more favourable because, as seen in Equations (2)–(5), it means thatthe rate of damage growth for a given pseudo-energy input will be less and thus the incrementalloss in pseudo-stiffness will also be less. However, one cannot, or should not, use this curve aloneto judge the fatigue resistance of the three mixtures.
Dow
nloa
ded
by [
McG
ill U
nive
rsity
Lib
rary
] at
14:
22 0
2 O
ctob
er 2
014

600 W.A. Zeiada et al.
Figure 7. An example of S–C curve fitting model for the polymer-modified mixture.
Figure 8. Comparison of damage characteristic curves for study mixtures.
While the damage characteristic curve constitutes an important component of the overall mix-ture fatigue resistance, it is not the only characteristic that should be considered. In addition, onemust also consider the material’s resistance to deformation, i.e. how much pseudo-energy willbe generated for any given strain input. The resistance to deformation can vary as much or morebetween materials than their differences in damage resistance. An example of how this interplaybetween resistances to deformation and damage may affect the fatigue life can be observed byconsidering the following hypothetical case. Suppose that there are two mixtures, and that the first(Mixture 1) has low damage sensitivity, but the second (Mixture 2) has high damage sensitivity(i.e. the C–S curve for Mixture 1 is positioned above that for Mixture 2). Ignoring the moduluseffect, one would immediately conclude that Mixture 1 is the better material with regard to fatigueresistance. However, now suppose that the modulus for Mixture 1 is greater than that of Mixture 2by a factor of 4, and further suppose that both materials are subjected to controlled-strain loadingat the same input level. According to the damage theory (Equations (2)–(5)), under these loadingconditions Mixture 1 would generate 16 times more pseudo-energy than would Mixture 2. Such
Dow
nloa
ded
by [
McG
ill U
nive
rsity
Lib
rary
] at
14:
22 0
2 O
ctob
er 2
014

Road Materials and Pavement Design 601
Figure 9. Simulation results for controlled-strain test at 10 Hz loading frequency and at (a) 5◦C, (b) 20◦Cand (c) 27◦C.
an increase in pseudo-energy may very easily overcome the differences in C–S curves and resultin overall poorer fatigue performance than Mixture 1.
It can also be theoretically shown (Park, 1994) that S is an internal state variable that relatesto a physical change within the material (micro-crack formation, internal dislocations, etc.) butdoes not necessarily give direct quantification of that change. Consider the case where the physi-cal transformation responsible for any observed softening is micro-cracking. The S variable willincrease as those micro-cracks grow or multiply, but one cannot convert the value of S to thenumber of micro-cracks, cumulative crack area, etc. without some additional theoretical assump-tions. This constraint means that across different materials, the same S value does not necessarilyrepresent the same internal physical change. The practical implication of this theoretical constraintis simply that in order to gain useful information on fatigue cracking one must perform simu-lated predictions of the fatigue life at specific conditions of interest. Underwood, Baek and Kim(2012) derived the formulae for predicting the material response to fully reversed constant stressand strain loadings (Equations (20) and (21), respectively) and verified these formulations usingindependent laboratory experiments (Hou, Underwood & Kim, 2010). Here, these equations areused to predict the fatigue performance of the three study mixtures at the temperatures of 5, 20and 27◦C (41, 68 and 80◦F) and the results are summarised in Figures 9 and 10.
Nfailure = (fr)(23α)Sα−αC2+1failure
(α − αC2 + 1)(C1C2)α[(ε0,pp)(|E∗|LVE)]2αK1, (20)
Nfailure = f ∗r 23α|E∗|2α
[(σ0,pp)]2αK1
∫ Sfailure
0
((1 − C1(S)C2)2
C1C2SC2−1
)α
(dS), (21)
where Nfailure is the predicted cycle number of cycles to failure; fr the reduced frequency for thecondition being simulated; |E∗| the dynamic modulus for the condition being simulated; ε0,pp the
Dow
nloa
ded
by [
McG
ill U
nive
rsity
Lib
rary
] at
14:
22 0
2 O
ctob
er 2
014
602 W.A. Zeiada et al.
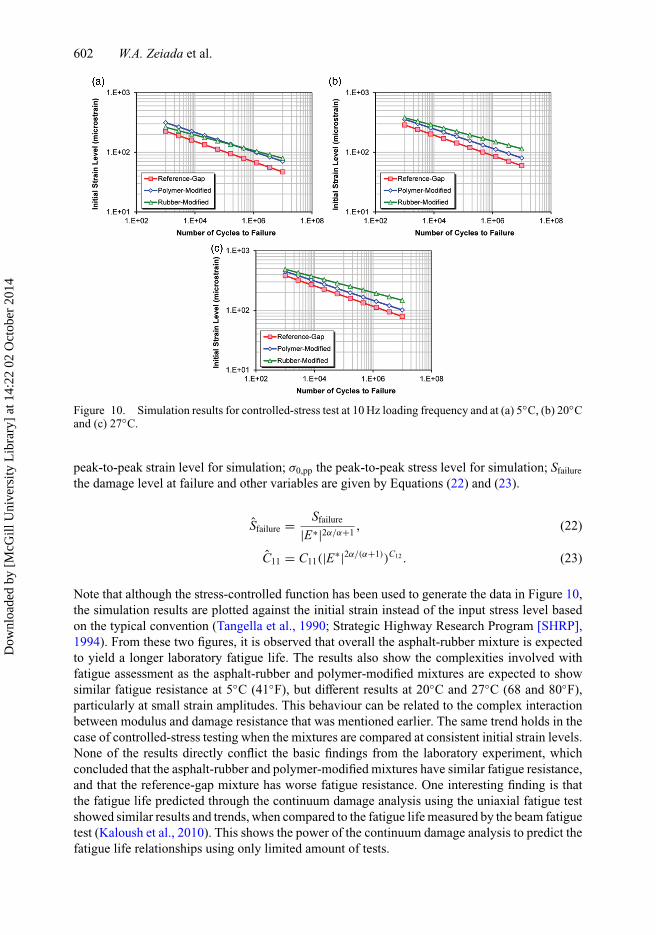
Figure 10. Simulation results for controlled-stress test at 10 Hz loading frequency and at (a) 5◦C, (b) 20◦Cand (c) 27◦C.
peak-to-peak strain level for simulation; σ0,pp the peak-to-peak stress level for simulation; Sfailure
the damage level at failure and other variables are given by Equations (22) and (23).
Sfailure = Sfailure
|E∗|2α/α+1 , (22)
C11 = C11(|E∗|2α/(α+1))C12 . (23)
Note that although the stress-controlled function has been used to generate the data in Figure 10,the simulation results are plotted against the initial strain instead of the input stress level basedon the typical convention (Tangella et al., 1990; Strategic Highway Research Program [SHRP],1994). From these two figures, it is observed that overall the asphalt-rubber mixture is expectedto yield a longer laboratory fatigue life. The results also show the complexities involved withfatigue assessment as the asphalt-rubber and polymer-modified mixtures are expected to showsimilar fatigue resistance at 5◦C (41◦F), but different results at 20◦C and 27◦C (68 and 80◦F),particularly at small strain amplitudes. This behaviour can be related to the complex interactionbetween modulus and damage resistance that was mentioned earlier. The same trend holds in thecase of controlled-stress testing when the mixtures are compared at consistent initial strain levels.None of the results directly conflict the basic findings from the laboratory experiment, whichconcluded that the asphalt-rubber and polymer-modified mixtures have similar fatigue resistance,and that the reference-gap mixture has worse fatigue resistance. One interesting finding is thatthe fatigue life predicted through the continuum damage analysis using the uniaxial fatigue testshowed similar results and trends, when compared to the fatigue life measured by the beam fatiguetest (Kaloush et al., 2010). This shows the power of the continuum damage analysis to predict thefatigue life relationships using only limited amount of tests.
Dow
nloa
ded
by [
McG
ill U
nive
rsity
Lib
rary
] at
14:
22 0
2 O
ctob
er 2
014

Road Materials and Pavement Design 603
One caveat in this analysis is that the controlled-stress simulations are shown with respect to theinitial strain level and not with respect to the input stress condition. Since the reference mixture isstiffer than either the polymer-modified or rubber-modified mixtures, when comparisons are madeat the same stress level the reference mixture would appear to outperform the other two. However,convention based on historical correlations (Tangella et al., 1990) suggests that more useful insighton in-service fatigue performance is gained by examining controlled-stress laboratory tests in themanner performed herein. It should also be mentioned that laboratory fatigue tests of the typesimulated with the VECD model do not generally take explicit consideration of differences inthe fracture characteristics of the materials. However, these characteristics may have importantimplications in rigorously relating laboratory fatigue tests to pavement cracking performance.Since the rubber-modified asphalt mixture has been shown to outperform either of the other twostudy mixtures in this regard, it is expected that the differences identified through this investigationlikely underestimate the overall net benefits of asphalt rubber in mitigating or reducing the crackingphenomenon in asphalt concrete pavements.
9. ConclusionsThis paper presented research performed to compare properties and fatigue performance character-istics for reference, polymer-modified and rubber-modified gap-graded mixtures placed on the E18highway in the Stockholm area of Sweden. The advanced material characterisation tests includeddynamic (complex) modulus for stiffness evaluation and the uniaxial tension–compression forfatigue assessment. The data were used to compare the performance of the rubber-modifiedgap-graded mixture to the reference and the polymer-modified gap mixtures using the VECDapproach.
Dynamic modulus test results indicate that, at low test temperatures, the polymer-modifiedmixture expressed the highest stiffness followed by the reference and rubber-modified mixtures.In comparison, at low temperatures, the rubber-modified mixture had the highest stiffness followedby reference and polymer-modified. The rubber-modified mixture exhibited the lowest stiffnesscompared to the other two mixtures at 21◦C (70◦F), which is the test temperature used for theuniaxial tension–compression test.
According to the uniaxial tension–compression fatigue test (300με), both the polymer-modifiedand rubber-modified mixtures, undergo higher load cycles before failure compared with thereference-gap mixture. This appears to be reasonable since for strain-controlled test, the lowerthe modulus the higher the fatigue life. Moreover, the polymer-modified mixture appears to haveslightly higher number of cycles till failure compared with the rubber-modified mixture. However,it was expected that the rubber-modified mixture would show relatively higher fatigue life andthis discrepancy may be the result of differences in compaction effort.
Damage characteristic (C–S) curves were formulated and used along with the measured linearviscoelastic characteristics to predict the fatigue performance of the three study mixtures overa range of temperatures. This data clearly showed the benefits of the rubber-modified mixturein terms of laboratory fatigue resistance. This VECD analysis presents a more powerful tool toevaluate fatigue resistance. Instead of only looking at the number of cycles at a certain stiffnessreduction, this method considers internal state damage. Results indicate that VECD is a muchmore comprehensive approach to access resistance to fatigue damage than the traditional numberof cycles at a certain stiffness reduction. The rubber-modified mixture exhibits the greatest fatigueresistance followed by the polymer-modified and reference.
Finally, results obtained from this study will be compared to actual field performance of thetest sections once this information becomes available from Trafikverket. At this time, the ranking
Dow
nloa
ded
by [
McG
ill U
nive
rsity
Lib
rary
] at
14:
22 0
2 O
ctob
er 2
014

604 W.A. Zeiada et al.
of mixtures from laboratory tests will be compared to the field ranking to validate the results ofthe VECD approach.
ReferencesAmerican Association of State Highway and Transportation Officials [AASHTO] TP62-07. (2007). Standard
method of test for determining dynamic modulus of hot-mix asphalt concrete mixtures. Washington, DC:AASHTO.
American Association of State Highway and Transportation Officials [AASHTO] T 321. (2008). Standardmethod of test for determining the fatigue life of compacted hot-mix asphalt (HMA) subjected to repeatedflexural bending. Washington, DC: AASHTO.
Carpenter, S. H., & Shen, S. (2005). Application of the dissipated energy concept in fatigue endurancelimit testing. Transportation Research Record, Journal of the Transportation Research Board, 1929,165–173.
Chehab, G. R., Kim, Y. R., Schapery, R. A., Witczak, M. W., & Bonaquist, R. (2002). Time-temperaturesuperposition principle for asphalt concrete mixtures with growing damage in tension state. Journal ofthe Association of Asphalt Paving Technologists, 72, 559–593.
Christensen, D. W., & Bonaquist, R. (2005). Practical application of continuum damage theory to fatiguephenomena in asphalt concrete mixtures. Journal of the Association of Asphalt Paving Technologists,74, 963–1002.
Daniel, J. S., & Kim, Y. R. (2002). Development of a simplified fatigue test and analysis procedure using aviscoelastic continuum damage model. Journal of the Association of Asphalt Paving Technologists, 72,619–650.
Hou, E. T., Underwood, B. S., & Kim, Y. R. (2010). Fatigue performance prediction of North Carolinamixtures using the simplified viscoelastic continuum damage model. Journal of the Association ofAsphalt Paving Technologists, 79, 35–80.
Jacobs, M. M. J., Hopman, P. C., & Molenaar, A. A. A. (1996). Application of fracture mechanics principlesto analyze cracking in asphalt concrete. Journal of the Association of Asphalt Paving Technologists, 65,1–39.
Kaloush, K. E., Biligiri, K. P., Rodezno, M. C., Souliman, M. I., Reed, J. X., & Stempihar, J. (2010).Laboratory evaluation of rubber & polymer modified bituminous mixtures constructed in Stockholm(E18 Highway between the Järva Krog & Bergshamra Interchanges). Tempe, Arizona: Arizona StateUniversity.
Kaloush, K. E., Biligiri, K. P., Nordgren, T., Zeiada, W. A., Rodezno, M. C., Souliman, M. I., . . . Stempihar, J.(2012). Laboratory evaluation of asphalt-rubber gap graded mixtures constructed on Stockholm highwayin Sweden. Asphalt Rubber 2012, Munich, Germany.
Kaloush, K. E., Biligiri, K. P., Zeiada, W. A., Rodezno, M. C., & Souliman, M. I. (2008). Laboratorypavement performance evaluation of Swedish gap graded asphalt concrete mixtures – Malmo E-06Highway. Tempe, Arizona: Arizona State University.
Kim, Y. R., Lee, H. J., & Little, D. (1997a). Fatigue characterization of asphalt concrete using viscoelasticityand continuum damage theory. Journal of the Association of Asphalt Paving Technologists, 66, 520–558.
Kim, Y. R., Lee, H. J., & Little, D. N. (1997b). Fatigue characterization of asphalt concrete using visco-elasticity and continuum damage theory. Journal of the Association of Asphalt Paving Technologists,66, 520–569.
Kim, Y. R., & Little, D. (1990). One-dimensional constitutive modeling of asphalt concrete. Journal ofEngineering Mechanics, 116(4), 751–772.
Kutay, M. E., Gibson, N., & Youtcheff, J. (2008). Conventional and viscoelastic continuum damage (VECD)-based fatigue analysis of polymer modified asphalt pavements. Journal of the Association of AsphaltPaving Technologists, 77, 395–434.
Lee, H. J. (1996). Viscoelastic constitutive modeling of asphalt concrete using viscoelasticity and continuumdamage theory (Doctoral Dissertation). North Carolina State University, Raleigh.
Majidzadeh, K., Kauffmann, E. M., & Ramsamooj, D. V. (1971). Application of fracture mechanics inthe analysis of pavement fatigue. Proceedings of the Association of Asphalt Paving Technologists, 40,227–246.
Mun, S., Chehab, G. R., & Kim, Y. R. (2007). Determination of time-domain viscoelastic functions usingoptimized interconversion techniques. International Journal of Road Materials and Pavement Design,8(2), 351–365.
Dow
nloa
ded
by [
McG
ill U
nive
rsity
Lib
rary
] at
14:
22 0
2 O
ctob
er 2
014

Road Materials and Pavement Design 605
Nordgren, T., & Preinfalk, L. (2009). Asphalt rubber – a new concept for asphalt pavements in Sweden?Progress report – February 2009, Swedish Transport Administration, Gothenburg, Sweden.
Park, S. W. (1994). Development of a nonlinear thermo-viscoelastic constitutive equation for particulatecomposites with growing damage (Doctoral Dissertation). The University of Texas, Austin.
Park, S. W., & Kim, Y. R. (2001). Fitting Prony-series viscoelastic models with power-law presmoothing.Journal of Materials in Civil Engineering, 13(1), 26–32.
Park, S. W., Kim, Y. R., & Schapery, R. A. A. (1996). A viscoelastic continuum damage model and itsapplication to uniaxial behavior of asphalt concrete. Mechanics of Materials, 24, 241–255.
Park, S. W., & Schapery, R. A. (1999). Methods of interconversion between linear viscoelastic materialfunctions, part I – a numerical method based on Prony series. International Journal of Solids andStructures, 36, 1653–1675.
Pell, P. S., & Hanson, J. M. (1973). Behavior of bituminous road base materials under repeated loading.Proceedings of Association of Asphalt Paving Technologists, 42, 201–229.
Raithby, K. D., & Ramshaw, J. T. (1972). Effect of secondary compaction on the fatigue performance of ahot-rolled asphalt, TRRL-LR 471, Crowthorne.
Roque, R., & Buttlar, W. G. (1992). The development of a measurement and analysis system to accuratelydetermine asphalt concrete properties using the indirect tensile mode. Journal of the Association ofAsphalt Paving Technologists, 61, 304–333.
Schapery, R. A. (1984). Correspondence principles and a generalized J integral for large deformation andfracture analysis of viscoelastic media. International Journal of Fracture, 25, 195–223.
Schapery, R. A. (1990). A theory of mechanical behavior of elastic media with growing damage and otherchanges in structure. Journal of Mechanics and Physics of Solids, 38, 215–253.
Schapery, R. A. (1991). Analysis of damage growth in particulate composite using a work potential.Composites, Part B, Engineering, 1(3), 167–182.
Strategic Highway Research Program [SHRP]. (1994). SHRP-A-404 – Fatigue characteristics of bitumenand bituminous mixes. University of California, Berkeley, National Research Council, Washington, DC.
Tangella, S. R., Craus, J., Deacon, J. A., & Monismith, C. L. (1990). Summary report of fatigue responseof asphalt mixtures, Technical Memorandum No. TM-UCB-A-003A-89-3M, prepared for SHRP ProjectA-003A. Institute of Transportation Studies, University of California, Berkeley.
Underwood, B. S., Baek, C. M., & Kim, Y. R. (2012). Use of simplified viscoelastic continuum damagemodel as an asphalt concrete fatigue analysis platform. Transportation Research Record, Journal of theTransportation Research Board, 4, 36–45.
Underwood, B. S., Kim, Y. R., & Guddati, M. N. (2006). Characterization and performance prediction ofALF mixtures using a viscoelastoplastic continuum damage model. Journal of the Association of AsphaltPaving Technologists, 75, 577–636.
Underwood, B. S., Kim, Y. R., & Guddati, M. N. (2010). Improved calculation method of damage parameter inviscoelastic continuum damage model. International Journal of Pavement Engineering, 11(6), 459–476.
Van Dijk, W. (1975). Practical fatigue characterization of bituminous mixes. Journal of the Association ofAsphalt Paving Technologists, 44, 38–72.
Van Dijk, W., & Visser, W. (1977). The energy approach to fatigue for pavement design. Journal of theAssociation of Asphalt Paving Technologists, 46, 1–40.
Zhang, J., Sabouri, M., Guddati, M., & Kim, Y. R. (2013). Development of a failure criterion for asphaltmixtures under fatigue loading. International Journal of Road Materials and Pavement Design, 14(2),1–15.D
ownl
oade
d by
[M
cGill
Uni
vers
ity L
ibra
ry]
at 1
4:22
02
Oct
ober
201
4