Embed Size (px)
DESCRIPTION
Green Lakes Basin, CO. Comparison of Cations in Three Lakes. Red rectangles = sampling locations Blue arrows = direction of stream flow. Green Lakes Basin, CO. Continental Divide. Methods. Look at concentrations of Ca 2+ , Mg 2+ , Na + , and K + from 1982 to 2006. - PowerPoint PPT Presentation
Citation preview
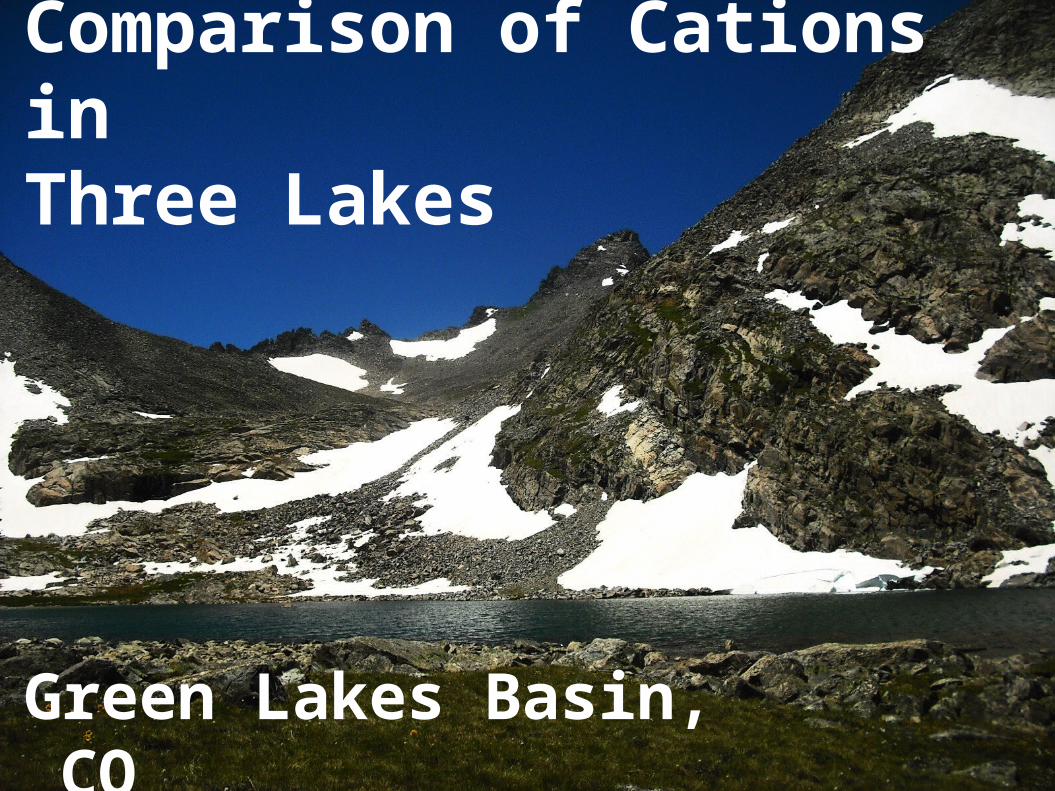
Comparison of Cations in Three Lakes
Green Lakes Basin, CO
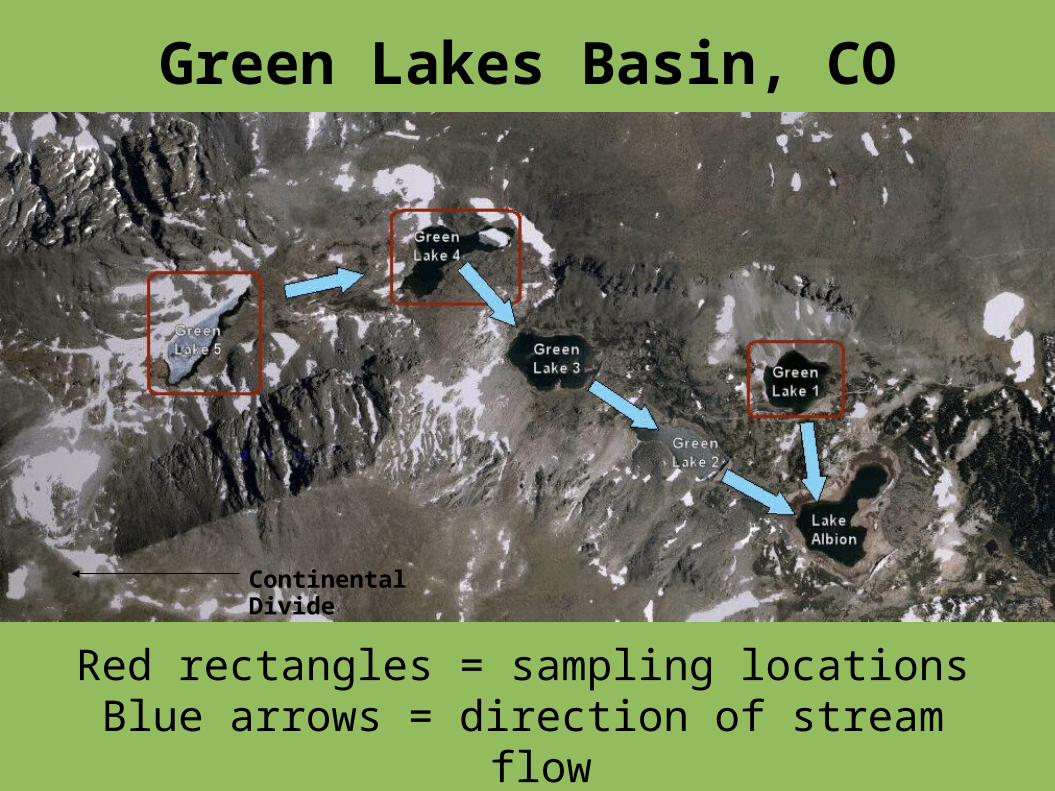
Green Lakes Basin, CO
Red rectangles = sampling locationsBlue arrows = direction of stream flow
Continental Divide
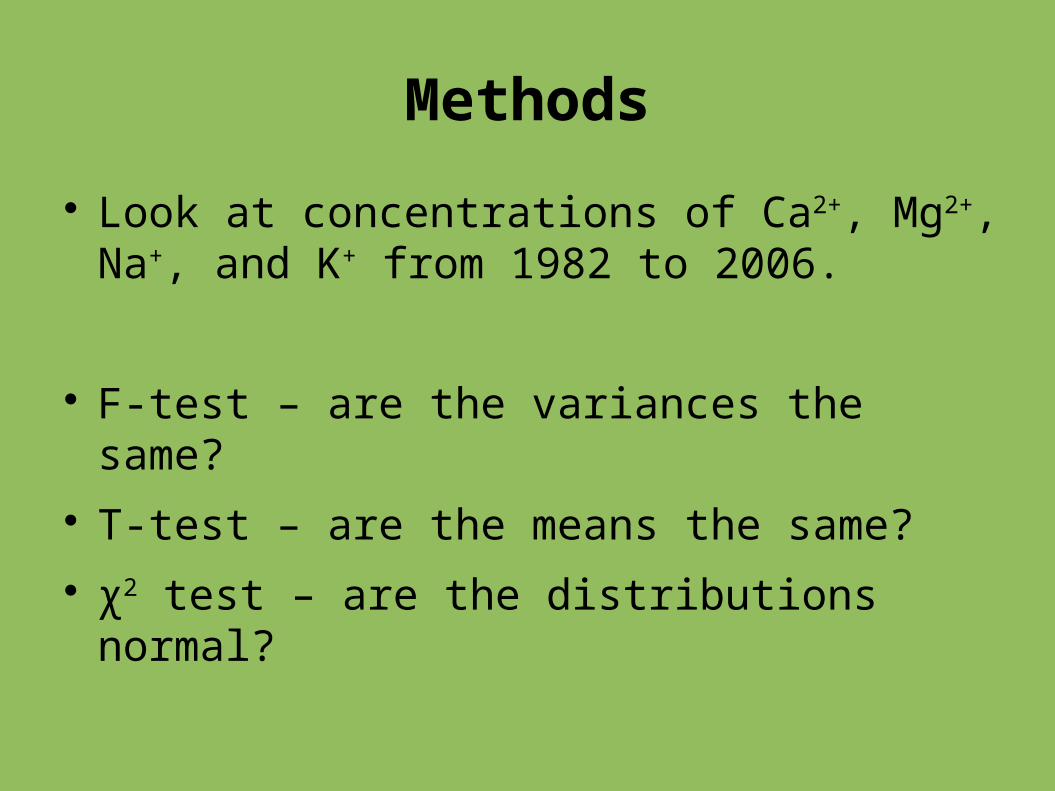
Methods
Look at concentrations of Ca2+, Mg2+, Na+, and K+ from 1982 to 2006.
F-test – are the variances the same? T-test – are the means the same? χ2 test – are the distributions normal?
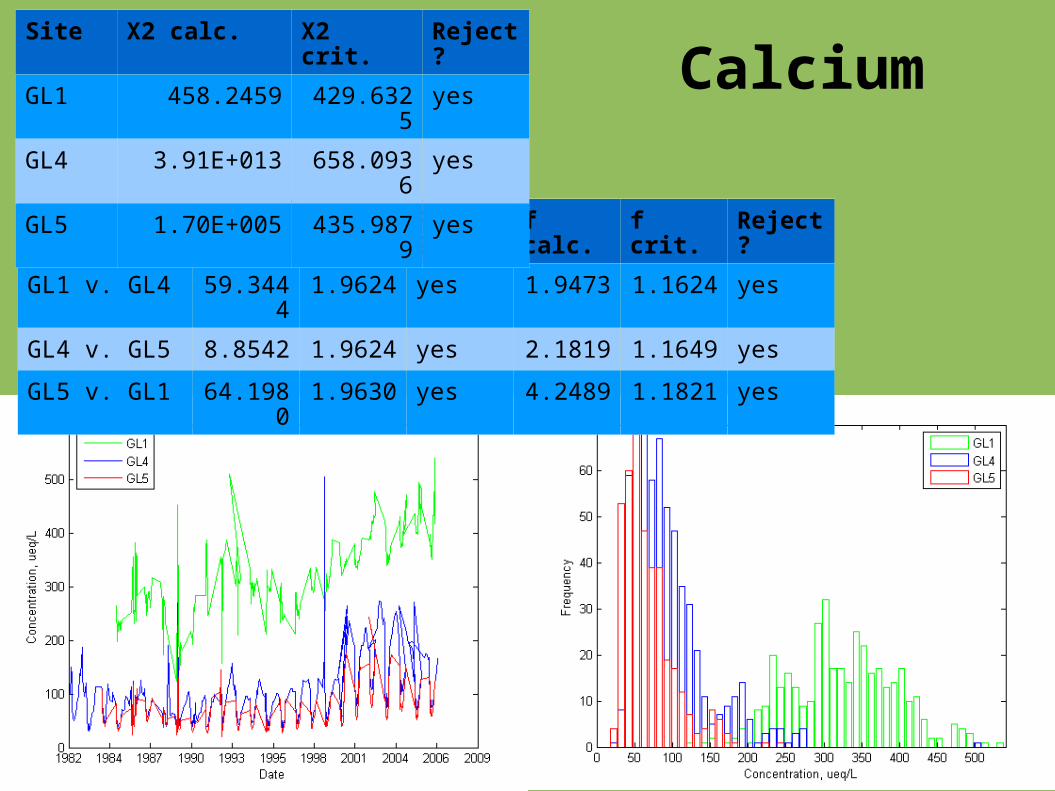
Calcium
Comparison t calc. t crit. Reject? f calc. f crit. Reject?
GL1 v. GL4 59.3444 1.9624 yes 1.9473 1.1624 yes
GL4 v. GL5 8.8542 1.9624 yes 2.1819 1.1649 yes
GL5 v. GL1 64.1980 1.9630 yes 4.2489 1.1821 yes
Site X2 calc. X2 crit. Reject?
GL1 458.2459 429.6325 yes
GL4 3.91E+013 658.0936 yes
GL5 1.70E+005 435.9879 yes
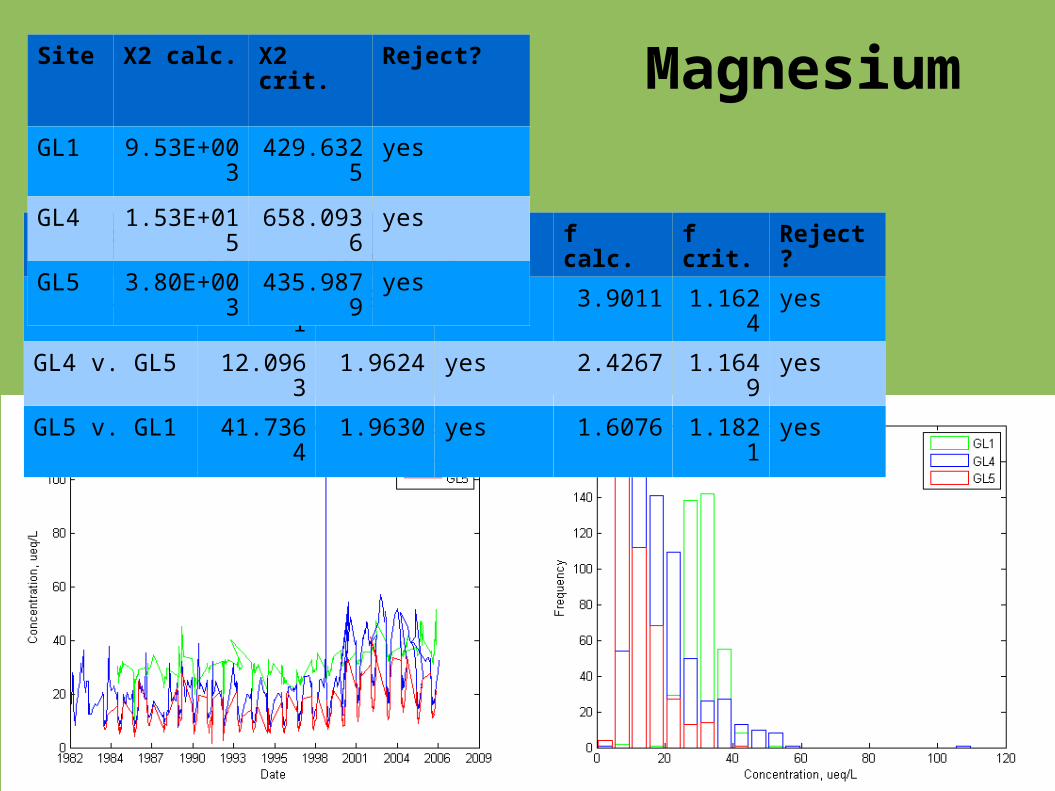
Magnesium
Comparison t calc. t crit. Reject? f calc. f crit. Reject?
GL1 v. GL4 19.0031 1.9624 yes 3.9011 1.1624 yes
GL4 v. GL5 12.0963 1.9624 yes 2.4267 1.1649 yes
GL5 v. GL1 41.7364 1.9630 yes 1.6076 1.1821 yes
Site X2 calc. X2 crit. Reject?
GL1 9.53E+003 429.6325 yes
GL4 1.53E+015 658.0936 yes
GL5 3.80E+003 435.9879 yes
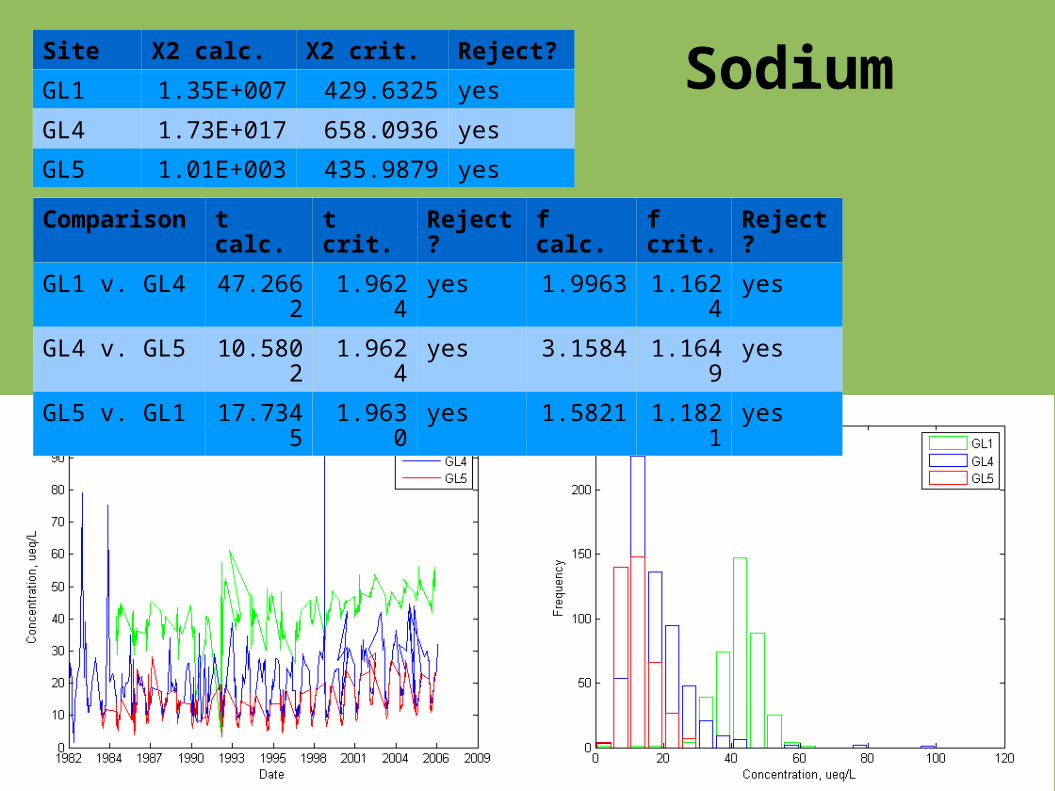
Sodium
Comparison t calc. t crit. Reject? f calc. f crit. Reject?
GL1 v. GL4 47.2662 1.9624 yes 1.9963 1.1624 yes
GL4 v. GL5 10.5802 1.9624 yes 3.1584 1.1649 yes
GL5 v. GL1 17.7345 1.9630 yes 1.5821 1.1821 yes
Site X2 calc. X2 crit. Reject?
GL1 1.35E+007 429.6325 yes
GL4 1.73E+017 658.0936 yes
GL5 1.01E+003 435.9879 yes
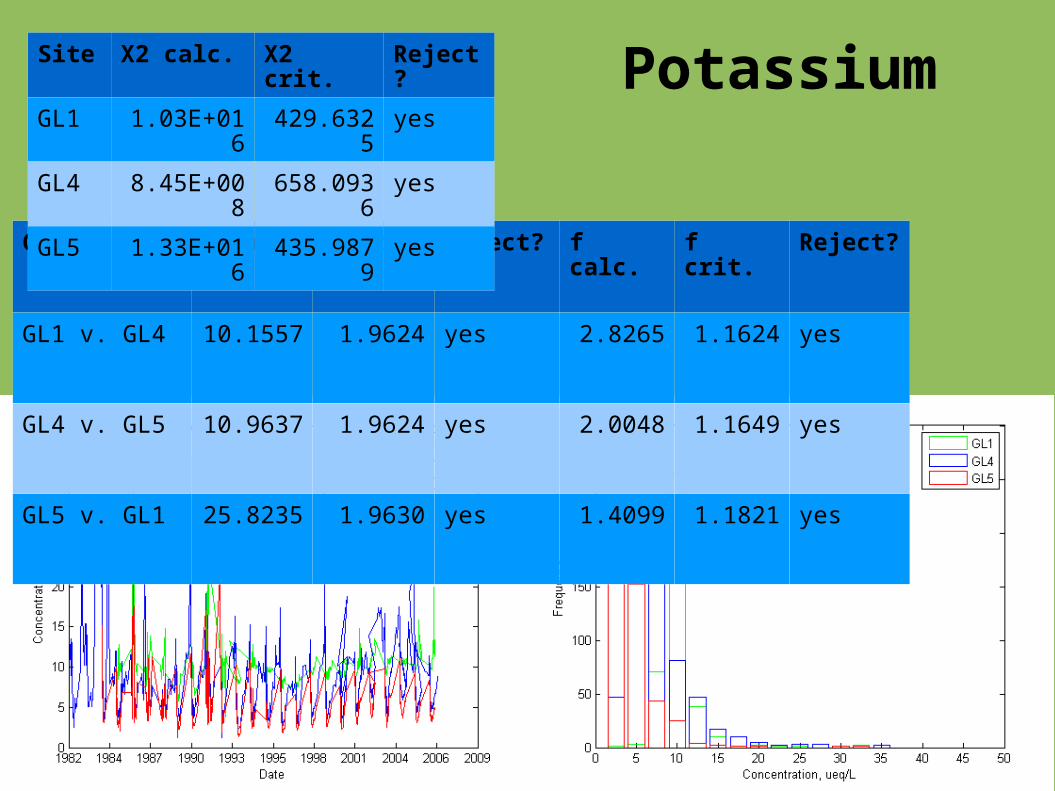
Potassium
Comparison t calc. t crit. Reject? f calc. f crit. Reject?
GL1 v. GL4 10.1557 1.9624 yes 2.8265 1.1624 yes
GL4 v. GL5 10.9637 1.9624 yes 2.0048 1.1649 yes
GL5 v. GL1 25.8235 1.9630 yes 1.4099 1.1821 yes
Site X2 calc. X2 crit. Reject?
GL1 1.03E+016 429.6325 yes
GL4 8.45E+008 658.0936 yes
GL5 1.33E+016 435.9879 yes
Conclusions Green Lakes 1, 4, and 5 have different
cation chemistries– Variances and means are not the same
– None of the data are normally distributed GL4 has higher concentrations than GL5
– Inputs from hillslopes and from GL5 GL1 is the most different of the three
– Ca2+ and Na+ concentrations are much higher
– Possibly a different rock type