Embed Size (px)
Citation preview
COMPARISON OF CANADIAN AND INTERNATIONAL ANGUS CATTLE POPULATIONS USING GENE VARIANTS AND MICROSATELLITES
A Thesis Submitted to the
College of Graduate Studies and Research
in Partial Fulfillment of the Requirements
For the Degree of Master of Science
in the Department of Animal and Poultry Science
University of Saskatchewan
Saskatoon, SK
Canada
Chelsey Rae Carruthers
© Copyright Chelsey Rae Carruthers, 2009. All rights reserved
i
PERMISSION TO USE
In presenting this thesis in partial fulfillment of the requirements for a Postgraduate
degree from the University of Saskatchewan, I agree that the libraries of this University
may make it freely available for inspection. I further agree that permission for copying of
this thesis in any manner, in whole or in part, for scholarly purposes may be granted by
the professor or professors who supervised my thesis work, or in their absence, by the
Head of the Department or the Dean of the College in which my thesis work was done. It
is understood that any copying, publication, or use of this thesis or parts of it thereof for
financial gain shall not be allowed without my written permission. It is also understood
that due recognition shall be given to me and to the University of Saskatchewan in any
scholarly use which may be made of any material in my thesis.
Requests for permission to copy or to make use of material in this thesis in whole or in
part should be addressed to:
Head of the Department of Animal and Poultry Science
University of Saskatchewan
Saskatoon, Saskatchewan S7N 5A8
ii
ABSTRACT
Seven single nucleotide polymorphisms in six genes (LEP, IGF2, MC1R, PMCH,
CAPN1, and CAST) which had been shown to affect traits of economic importance were
used to compare the allele frequencies and diversity of a Canadian population of Angus
cattle and an International population. Genetic diversity was also measured using 22
microsatellite markers that were assumed not to be affected by selection.
The Canadian population consisted of 107 cows and 57 bulls, while the Canadian
Angus Association’s International Embryo Program population consisted of 26 calves.
Black and red animals were represented in each population. Although the bulls of the
Canadian population represent Angus from 16-17 years ago, and the cows of the
Canadian population represent Angus from 2006-2007, no difference was observed in
either the set of microsatellite genotypes nor the SNP genotypes.
A significant difference was found between the Canadian and International
populations at CAST, with the Canadian population exhibiting a higher frequency of the
favorable A allele than the International population. This allele is positively correlated
with tenderness. No significant differences were found for the other genes. Both
populations were in Hardy Weinburg equilibrium for all genes except MC1R, which
affects coat color.
Using microsatellites, the total genetic variability of the two Angus populations
was measured, showing that 93% of total variability was attributed to differences within,
and not between, populations. Randomly chosen cattle could also be assigned to the
correct population 97% of the time, based on microsatellite genotypes, and 75% of the
time based on SNP genotypes.
Mean heterozygosity was 0.578 based on microsatellites and 0.332 based on
SNPs. The proportion of genetic variability between the two populations was 3% based
on microsatellites and 7% based on SNPs. It is possible this reflects the results of indirect
selection differences in various countries.
Finally, Nei’s genetic distance was measured between the Canadian and
International populations. The Canadian and International populations had a pairwise
genetic distance of 0.097. In comparison, the genetic distance of Canadian Angus was
iii
0.135 to Blonde d’Aquitaine, 0.251 to Simmental, 0.258 to Gelbvieh, 0.281 to Limousin,
0.305 to Holstein, 0.334 to Belgian Blue, and 0.452 to Hereford based on microsatellite
markers.
The results of this study show that the Angus breed contains as much or more
genetic diversity than other cattle breeds. Greatest genetic differences exist between
individual animals, not between populations of cattle in Canada and other countries.
iv
ACKNOWLEDGEMENTS
First and foremost, I would like to thank my supervisor, Dr. Sheila Schmutz. Her
expertise, guidance, and patience have been invaluable to me, and this thesis would not
have been possible without her encouragement and support.
I would also like to thank my committee members, Dr. Yves Plante, Dr. Ken
Walburger, and my committee chair, Dr. Bernard Laarveld. Dr. Plante generously shared
his time and expertise in data analysis and statistics.
Thanks go out to past and present graduate students and laboratory technicians for
technical support, as well as great conversations and ideas on a wide variety of subjects.
Special thanks to Tom Berryere, Janel Dickin, Dayna Dreger, Sarah Helgeson, Kim
McLean, Kim Reddick, and Lee-Anne Walter.
Thank you to the Canadian Angus Association for providing me the opportunity
to undertake this research, during which I was fortunate enough to meet Angus producers
and enthusiasts from around the world. Thanks also to the staff at Remington Cattle
Company in Del Bonita, Alberta for their assistance and cooperation throughout my
project.
Finally, I would like to acknowledge the Canadian Angus Association, NSERC,
and the Department of Animal and Poultry Science at the University of Saskatchewan for
funding and scholarship support.
v
TABLE OF CONTENTS
PERMISSION TO USE……………….…..………………………………………….….. i
ABSTRACT……………………………………………...…………………………….…ii
ACKNOWLEDGEMENTS……………………………………………………….……...iv
TABLE OF CONTENTS…………………………………………………....…………….v
LIST OF TABLES…………………………………………………………………….…vii
LIST OF FIGURES………………………………………………………………………ix
LIST OF APPENDICES……………………………………………….………….………x
LIST OF ABBREVIATIONS………………………………………….……………....…xi
1.0 INTRODUCTION ……………………………………………………………………1
2.0 LITERATURE REVIEW……………………………………………………………..3
2.1 The Angus breed………………………………………………………………3
2.1.1 Breed history and development…...…………………...………….3
2.1.2 Current breed status…………………………………....………….3
2.1.3 International movement of Angus genetics…………………...…..4
2.2 Polymorphisms in genes related to beef production…………………………..5
2.2.1 LEP………………………………………………………………..6
2.2.2 IGF2……………………………………..……………...…………7
2.2.3 MC1R…………………….……………………………...…….......8
2.2.4 PMCH………………………..…………………………...……….9
2.2.5 CAPN1……………………………………………..………...……9
2.2.6 CAST……………………………………………………...……...10
2.3 Genetic diversity…………………………………………………...………...11
2.3.1 Genetic diversity in cattle………………………………...……...11
2.3.2 Polymorphism types for studying diversity………………...……13
2.4 Hypotheses……………………………………………………...…………....17
vi
3.0 MATERIALS AND METHODS…………………………………………………….18
3.1 Populations……………………………………………………………...…....18
3.2 DNA extraction………………………………………………………...…….19
3.3 PCR-RFLP…………………………………………………………...………19
3.4 Microsatellite genotyping………………………………………...………….21
3.5 Statistical analysis……………………………………………………...…….22
4.0 RESULTS……………………………………………………………………………23
4.1 Allele frequency……………………………………………………………...23
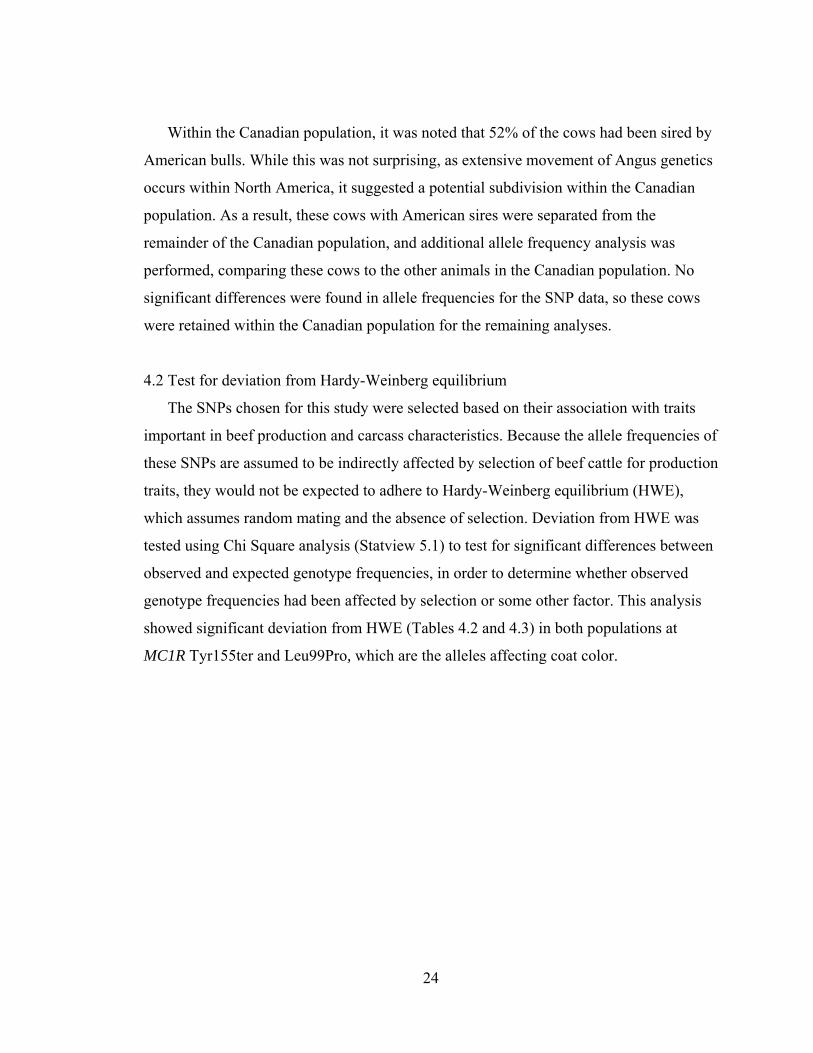
4.2 Test for deviation from Hardy-Weinberg Equilibrium…………………........24
4.3 Population structure………………………………………………...………..26
4.4 Population assignment…………………….………………………...……….27
4.5 Heterozygosity…………………………………...…………………..............30
4.6 Allele and heterozygosity statistics…………………………………………..30
4.7 F statistics…………………………...………………..……………………..33
4.8 Analysis of molecular variance…………………………….………………...35
4.9 Nei’s genetic distance…………...…………………………………………..36
5.0 DISCUSSION………………………………………………………………………..38
5.1 Allele frequency……………………………..………………...……………38
5.2 Hardy-Weinberg Equilibrium………………………………………..………39
5.3 Population structure………………………………………………...………..40
5.4 Population assignment…………………………………………………..…...41
5.5 Heterozygosity……...…………………………………………………..……43
5.6 F statistics………….………………….……………………………………..44
5.7 Analysis of molecular variance………………………………………………45
5.8 Nei’s genetic distance……………………………………………...………...48
6.0 CONCLUSIONS……………………………………………………...……………..50
7.0 REFERENCES……………………………………………………………...……….52
8.0 APPENDICES………………………………………………………………...……..59
vii
LIST OF TABLES
Table 2.1 Six SNPs that affect growth and carcass traits in beef cattle ……………….....6
Table 2.2 Allele frequencies in the LEP R25C SNP in four breeds of beef cattle ...…….7
Table 4.1 Allele frequencies for six SNPs in two Angus populations………………..…23
Table 4.2 Test for deviation from Hardy-Weinberg Equilibrium for the International population based on six SNPs using Chi Square analysis………………………...…..…25
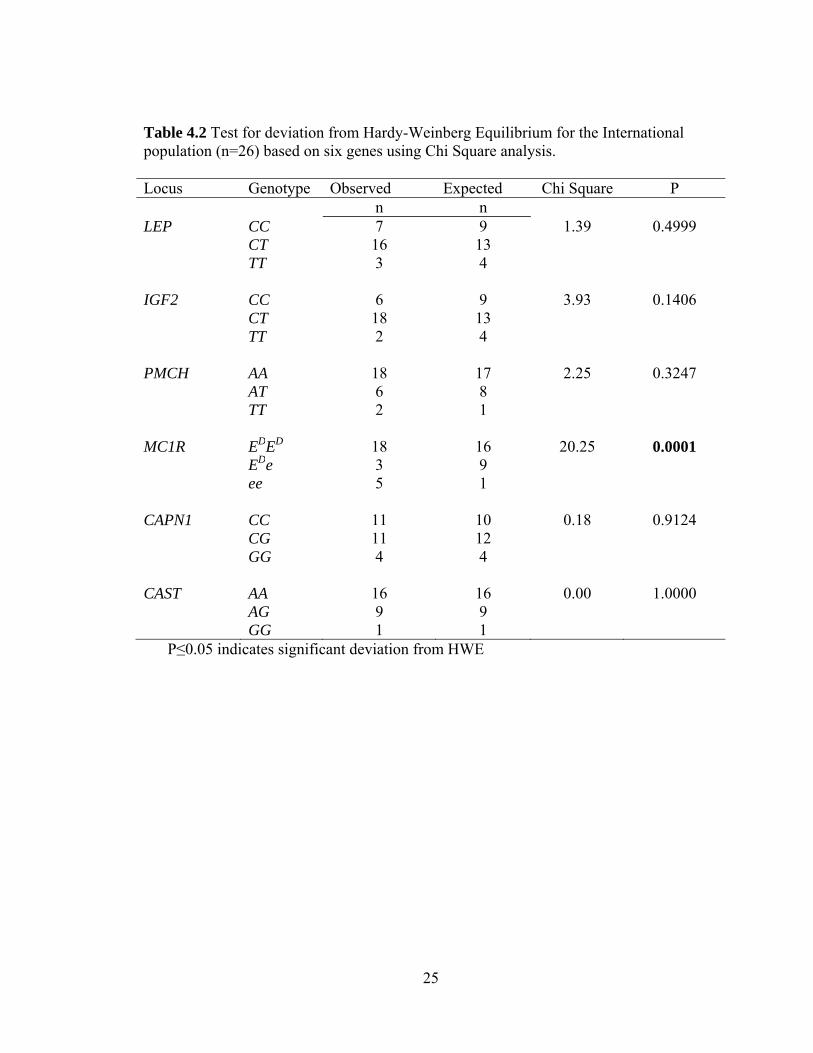
Table 4.3 Test for deviation from Hardy-Weinberg Equilibrium for the Canadian population based on six SNPs using Chi Square analysis………………………….……26
Table 4.4 Population assignment for two populations based on 22 microsatellites…….28
Table 4.5 Population assignment for two populations using six SNPs……………….....28
Table 4.6 List of private alleles found in either the Canadian or International populations and their frequencies. ………………………………………..………..…....29
Table 4.7 Mean heterozygosity for the International and Canadian populations using microsatellite and SNP data…………………………………………………….....30
Table 4.8 Allele and heterozygosity statistics for the Canadian population based on six SNPs………………………………………………………………………………….31
Table 4.9 Allele and heterozygosity statistics for the Canadian population based on 22 microsatellite loci…………………………………………………………………......31
Table 4.10 Allele and heterozygosity statistics for the International population based on six SNPs……………………………...………………………………………...32
Table 4.11 Allele and heterozygosity statistics for the International population based on 22 microsatellite loci…………………………………………………………...32
Table 4.12 F statistics for two populations using genotypes for six SNPs………..……33
Table 4.13 F statistics for two populations based on 22 microsatellite loci…………….34
Table 4.14 Analysis of molecular variance between two populations based on 22 microsatellites……………………………………………………………………………35
Table 4.15 Analysis of molecular variance between two populations based on six SNPs…………………………………….………………………………………………..36

viii
Table 4.16 Nei’s genetic distance for eight cattle breeds using 12 microsatellite markers……………………………………………...………………………………...…37
Table 5.1 Nei’s genetic distance for three cattle breeds……………………….………...47

ix
LIST OF FIGURES
Figure 4.1 Genetic structure analysis showing two clusters present, with the International population represented in red, and the Canadian population represented in blue and green…………………………………………………………………………27
Figure 5.1 Diagram showing the approximate locations of the six SNPs (green) and 22 microsatellite markers (red) used in this study…………………….....………….47

x
LIST OF APPENDICES
Appendix A Basic information on individuals comprising the International population……………………………………………………………………………….59
Appendix B. DNA extraction protocol………………………………………………….60
Appendix C. PCR primers and annealing temperatures for the seven SNPs in six genes…………………………………………………….……………………………….61
Appendix D. RFLP parameters for seven SNPs in six genes……………………...……62
Appendix E. PCR parameters for 22 microsatellite markers……………………...…….63
Appendix F. Microsatellite markers used for Nei’s genetic distance analysis of 752 animals representing eight cattle breeds…………………………………………………64
xi
LIST OF ABBREVIATIONS
αMSH alpha melanocyte stimulating hormone
°C Degrees Celsius
μL Microlitre
A Adenine
AI Artificial insemination
AMOVA Analysis of molecular variance
Ala Alanine
Arg Arginine
bp Base pair
c. Coding
C Cytosine
CAA Canadian Angus Association
CAGR Canadian Animal Genetic Resources
CAPN1 µ-Calpain
CAST Calpastatin
Cys Cysteine
DAD-IS Domestic Animal Diversity Information System
DNA Deoxyribonucleic acid
dNTP Deoxyribonucleotide triphosphate
EDTA Ethylenediamine tetraacetic acid
ET Embryo transfer
FAO Food and Agriculture Organization
G Guanine
Gly Glycine
He Expected heterozygosity
Ho Observed heterozygosity
HPLC High performance liquid chromatography
HWE Hardy-Weinberg Equilibrium
IGF2 Insulin-like growth factor 2
xii
LEP Leptin
MC1R Melanocortin 1 receptor
MC4R Melanocortin 4 receptor
MCH Melanin concentrating hormone
MgCl2 Magnesium chloride
mL Millilitre
MOET Multiple ovulation embryo transfer
mtDNA Mitochondrial DNA
Na Number of alleles
Ne Expected number of alleles
ng Nanogram
PCR Polymerase chain reaction
PCR-RFLP Polymerase chain reaction restriction fragment length polymorphism
PMCH Pro-melanin concentrating hormone
PrP Prion protein
REA Rib eye area
SNP Single nucleotide polymorphism
T Thymine
TE Tris-ethylenediamine tetraacetic acid
QTL Quantitative trait loci
1
1.0 Introduction
The Angus breed is the most widely utilized beef breed in Canada, based on the
number of animals registered with the Canadian Angus Association each year (Canadian
Beef Breeds Council 2009). The popularity of this breed also extends across the world,
with Angus cattle found in many different countries. While different areas of the world
have diverse beef production systems and consumer preferences, Angus cattle are desired
internationally for their superior production and beef characteristics.
In this study, Canadian Angus cattle were compared to a group of Angus embryo
transfer (ET) calves from eight different countries: Argentina, Australia, Brazil,
Denmark, Ireland, Scotland, Uruguay, and the United States. These two populations were
studied in order to understand the genetic differences between Angus cattle in Canada
and those found throughout the world. Establishing estimates of the genetic variability
existing within breeds allows a breed association to monitor how well their cattle may fit
into a variety of breeding goals. The more diverse a population of animals is the more
potential there exists for change to the breed.
The Canadian and International populations were compared to one another using two
types of genetic polymorphisms: microsatellites and causative single nucleotide
polymorphisms (SNPs) in genes that have been shown to affect production traits in beef
cattle. Estimates of genetic diversity were generated using the two marker types to
determine the existing variability within the breed, to compare Canadian Angus cattle to
those found around the world, and to compare random polymorphisms to those under the
influence of direct or indirect selection.
Genetic diversity in domesticated species, especially highly selected breeds of
livestock, has been investigated recently due to the concern that highly selective breeding
practices may be impacting diversity (Zenger et al. 2006). Characterizing the genetic
variability within livestock breeds may be useful in the conservation of rare breeds, and
also in the maintenance of diversity within commonly used, highly productive breeds.
Several types of genetic markers may be used for measuring diversity. Most often
microsatellite markers are used (MacHugh et al. 1998; Beja-Pereira et al. 2003; Mukesh

2
et al. 2004), as they are highly polymorphic, and are generally considered neutral, or
unaffected by selection (Freeman et al. 2005).
Single nucleotide polymorphisms (SNPs) are changes in a single basepair, which may
or may not cause changes in phenotype. SNPs in non-coding regions of DNA are gaining
popularity in diversity studies, especially when animals are genotyped for thousands of
SNPs, scanning the entire genome (MacEachern et al. 2009). Recently, whole-genome
SNP scans involving thousands of SNPs have been undertaken in an attempt to define
relationships between cattle breeds based on polymorphisms that span the entire genome
(McKay et al. 2008; MacEachern et al. 2009).
Alternatively, causative SNPs may directly affect an animal’s phenotype, causing the
allele frequencies at that SNP to be changed either directly or indirectly by selection for
certain traits. Different selection strategies in separate breeds or even populations of
cattle results in populations which may have different allele frequencies at these SNPs (Li
et al. 2006). The use of causative SNPs that have been shown to affect production traits
in cattle can be very useful in diversity studies to investigate the effects of selection.
Growth traits of beef cattle are considered highly important characteristics as they
directly influence the value of the animal. Birth weight, weaning weight, and yearling
weight are moderately to highly heritable, and have been under selection in beef cattle
(Rasali et al. 2005). It has been suggested that breeding strategies that focus on selection
for specific traits, as well as the use of artificial insemination and embryo transfer, have
decreased genetic variability in beef cattle populations (Vasconcellos et al. 2003).
While many studies use one type of polymorphism to compare breeds and to estimate
genetic diversity, there is little available information comparing two or more different
types of polymorphisms. This study used two different types of polymorphisms to
evaluate which type provides the most useful information regarding different questions
related to genetic diversity. In addition, existing literature often focuses on several breeds
or populations in one region. Little information exists on genetic diversity within breeds,
and the differences between populations of animals belonging to the same breed, but
subjected to different selection criteria and environmental conditions. This study aimed to
integrate information from two types of polymorphisms with respect to two Angus
populations.
3
2.0 Literature Review
2.1 The Angus breed
2.1.1 Breed history and development
The Angus breed was developed in Scotland in the 18th century, although reports
of black, naturally polled cattle in that country date back much further (Briggs and Briggs
1980). The herd book in Scotland was developed in the early 1800s, and although the
Angus breed has been extensively used in the development of other breeds, its own herd
book has remained closed. The early development of Angus cattle by influential breeders
such as Hugh Watson and William McCombie was focused on easy fleshing,
conformation, longevity, and maternal ability (Briggs and Briggs 1980).
Angus cattle were first imported to Canada in 1859 (Briggs and Briggs 1980). The
first Angus bull born in North America was Eye Bright 2nd, born in Guelph on January
12, 1877 (Canadian Angus Association 2009). The Canadian Angus herd book was
established as The Dominion Polled Angus Herd Registry in Toronto in 1884, and was
replaced by the Canadian Aberdeen Angus Association herd book in 1905. In 1996, the
Canadian Angus Association’s offices moved from Ottawa to their present location in
Calgary, Alberta.
2.1.2 Current breed status
According to the Canadian Beef Breeds Council (2009), Angus is the most popular of
the 33 recognized beef breeds in Canada, with the highest number of animals registered
per year (62,283 cattle in 2008) (Canadian Angus Association 2009). The same is true in
the United States, where the American Angus Association registers more cattle (333,766
cattle in 2008) each year than any other beef breed association (American Angus
Association 2009).
Angus breed associations can be found in several other countries. The Aberdeen
Angus Cattle Breeders’ Society of South Africa was formed in 1917, and currently lists
190 purebred producers, as well as an additional 2,300 commercial producers who report
Angus as their predominant breed (Aberdeen Angus Cattle Breeders’ Society of South
4
Africa 2009). Angus associations also exist in Argentina, Australia, Brazil, Chile,
Denmark, England, Ireland, Mexico, New Zealand, Norway, Scotland, Switzerland, and
Uruguay (Canadian Angus Association 2009).
The common themes in the mission statements of these associations, wherever
they are located, is to produce quality Angus cattle on the basis of calving ease,
mothering and milking ability, early maturity, longevity, adaptability, feed efficiency,
and marbling. Each association boasts that the Angus breed is unparalleled in terms of
fertility, hardiness, and desirable carcass size and quality. As a result, many Angus
associations have programs for the specialized marketing of Angus beef. Certified Angus
Beef programs exist in Canada, the United States, Australia, and Ireland. These programs
provide Angus producers with a premium marketing opportunity for their beef.
2.1.3 International movement of Angus genetics
The international transfer of Angus genetics is prevalent, not only within North
America, but between other countries as well. As the breed first developed, most
movement occurred when live animals were imported by countries such as Canada, the
United States, and South Africa from Scotland (Briggs and Briggs 1980). More recently,
Canadian Angus genetics have been utilized to make improvements to the breed in other
countries. For example, the Irish Angus Society credits many recent improvements to the
extensive use of artificial insemination (AI) and Canadian bulls (Irish Angus Society
2009). Events such as the World Angus Forum, which was first held in Sydney,
Australia, in 1969, serve to bring Angus breeders from different countries together, and
emphasize the international nature of the breed.
Due to health and safety concerns, the international movement of live animals is not
as common as it once was. Live Canadian breeding cattle have market access to only 11
countries (Canadian Beef Breeds Council 2009). However, semen and embryos can be
exported more easily, as they can be certified pathogen free by guidelines developed by
Agriculture and Agri-Food Canada (2009). Semen from Canadian beef bulls is exported
to 104 countries around the world, and Canadian embryos are exported to 70 countries
(Canadian Beef Breeds Council 2009). The increased use of AI and ET has resulted in the
need for guidelines and regulations concerning these technologies. Canadian Angus
5
calves that are the product of AI must be sired by bulls that have been parentage verified
by the Canadian Angus Association approved laboratory (Canadian Angus Association
2009). Semen may come from Angus bulls registered in Argentina, Australia, Canada,
Great Britain, New Zealand, South Africa, or the United states as long as the sire is
recorded in the Canadian Angus Association’s herd book before the calf may be
registered (Canadian Angus Association 2009). The dam must also be recorded in the
Canadian Angus herd book. The sire and dam must not be known carriers of the genetic
defects listed by the Canadian Angus Association (2009).
In the case of ET calves, the donor dam and the sire must have DNA on file with the
Canadian Angus Association, and the recipient dam must possess some permanent type
of identification (Canadian Angus Association 2009). Parentage verification is required
on one calf from each single-sire embryo flush, and on every calf if multiple sires were
used. Embryos from foreign countries must have both their sire and dam recorded with
the Canadian Angus Association before they can be considered for registration (Canadian
Angus Association 2009).
The popularity of the Angus breed, both within Canada and internationally, raises the
question of what similarities and differences exist within Angus populations around the
world. The intense focus on selection for production traits within the breed suggests that
genetic differences may be found in Angus populations depending on the production
systems and consumer demands of each country. Because Angus genetics are highly
valued for purebred purposes, and for the development and improvement of other beef
breeds, maintaining genetic diversity within the Angus breed, while selecting animals for
production, should be a priority for Angus associations and breeders.
2.2 Polymorphisms affecting production traits in cattle
SNPs in six genes were chosen for this study, each of which has been shown to be
associated with a growth or carcass quality trait in beef cattle (Table 2.1). Genes that
have been shown to affect growth and carcass traits were chosen because these are
probably the most important considerations for Canadian beef producers.

6
Table 2.1. Six SNPs that affect growth and carcass traits in beef cattle.
Gene Chromosome SNP Allele
FrequencyTrait
LEP 4 Arg25Cys 50:50 Fat IGF2 29 c.-292C>T 80:20 Rib-eye area MC1R 18 ED/E+/e 90:9:1 Color & early growth PMCH 5 -134A>T 70:30 Fat CAPN1 29 Ala316Gly 77:23 Beef tenderness CAST 7 c.2959A>G 95:5 Beef tenderness
2.2.1 LEP
Leptin is the hormone product of the obese or leptin (LEP) gene (Stone et al.
1996). It functions to regulate appetite and influence body composition, in particular, the
deposition of fat (Buchanan et al. 2002; Kononoff et al. 2005). Leptin is synthesized by
adipocytes and has been mapped to bovine chromosome 4 (Stone et al. 1996).
A SNP in exon 2, R25C, was identified by Fitzsimmons (1999). The SNP changes
an arginine to a cysteine. The T allele causes cysteine and is positively correlated to
animals with more rapid fat deposition (Buchanan et al. 2002; Kononoff et al. 2005).
Kononoff et al. (2005) found that cattle homozygous for the T allele graded AAA 7%
more often than C/T or C/C animals.
The probable effect of selection on LEP allele frequencies is a complex issue.
While genetic testing for this SNP is available, the results are most often used by feedlot
operators to sort feeder cattle in order to reduce days on feed for T/T animals, which tend
to deposit backfat more quickly (Buchanan et al. 2002) and therefore finish earlier.
Angus producers may use LEP genotype as a marketing tool for bulls, which would
likely have an effect on allele frequencies. However, the majority of commercial cattle
producers in Canada do not retain ownership of their animals to the point of finishing.
Although these producers would not benefit from actively selecting for fat deposition,
other benefits may be a direct advantage to cow-calf producers.
7
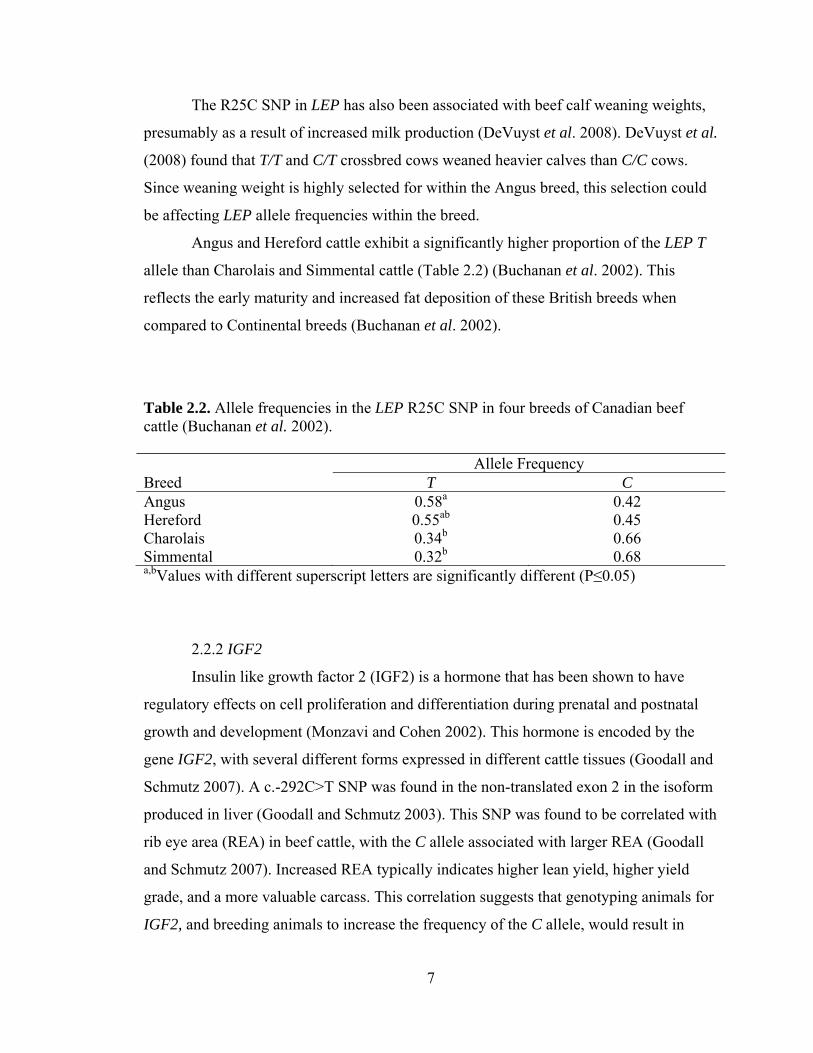
The R25C SNP in LEP has also been associated with beef calf weaning weights,
presumably as a result of increased milk production (DeVuyst et al. 2008). DeVuyst et al.
(2008) found that T/T and C/T crossbred cows weaned heavier calves than C/C cows.
Since weaning weight is highly selected for within the Angus breed, this selection could
be affecting LEP allele frequencies within the breed.
Angus and Hereford cattle exhibit a significantly higher proportion of the LEP T
allele than Charolais and Simmental cattle (Table 2.2) (Buchanan et al. 2002). This
reflects the early maturity and increased fat deposition of these British breeds when
compared to Continental breeds (Buchanan et al. 2002).
Table 2.2. Allele frequencies in the LEP R25C SNP in four breeds of Canadian beef cattle (Buchanan et al. 2002).
Allele Frequency Breed T C Angus 0.58a 0.42 Hereford 0.55ab 0.45 Charolais 0.34b 0.66 Simmental 0.32b 0.68 a,bValues with different superscript letters are significantly different (P≤0.05)
2.2.2 IGF2
Insulin like growth factor 2 (IGF2) is a hormone that has been shown to have
regulatory effects on cell proliferation and differentiation during prenatal and postnatal
growth and development (Monzavi and Cohen 2002). This hormone is encoded by the
gene IGF2, with several different forms expressed in different cattle tissues (Goodall and
Schmutz 2007). A c.-292C>T SNP was found in the non-translated exon 2 in the isoform
produced in liver (Goodall and Schmutz 2003). This SNP was found to be correlated with
rib eye area (REA) in beef cattle, with the C allele associated with larger REA (Goodall
and Schmutz 2007). Increased REA typically indicates higher lean yield, higher yield
grade, and a more valuable carcass. This correlation suggests that genotyping animals for
IGF2, and breeding animals to increase the frequency of the C allele, would result in

8
higher quality carcasses. Carcass composition plays a major role in carcass based pricing,
so producers selecting animals for increased rib eye area would benefit when marketing
beef on a carcass pricing basis. However, since the desirable C allele is already found at a
frequency of 80% in beef cattle, there is perhaps little opportunity to increase the
frequency of this allele, and therefore to increase rib eye area (Goodall and Schmutz
2003).
2.2.3 MC1R
Melanocortin 1 receptor (MC1R) is expressed on the surface of melanocytes
(Cone et al. 1996) and has been mapped to cattle chromosome 18 (Werth et al. 1996).
When the ED allele is present, as a result of the L99P amino acid substitution, MC1R
binds alpha-melanocyte-stimulating hormone (αMSH) (Klungland et al. 1995). This
results in production of the pigment eumelanin, which causes black coat color (Klungland
et al. 1995). When MC1R does not bind αMSH, phaeomelanin is produced, which causes
red coat color (Klungland et al. 1995). Red cattle have an e/e genotype. The e allele
results from a guanine deletion at nucleotide 310, which causes a frameshift that results
in a premature stop codon, and a nonfunctional MC1R protein (Joerg et al. 1996). The E+
“wild type” or ancestral allele allows either eumelanin or phaeomelanin to be produced.
It has been postulated by McLean and Schmutz (2009) that when αMSH is not
bound to MC1R, it binds to MC4R, decreasing appetite and subsequent growth in cattle.
MC4R has been shown by Huszar et al. (1997) to affect appetite and growth in mice. The
ED allele was associated with increased back fat and more rapid finishing, while the e
allele was associated with slower fat deposition (McLean and Schmutz 2009). Red cattle
were also found to be lighter at the beginning of the backgrounding period than black
cattle.
Because coat color is a highly visible trait, breeders may select for this, and
therefore also indirectly select for MC1R genotype. In Canada, red and black Angus are
considered a single breed, and are registered in the same herd book (Canadian Angus
Association 2009). This is similar in Australia, Brazil, Uruguay, and South Africa.
However, this is not the case in all Angus associations. The American Angus Association
(2009) registers only black animals, and known red carriers must be identified. The Red
9
Angus Association of America maintains its own separate association and herd book
(Red Angus Association of America 2009). This is similar in Chile, Denmark, and
Norway, where separate registries are maintained for red and black animals. In Scotland
and Ireland, only Aberdeen (black) animals are permitted in the registry.
2.2.4 PMCH
Melanin concentrating hormone (MCH) stimulates feed intake and modulates
metabolism in rodents (Shimada et al. 1998) and humans (Gavrila et al. 2005). The gene
that encodes this protein, Pro-Melanin-Concentrating Hormone (PMCH), was
characterized in cattle by Helgeson and Schmutz (2008) and mapped to cattle
chromosome 5 by Stone et al. (2002). A g.-134A>T SNP identified by Helgeson and
Schmutz (2008) was associated with fat deposition in beef cattle. The A allele at this SNP
was associated with increased grade fat and average fat, while the T allele was associated
with less fat. The A allele was found in higher frequency in Angus cattle (0.83) than in
other breeds (0.64 for Hereford, 0.73 for Charolais, and 0.42 for Simmental).
As previously discussed for LEP, PMCH genotype is probably not directly
influenced by active selection for fat deposition. Selecting animals for breeding based on
PMCH genotype would only benefit cattle breeders if they were retaining animals
through the finishing stage. Because most breeders do not receive any feedback on
finishing performance and carcass traits, this type of selection is currently not widely
practiced. With the recent use of radiofrequency tagging for traceability and food safety
reasons, the opportunity exists for more performance and carcass data to be returned to
breeders, who could in turn use this information for selection purposes in the future.
While this technology suggests the possibility of increased information transfer between
the levels of the production chain, logistical problems and the costs involved in the
information transfer are daunting obstacles at present.
2.2.5 CAPN1
The micromolar calcium-activated neutral protease gene (CAPN1) encodes the
protease µ-calpain which is thought to be the most important protease in postmortem

10
meat tenderization (Koohmaraie 1996). This process is essential to the tenderness of beef,
which is a primary concern of consumers. The Ala316Gly SNP reported by Page et al.
(2002) is a G/C SNP in exon 9 which causes an amino acid substitution. The C allele
occurs in 23-68% of cattle, depending on breed, and is correlated with reduced Warner-
Bratzler shear force values, or more tender beef (Morris et al. 2006).
Beef tenderness is another characteristic that is potentially very economically
important to the beef industry, but is difficult to select for. Because beef tenderness
cannot be measured in live animals, cattle breeders do not receive the carcass information
that they would require in order to select for more tender beef. Because tenderness is
evaluated using Warner-Bratzler shear test measurements, which are performed on
cooked beef, it would be illogical to test the tenderness of each carcass. It is important to
keep in mind that tenderness varies even between cuts from the same carcass.
Additionally, physical and environmental conditions pre and post-slaughter also affect
tenderness. Even if tenderness data were available to breeders, it would only be
economically beneficial to select for tenderness if producers were retaining ownership
through the finishing phase, and selling beef on the basis of carcass quality. For the
majority of beef producers who market weaned calves based on live weight alone, this is
not feasible.
Recently, some DNA tests for beef tenderness have been commercialized.
GeneStar Tenderness (Pfizer Genetic Soulutions 2009) and Igenity Tenderness (Igenity
2009) test for two different SNPs in CAPN1, and one SNP in CAST. In a third party
validation study of these tests, Van Eenennaam et al. (2007) found the scores from both
tests to be highly and significantly associated with beef tenderness. These findings
indicate that bulls marketed on the basis DNA testing for these SNPs have the potential to
influence the allele frequencies of these genes.
2.2.6 CAST
Calpastatin is encoded by the CAST gene and inhibits µ-calpain (Koohmaraie 1996).
Barendse (2002) reported a c.2959A>G SNP at the CAST gene where the A/A genotype
was correlated with lower Warner-Bratzler shear force measurements compared to the
A/G genotype (Morris et al. 2006). That is, A/A animals exhibit lower levels of
11
calpastatin, causing greater µ-calpain activity during post-mortem meat tenderization
(Koohmaraie 1996). The A allele occurs with a frequency of 84-95% in Bos taurus cattle
(Morris et al. 2006). Van Eenennaam et al. (2007) also found significant correlations
between genotype at the c.2959A>G SNP and tenderness in a study validating
commercially available genetic marker panels.
With the development of DNA tests for beef tenderness, CAPN1 and CAST allele
frequencies may be increasingly impacted by selection through the testing and marketing
of Angus bulls based on such tests.
2.3 Genetic diversity
2.3.1 Genetic diversity in cattle
Genetic diversity has long been a concern for wild animals, and even for
livestock when associated with rare breeds. Recently, however, more attention has been
given to the importance of assessing genetic diversity within commonly used breeds of
livestock (Zenger et al. 2006). This interest has developed for a variety of reasons. First,
the intense selection within major breeds of cattle for very specific production traits has
potentially decreased the natural variability within these breeds for specific traits. Notter
(1999) stated that selection for increasingly standardized products (beef and milk) and
standardized production conditions may be decreasing diversity. While beef cattle may be
less affected than dairy, because they are raised in a wide variety of environmental
conditions, and because AI is not used as extensively in beef cattle, variability may still
be affected.
Alfonso et al. (2006) investigated the effects of selection on genetic diversity,
using populations of sheep that had undergone intense selection against susceptibility to
scrapie. They compared populations of Latxa sheep, a dairy breed, in Spain and France.
Some populations had been subjected to selection against scrapie susceptibility through
the use of rams with the ARR/ARR genotype at the prion protein (PrP) gene. This allele
has been associated with decreased susceptibility to prion diseases in sheep (Alfonso et
al. 2006).

12
The classical and perhaps most important application of genetic testing in
livestock has been to identify carriers or animals susceptible to a specific disease, in an
attempt to exclude such animals from the population. This application continues to be of
great importance from an animal health and production perspective. Additionally, it
provides the opportunity to study the effects of intense selection on genetic diversity.
Using pedigree information as well as 15 microsatellite markers, Alfonso et al. (2006)
found that genetic diversity had not significantly decreased within the breed based on Fst
values, which measures the heterozygosity of the population relative to all populations
(Peakall and Smouse 2006). However, they suggested that a greater effect on diversity
may be evident if the ewes were also being selected on the basis of PrP genotype, and
that caution should be exercised when subjecting a breed to such selection pressure.
In cattle, some research that has been done on genetic diversity within breeds has
been based on pedigree information and measures of inbreeding (Cleveland et al. 2005).
While this approach results in an overview of the breed’s effective population size (Ne),
which has served as a benchmark of diversity (Cleveland et al. 2005), it does not reveal
what is actually happening on a molecular level.
Zenger et al. (2006) tested the genetic diversity within the Holstein breed within
Australia, and around the world. This breed has undergone intense selection for milk
yield, through the extensive use of a relatively small number of elite sires via artificial
insemination (AI). They found, using a large panel of SNPs, that genetic diversity had not
decreased within the breed from 1975 to 1999, despite intense selection. However, their
study did find that, due to the extensive exportation of semen from the United States, the
global Holstein population was virtually one unit, with Nei’s genetic distances of only
0.004 between populations (Zenger et al. 2006). Although a threat to genetic diversity
within this breed was not evident, Zenger et al. (2006) did find that the effective
population size of the breed was around 125 animals, which is not sufficient to ensure
variability over the long term (Georges and Andersson 1996; Frankham et al. 2002).
Most studies of genetic diversity in cattle compare different breeds within a
region. The majority of this research concludes that a high proportion of the total genetic
diversity can be explained within breeds (Ruane 1999; Li et al. 2006; MacNeil et al.
2007). In other words, the genetic diversity found within breeds today was found within
13
cattle prior to breed formation. The exception to this generalization is when small
populations of cattle have been isolated. MacNeil et al. (2007) studied feral cattle on
Chirikof Island, Alaska. They found that 14% of the total genetic variation was due to
differences between this population and non-isolated cattle found on the mainland, using
frequency statistics based on a panel of 34 microsatellites. Brenneman et al. (2007) also
found large differences between 4 breeds of Bos taurus and Bos indicus cattle in South
America, with 24% of variation attributed to breed differences, using allele frequencies of
26 microsatellites.
While many studies have compared different breeds to one another in the same
location, there is little information available on the differences between animals of the
same breed located in different environments. Conservation of livestock genetics is
becoming a priority because the highly selected breeds of livestock that are being
developed under modern production and environmental conditions may lose the genetic
variability that would allow them to be useful under future conditions. Programs such as
the FAO’s Integrated Programme for the Global Management of Genetic Resources
(CaDBase http://www.projects.roslin.ac.uk/cdiv.markers.html.), and Agriculture and
Agri-Food Canada’s Animal Genetic Resources program have been developed in order to
better understand animal genetic diversity, and to conserve genetic resources for the
future (Martin-Burriel et al. 1999).
Besides characterization of diversity and preservation of rare or potentially useful
genetics, measures of genetic diversity in cattle can be used for other purposes. Sasazaki
et al. (2007) used six SNPs with Bos indicus-specific alleles to verify the accuracy of
country-of-origin labeling in Japanese beef. They found that beef could be identified as
domestic or imported (from Australia) 93% of the time, based on the assumption that any
Bos indicus influence came from Australia (Sasazaki et al. 2007). With food traceability
and food safety concerns ever increasing, this technology has great potential for further
development and use.
2.3.2 Polymorphism types for studying diversity
Over the years, several different types of markers have been used for
studying the diversity, breed structure, and domestication history of cattle. Before the
14
development of DNA technologies, polymorphisms in various proteins and blood groups
were often used in diversity studies (Bowcock et al. 1994; MacHugh et al. 1997).
As the capacity to amplify and analyze DNA grew, researchers in diversity began
to use mitochondrial DNA (mtDNA) more extensively. Mitochondrial DNA is maternally
inherited, extranuclear DNA (Taanman 1999). The D-loop region of mtDNA is non-
coding, but plays an important role in transcription and replication (Brown et al. 1979;
Schutz et al. 1994). This region was found to be extremely useful for phylogenetic
analysis because it experiences five to ten times more nucleotide substitutions than
nuclear DNA (Brown et al. 1979).
Because mtDNA is maternally inherited only, it is not complicated by
recombination (Henkes et al. 2005). The D-loop region of mtDNA was widely used for
phylogenetic studies that focused on determining the time and location of the
domestication of cattle and the development of breeds. Loftus et al. (1994) used mtDNA
to conclude that cattle of Bos taurus and Bos indicus origin were domesticated
independently, in two separate events. Other studies used D-loop sequence to establish
relationships between cattle breeds (Kim et al. 2003), and to investigate the geographical
patterns of domestication (Bradley et al. 1996) and breed development (Henkes et al.
2005).
Microsatellites have also been widely used in phylogenetic and diversity studies
of livestock. Microsatellites are short repeats, usually of 2 base pairs in cattle (Ellegren et
al. 1997). It is thought that these repeats are formed by “replication slippage”, where
repeated sequence is either lost or gained in a step by step manner (Forbes et al. 1995).
These markers are very desirable for measuring genetic diversity because they are highly
polymorphic, and because they appear in non-coding regions of DNA. Therefore, they
are generally assumed to exhibit selective neutrality (Ellegren et al. 1997). In other
words, they are assumed to be unaffected by natural or artificial selection unless closely
linked to genes are affected by selection.
Bowcock et al. (1994) used microsatellites to show variation in human
populations, where previous studies had used blood groups or mtDNA. Since that time,
these markers have been extensively used for phylogenetic research in humans and many
species of wild and domesticated animals. Many studies using microsatellites focused on
15
relationships between breeds of cattle and geographical patterns of domestication
(MacHugh et al. 1997; MacHugh et al. 1998; Kantanen et al. 2000). More recently, the
studies using microsatellites have focused on evaluating the diversity within breeds for
the purpose of conserving rare or unique genetics (Vitalis et al. 2001, Beja-Pereira et al.
2003; Freeman et al. 2005; Brenneman et al. 2007; MacNeil et al. 2007). Relatively
recent concern with genetic diversity within breeds of livestock has, in particular, led to
the use of microsatellite markers to assess whether selective breeding has impacted
diversity (Vitalis et al. 2001).
When microsatellites are used to study genetic diversity, the number of loci that
are used affects the outcome. Ruane (1999) reviewed the use of genetic distance studies
in conservation genetics. He found that at least 20 microsatellite markers, with four to ten
alleles each, were necessary for unbiased estimates of genetic distance. Fewer markers
can lead to overestimation of genetic distance (Ruane 1999). Freeman et al. (2005) also
raised the issue of the use of different microsatellite panels for each study. They proposed
a regression-based method to combine data from different studies, which used different
markers. In an effort to obtain comparable results between studies, the Food and
Agriculture Organization (FAO) published a list of recommended microsatellite markers
for genetic characterization of several species (CaDBase
http://www.projects.roslin.ac.uk/cdiv/markers.html). This resource was used by the
Canadian Animal Genetic Resources Program (CAGR) to develop their 30 marker
microsatellite panel for livestock conservation purposes. A subset of 22 of the CAGR’s
markers were used in this study and were chosen based on ease of genotyping and quality
of the resulting sequence, as assessed by previous studies.
While microsatellite markers are usually considered neutral, or unaffected by
selection, some studies have found microsatellites that are linked with QTL for important
production traits. Coppieters et al. (1998) and Kantanen et al. (2000) found that certain
microsatellites were influenced by selection while studying diversity. These
microsatellite markers were found to reside within QTL for milk production
characteristics. When using microsatellites for diversity studies, one must consider that
they may be affected by selection if they are linked to genes that affect phenotype, and
are thereby influenced by selection.
16
Another type of polymorphism that is commonly used in the study of diversity is
single nucleotide polymorphisms (SNPs). The types of SNPs used fall under two major
categories. First, SNPs known to be causative mutations associated with production or
other traits in cattle are sometimes used (Vasconcellos et al. 2003; Li et al. 2006).
Because these SNPs are associated with measurable or visual phenotypes, it can be
assumed that they are either directly or indirectly influenced by natural or artificial
selection. When breeds of cattle are subjected to different selection pressures, the allele
frequencies of these causative SNPs may reflect that selection (Li et al. 2006). SNPs
should therefore be useful in determining the effects of selective breeding on diversity,
and may provide more information than microsatellites for the purpose of differentiating
between breeds or populations of cattle.
The second way that SNPs are used in the study of genetic diversity is high
density SNP maps or panels, consisting of very large numbers of polymorphisms that
may or may not be associated with any phenotype (McKay et al. 2008; MacEachern et al.
2009). These SNP panels are constructed to represent the full genome (Akey et al. 2002;
Zenger et al. 2006; The Bovine HapMap Consortium 2009).
McKay et al. (2008) used 2,641 SNPs to assess population structure in eight cattle
breeds, representing both Bos taurus and Bos indicus animals. Their study, using a
Bayesian approach, found that 100 SNPs were required in order to produce results similar
to 30 microsatellites when assigning individual animals to the correct breed cluster. This
type of comparison is useful for determining which polymorphism type should be chosen
for diversity studies. Knowing whether SNPs or microsatellites will provide more
information for a specific measure of diversity can increase the usefulness of the analysis.
In this study, two types of polymorphisms were chosen to evaluate genetic
diversity. First, six SNPs which have been associated with production and carcass traits
in beef cattle were chosen in previous studies to evaluate the impact of artificial selection
on the diversity of Angus cattle. These SNPs were chosen based on their associations
with growth and carcass traits. Secondly, the panel of 22 microsatellites were chosen as
neutral markers to assess diversity without the influence of selection.
17
2.4 Hypotheses
The objective of this study was to determine if Canadian Angus cattle are
significantly different than International Angus cattle at specific genes recently shown to
affect traits of economic importance. Additionally, this study aimed to evaluate the
genetic diversity within the Angus breed using two types of polymorphisms.
I hypothesized that the Canadian Angus population would not be significantly
different from the International population based on allele frequencies of SNPs associated
with production traits. I expected, although these cattle were the products of different
environments and were likely selected under differing criteria, that Angus genetics are
similar around the world, and that the two groups would not vary significantly.
I expected to find that genetic diversity would be higher when assessed using
microsatellite markers than when using causative SNPs, based on the polymorphic nature
of microsatellite markers compared to SNPs, and due to the possible effects of selection
on the SNP allele frequencies.
18
3.0 Materials and Methods
3.1 Populations
Two populations were used for this study. The International population consisted
of 26 calves born in May and June of 2008 (Appendix A). These calves originated from
eight different countries, and were imported as embryos in 2007 for the Canadian Angus
Association’s International Embryo Program to be exhibited at the World Angus Forum
in July, 2009, in Calgary, Alberta. The embryos were transferred to Canadian Angus
recipient cows on August 24, 2007 at Remington Cattle Company, Del Bonita, Alberta.
Blood was collected from these calves on June 25, 2008, and coat color was
recorded at that time. DNA based parentage verification was performed in 2009, and 23
were registered with the Canadian Angus Association. DNA was not available for
parentage verification from the sire of the remaining calves, therefore, they could not be
registered. All embryo transfer calves must be parentage verified in order to be
registered with the Canadian Angus Association. Because embryos from multiple
ovulation embryo transfer (MOET) flushes were provided by most countries participating
in the International Embryo Program, some calves in this population were full siblings
(Appendix A).
The Canadian population consisted of 107 cows that were purchased by the
Western Beef Development Centre in 2007 as two and three year olds, as well as 57 bulls
from which blood was collected and genomic DNA extracted in 1992-1994. The cows
were purchased from seven ranches in western Canada, and therefore some were half
siblings. In addition, 52% of these cows were sired by American bulls. The bulls of the
Canadian population were obtained from a wide variety of ranches, and were assumed
not to be closely related based on the fact that they did not share tattoo letters.
Both populations consisted of purebred Angus cattle registered with the Canadian
Angus Association. Both red and black Angus were represented in each population.
An additional population of animals was used in the calculation of Nei’s genetic
distance, in order to compare the International and Canadian Angus populations to
Canadian animals representing eight common cattle breeds. Seven hundred and fifty-two
animals representing eight cattle breeds were used to produce genetic distances. These
19
animals were randomly selected within breeds from an existing genotype database
developed for a previous diversity study by the CAGR. They included: 100 Angus, 100
Blonde d’Aquitaine, 101 Gelbvieh, 101 Hereford, 101 Holstein, 101 Limousin, 101
Simmental, and 48 Belgian Blue animals. All were registered within their respective
Canadian breed associations. Because the genotypes of these cattle were randomly
chosen from a large data set, the animals are unlikely to be closely related to each other.
They had been genotyped at 12 microsatellite markers according to the methods
previously described here. These markers were selected from the bovine microsatellite
markers recommended by the FAO, and with the exception of three markers, were the
same microsatellites that were used in the rest of this study (Appendix F). This additional
genetic distance data was used to illustrate the differences between cattle breeds, in order
to provide a reference for the distances found between the two Angus populations in this
study.
3.2 DNA extraction
Genomic DNA was extracted from whole blood collected in EDTA using the
method described by Schmutz et al. (1995) for the International population, and the cows
of the Canadian population (Appendix B). DNA from the bulls in the Canadian
population was extracted previously according to the same method and stored at -80 °C
prior to use in this study.
3.3 PCR – RFLP
Polymerase Chain Reaction Restriction Fragment Length Polymorphism (PCR-
RFLP) assays were performed based on previously described methods for MC1R
(Klungland et al. 1995; Joerg et al. 1996), LEP (Buchanan et al. 2002), IGF2 (Goodall
and Schmutz 2003), and PMCH (Helgeson and Schmutz 2008). PCR-RFLP tests were
developed for CAPN1 (Page et al. 2002) and CAST (Barendse 2002) based on published
sequence for previously reported SNPs.
For each PCR-RFLP assay, 1 µl of genomic DNA (25-50 ng) suspended in 1x TE
buffer was added to a 14 µl reaction consisting of 0.3 µl 10 mM dNTPs, 0.9 µl 1.5mM
MgCl2, 10 pmol of each the forward and reverse primer (Appendix C), 1.5 µl 10x PCR
20
buffer, 0.1 µl 5U/ µl Taq Polymerase (Invitrogen, Carlsbad, CA, USA), and 9.2 µl of
dH2O.
Each PCR reaction consisted of 4 minutes denaturation at 94 °C, 30-37 cycles of
50 seconds at 94 °C, 50 seconds at the appropriate annealing temperature, 50 seconds at
72 °C, and a final 4 minute dwell at 72 °C (Appendix C). A Stratagene® RoboCycler®
was used for all PCR reactions.
Restriction enzyme digests were performed using 0.8 µl of enzyme, 1.5 µl of the
appropriate buffer, and 0.2 µl of dH2O added to the 15 µl of PCR product. The digest was
incubated at the appropriate temperature for the restriction enzyme for three hours
(Appendix D). Restriction digest products were electrophoresed on agarose gels
(Cambrex), with the exception of the PMCH assay, which utilized a 4% DNA agar gel
(Marine Bioproducts, Delta, B.C.). Gels were stained with ethidium bromide, and bands
were visualized under UV light and photographed for genotype determination. Genotypes
that could not be confidently determined following initial PCR-RFLP were redone
according to the same method. Genotypes for all animals at each SNP were satisfactorily
attained within three attempts.
PCR-RFLP for MC1R was performed in two steps. The first PCR was done using
primers P6 and P7 from Joerg et al. (1996). The PCR product was digested with Msp I
(Fermentas). This test distinguished the ED and E+ alleles from the e allele at the
Tyr155ter SNP (Klungland et al. 1995). The primers E5 and E6 from Klungland et al.
(1995) were then used with Ssi I (Fermentas). This test distinguished the ED allele from
the E+ allele at the Leu99Pro SNP (Klungland et al. 1995).
PCR-RFLP for LEP was done following the procedure outlined by Buchanan et
al. (2002) for the Arg25Cys SNP. IGF2 was genotyped according to the method of
Goodall and Schmutz (2003) for the c.-292C>T SNP. Animals were genotyped for
PMCH according to the method developed by Helgeson and Schmutz (2008) for the
-134A>T SNP.
CAPN1 primers were designed based on published sequence (AF_248054) for the
Ala316Gly SNP reported by Page et al. (2002) (Appendix C). The 100 bp PCR product
was digested with Bse DI (Fermentas), resulting in fragments of 26 and 75 bp when the G
allele was present, and fragments of 15, 26, and 60 bp when the C allele was present.
21
Primers were designed from published sequence (NC_007305) to amplify the
c.2959A>G SNP in CAST, discovered by Barendse (2002). RFLP was conducted using
Hpy F3I (Fermentas). The A allele resulted in 61 and 106 bp fragments following
digestion, while the G allele resulted in a 169 bp fragment.
3.4 Microsatellite genotyping
The panel of 22 microsatellite markers used in this study was selected by Dr.
Yves Plante of the Canadian Animal Genetic Resources program (CAGR) for diversity
studies (Appendix E). These markers were recommended by the Domestic Animal
Diversity Information System (DAD-IS) of the Food and Agriculture Organization of the
United Nations (FAO) (FAO 2009). The FAO’s list of recommended microsatellite
markers for bovine diversity studies consisted of 30 markers, of which 22 were chosen
for this study based on quality of genotyping results from previous studies conducted by
the CAGR. Both populations were genotyped for the 22 microsatellite markers according
to the following method:
1 µl (50 ng) of genomic DNA suspended in 1x TE was added to a PCR cocktail
consisting of 0.3 µl of each the forward and reverse primer (10 pmol / µl), 7.5 µl of
AmpliTaq Gold Master Mix (Applied Biosystems), and 4.9 µl of HPLC grade dH2O.
PCR was performed on a MyCycler® thermal cycler (Bio-Rad). Each reaction consisted
of 7 minutes at 95 °C, then 40 cycles of 20 seconds at 95 °C, 30 seconds at the
appropriate annealing temperature, and 1 minute at 72 °C, followed by a final 7 minute
dwell at 72 °C (Appendix E).
1 µl of PCR product was then diluted with 49 µl of HPLC grade dH2O, and 1 µl
of this dilution was added to 0.3 µl of Gene Scan 600 LIZ size standard (Applied
Biosystems) and 8.7 µl formamide. The product was denatured at 95 °C for five minutes,
then run on a 3130 xl Genetic Analyzer (Applied Biosystems). Determination of alleles
was done using GeneMapper 3.7 (Applied Biosystems 2004). Samples for which alleles
could not be readily determined were repeated and reanalyzed according to the above
protocol. When alleles could not be confidently determined after three attempts, the
sample was left as a blank for that marker.
22
3.5 Statistical analysis
SNP allele frequencies for the two populations were compared using Chi-Square
analysis in Statview 5.0. Deviation from Hardy-Weinberg equilibrium was tested for both
SNP and microsatellite data using GeneAlEx 6.1 (Peakall and Smouse 2006).
Analysis of population structure was performed with Structure 2.1 (Pritchard et al.
2000). A Bayesian clustering admixture method was used to determine K, or the number
of separate genetic clusters, that were present in the data when the number of existing
populations was not provided. The results of this analysis were used as the basis for the
decision to utilize two populations in subsequent analysis. Originally, three populations
were proposed, but two Canadian populations were combined after population structure
analysis determined that they were not discrete from one another.
Population assignment analysis was performed using GeneAlEx 6.1 (Peakall and
Smouse 2006). Population assignment was calculated by log likelihood of the allele
frequency at each locus, resulting in the classification of each animal as being most likely
to belong to either its own population, or the other population. Individual assignment was
therefore the probability of a randomly selected animal being assigned to the correct
population.
Analysis of molecular variance (AMOVA), observed and expected
heterozygosity, observed and effective number of alleles, frequency statistics (Fis, Fit, and
Fst), were calculated with GeneAlEx 6.1. AMOVA determines the total molecular
variation within the data, with the null hypothesis that there is no difference between
populations. This total variation is then partitioned between and among populations.
Pairwise population matrices of Nei’s genetic distance were produced using
GeneAlEx 6.1 (Peakall and Smouse 2006). In addition to the two populations used in this
study, 752 additional animals representing eight cattle breeds were used to produce
genetic distances.
All genetic analyses were performed separately for SNP data and for
microsatellite data so that the results of the two types of polymorphisms could be
compared.
23
4.0 Results
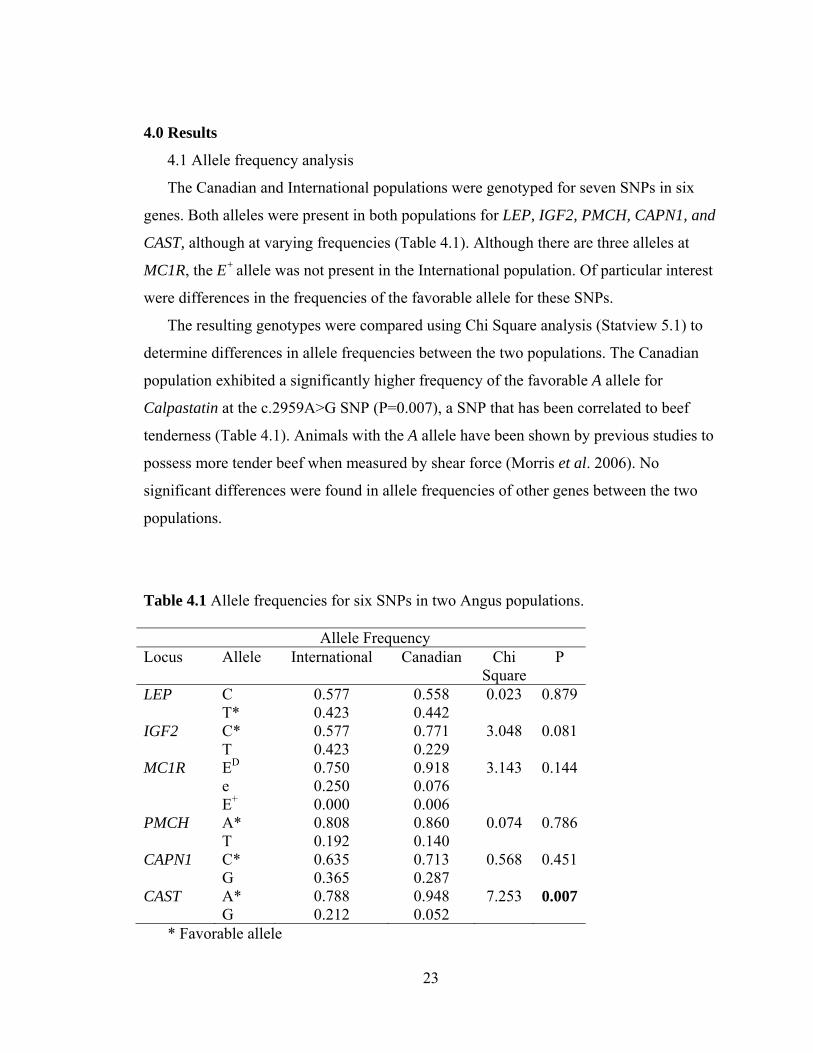
4.1 Allele frequency analysis
The Canadian and International populations were genotyped for seven SNPs in six
genes. Both alleles were present in both populations for LEP, IGF2, PMCH, CAPN1, and
CAST, although at varying frequencies (Table 4.1). Although there are three alleles at
MC1R, the E+ allele was not present in the International population. Of particular interest
were differences in the frequencies of the favorable allele for these SNPs.
The resulting genotypes were compared using Chi Square analysis (Statview 5.1) to
determine differences in allele frequencies between the two populations. The Canadian
population exhibited a significantly higher frequency of the favorable A allele for
Calpastatin at the c.2959A>G SNP (P=0.007), a SNP that has been correlated to beef
tenderness (Table 4.1). Animals with the A allele have been shown by previous studies to
possess more tender beef when measured by shear force (Morris et al. 2006). No
significant differences were found in allele frequencies of other genes between the two
populations.
Table 4.1 Allele frequencies for six SNPs in two Angus populations. Allele Frequency Locus Allele International Canadian Chi
SquareP
LEP C 0.577 0.558 0.023 0.879 T* 0.423 0.442 IGF2 C* 0.577 0.771 3.048 0.081 T 0.423 0.229 MC1R ED 0.750 0.918 3.143 0.144 e 0.250 0.076 E+ 0.000 0.006 PMCH A* 0.808 0.860 0.074 0.786 T 0.192 0.140 CAPN1 C* 0.635 0.713 0.568 0.451 G 0.365 0.287 CAST A* 0.788 0.948 7.253 0.007 G 0.212 0.052
* Favorable allele
24
Within the Canadian population, it was noted that 52% of the cows had been sired by
American bulls. While this was not surprising, as extensive movement of Angus genetics
occurs within North America, it suggested a potential subdivision within the Canadian
population. As a result, these cows with American sires were separated from the
remainder of the Canadian population, and additional allele frequency analysis was
performed, comparing these cows to the other animals in the Canadian population. No
significant differences were found in allele frequencies for the SNP data, so these cows
were retained within the Canadian population for the remaining analyses.
4.2 Test for deviation from Hardy-Weinberg equilibrium
The SNPs chosen for this study were selected based on their association with traits
important in beef production and carcass characteristics. Because the allele frequencies of
these SNPs are assumed to be indirectly affected by selection of beef cattle for production
traits, they would not be expected to adhere to Hardy-Weinberg equilibrium (HWE),
which assumes random mating and the absence of selection. Deviation from HWE was
tested using Chi Square analysis (Statview 5.1) to test for significant differences between
observed and expected genotype frequencies, in order to determine whether observed
genotype frequencies had been affected by selection or some other factor. This analysis
showed significant deviation from HWE (Tables 4.2 and 4.3) in both populations at
MC1R Tyr155ter and Leu99Pro, which are the alleles affecting coat color.
25
Table 4.2 Test for deviation from Hardy-Weinberg Equilibrium for the International population (n=26) based on six genes using Chi Square analysis. Locus Genotype Observed Expected Chi Square P
n n LEP CC 7 9 1.39 0.4999 CT 16 13 TT 3 4 IGF2 CC 6 9 3.93 0.1406 CT 18 13 TT 2 4 PMCH AA 18 17 2.25 0.3247 AT 6 8 TT 2 1 MC1R EDED 18 16 20.25 0.0001 EDe 3 9 ee 5 1 CAPN1 CC 11 10 0.18 0.9124 CG 11 12 GG 4 4 CAST AA 16 16 0.00 1.0000 AG 9 9 GG 1 1
P≤0.05 indicates significant deviation from HWE
26
Table 4.3 Test for deviation from Hardy-Weinberg Equilibrium for the Canadian population (n=164) based on six genes using Chi Square analysis. Locus Genotype Observed Expected Chi Square P
n n LEP CC 47 51 1.88 0.392 CT 89 80 TT 28 33 IGF2 CC 102 98 3.00 0.223 CT 49 58 TT 13 8 PMCH AA 123 122 1.44 0.487 AT 37 39 TT 4 3 MC1R EDED 142 136 9.42 0.009 EDe 15 26 ee 5 2 CAPN1 CC 92 86 5.40 0.067 CG 53 65 GG 19 13 CAST AA 149 148 1.27 0.529 AG 13 13 GG 2 2 P≤0.05 indicates significant deviation from HWE
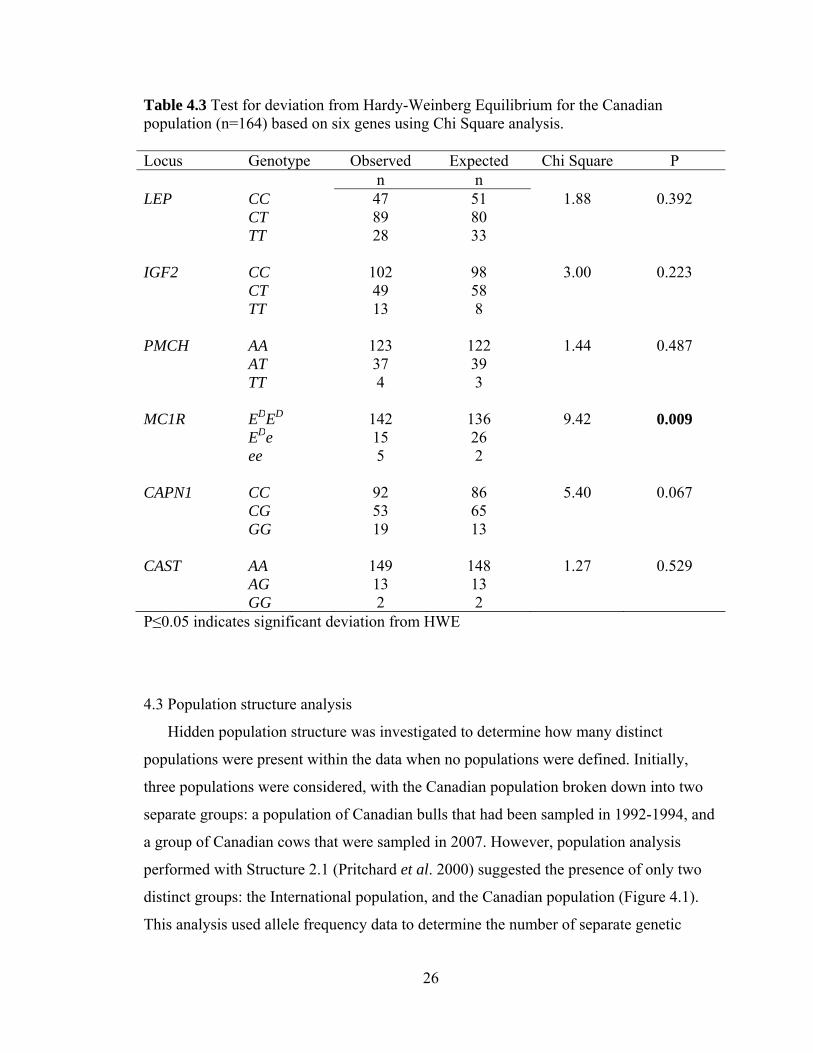
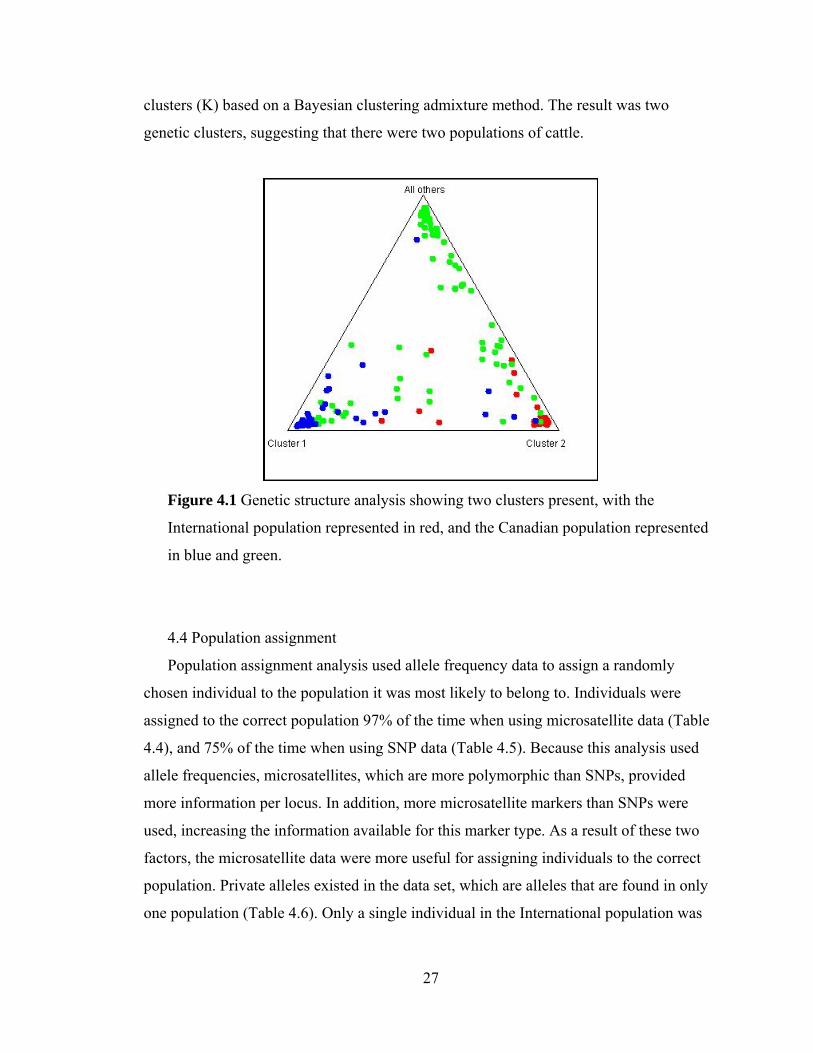
4.3 Population structure analysis
Hidden population structure was investigated to determine how many distinct
populations were present within the data when no populations were defined. Initially,
three populations were considered, with the Canadian population broken down into two
separate groups: a population of Canadian bulls that had been sampled in 1992-1994, and
a group of Canadian cows that were sampled in 2007. However, population analysis
performed with Structure 2.1 (Pritchard et al. 2000) suggested the presence of only two
distinct groups: the International population, and the Canadian population (Figure 4.1).
This analysis used allele frequency data to determine the number of separate genetic
27
clusters (K) based on a Bayesian clustering admixture method. The result was two
genetic clusters, suggesting that there were two populations of cattle.
Figure 4.1 Genetic structure analysis showing two clusters present, with the
International population represented in red, and the Canadian population represented
in blue and green.
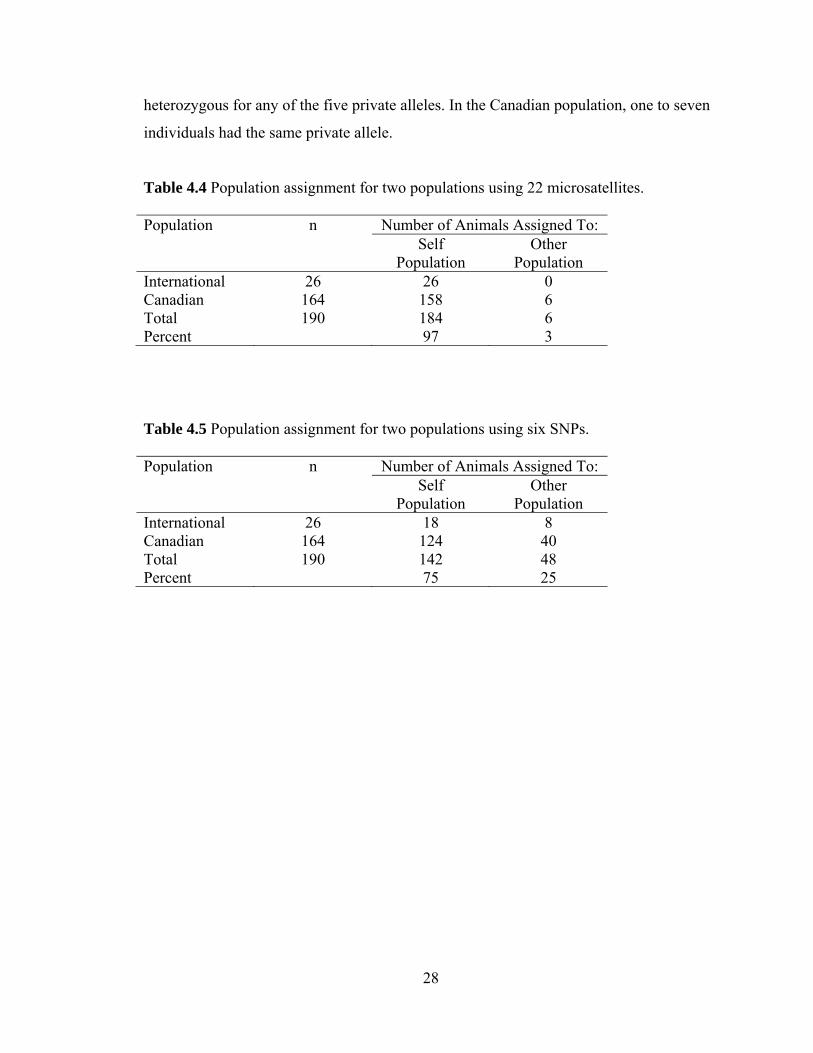
4.4 Population assignment
Population assignment analysis used allele frequency data to assign a randomly
chosen individual to the population it was most likely to belong to. Individuals were
assigned to the correct population 97% of the time when using microsatellite data (Table
4.4), and 75% of the time when using SNP data (Table 4.5). Because this analysis used
allele frequencies, microsatellites, which are more polymorphic than SNPs, provided
more information per locus. In addition, more microsatellite markers than SNPs were
used, increasing the information available for this marker type. As a result of these two
factors, the microsatellite data were more useful for assigning individuals to the correct
population. Private alleles existed in the data set, which are alleles that are found in only
one population (Table 4.6). Only a single individual in the International population was
28
heterozygous for any of the five private alleles. In the Canadian population, one to seven
individuals had the same private allele.
Table 4.4 Population assignment for two populations using 22 microsatellites.
Population n Number of Animals Assigned To:
Self
Population Other
Population International 26 26 0 Canadian 164 158 6 Total 190 184 6 Percent 97 3
Table 4.5 Population assignment for two populations using six SNPs.
Population n Number of Animals Assigned To:
Self
Population Other
Population International 26 18 8 Canadian 164 124 40 Total 190 142 48 Percent 75 25
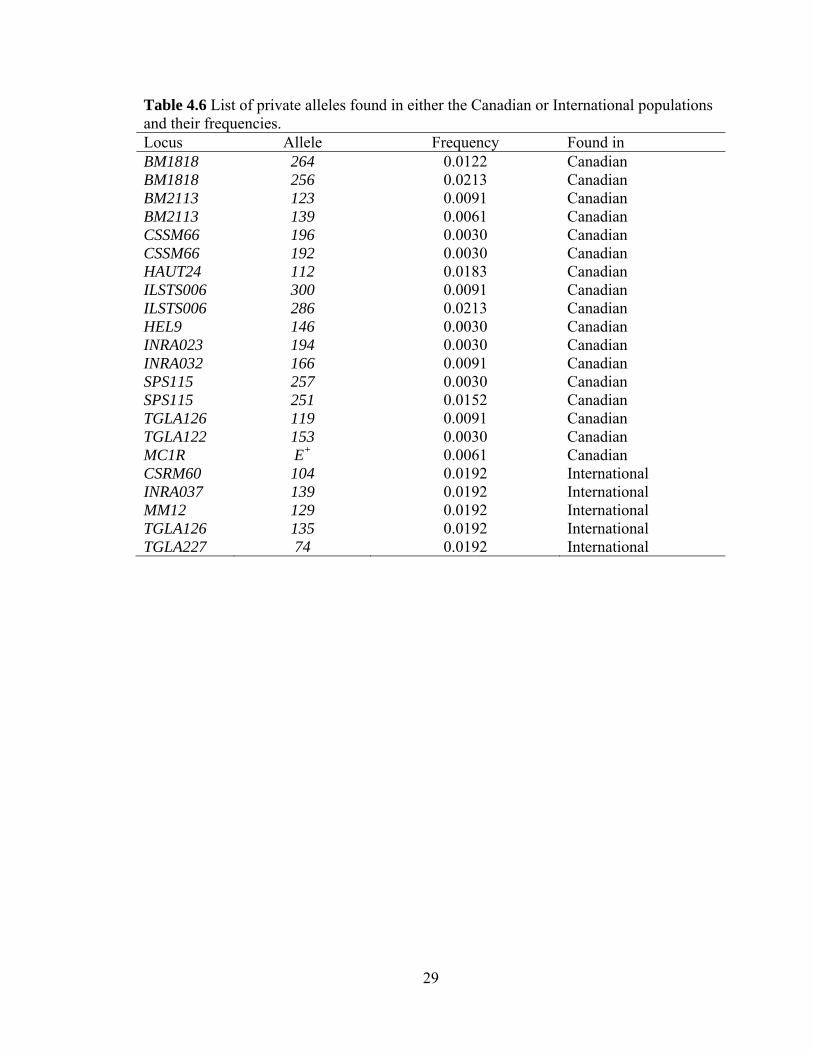
29
Table 4.6 List of private alleles found in either the Canadian or International populations and their frequencies. Locus Allele Frequency Found in BM1818 264 0.0122 Canadian BM1818 256 0.0213 Canadian BM2113 123 0.0091 Canadian BM2113 139 0.0061 Canadian CSSM66 196 0.0030 Canadian CSSM66 192 0.0030 Canadian HAUT24 112 0.0183 Canadian ILSTS006 300 0.0091 Canadian ILSTS006 286 0.0213 Canadian HEL9 146 0.0030 Canadian INRA023 194 0.0030 Canadian INRA032 166 0.0091 Canadian SPS115 257 0.0030 Canadian SPS115 251 0.0152 Canadian TGLA126 119 0.0091 Canadian TGLA122 153 0.0030 Canadian MC1R E+ 0.0061 Canadian CSRM60 104 0.0192 International INRA037 139 0.0192 International MM12 129 0.0192 International TGLA126 135 0.0192 International TGLA227 74 0.0192 International
30
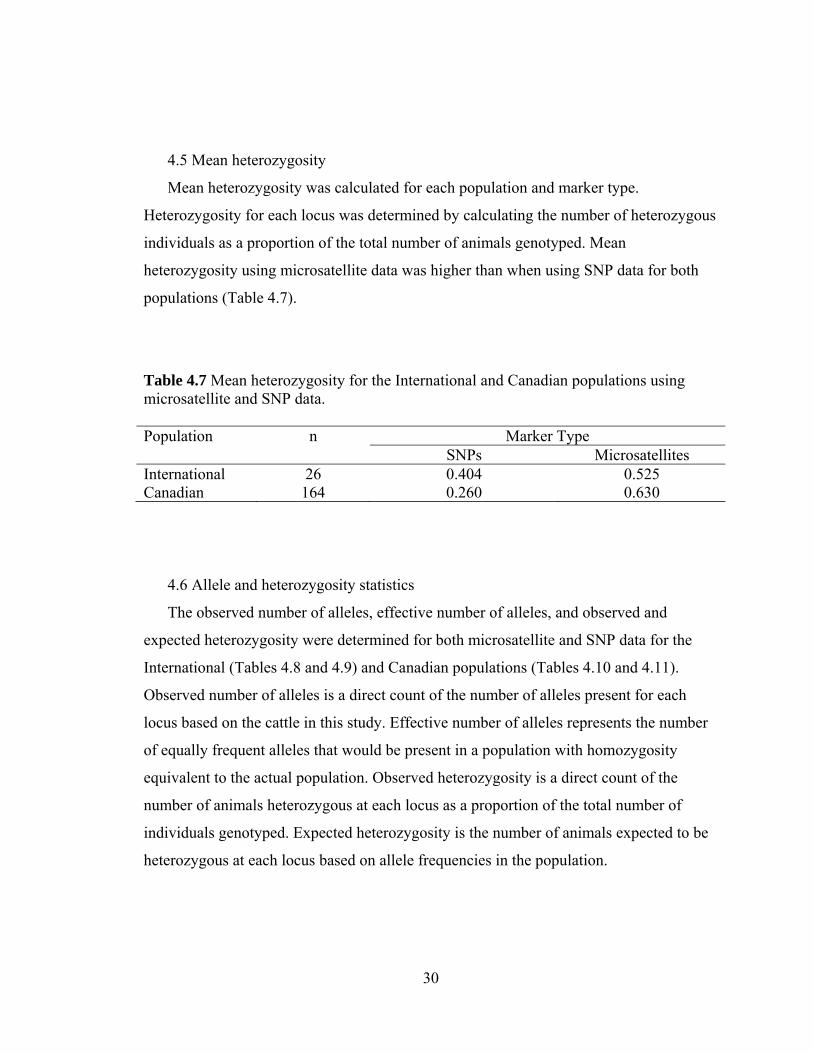
4.5 Mean heterozygosity
Mean heterozygosity was calculated for each population and marker type.
Heterozygosity for each locus was determined by calculating the number of heterozygous
individuals as a proportion of the total number of animals genotyped. Mean
heterozygosity using microsatellite data was higher than when using SNP data for both
populations (Table 4.7).
Table 4.7 Mean heterozygosity for the International and Canadian populations using microsatellite and SNP data. Population n Marker Type SNPs Microsatellites International 26 0.404 0.525 Canadian 164 0.260 0.630
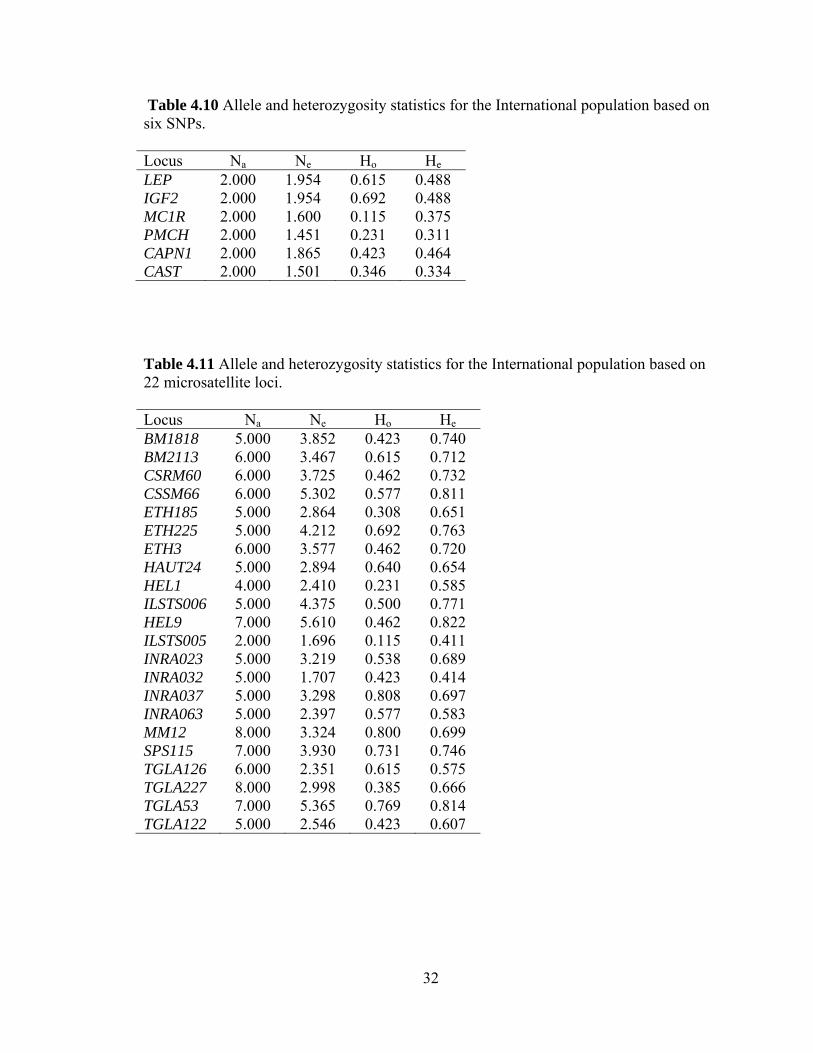
4.6 Allele and heterozygosity statistics
The observed number of alleles, effective number of alleles, and observed and
expected heterozygosity were determined for both microsatellite and SNP data for the
International (Tables 4.8 and 4.9) and Canadian populations (Tables 4.10 and 4.11).
Observed number of alleles is a direct count of the number of alleles present for each
locus based on the cattle in this study. Effective number of alleles represents the number
of equally frequent alleles that would be present in a population with homozygosity
equivalent to the actual population. Observed heterozygosity is a direct count of the
number of animals heterozygous at each locus as a proportion of the total number of
individuals genotyped. Expected heterozygosity is the number of animals expected to be
heterozygous at each locus based on allele frequencies in the population.
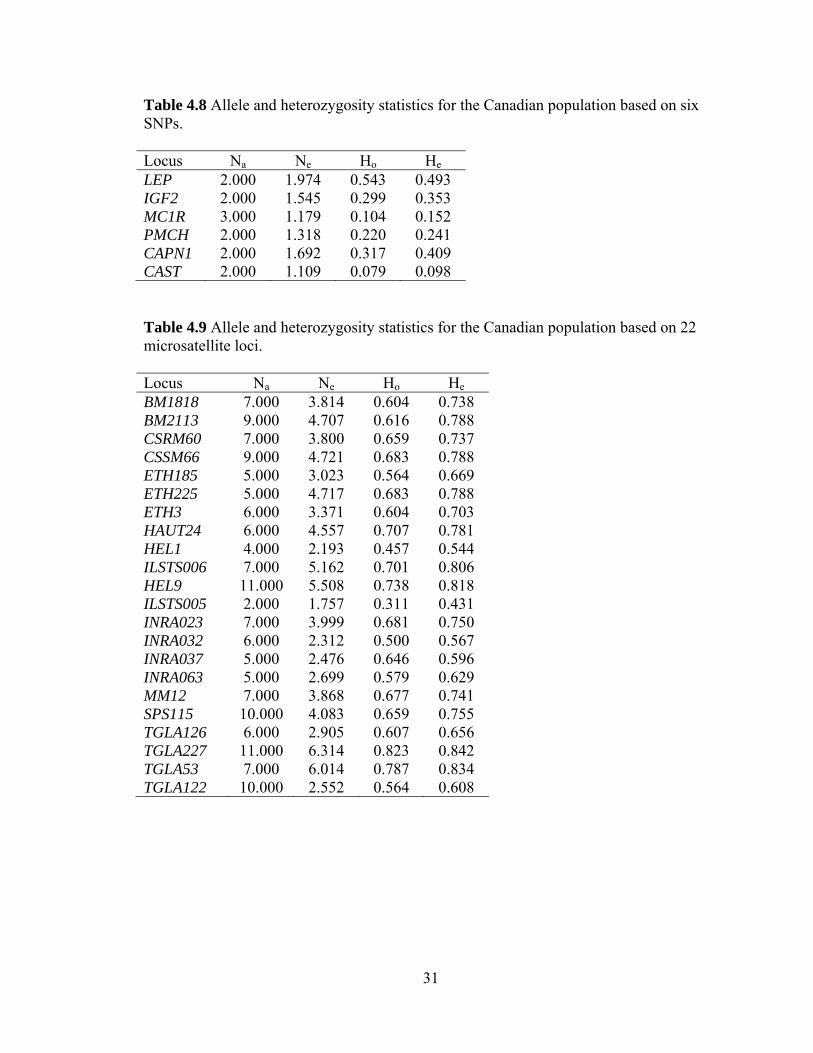
31
Table 4.8 Allele and heterozygosity statistics for the Canadian population based on six SNPs. Locus Na Ne Ho He LEP 2.000 1.974 0.543 0.493 IGF2 2.000 1.545 0.299 0.353 MC1R 3.000 1.179 0.104 0.152 PMCH 2.000 1.318 0.220 0.241 CAPN1 2.000 1.692 0.317 0.409 CAST 2.000 1.109 0.079 0.098 Table 4.9 Allele and heterozygosity statistics for the Canadian population based on 22 microsatellite loci. Locus Na Ne Ho He BM1818 7.000 3.814 0.604 0.738 BM2113 9.000 4.707 0.616 0.788 CSRM60 7.000 3.800 0.659 0.737 CSSM66 9.000 4.721 0.683 0.788 ETH185 5.000 3.023 0.564 0.669 ETH225 5.000 4.717 0.683 0.788 ETH3 6.000 3.371 0.604 0.703 HAUT24 6.000 4.557 0.707 0.781 HEL1 4.000 2.193 0.457 0.544 ILSTS006 7.000 5.162 0.701 0.806 HEL9 11.000 5.508 0.738 0.818 ILSTS005 2.000 1.757 0.311 0.431 INRA023 7.000 3.999 0.681 0.750 INRA032 6.000 2.312 0.500 0.567 INRA037 5.000 2.476 0.646 0.596 INRA063 5.000 2.699 0.579 0.629 MM12 7.000 3.868 0.677 0.741 SPS115 10.000 4.083 0.659 0.755 TGLA126 6.000 2.905 0.607 0.656 TGLA227 11.000 6.314 0.823 0.842 TGLA53 7.000 6.014 0.787 0.834 TGLA122 10.000 2.552 0.564 0.608
32
Table 4.10 Allele and heterozygosity statistics for the International population based on six SNPs. Locus Na Ne Ho He LEP 2.000 1.954 0.615 0.488 IGF2 2.000 1.954 0.692 0.488 MC1R 2.000 1.600 0.115 0.375 PMCH 2.000 1.451 0.231 0.311 CAPN1 2.000 1.865 0.423 0.464 CAST 2.000 1.501 0.346 0.334
Table 4.11 Allele and heterozygosity statistics for the International population based on 22 microsatellite loci. Locus Na Ne Ho He BM1818 5.000 3.852 0.423 0.740 BM2113 6.000 3.467 0.615 0.712 CSRM60 6.000 3.725 0.462 0.732 CSSM66 6.000 5.302 0.577 0.811 ETH185 5.000 2.864 0.308 0.651 ETH225 5.000 4.212 0.692 0.763 ETH3 6.000 3.577 0.462 0.720 HAUT24 5.000 2.894 0.640 0.654 HEL1 4.000 2.410 0.231 0.585 ILSTS006 5.000 4.375 0.500 0.771 HEL9 7.000 5.610 0.462 0.822 ILSTS005 2.000 1.696 0.115 0.411 INRA023 5.000 3.219 0.538 0.689 INRA032 5.000 1.707 0.423 0.414 INRA037 5.000 3.298 0.808 0.697 INRA063 5.000 2.397 0.577 0.583 MM12 8.000 3.324 0.800 0.699 SPS115 7.000 3.930 0.731 0.746 TGLA126 6.000 2.351 0.615 0.575 TGLA227 8.000 2.998 0.385 0.666 TGLA53 7.000 5.365 0.769 0.814 TGLA122 5.000 2.546 0.423 0.607
33
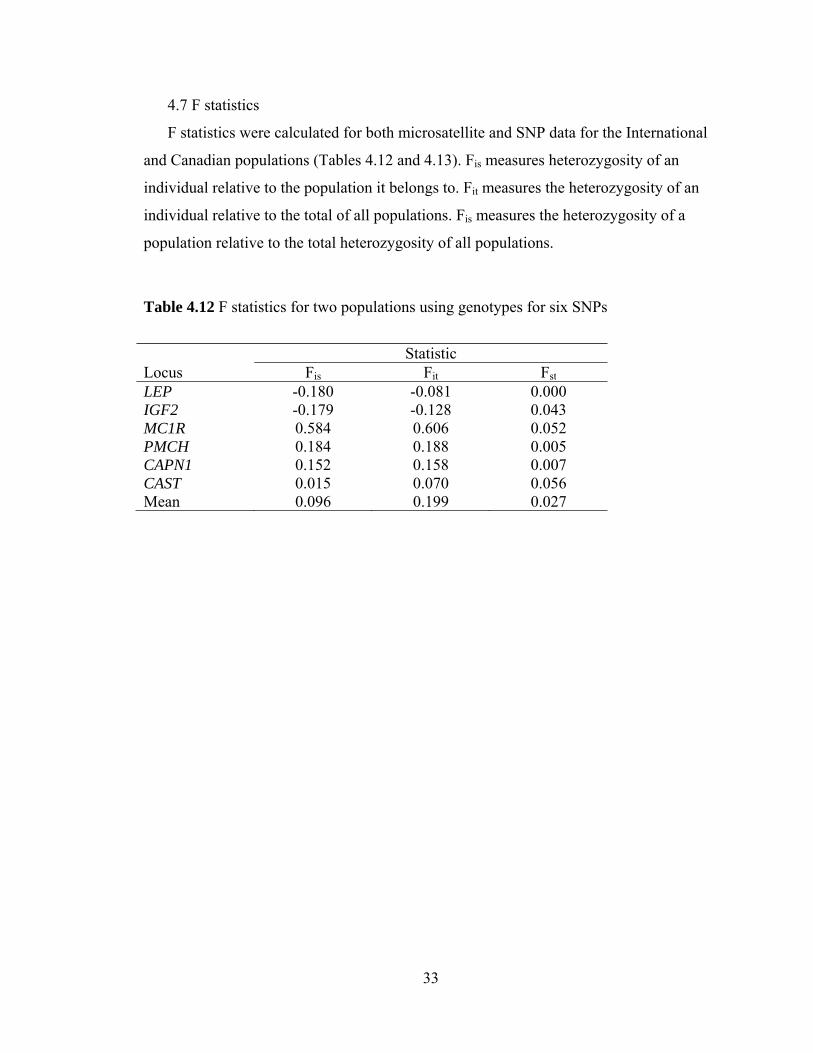
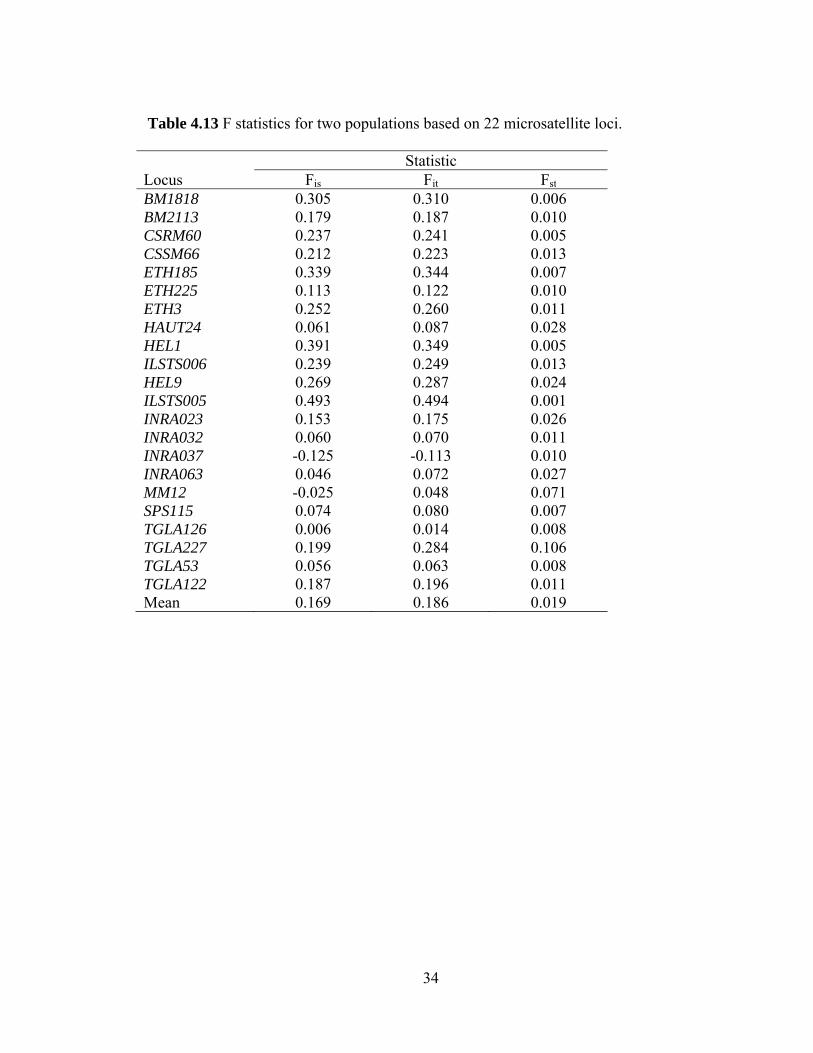
4.7 F statistics
F statistics were calculated for both microsatellite and SNP data for the International
and Canadian populations (Tables 4.12 and 4.13). Fis measures heterozygosity of an
individual relative to the population it belongs to. Fit measures the heterozygosity of an
individual relative to the total of all populations. Fis measures the heterozygosity of a
population relative to the total heterozygosity of all populations.
Table 4.12 F statistics for two populations using genotypes for six SNPs
Statistic Locus Fis Fit Fst LEP -0.180 -0.081 0.000 IGF2 -0.179 -0.128 0.043 MC1R 0.584 0.606 0.052 PMCH 0.184 0.188 0.005 CAPN1 0.152 0.158 0.007 CAST 0.015 0.070 0.056 Mean 0.096 0.199 0.027
34
Table 4.13 F statistics for two populations based on 22 microsatellite loci. Statistic Locus Fis Fit Fst BM1818 0.305 0.310 0.006 BM2113 0.179 0.187 0.010 CSRM60 0.237 0.241 0.005 CSSM66 0.212 0.223 0.013 ETH185 0.339 0.344 0.007 ETH225 0.113 0.122 0.010 ETH3 0.252 0.260 0.011 HAUT24 0.061 0.087 0.028 HEL1 0.391 0.349 0.005 ILSTS006 0.239 0.249 0.013 HEL9 0.269 0.287 0.024 ILSTS005 0.493 0.494 0.001 INRA023 0.153 0.175 0.026 INRA032 0.060 0.070 0.011 INRA037 -0.125 -0.113 0.010 INRA063 0.046 0.072 0.027 MM12 -0.025 0.048 0.071 SPS115 0.074 0.080 0.007 TGLA126 0.006 0.014 0.008 TGLA227 0.199 0.284 0.106 TGLA53 0.056 0.063 0.008 TGLA122 0.187 0.196 0.011 Mean 0.169 0.186 0.019

35
4.8 Analysis of molecular variance
Analysis of molecular variance (AMOVA) determined the total genetic variation in
the genotype data, then partitioned this variation into two sources: within populations,
and between populations. Therefore, this statistic measured the genetic variation that
could be explained by the differences between the two populations, in comparison to the
variation that was explained by the genetic differences between individual animals within
populations.
Ninety-seven percent of the total genetic variation was explained by the variation
within, not between, the International and Canadian populations, based on microsatellite
data (Table 4.14). Using SNP data, 93% of the genetic variation was explained by the
variation within populations (Table 4.15). These results indicate that 3-7% of the total
genetic variation was explained by variation between the two populations. SNP data was
as useful, or more useful, than microsatellite data for analysis of molecular variance,
resulting in a higher proportion of the total variation being attributed to differences
between populations.
Table 4.14 Analysis of molecular variance between two populations based on 22 microsatellites. Source DF SS MS Est.
Variation% P
Between populations 1 1737.951 1737.951 14.666 3% 0.010 Within populations 378 159278.812 421.373 421.373 97% Total 379 161016.762 2159.323 436.039

36
Table 4.15 Analysis of molecular variance between two populations based on six SNPs. Source DF SS MS Est.
Variation % P
Between populations
1 9.135 9.135 0.158 7% 0.010
Within populations
188 381.702 2.030 2.030 93%
Total 189 390.837 11.165 2.189
4.9 Nei’s genetic distance
A pairwise comparison of Nei’s genetic distance was calculated between the
International and Canadian populations using both microsatellite and SNP data. A genetic
distance of 0.097 was found between the two populations using microsatellite data and,
and a distance of 0.022 was determined using SNP data.
A population matrix of pairwise Nei’s genetic distance was also calculated with
GeneAlEx 6.1 (Peakall and Smouse 2006) for 752 animals representing eight cattle
breeds (Table 4.16). Within this matrix, genetic distances ranged from 0.081 (between
Gelbvieh and Simmental) to 0.452 (between Angus and Hereford). A genetic distance of
0 indicated that there is no difference between populations, while values approaching 1
indicated increasing levels of differentiation between each pair of populations.
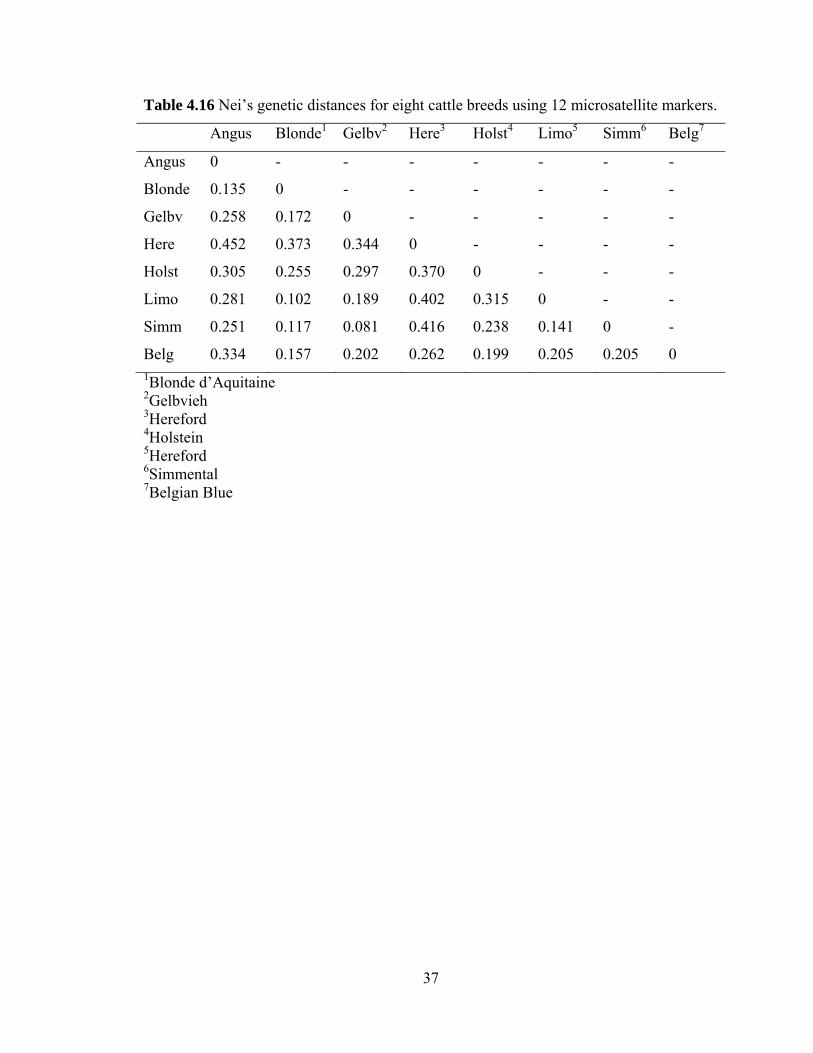
37
Table 4.16 Nei’s genetic distances for eight cattle breeds using 12 microsatellite markers.
Angus Blonde1 Gelbv2 Here3 Holst4 Limo5 Simm6 Belg7
Angus 0 - - - - - - -
Blonde 0.135 0 - - - - - -
Gelbv 0.258 0.172 0 - - - - -
Here 0.452 0.373 0.344 0 - - - -
Holst 0.305 0.255 0.297 0.370 0 - - -
Limo 0.281 0.102 0.189 0.402 0.315 0 - -
Simm 0.251 0.117 0.081 0.416 0.238 0.141 0 -
Belg 0.334 0.157 0.202 0.262 0.199 0.205 0.205 0 1Blonde d’Aquitaine 2Gelbvieh 3Hereford 4Holstein 5Hereford 6Simmental 7Belgian Blue

38
5.0 Discussion
5.1 Allele frequency analysis
Analysis of the frequencies of SNP alleles between the two populations indicated that
the Canadian population contained a significantly higher proportion of the favorable A
allele for the CAST SNP (Table 4.1). CAST is correlated to beef tenderness, a trait that
cannot be evaluated in a live animal, or a carcass, for the purpose of selection (Barendse
2002). While tenderness can be assessed on cooked beef, this kind of carcass data is not
available to the primary breeder in order for selection for tender beef to occur. As an
alternative, genetic tests for tenderness have been developed which use SNPs in genes
such as CAST and µ-calpain (CAPN1). These tests allow breeders to test live animals for
SNPs that are correlated with tenderness, in order to select animals with the favorable
alleles at these SNPs. Producers could market calves as potentially more tender, or
market bulls on the basis of producing a more tender calf crop.
Because of the difficulty in obtaining tenderness information, Angus cattle are likely
not currently under heavy selection pressure for this trait. However, there is a possibility
that more selection is taking place in North America, where DNA tests are commercially
available, compared to other countries around the world. This could help to explain the
increased frequency of the favorable allele in the Canadian Angus population. This
evidence may be further supported by the fact that the cows of the Canadian population,
which were sampled in 2007, exhibited a significantly higher frequency of the CAST A
allele than did the bulls, which were sampled in 1992-1994. The increased frequency of
the A allele in the Canadian population between these two groups, following the
availability of commercial tenderness tests, suggests that some selection may have
occurred.
For five of the six SNPs, both populations of Angus cattle exhibited higher
frequencies of the favorable allele than the unfavorable allele (Table 4.1). No alleles were
found at very low frequencies (Table 4.1), which would indicate loss of diversity due to
selection. This indicates that Angus cattle are excellent genetic resources for

39
crossbreeding since favorable allele frequencies of these genes are high. For tenderness,
especially, Canadian Angus cattle may be a valuable tool for increasing the frequency of
the CAST A allele which is correlated to more tender beef.
The allele frequencies were not expected to be significantly different between the
Canadian and International Angus populations because the widespread use of AI in elite
purebred herds around the world results in the distribution of the top Angus genetics. The
International population in this study represents an elite selection of international Angus
cattle, since the embryos were donated by top purebred producers who are interested in
only the most elite genetics. The international movement of Angus genetics is evidenced
by the fact that two calves in the International population, originating from different
countries, shared the same sire (Appendix A). Additionally, many of the calves of the
International population have ancestors of Canadian origin in their pedigree, further
suggesting that the two populations would not be significantly different from one another.
5.2 Deviation from Hardy-Weinberg equilibrium
Hardy-Weinberg equilibrium (HWE) assumes random mating and the absence of
selection. Since cattle are not bred randomly in most cases, and because the SNPs in this
study were chosen on the basis of the probability that they may be influenced by
selection, the SNP genotype data were tested for deviation from Hardy-Weinberg
equilibrium.
In this study, significant deviation from HWE was found for MC1R (0.0001) in the
International population (Table 4.2), and in MC1R (P=0.009) in the Canadian population
(Table 4.3). The resulting deviation from HWE for MC1R can be explained by the non-
random breeding of red and black Angus cattle by the majority of breeders. In fact, many
countries such as the United States consider red and black Angus to be separate breeds.
Some countries, such as Scotland, do not recognize red Angus at all. In any case, Angus
cattle are most often bred specifically to be red or black, resulting in genotype
frequencies that do not conform to Hardy-Weinberg equilibrium. Coat color is a highly
visible phenotype that can be easily evaluated and selected for by breeders.
Negrini et al. (2008) used 97 SNPs in 73 genes to assign individuals to one of 24
European cattle breeds in a study evaluating SNPs for parentage and meat traceability
40
applications. Thirteen breeds of beef cattle from Italy, and 11 breeds from other European
countries were used, with 17-82 individual animals representing each breed. The SNPs in
their study were chosen as candidates for meat quality, and included intronic, 3’, 5’, and
promoter region SNPs in addition to exonic polymorphisms. None of the same
polymorphisms were used in this study. Negrini et al. (2008) concluded that deviation
from HWE would only be considered significant if detected in greater than 50% of the
populations in the study. When calculated using the Fisher exact test (Guo and Thompson
1992). If present in less than 50% of the populations, the SNP would be used in analysis,
whether it deviated from HWE or not. Negrini et al. (2008) found that 43% of the 97
polymorphisms deviated from HWE in one or more populations, but no SNPs reached the
50% threshold for exclusion. Therefore, the deviation that was detected in these
polymorphisms does not seem to result from the effects of differing selection by
population. Although the SNPs studied by Negrini et al. (2008) were candidates for meat
quality, and therefore potentially affected by selection, deviation from HWE was
considered spurious when it occurred in fewer than half of the populations in the study.
5.3 Population structure analysis
Population structure analysis is a method to determine how many discrete populations
occur among the group of cattle that were genotyped. The most probable number of
clusters (K) is an indication of the number of discrete populations present in the data. In
this study, three initial populations were used for population structure analysis with
Structure 2.2 (Figure 4.1). These were the International population, the bulls of the
Canadian population, and the cows of the Canadian population. It was initially postulated
that, given the period of time between the sampling of the Canadian bulls and cows, these
populations may have proven to be discrete due to changes in selection pressure over this
time period. However, only two separate clusters resulted from the analysis: the Canadian
population and the International population (Figure 4.1). The Canadian bulls and cows
were not different enough based on their genotype data to constitute two separate
populations. As a result, two populations were utilized for the remainder of the analyses
that were performed.
41
MacNeil et al. (2007) investigated an isolated population of 23 cattle on Chirikof
Island, Alaska in relation to 200 cattle from 11 mainland beef breeds. Using 34
microsatellite markers, they found that four clusters were present, with the island
population forming its own discrete cluster. It is somewhat surprising that their analysis
failed to separate 11 breeds into different clusters, whereas the Canadian and
International populations within one breed were distinguishable, using 164 cattle.
Few studies have investigated different populations of animals within the same breed.
Zenger et al. (2006) studied Holsteins from several different countries, and resulting
population structure analysis yielded one single cluster, effectively describing the world’s
Holstein population as a single entity. This study used 845 genome-wide SNPs to
evaluate 431 Holstein bulls within Australia, which were born between 1975 and 1999
(Zenger et al. 2006). They also included bulls from the USA, Canada, the Netherlands,
France, New Zealand, Great Britain, and Germany, with three to 81 individuals
representing each country (Zenger et al. 2006). The results from their study were not
surprising, as the Holstein breed is based on a relatively small number of elite bulls,
whose genetics are widely and extensively distributed using artificial insemination.
Zenger et al. (2006) concluded that, due to the extensive use of American bulls in
Australia and other countries, it is clear that the Holstein breed is very similar across the
world.
5.4 Population assignment
Using 22 microsatellite markers, randomly chosen individuals were assigned to the
correct population 97% of the time in this study (Table 4.4), while SNP data yielded the
correct population 75% of the time (Table 4.5).
These results agree with previous studies. Negrini et al. (2008) found that more than
90 SNPs were required to reach 90% accuracy in population assignment, compared to 18-
23 microsatellite markers required to achieve the same accuracy of assignment. This is
likely due to the fact that microsatellites are more polymorphic, meaning that they are
more informative when calculating allele frequency data. Interestingly, Negrini et al.
(2008) further investigated the effect of different qualities of SNPs for use in population
assignment. They found that selecting SNPs with high Fst values (or higher degrees of
42
variability between populations) decreased the number of SNPs that were necessary to
obtain greater than 90% probability of correct population assignment. The Bovine
HapMap Consortium (2009) further supported this when they found that as few as 50
SNPs, representing both introns and exons, most of which did not result in changes to the
amino acid, were sufficient for parentage verification and for proof of identity.
Some factors, such as the presence of private alleles, or alleles that are found in one
population only, increase the likelihood of correct assignment. The presence of a private
allele in an individual’s genotype absolutely assigns that individual to the population
containing the private allele, greatly increasing the probability of correct assignment. An
example of a private allele found in this study is the E+ allele at MC1R, which was found
only in the Canadian population (Table 4.6). Therefore, when using the SNPs for
population assignment, the animal with this allele would be assigned to the Canadian
population with 100% certainty, increasing the overall accuracy of assignment.
Population assignment analysis has been used in numerous studies for three main
applications: parentage verification, proof of identity, and traceability of animals or
animal products to a population of origin for food safety reasons. Sasazaki et al. (2007)
used six markers with Bos indicus- specific alleles to assign beef products to domestic
(Japanese) or imported (Australian) origin. Their study made the assumption that any Bos
indicus alleles originiated in Australia, and therefore indicated imported beef. Their
study found that correct assignment of an individual cut of meat was achieved over 93%
of the time in 782 samples of beef that was commercially available in Japan (Sasazaki et
al. 2007).
Negrini et al. (2008) identified two contrasting approaches to population assignment.
Deterministic methods use breed-specific or population-specific alleles, commonly
associated with coat color, to assign unknown individuals to populations (Negrini et al.
2008). A deterministic approach requires populations to be unique from each other in
some way, and is commonly used to distinguish Bos taurus from Bos indicus animals.
Deterministic methods commonly use one or two SNPs. On the other hand, probabilistic
approaches to population assignment require more markers, and use allele frequencies of
reference populations to assign individuals to a likely population. This study utilized a

43
probabilistic method for population assignment, and contrasted SNPs and microsatellites
as the marker type.
In a study that used 20 microsatellite markers to assign animals to one of seven
breeds, MacHugh et al. (1998) found that as few as two to four markers yielded correct
assignment about 90% of the time. Increasing the number of markers to 10 resulted in
greater than 99% correct assignment. Their findings confirmed that highly unique breeds
are easier to classify than are highly heterogeneous breeds. This emphasized the
importance of the reference populations that are used. Because population assignment is
based on the allele frequencies of the reference population, it is important for the
reference population to be a representative sample of the breed or population, especially
when attempting to assign individuals to very similar populations, rather than breeds with
more differences between them.
While microsatellite markers yield more definite results for population assignment
than do SNPs, it would be interesting to compare equal numbers of each polymorphism
type. Using a larger selection of SNPs would likely increase the probability of correct
assignment.
5.5 Heterozygosity
Average heterozygosity was calculated for the International and Canadian Angus
populations for both microsatellite and SNP genotypes (Table 4.7). As expected, mean
heterozygosity was higher when using microsatellite data than when using SNP data,
because the multiallelic nature of microsatellites results in greater heterozygosity for this
marker type. Vasconcellos et al. (2003) found similar results with Angus and other
Brazilian cattle breeds, with average heterozygosity of 0.653 for microsatellite markers
and 0.275 for SNPs. Microsatellite data is expected to yield higher measures of
heterozygosity than SNP data because microsatellites have multiple alleles, compared to
only two for SNPs, resulting in the potential for more inherent heterozygosity.
44
5.6 F statistics
F statistics measure essentially the same partitioning of total genetic variation as
AMOVA. Fst is very commonly used in diversity studies to detect selection through
differences between subpopulations, and is often reported as the amount of genetic
variation that can be explained by the difference between populations (Bovine HapMap
Consortium 2009). Mean Fst for this study was 0.027 when using SNP genotypes (Table
4.12) and 0.019 when using microsatellite genotypes (Table 4.13). These values translate
to 3% and 2% of the total variation being explained by differences between the
International and Canadian populations. Fst results agree with the AMOVA obtained with
these data: SNP data resulted in more of the variation being explained by differences
between populations, than did microsatellite data.
These values can also be compared to previous studies. Zenger et al. (2006) found a
mean Fst value of 0.016, or a difference of about 2% between Holstein populations from
different countries. Their study, which is one of very few to compare animals of the same
breed, produced results very similar to those seen between the International and Canadian
Angus populations.
Negrini et al. (2008) reported a mean Fst of 0.11, which means that 11% of the
variation in their study could be explained by differences between 24 cattle breeds based
on microsatellite data. Mukesh et al. (2004) also attributed 12% of the total variation to
differences between three breeds, using microsatellites.
Brenneman et al. (2007) compared Angus to several Bos indicus breeds, and the
resulting average Fst value was much higher, at 0.238 (24% of the total variation was
attributed to between-breed differences). Their result highlights the genetic separation
between Bos taurus and Bos indicus cattle. Some studies postulate that Bos taurus and
Bos indicus diverged more than 250,000 years ago (Bovine HapMap Consortium 2009).
Li et al. (2006) calculated Fst values for a set of microsatellite markers, and also for
SNPs in genes associated with beef production traits: Growth hormone 1 (GH1), Insulin-
like growth factor 1 ( IGF1), and Leptin (LEP). The LEP SNP used in their study was the
same SNP used in this study, however, only average Fst values were presented for the
three SNPs. These polymorphisms were studied in over 700 unrelated animals
representing 20 common breeds in Byelorussia, Denmark, Finland, Norway, Poland,

45
Russia, Sweden, the UK, and Ukraine. Mainly rare local breeds were used in their study,
and it was not stated whether Angus or Angus cross cattle were represented. They found
that average Fst values for genes were slightly higher (0.108) than Fst values for
microsatellite markers (0.095). Li et al. (2006) attributed this difference to selection or
gene flow affecting allele frequencies of the SNPs they investigated. If SNPs in genes
that affect production characteristics are under selection, it is likely that this selection
differs slightly within different populations, according to the production system and the
end product that is being produced. If selection is different within populations, then allele
frequencies of these SNPs would vary between populations, resulting in higher Fst values,
or genetic differences, between populations.
This phenomenon may, less likely, explain differences between populations of the
same breed than differences between breeds. It is more logical to conclude that most
breed differences arose from different selection at the time of breed development, in
combination with relatively small founder population sizes during the development of
modern breeds. As breeds were developed for different uses, whether for meat, milk, or
draft power, different selection criteria were applied to populations of animals that would
become separate breeds.
If microsatellite markers are indeed neutral, and are not being affected by selection,
they would be expected to be more uniform across populations, exhibiting lower Fst
values than SNPs. The differences found in microsatellite genotypes would have existed
within the gene pool prior to breed development and selection, and would therefore be
distributed evenly throughout the genome.
5.7 Analysis of molecular variance
Analysis of molecular variance (AMOVA) and F statistics are methods for
determining the proportions of total genetic variation that can be explained by the
differences between and within populations. SNP data (Table 4.15) were more useful for
detecting differences between populations of cattle than were the microsatellite data
(Table 4.14). This result can possibly be explained by the effects of selection. If the SNPs
used in this study are being affected, directly or indirectly, by selection, then differential
selection pressures on the two populations may result in greater differences between the
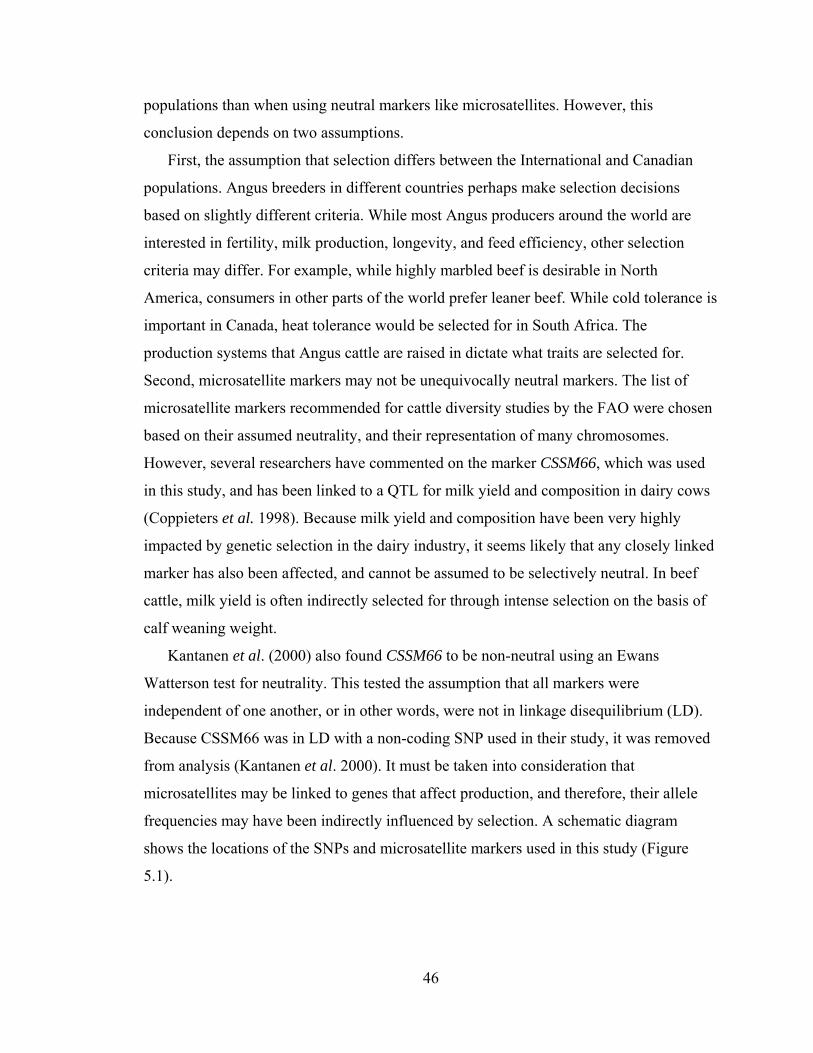
46
populations than when using neutral markers like microsatellites. However, this
conclusion depends on two assumptions.
First, the assumption that selection differs between the International and Canadian
populations. Angus breeders in different countries perhaps make selection decisions
based on slightly different criteria. While most Angus producers around the world are
interested in fertility, milk production, longevity, and feed efficiency, other selection
criteria may differ. For example, while highly marbled beef is desirable in North
America, consumers in other parts of the world prefer leaner beef. While cold tolerance is
important in Canada, heat tolerance would be selected for in South Africa. The
production systems that Angus cattle are raised in dictate what traits are selected for.
Second, microsatellite markers may not be unequivocally neutral markers. The list of
microsatellite markers recommended for cattle diversity studies by the FAO were chosen
based on their assumed neutrality, and their representation of many chromosomes.
However, several researchers have commented on the marker CSSM66, which was used
in this study, and has been linked to a QTL for milk yield and composition in dairy cows
(Coppieters et al. 1998). Because milk yield and composition have been very highly
impacted by genetic selection in the dairy industry, it seems likely that any closely linked
marker has also been affected, and cannot be assumed to be selectively neutral. In beef
cattle, milk yield is often indirectly selected for through intense selection on the basis of
calf weaning weight.
Kantanen et al. (2000) also found CSSM66 to be non-neutral using an Ewans
Watterson test for neutrality. This tested the assumption that all markers were
independent of one another, or in other words, were not in linkage disequilibrium (LD).
Because CSSM66 was in LD with a non-coding SNP used in their study, it was removed
from analysis (Kantanen et al. 2000). It must be taken into consideration that
microsatellites may be linked to genes that affect production, and therefore, their allele
frequencies may have been indirectly influenced by selection. A schematic diagram
shows the locations of the SNPs and microsatellite markers used in this study (Figure
5.1).
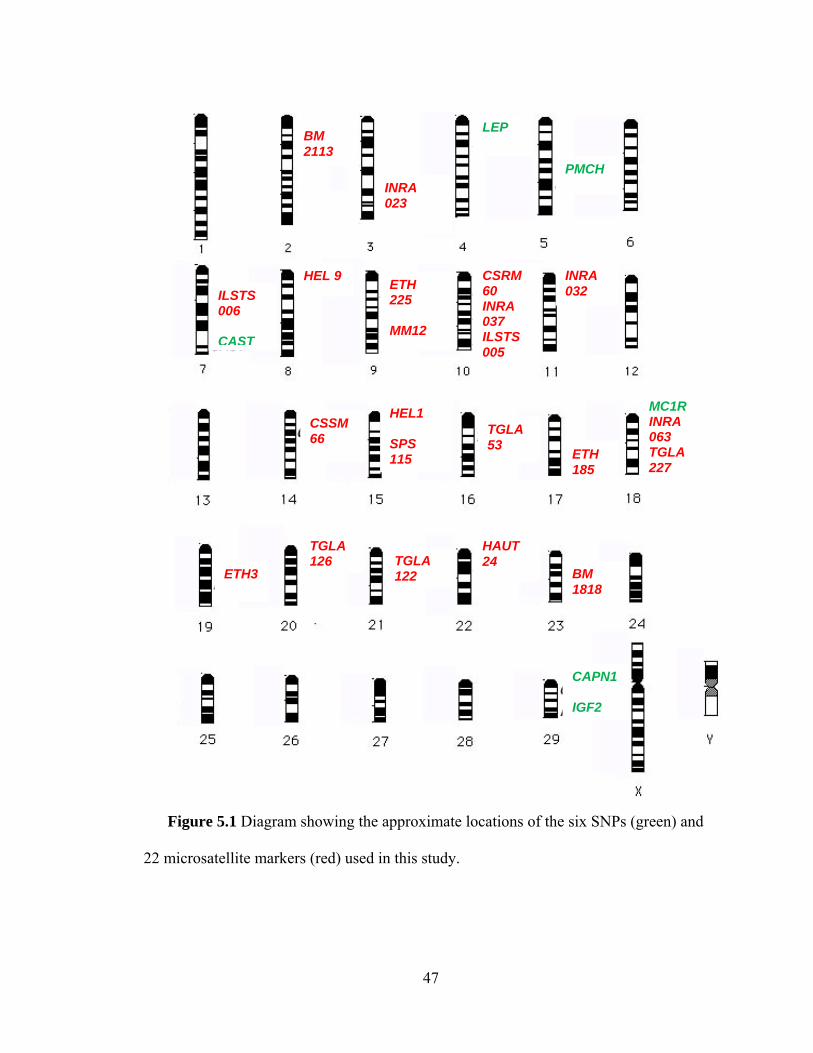
47
Figure 5.1 Diagram showing the approximate locations of the six SNPs (green) and
22 microsatellite markers (red) used in this study.
BM 2113
INRA 023
LEP
PMCH
ILSTS 006 CAST
HEL 9 ETH 225 MM12
CSRM 60 INRA 037 ILSTS 005
INRA 032
CSSM 66
HEL1 SPS 115
TGLA 53
ETH 185
MC1R INRA 063 TGLA 227
ETH3
TGLA 126 TGLA
122
HAUT 24
BM 1818
CAPN1 IGF2

48
The results of AMOVA in this study can be compared to other studies, although few
studies have compared both SNP and microsatellite data, and few have compared groups
of animals within the same breed. MacNeil et al. (2007) found that 14% of the total
genetic variation between Chirikof Island cattle and 11 common American beef breeds
could be explained by differences between the breeds. Their result is somewhat higher
than usual, but can likely be explained by the isolation and resulting unique genetics of
the island population. Differences between separate populations of the same breed would
be expected to be much lower than 14%, as evident in the Holstein breed, where the
average differentiation between populations was 1.6% using microsatellite markers
(Zenger et al. 2006).
5.8 Genetic distance
Nei’s pairwise genetic distances were calculated for the International and Canadian
Angus populations using SNP and microsatellite data. A distance of 0.097 was found
between the International and Canadian Angus populations using microsatellites, and a
distance of 0.022 was found using SNP genotypes (Table 4.16).
Genotypes for 752 additional animals representing eight common cattle breeds at
twelve microsatellite markers. Genetic distances ranged from 0.081 between Gelbvieh
and Simmental, to 0.452 between Angus and Hereford (Table 4.16). Hereford cattle
exhibited large genetic distances from the other breeds. Although Angus and Hereford
are both British breeds with similar body frames and growth characteristics, previously
published results support the results seen here. MacNeil et al. (2007) and Wiener et al.
(2004) obtained genetic distance results where Hereford animals did not cluster together
with any other British breed, instead forming their own distinct branch on phylogenetic
trees.
The anomaly of Hereford cattle not fitting into the expected phylogenetic
organization may be due to the high levels of inbreeding and homozygosity in the breeds’
history (Cleveland et al. 2005). Using pedigrees from over twenty million Hereford cattle
spanning the past century, Cleveland et al. (2005) calculated trends in inbreeding
coefficients and effective population sizes for the Hereford breed since the early 1900s.
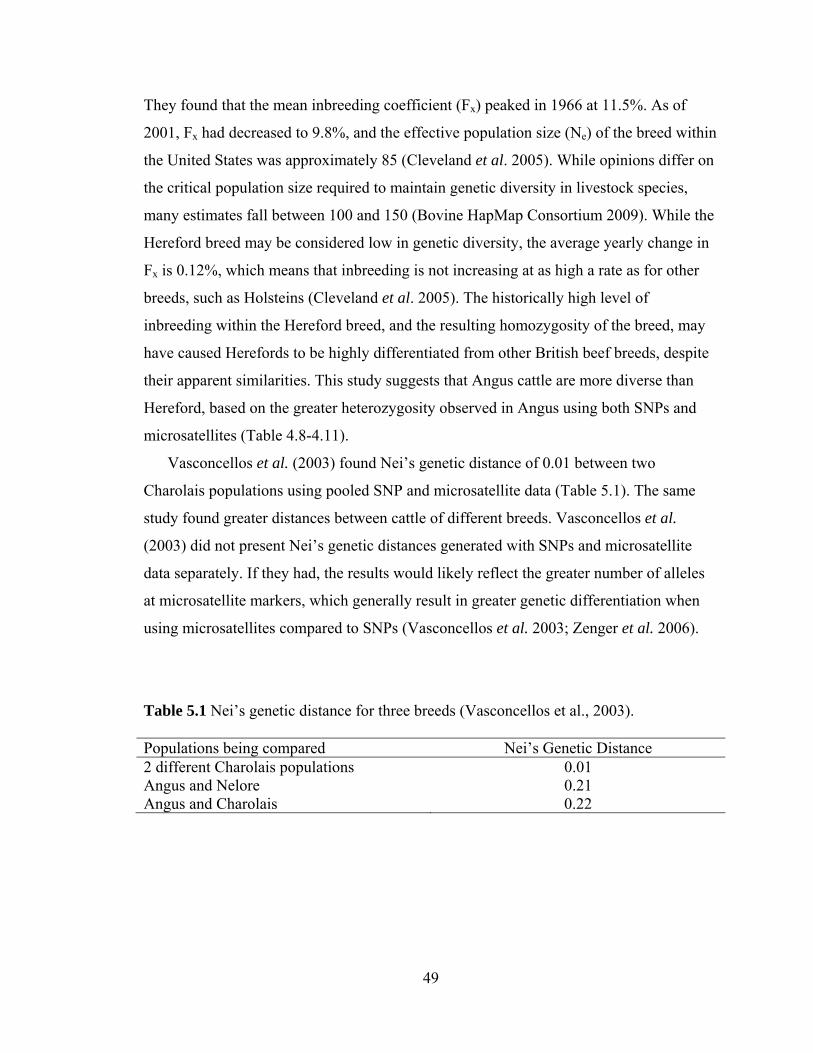
49
They found that the mean inbreeding coefficient (Fx) peaked in 1966 at 11.5%. As of
2001, Fx had decreased to 9.8%, and the effective population size (Ne) of the breed within
the United States was approximately 85 (Cleveland et al. 2005). While opinions differ on
the critical population size required to maintain genetic diversity in livestock species,
many estimates fall between 100 and 150 (Bovine HapMap Consortium 2009). While the
Hereford breed may be considered low in genetic diversity, the average yearly change in
Fx is 0.12%, which means that inbreeding is not increasing at as high a rate as for other
breeds, such as Holsteins (Cleveland et al. 2005). The historically high level of
inbreeding within the Hereford breed, and the resulting homozygosity of the breed, may
have caused Herefords to be highly differentiated from other British beef breeds, despite
their apparent similarities. This study suggests that Angus cattle are more diverse than
Hereford, based on the greater heterozygosity observed in Angus using both SNPs and
microsatellites (Table 4.8-4.11).
Vasconcellos et al. (2003) found Nei’s genetic distance of 0.01 between two
Charolais populations using pooled SNP and microsatellite data (Table 5.1). The same
study found greater distances between cattle of different breeds. Vasconcellos et al.
(2003) did not present Nei’s genetic distances generated with SNPs and microsatellite
data separately. If they had, the results would likely reflect the greater number of alleles
at microsatellite markers, which generally result in greater genetic differentiation when
using microsatellites compared to SNPs (Vasconcellos et al. 2003; Zenger et al. 2006).
Table 5.1 Nei’s genetic distance for three breeds (Vasconcellos et al., 2003). Populations being compared Nei’s Genetic Distance 2 different Charolais populations 0.01 Angus and Nelore 0.21 Angus and Charolais 0.22

50
6.0 Conclusions
This study has shown that the Canadian Angus population exhibits a significantly
higher frequency of the CAST A allele, which is correlated with more tender beef, than
the International population. This result could be explained by more selection pressure
for tender beef in Canada, due to the adoption of DNA testing for SNPs correlated to
tenderness. For all genes, the favorable allele was found with higher frequency than the
unfavorable allele in both populations.
Tests for deviation from Hardy-Weinberg equilibrium revealed that MC1R deviated
from HWE for both populations. This deviation can probably be attributed to the non-
random mating of red and black Angus, based on producer preference, and the ease of
selection for this highly visible phenotype.
Mean heterozygosity was, as expected, higher for microsatellite data than for SNP
data. This can be attributed to the multiallelic nature of microsatellite showed that there
were two populations present: the International Angus population, and the Canadian
Angus population. Population assignment was 75-97% successful at assigning unknown
individuals to the correct population, especially when using microsatellite data. Again,
the multiallelic characteristics of microsatellites provide more information per locus,
increasing the likelihood of correct classification.
Analysis of molecular variance and frequency statistics were use to determine the
proportion of total genetic variability attributed to differences between populations
compared to individual variation within populations. Both measures resulted in more
difference between populations using SNPs compared to microsatellites. This may be
attributable to differential selection in the two populations, resulting in different allele
frequencies in the populations. Because microsatellites are generally considered not to be
affected by selection, they result in more of the total variability to be assigned to
individuals within the populations.
Genetic distance data, however, did not appear to agree with AMOVA and Fst values.
SNP data yielded smaller genetic distances between the two Angus populations compared
to microsatellite data. This contrasts with the results of AMOVA and Fst analysis,
suggesting that SNP data results in more similarities between populations than
51
microsatellite data. One would expect genetic distance data to reflect similar trends as
AMOVA and frequency data, with SNPs resulting in a larger difference between the two
populations.
In conclusion, the genetic diversity within the Angus breed is mainly attributable to
the variation within individual animals, rather than great differences between populations.
This result is similar to other studies that compared not only different breeds, but also
different populations of the same breed of cattle. Frequencies of the favorable alleles for
the six SNPs affecting production traits were as high or higher than expected in both
Angus populations. The Canadian population, exhibiting a higher frequency of the CAST
A allele, is potentially a valuable source for genetic improvement to beef tenderness in
Angus and other breeds. SNPs resulted in greater differences detectable between the
populations. Microsatellite markers, on the other hand, were more informative for
population assignment and genetic distance due to the increased number of potential
alleles.
52
7.0 References Aberdeen Angus Cattle Breeders’ Society of South Africa (2009)
www.studbook.co.za/society/angus Accessed July 2009 Afolayan, R.A., Pitchford, W.S., Deland, M.P.B. & McKiernan, W.A. (2007) Breed
variation and genetic parameters for growth and body development in diverse beef cattle genotypes. Animal 1, 13-20.
Agriculture and Agri-food Canada (2009) www.agr.gc.ca Accessed July 2009 Akey, J.M., Zhang, G., Zhang, K., Jin, L. & Shriver, M.D. (2002) Interrogating a high-
density SNP map for signatures of natural selection. Genome Research 12, 1805-1814. Alfonso, L., Parada, A., Legarra, A., Ugarte, E. & Arana, A. (2006) The effects of
selective breeding against scrapie susceptibility on the genetic variability of the Latxa black-faced sheep breed. Genetics, Selection and Evolution 38, 495-511.
American Angus Association (2009) www.angus.org Accessed July 2009 Australian Angus Association (2009) www.angusaustralia.com.au Accessed July 2009 Barendse, W.J. (2002) DNA markers for meat tenderness. International patent application
PCT/AU02/00122. International patent publication WO 02/064820 A1. Beja-Pereira, A., Alexandrino, P., Bessa, I., Carretero, Y., Dunner, S., Ferrand, N.,
Jordana, J., Laloe, D., Moazami-Goudarzi, K., Sanchez, A. & Canon, J. (2003) Genetic characterization of southwestern European bovine breeds: a historical and biogeographical reassessment with a set of 16 microsatellites. Journal of Heredity 94, 243-250.
The Bovine HapMap Consortium. (2009) Genome-wide survey of SNP variation
uncovers the genetic structure of cattle breeds. Science 324, 528-532. Bowcock, A.M., Ruiz-Linares, A., Tomfohrde, J., Minch, E., Kidd, J.R. & Cavalli-
Sforza, L.L. (1994) High resolution of human evolutionary trees with polymorphic microsatellites. Nature 368, 455-457.
Bradley, D.G., MacHugh, D.E., Cunningham, P. & Loftus, R.T. (1996) Mitochondrial
diversity and the origins of African and European cattle. Proceedings of National Academic Science of USA 93, 5131-5135.
Brenneman, R.A., Chase Jr., C.C., Olson, T.A., Riley, D.G. & Coleman, S.W. (2007)
Genetic diversity among Angus, American Brahman, Senepol, and Romosinuano cattle breeds. Animal Genetics 38, 50-53.
53
Briggs, H.M. & Briggs, D.M. (1980) Modern breeds of livestock. 4th edition. Macmillan Publishing Co. New York, New York.
Brown, W.M., George, M. & Wilson, A.C. (1979) Rapid evolution of animal
mitochondrial DNA. Proceedings of National Academic Science of USA 76, 1967-1971.
Buchanan, F.C., Fitzsimmons, C.J., Van Kessel, A.G., Thue, T.D., Winkelman-Sim, D.C.
& Schmutz, S.M. (2002) Association of a missense mutation in the bovine leptin gene with carcass fat content and leptin mRNA levels. Genetics, Selection and Evolution 34, 105-116.
Canadian Angus Association (2009) www.cdnangus.ca. Accessed July 2009. Canadian Beef Breeds Council (2009) www.canadianbeefbreeds.com Accessed July 2009 Casas, E., White, S.N., Wheeler, T.L., Shackelford, S.D., Koohmaraie, M., Riley, D.G.,
Chase, C.C., Johnson, D.D. & Smith, T.P.L. (2006) Effects of calpastatin and µ-calpain markers in beef cattle on tenderness traits. Journal of Animal Science 84, 520-525.
Cleveland, M.A., Blackburn, H.D., Enns, R.M. & Garrick, D.J. (2005) Changes in
inbreeding of U.S. Herefords during the twentieth century. Journal of Animal Science 83, 992-1001.
Cone, R.D., Lu, D., Koppula, S., Vage, D.I., Klungland, H., Boston, B., Chen, W., Orth,
D.N., Pouton, C. & Kesterson, R.A. (1996) The melanocortin receptors: agonists, antagonists, and the hormonal control of pigmentation. Recent Progress in Hormone Research 51, 287-318.
Coppieters, W., Riquet, J., Arranz, J.J., Berzi, P., Cambisano, N., Grisant, B., Karim, L.,
Marcq, F., Moreau, L., Nezer, C., Simon, P., Vanmanshoven, P., Wagenaar, D. & Georges, M. (1998) A QTL with major effect on milk yield and composition maps to bovine chromosome 14. Mammalian Genome 9, 540-544.
Crews Jr., D.H., Pollak, E.J. & Quaas, R.L. (2004) Evaluation of Simmental carcass EPD
estimated using live and carcass data. Journal of Animal Science 82, 661-667. DeVuyst, E.A., Bauer, M.L., Cheng, F.C., Mitchell, J. & Larson, D. (2008) The impact of
a leptin gene SNP on beef cattle weaning weights. Animal Genetics 39, 284-286. Ellegren, H., Moore, S., Robinson, N., Byrne, K., Ward, W. & Sheldon, B.C. (1997)
Microsatellite evolution- a reciprocal study of length repeats at homologous loci in cattle and sheep. Molecular Biology and Evolution 14, 854-860.
54
Fitzsimmons, C.J. (1999) An investigation into leptin’s role as a candidate gene for carcass fat levels in beef cattle. MSc. Thesis. University of Saskatchewan, Saskatoon, SK.
Food and Agriculture Organization of the United Nations (2009) www.fao.org Accessed
July 2009 Forbes, S.H., Hogg, J.T., Buchanan, F.C., Crawford, A.M. & Allendorf, F.W. (1995)
Microsatellite evolution in congeneric mammals: domestic and bighorn sheep. Molecular Biology and Evolution 12, 1106-1113.
Frankham, R., Ballou, J.D. & Briscoe, D.A. (2002) Introduction to conservation genetics.
Cambridge University Press, Cambridge, U.K. Freeman, A.R., Bradley, D.G., Nagda, S., Gibson, J.P. & Hanotte, O. (2005)
Combination of multiple microsatellite data sets to investigate genetic diversity and admixture of domestic cattle. Animal Genetics 37, 1-9.
Gavrila, A., Chan, J.L., Miller, L.C., Heist, K., Yiannakouris, N. & Mantzoros, C.S.
(2005) Circulating melanin-concentrating hormone, agouti-related protein, and α-melanin-stimulating hormone levels in relation to body composition: alterations in response to food deprivation and recombinant human leptin administration. Journal of Clinical Endocrinology and Metabolism 90, 1047-1054.
Georges, M. & Andersson, L. (1996) Livestock genomics comes of age. Genome
Research 6, 907-921. Goodall, J.J. & Schmutz, S.M. (2003) Linkage mapping of IGF2 on cattle chromosome
29. Animal Genetics 34, 313. Goodall, J.J. & Schmutz, S.M. (2007) IGF2 gene characterization and association with
rib eye area in beef cattle. Animal Genetics 38, 154. Guo, S.W. & Thompson, E.A. (1992) Performing the exact test of Hardy-Weinberg
proportion for multiple alleles. Biometrics 48, 361-372. Helgeson, S.C. & Schmutz, S.M. (2008) Genetic variations in the Pro-Melanin-
Concentrating Hormone affects carcass traits in Bos Taurus cattle. Animal Genetics 39, 310-315.
Henkes, L.E., Silva, W.A., Moraes, J.C.F. & Weimer, T.A. (2005) Mitochondrial control
region genetic diversity and maternal ancestry of a Brangus-Ibage cattle population. Genetics and Molecular Biology 28, 60-66.
Huszar, D., Lynch, C.A., Fairchild-Huntress, V., Dunmore, J.H., Fang, Q., Berkemeier,
L.R., Gu, W., Kestersen, R.A., Boston, B.A., Cone, R.D., Smith, F.J., Campfield,
55
L.A., Burn, P. & Lee, F. (1997) Targeted disruption of melanocortin 4 receptor results in obesity in mice. Cell 88, 131-141.
Igenity (2009) www.igenity.com Accessed July 2009 Irish Angus Society (2009) www.irishangus.ie Accessed July 2009 Joerg, H., Fries, H.R., Meijerink, E. & Stanzinger, G.F. (1996) Red coat color in Holstein
cattle is associated with a deletion in the MSHR gene. Mammalian Genome 7, 317-318.
Kantanen, J., Olsaker, I., Holm, L.E., Lien, S., Vilkki, J., Brusgaard, K., Eythorsdottir, E.,
Danell, B. & Adalsteinsson, S. (2000) Genetic diversity and population structure of 20 north European cattle breeds. Journal of Heredity 91, 446-457.
Kim, K.I., Lee, J.H., Lee, S.S. & Yang, Y.H. (2003) Phylogenetic relationships of
northeast Asian cattle to other cattle populations determined using mitochondrial DNA D-loop sequence polymorphism. Biochemical Genetics 41, 91-97.
Klungland, H., Vage, D.I., Gomez-Raya, L., Adalsteinsson, S. & Lien, S. (1995) The role
of melanocyte-stimulating hormone (MSH) receptor in bovine coat color determination. Mammalian Genome 6, 636-639.
Kononoff, P.J., Deobald, H.M., Stewart, E.L., Laycock, A.D. & Marquess, F.L.S. (2005)
The effect of a leptin single nucleoide polymorphism on quality grade, yield grade, and carcass weight of beef cattle. Journal of Animal Science 83, 927-932.
Koohmaraie, M. (1996) Biochemical factors regulating the toughening and tenderization
process of meat. Meat Science 43, S193-S201. Li, M.H., Adamowicz, T., Switonski, M., Ammosov, I., Ivanova, Z., Kiselyova, T.,
Popov, R. & Kantanen, J. (2006) Analysis of population differentiation in North Eurasian cattle (Bos taurus) using single nucleotide polymorphisms in three genes associated with production traits. Animal Genetics 37, 390-392.
Loftus, R.T., MacHugh, D.E., Bradley, D.G., Sharp, P.M. & Cunningham, P. (1994)
Evidence for two independent domestications of cattle. Evolution 91, 2757-2761. MacEachern, S., Hayes, B., McEwan, J. & Goddard, M. (2009) An examination of
positive selection and changing effective population size in Angus and Holstein cattle populations (Bos taurus) using a high density SNP genotyping platform and the contribution of ancient polymorphisms to genomic diversity in domestic cattle. BMC Genetics 10, 181.
56
MacHugh, D.E., Shriver, M.D., Loftus, R.T., Cunningham, P. & Bradley, D.G. (1997) Microsatellite DNA variation and the evolution, domestication, and phylogeography of Taurine and Zebu cattle. Genetics 146, 1071-1086.
MacHugh, D.E., Loftus, R.T., Cunningham, P. & Bradley, D.G. (1998) Genetic structure
of seven European cattle breeds assessed using 20 microsatellite markers. Animal Genetics 29, 333-340.
MacNeil, M.D., Cronin, M.A., Blackburn, H.D., Richards, C.M., Lockwood, D.R. &
Alexander, L.J. (2007) Genetic relationships between feral cattle from Chirikof Island, Alaska and other breeds. Animal Genetics 38, 193-197.
Martin-Burriel, I., Garcia-Muro, E. & Zaragoza, P. (1999) Genetic diversity analysis of
six Spanish native cattle breeds using microsatellites. Animal Genetics 30, 177-182. McKay, S.D., Schnabel, R.D., Murdoch, B.M., Matukumalli, L.K., Aerts, J., Coppieters,
W., Crews, D., Neto, E.D., Gill, C.A., Gao, C., Mannen, H., Wang, Z., Van Tassell, C.P., Williams, J.L., Taylor, J.F. & Moore, S.S. (2008) An assessment of population structure in eight breeds of cattle using a whole genome SNP panel. BMC Genetics 9, 37.
McLean, K.L & Schmutz, S.M. (2009) Associations of melanocortin 1 receptor genotype
with growth and carcass traits in beef cattle. Canadian Journal of Animal Science 89, 295-300.
Monzavi, R. & Cohen, P. (2002) IGFs and IGFBPs: role in health and disease. Best
Practice and Research in Clinical Endocrinology and Metabolism 16, 433-447. Morris, C.A., Cullen, N.G., Hickey, S.M., Dobbie, P.M., Veenvliet, B.A., Manley, T.R.,
Pitchford, W.S., Kruk, Z.A., Bottema, C.D.K. & Wilson, T. (2006) Genotypic effects of calpain1 and calpastatin on the tenderness of cooked M. longissimus dorsi steaks from Jersey X Limousin, Angus, and Hereford-cross cattle. Animal Genetics 37, 411-414.
Mukesh, M., Sodhi, M., Bhatia, S. & Mshra, B.P. (2004) Genetic diversity of Indian
native cattle breeds as analyzed with 20 microsatellite loci. Journal of Animal Breeding and Genetics 121, 416-424.
Negrini, R., Nicoloso, L., Crepaldi, P., Milanesi, E., Colli, L., Chegdani, F., Pariset, L.,
Dunner, S., Leveziel, H., Williams, J.L. & Ajmone Marsan, P. (2008) Assessing SNP markers for assigning individuals to cattle populations. Animal Genetics 40, 18-26.
Nei, M. (1978) Estimation of average heterozygosity and genetic distance from a small
number of individuals. Genetics 89, 583-590.

57
Notter, D.R. (1999) The importance of genetic diversity in livestock populations of the future. Journal of Animal Science 77, 61-69.
Page, B.T., Casas, E., Heaton, M.P., Cullen, N.G., Hyndman, D.L., Morris, C.A.,
Crawford, A.M., Wheeler, T.L., Koohmaraie, M., Keele, J.W. & Smith, T.P.L. (2002) Evaluation of single nucleotide polymorphisms in CAPN1 for association with meat tenderness in cattle. Journal of Animal Science 80, 3077-3085.
Peakall, R. & Smouse, P.E. (2006) GenAlEx 6: genetic analysis in Excel. Population
genetic software for teaching and research. Molecular Ecology Notes 6, 288-295. Pfizer Genetic Soultions (2009) www.geneticsoultions.com Accessed July 2009 Pritchard, J.K., Stephens, M. & Donnelly, P. (2000) Inference of population structure
using multilocus genotype data. Genetics 155, 945-959. Rasali, D.P., Crow, G.H., Shrestha, J.N.B., Kennedy, A.D. & Brule-Babel, A. (2005)
Multiple trait estimates of genetic parameters for juvenile growth and calving traits in Canadian Angus cattle. Canadian Journal of Animal Science 85, 309.
Red Angus Association of America (2009) www.redangus.org Accessed July 2009 Ruane, J. (1999) A critical review of the value of genetic distance studies in conservation
of animal genetic resources. Journal of Animal Breeding and Genetics 116, 317-323. Sasazaki, S., Mutoh, H., Tsurifune, K. & Mannen, H. (2007) Development of DNA
markers for discrimination between domestic and imported beef. Meat Science 77, 161-166.
Schlumbaum, A., Stopp, B., Breuer, G., Rehazek, A., Blatter, R., Turgay, M. & Schibler,
J. (2003) Combining archaeozoology and molecular genetics: the reason behind the changes in cattle size between 150 BCE and 700 AD in Northern Switzerland. Antiquity 77, 1-14.
Schutz, M.M., Freeman, A.E., Lindberg, G.L., Koehler, C.M. & Beitz, D.C. (1994) The
effect of mitochondrial DNA on milk production and health of dairy cattle. Livestock Production Science 37, 283-295.
Shimada, M., Tritos, N.A., Lowell, B., Flier, J.S. & Maratos-Flier, E. (1998) Mice
lacking melanin-concentrating hormone are hypophagic and lean. Nature 396, 670-674.
Stone, R.T., Grosse, W.M., Casas, E., Smith, T.P.L., Kelle, J.W. & Bennett, G.L. (2002)
Use of bovine EST data and human genomic sequences to map 100 gene-specific bovine markers. Mammalian Genome 13, 211-215.
58
Stone, R.T., Kappes, S.M. & Beattie, C.W. (1996) The bovine homolog of the obese gene maps to Chromosome 4. Mammalian Genome 7, 339-340.
Taanman, J.W. (1999) The mitochondrial genome: structure, transcription, translation,
and replication. Biochimica et Biophysica Acta 1410, 103-123. Van Eenennaam, A.L., Li, J., Thallman, R.M., Quaas, R.L., Dikeman, M.E., Gill, C.A.,
Franke, D.F. & Thomas, M.G. (2007) Validation of commercial DNA tests for quantitative beef quality traits. Journal of Animal Science 85, 891-900.
Vasconcellos, L.P.M.K., Tambasco-Talhari, D., Pereira, A.P., Coutinho, L.L. &
Regitano, L.C.A. (2003) Genetic characterization of Aberdeen Angus cattle using molecular markers. Genetics and Molecular Biology 26, 133-137.
Vieselmeyer, B.A., Rasby, R.J., Gwartney, B.L., Calkins, C.R., Stock, R.A. & Gosey,
J.A. (1996) Use of expected progeny differences for marbling in beef: I. production traits. Journal of Animal Science 74, 1009-1013.
Vitalis, R., Dawson, K. & Boursot, P. (2001) Interpretation of variation across marker
loci as evidence of selection. Genetics 158, 1811-1823. Weir, B.S. (1996) Genetic Data Analysis: Methods for Discrete Population Genetic Data.
2nd edition. Sinauer Associates, Massachusetts, p. 445. Werth, L.A., Hawkins, G.A., Eggen, A., Petit, E., Elduque, C., Kreigesmann, B. &
Bishop, M.D. (1996) Rapid communication: Melanocyte stimulating hormone receptor (MC1R) maps to bovine chromosome 18. Journal of Animal Science 74, 262.
White, S.N., Casas, E., Wheeler, T.L., Shackelford, S.D., Koohmaraie, M., Riley, D.G.,
Chase, C.C., Johnson, D.D., Keele, J.W. & Smith, T.P.L. (2005) A new SNP in CAPN1 is associated with tenderness in cattle of Bos indicus, Bos Taurus, and crossbred descent. Journal of Animal Science 83, 2001-2008.
Wiener, P., Burton, D. & Williams, J.L. (2004) Breed relationships and definition in
British cattle: a genetic analysis. Heredity 93, 597-602. Zenger, K.R., Khatkar, M.S., Cavanagh, J.A.L., Hawken, R.J. & Raadsma, H.W. (2006)
Genome-wide genetic diversity of Holstein-Friesian cattle reveals new insights into Australian and global population variability, including impact of selection. Animal Genetics 38, 7-14.
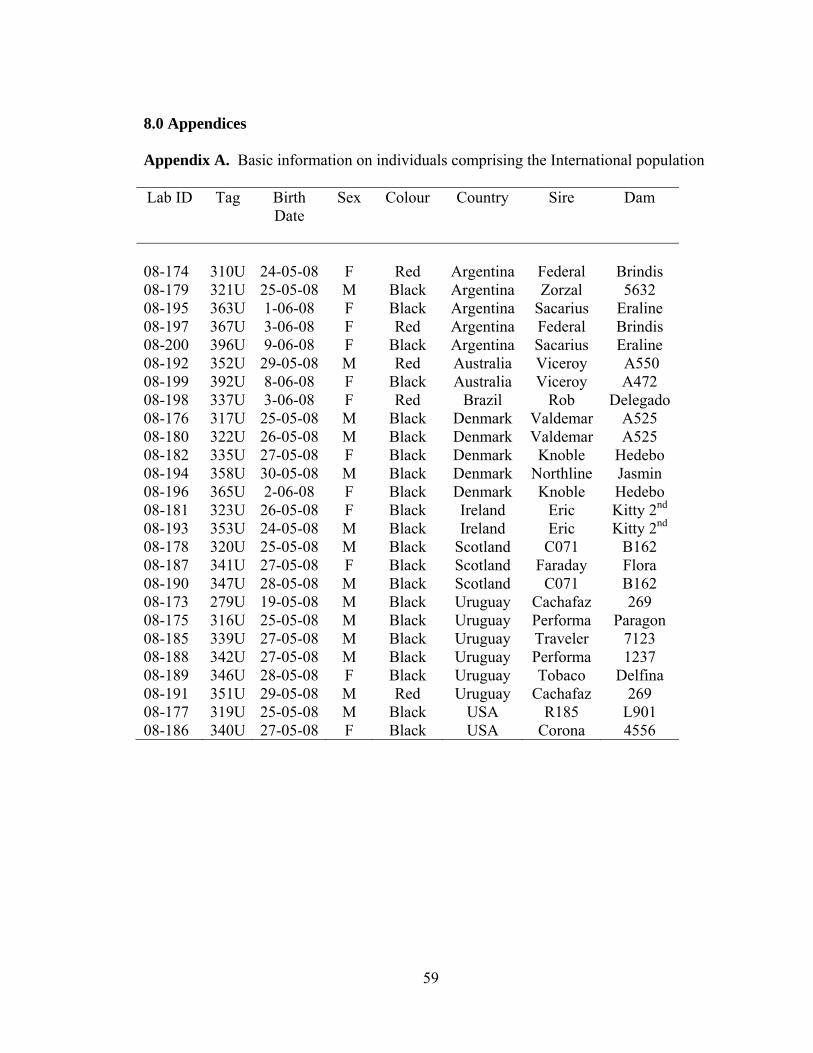
59
8.0 Appendices Appendix A. Basic information on individuals comprising the International population
Lab ID Tag Birth Date
Sex Colour Country Sire Dam
08-174 310U 24-05-08 F Red Argentina Federal Brindis 08-179 321U 25-05-08 M Black Argentina Zorzal 5632 08-195 363U 1-06-08 F Black Argentina Sacarius Eraline 08-197 367U 3-06-08 F Red Argentina Federal Brindis 08-200 396U 9-06-08 F Black Argentina Sacarius Eraline 08-192 352U 29-05-08 M Red Australia Viceroy A550 08-199 392U 8-06-08 F Black Australia Viceroy A472 08-198 337U 3-06-08 F Red Brazil Rob Delegado 08-176 317U 25-05-08 M Black Denmark Valdemar A525 08-180 322U 26-05-08 M Black Denmark Valdemar A525 08-182 335U 27-05-08 F Black Denmark Knoble Hedebo 08-194 358U 30-05-08 M Black Denmark Northline Jasmin 08-196 365U 2-06-08 F Black Denmark Knoble Hedebo 08-181 323U 26-05-08 F Black Ireland Eric Kitty 2nd 08-193 353U 24-05-08 M Black Ireland Eric Kitty 2nd 08-178 320U 25-05-08 M Black Scotland C071 B162 08-187 341U 27-05-08 F Black Scotland Faraday Flora 08-190 347U 28-05-08 M Black Scotland C071 B162 08-173 279U 19-05-08 M Black Uruguay Cachafaz 269 08-175 316U 25-05-08 M Black Uruguay Performa Paragon 08-185 339U 27-05-08 M Black Uruguay Traveler 7123 08-188 342U 27-05-08 M Black Uruguay Performa 1237 08-189 346U 28-05-08 F Black Uruguay Tobaco Delfina 08-191 351U 29-05-08 M Red Uruguay Cachafaz 269 08-177 319U 25-05-08 M Black USA R185 L901 08-186 340U 27-05-08 F Black USA Corona 4556
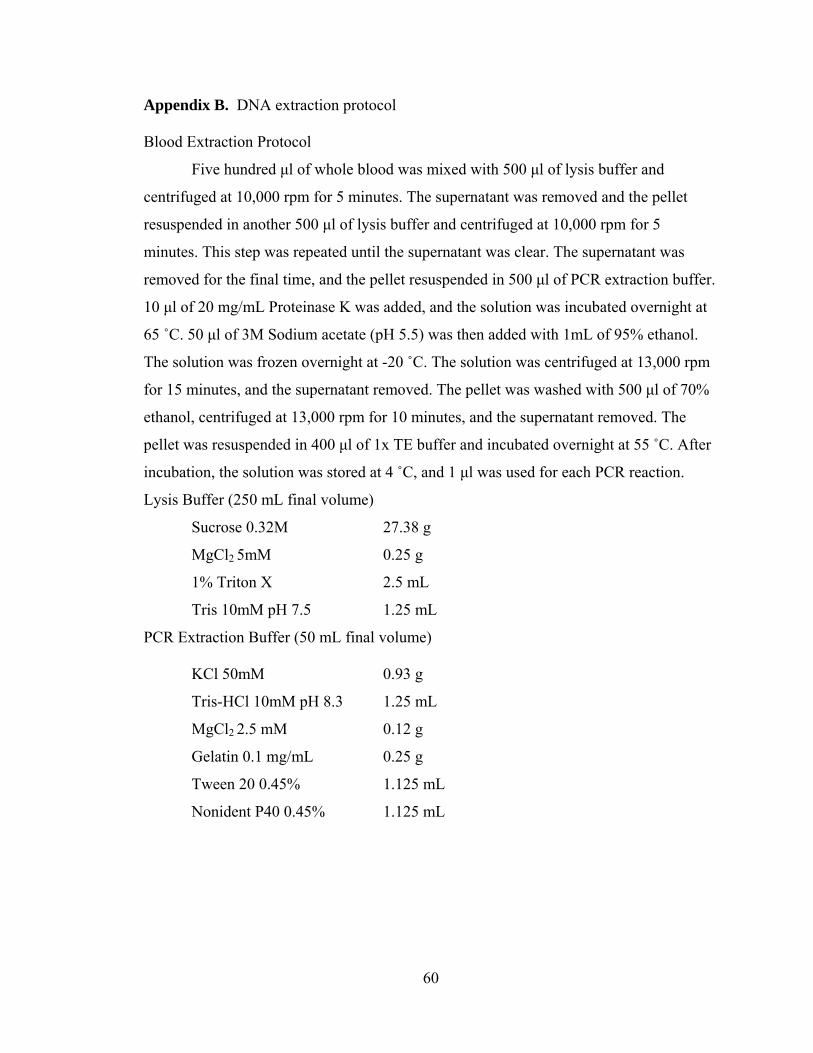
60
Appendix B. DNA extraction protocol
Blood Extraction Protocol
Five hundred μl of whole blood was mixed with 500 μl of lysis buffer and
centrifuged at 10,000 rpm for 5 minutes. The supernatant was removed and the pellet
resuspended in another 500 μl of lysis buffer and centrifuged at 10,000 rpm for 5
minutes. This step was repeated until the supernatant was clear. The supernatant was
removed for the final time, and the pellet resuspended in 500 μl of PCR extraction buffer.
10 μl of 20 mg/mL Proteinase K was added, and the solution was incubated overnight at
65 ˚C. 50 μl of 3M Sodium acetate (pH 5.5) was then added with 1mL of 95% ethanol.
The solution was frozen overnight at -20 ˚C. The solution was centrifuged at 13,000 rpm
for 15 minutes, and the supernatant removed. The pellet was washed with 500 μl of 70%
ethanol, centrifuged at 13,000 rpm for 10 minutes, and the supernatant removed. The
pellet was resuspended in 400 μl of 1x TE buffer and incubated overnight at 55 ˚C. After
incubation, the solution was stored at 4 ˚C, and 1 μl was used for each PCR reaction.
Lysis Buffer (250 mL final volume)
Sucrose 0.32M 27.38 g
MgCl2 5mM 0.25 g
1% Triton X 2.5 mL
Tris 10mM pH 7.5 1.25 mL
PCR Extraction Buffer (50 mL final volume)
KCl 50mM 0.93 g
Tris-HCl 10mM pH 8.3 1.25 mL
MgCl2 2.5 mM 0.12 g
Gelatin 0.1 mg/mL 0.25 g
Tween 20 0.45% 1.125 mL
Nonident P40 0.45% 1.125 mL
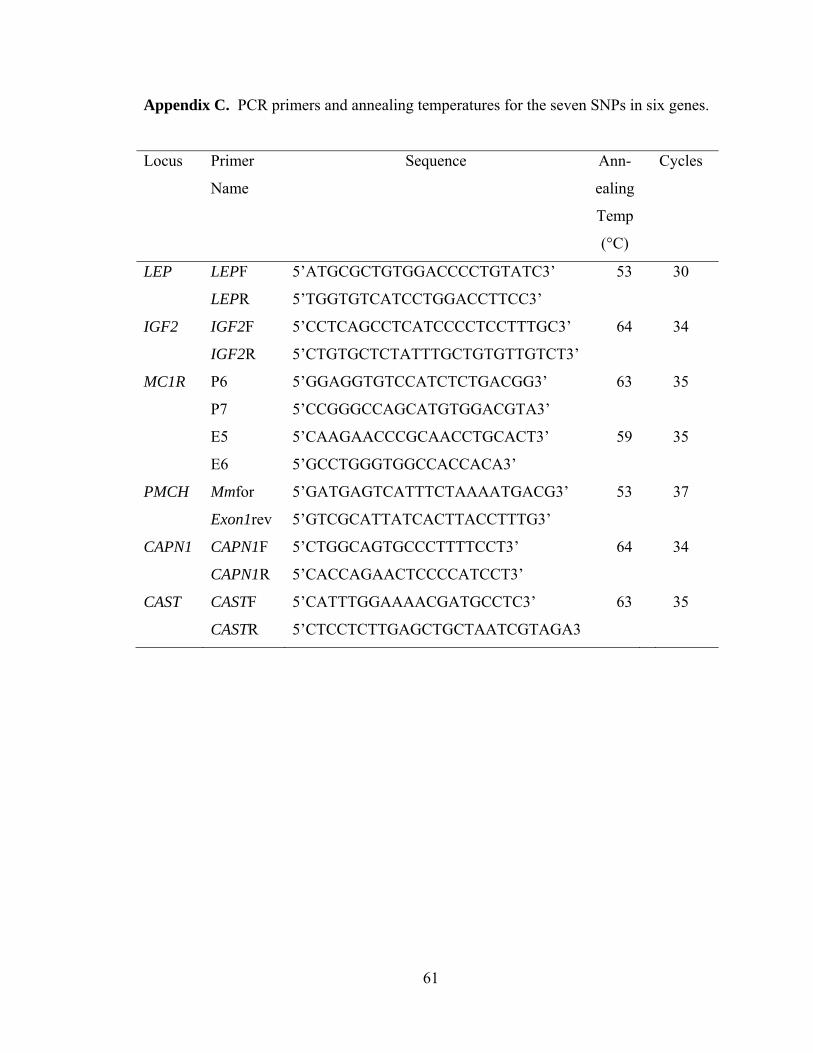
61
Appendix C. PCR primers and annealing temperatures for the seven SNPs in six genes.
Locus Primer
Name
Sequence Ann-
ealing
Temp
(°C)
Cycles
LEP LEPF 5’ATGCGCTGTGGACCCCTGTATC3’ 53 30
LEPR 5’TGGTGTCATCCTGGACCTTCC3’
IGF2 IGF2F 5’CCTCAGCCTCATCCCCTCCTTTGC3’ 64 34
IGF2R 5’CTGTGCTCTATTTGCTGTGTTGTCT3’
MC1R P6 5’GGAGGTGTCCATCTCTGACGG3’ 63 35
P7 5’CCGGGCCAGCATGTGGACGTA3’
E5 5’CAAGAACCCGCAACCTGCACT3’ 59 35
E6 5’GCCTGGGTGGCCACCACA3’
PMCH Mmfor 5’GATGAGTCATTTCTAAAATGACG3’ 53 37
Exon1rev 5’GTCGCATTATCACTTACCTTTG3’
CAPN1 CAPN1F 5’CTGGCAGTGCCCTTTTCCT3’ 64 34
CAPN1R 5’CACCAGAACTCCCCATCCT3’
CAST CASTF 5’CATTTGGAAAACGATGCCTC3’ 63 35
CASTR 5’CTCCTCTTGAGCTGCTAATCGTAGA3
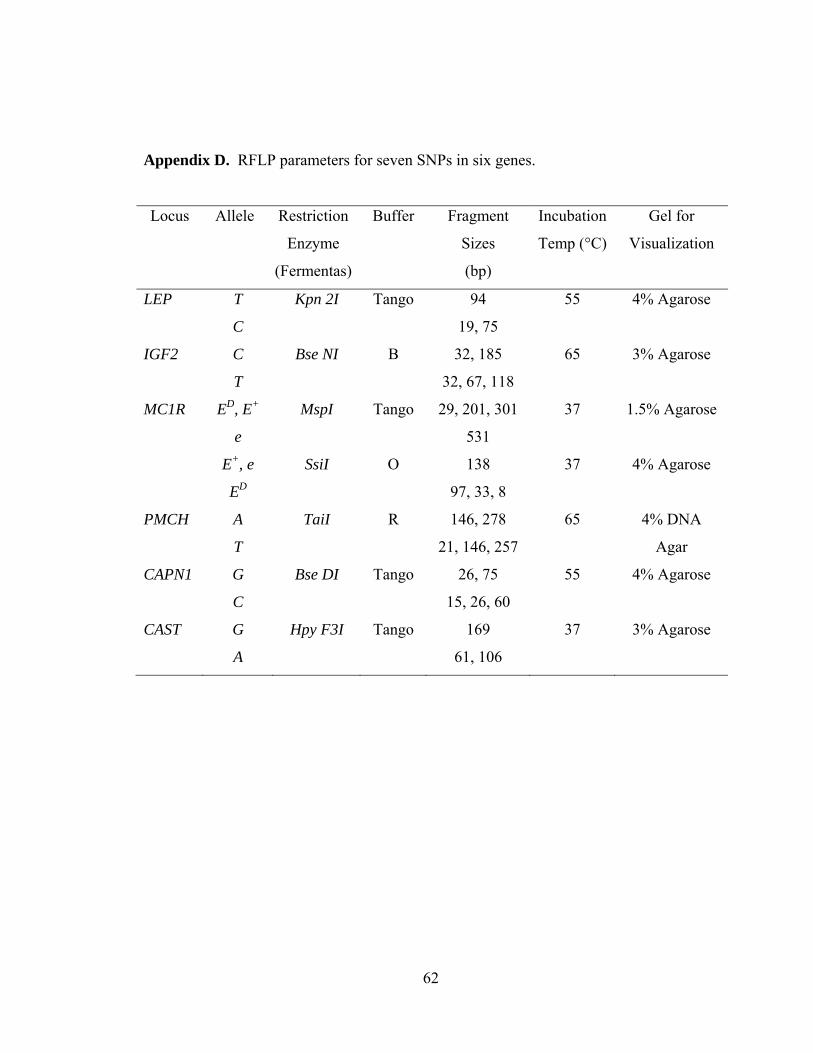
62
Appendix D. RFLP parameters for seven SNPs in six genes.
Locus Allele Restriction
Enzyme
(Fermentas)
Buffer Fragment
Sizes
(bp)
Incubation
Temp (°C)
Gel for
Visualization
LEP T Kpn 2I Tango 94 55 4% Agarose
C 19, 75
IGF2 C Bse NI B 32, 185 65 3% Agarose
T 32, 67, 118
MC1R ED, E+ MspI Tango 29, 201, 301 37 1.5% Agarose
e 531
E+, e SsiI O 138 37 4% Agarose
ED 97, 33, 8
PMCH A TaiI R 146, 278 65 4% DNA
T 21, 146, 257 Agar
CAPN1 G Bse DI Tango 26, 75 55 4% Agarose
C 15, 26, 60
CAST G Hpy F3I Tango 169 37 3% Agarose
A 61, 106

63
Appendix E. PCR parameters for 22 microsatellite markers.
Marker Name Chromosome Allele Range (bp)
Annealing Temperature
(°C) BM1818 23 248-278 52 BM2113 2 122-156 58.7 CSRM60 10 79-115 52 CSSM66 14 171-209 58.7 ETH185 17 214-246 58.7 ETH225 9 131-159 52 ETH3 19 103-133 58.7 HAUT24 22 104-158 52 HEL1 15 99-119 52 HEL9 8 141-173 52 ILSTS006 7 277-309 58.7 ILSTS005 10 176-194 52 INRA023 3 195-225 52 INRA032 11 160-204 52 INRA037 10 112-148 52 INRA063 18 167-189 58.7 MM12 9 101-145 52 SPS115 15 234-258 52 TGLA126 20 115-131 52 TGLA227 18 75-105 52 TGLA53 16 136-184 52 TGLA122 21 136-184 52
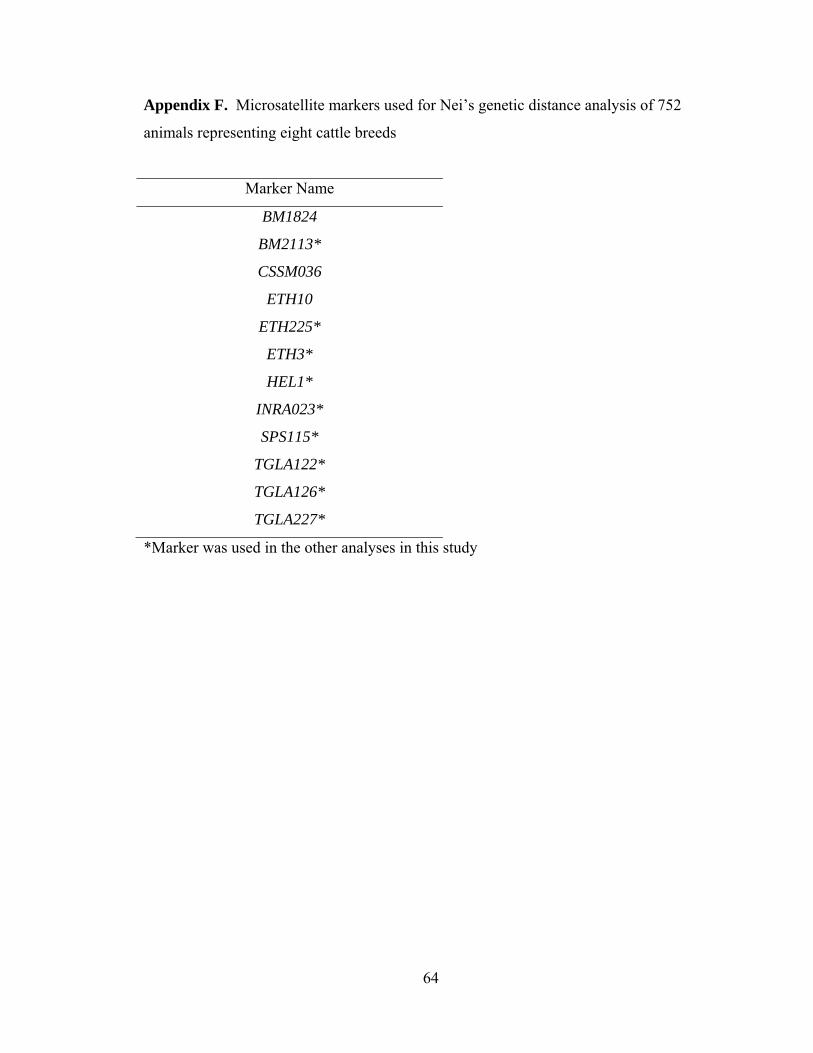
64
Appendix F. Microsatellite markers used for Nei’s genetic distance analysis of 752
animals representing eight cattle breeds
Marker Name
BM1824
BM2113*
CSSM036
ETH10
ETH225*
ETH3*
HEL1*
INRA023*
SPS115*
TGLA122*
TGLA126*
TGLA227*
*Marker was used in the other analyses in this study