Embed Size (px)
Citation preview
19th World Conference on Non-Destructive Testing 2016
1 License: http://creativecommons.org/licenses/by/3.0/
Comparison Corrosion Mapping Solutions using Phased Array, Conventional UT and 3D scanners
Jonathan TURCOTTE 1, Philippe RIOUX 1, Jérôme-Alexandre LAVOIE 2 1 Sonatest, Québec City, QC, Canada
2 Creaform, Lévis, QC Canada
Contact e-mail: [email protected]; [email protected]; [email protected]
Abstract. Corrosion mapping is a quantitative way to inspect a material where oxidation or erosion has reduced its thickness. Since an ultrasonic path is directly reduced on a corroded part, a conventional UT beam can report one specific thickness at a time while a phased array scan can produce an array of thicknesses. For the 3D scanners, since access to inner surface is generally restricted, the combination of a 3D scan (when available) with UT data creates a very powerful solution. Today instrument embedded software provides all the necessary tools to produce efficient corrosion mapping results with different level of precision (resolution) that depends on the technology used. In addition to that, PC software applications enhance that workflow by assisting the technician in planning the inspection (scan plan), analysing the data recorded and taking the right decision. Since each techniques are accurate, this paper ultimately compares these corrosion mapping solutions showing advantages, benefits and limitations along with some results.
Introduction
Corrosion is the degradation of metallic structures which can have a variety of causal factors and can display itself in many different ways. Corrosion inspection procedure is to evaluate the remaining wall thickness or the presence of mid-wall anomalies in a pipework, pressure vessels or any metallic structure. This inspection technique has always been in the heart of many problematic situations for production, maintenance and integrity engineers because of the safety and economic cost such material degradation can cause to the industrial and civil infrastructures. The standard approach to the inspection of corrosion is to use flaw detectors, however there is a growing requirement for corrosion mapping. Independently of the methodology chosen, corrosion mapping ultimately consists of an arranged grid of data collected over a specific area. Even if at the end each data point is a wall thickness measurement, the resolution of a corrosion mapping technique is very dependant of the technology involved in the process. As an example, here are three techniques able to perform corrosion mapping but that deliver very different resolution outcomes.
More info about this article: http://ndt.net/?id=19236
2
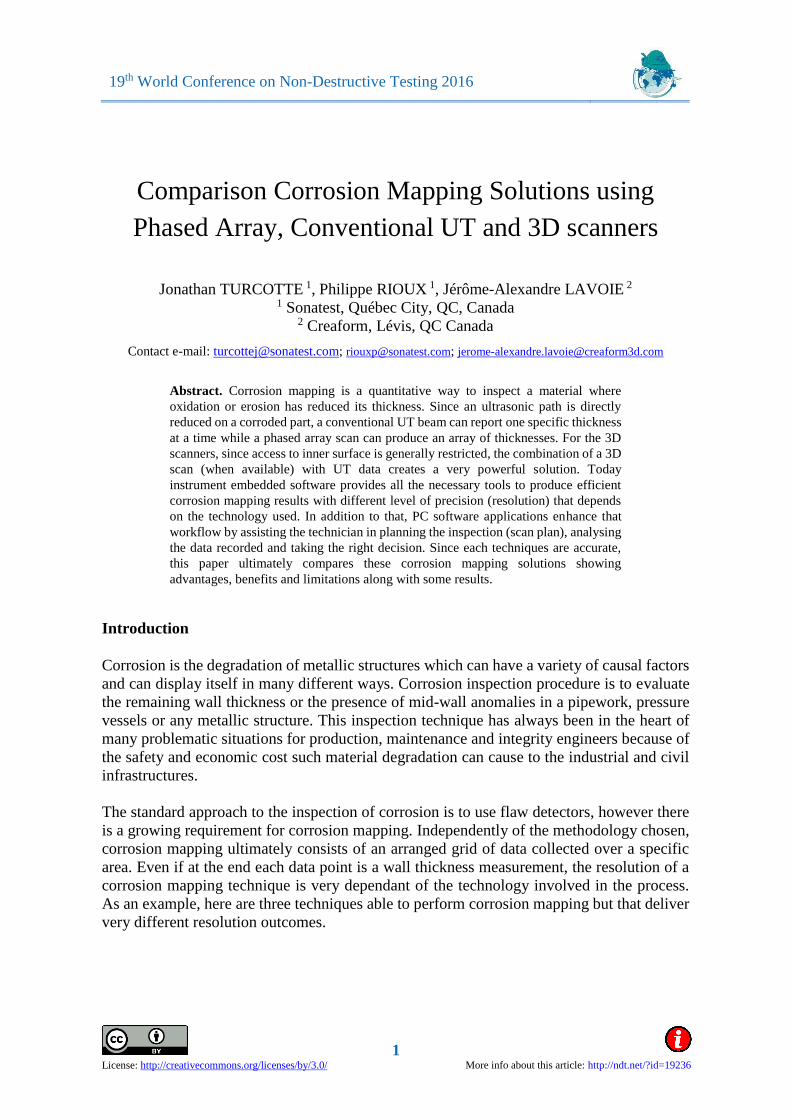
Conventional UT Thickness Logging Typical Resolution
[25-250 mm] | [1-10 inch]
Phased Array Internal Corrosion Mapping
Typical Resolution [1-5 mm] | [0.04-0.2 inch]
3D Scanner True Wall Thickness
Typical Resolution [0.05-5 mm] | [0.002-0.2 inch]
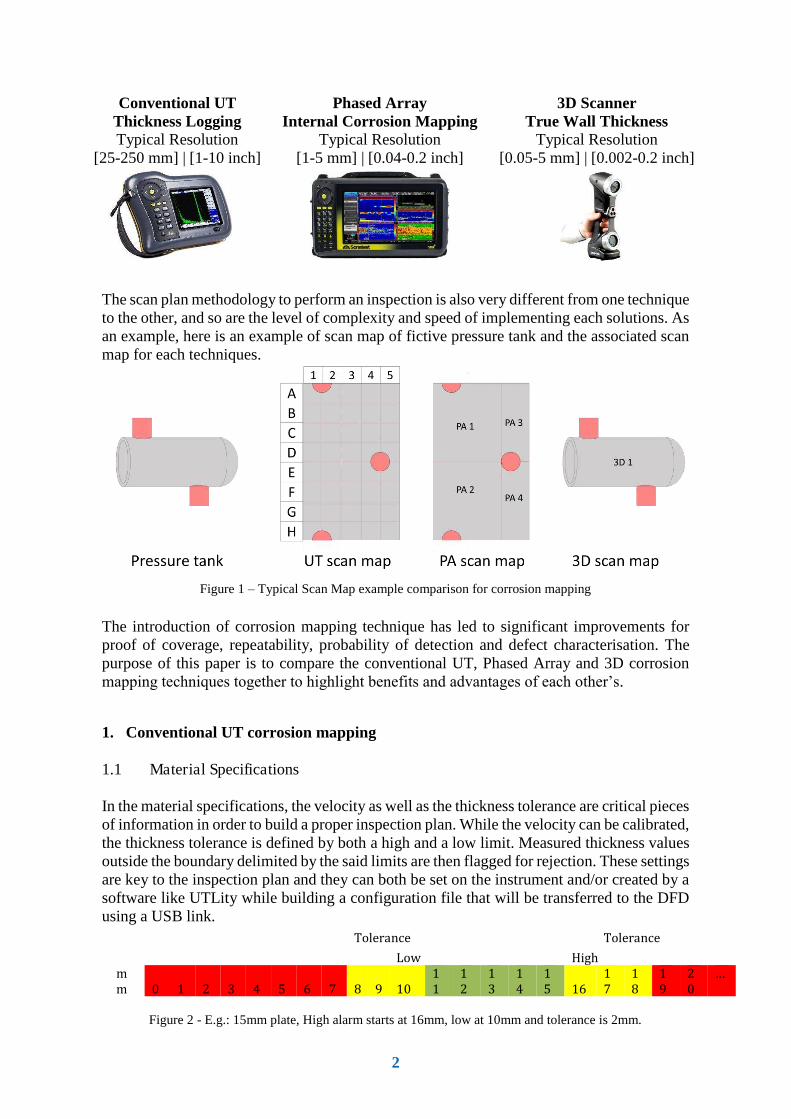
The scan plan methodology to perform an inspection is also very different from one technique to the other, and so are the level of complexity and speed of implementing each solutions. As an example, here is an example of scan map of fictive pressure tank and the associated scan map for each techniques.
Figure 1 – Typical Scan Map example comparison for corrosion mapping
The introduction of corrosion mapping technique has led to significant improvements for proof of coverage, repeatability, probability of detection and defect characterisation. The purpose of this paper is to compare the conventional UT, Phased Array and 3D corrosion mapping techniques together to highlight benefits and advantages of each other’s.
1. Conventional UT corrosion mapping
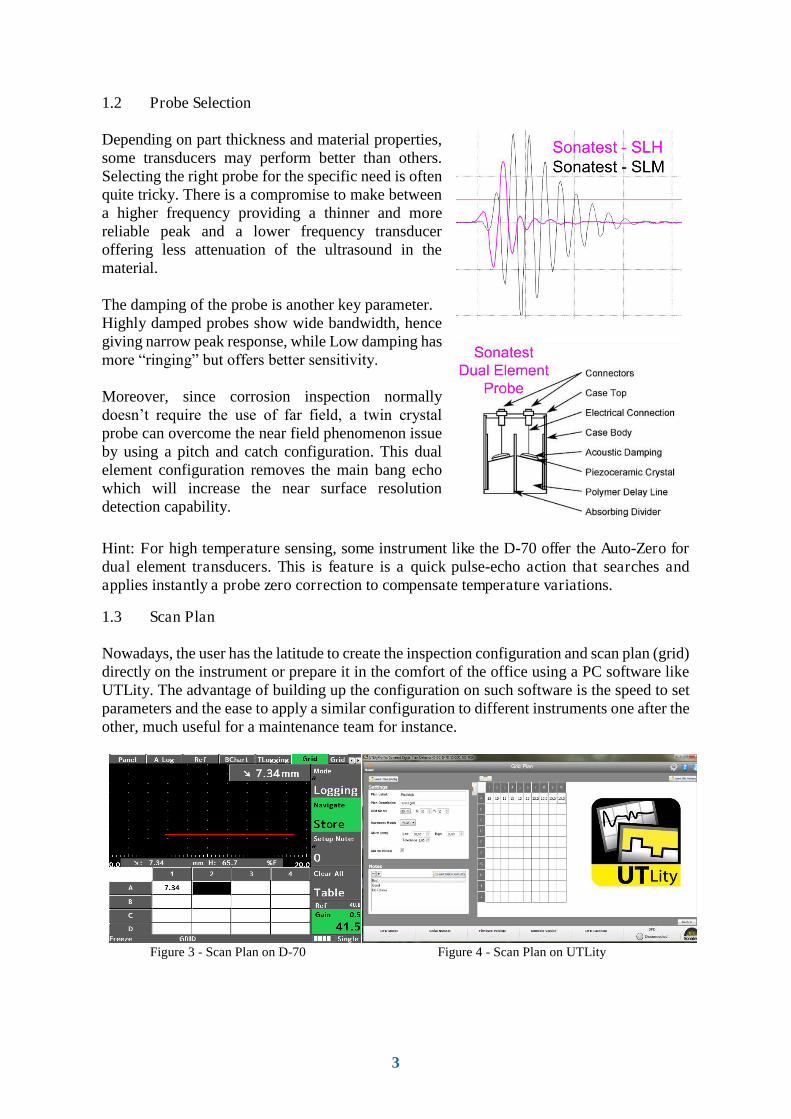
1.1 Material Specifications In the material specifications, the velocity as well as the thickness tolerance are critical pieces of information in order to build a proper inspection plan. While the velocity can be calibrated, the thickness tolerance is defined by both a high and a low limit. Measured thickness values outside the boundary delimited by the said limits are then flagged for rejection. These settings are key to the inspection plan and they can both be set on the instrument and/or created by a software like UTLity while building a configuration file that will be transferred to the DFD using a USB link.
Tolerance Tolerance
Low High
m
m 0 1 2 3 4 5 6 7 8 9 10
1
1
1
2
1
3
1
4
1
5 16
1
7
1
8
1
9
2
0
…
Figure 2 - E.g.: 15mm plate, High alarm starts at 16mm, low at 10mm and tolerance is 2mm.
3
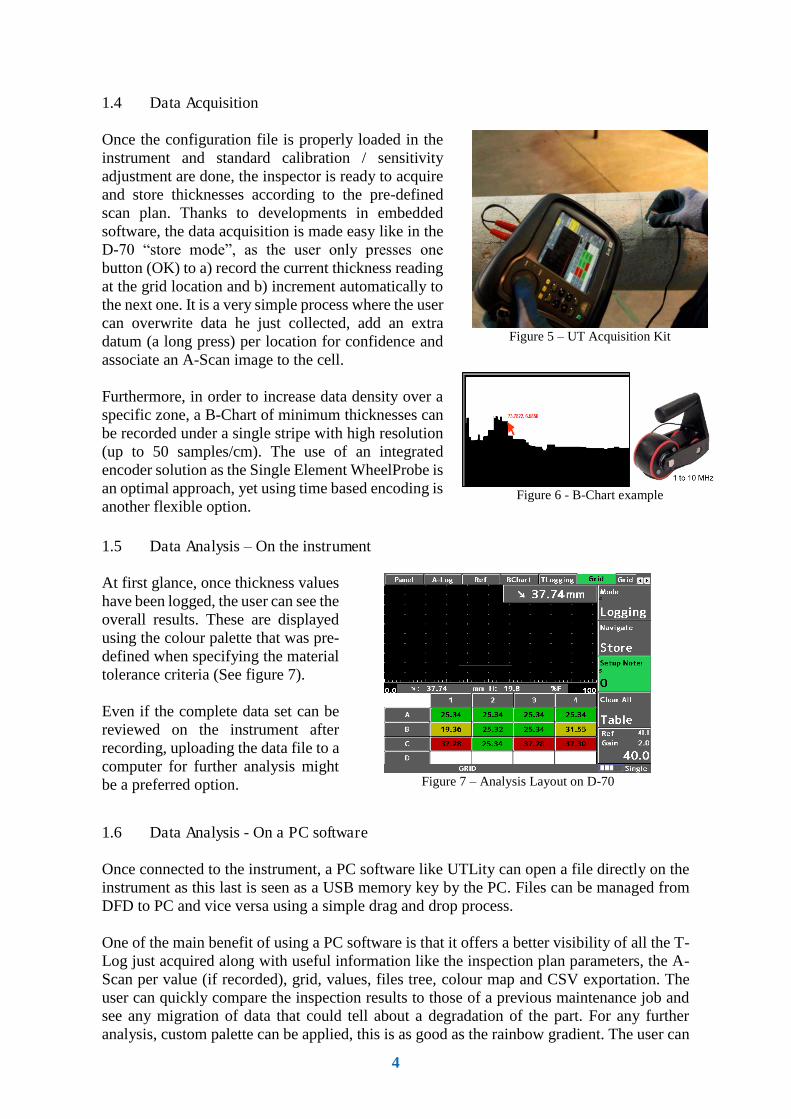
1.2 Probe Selection Depending on part thickness and material properties, some transducers may perform better than others. Selecting the right probe for the specific need is often quite tricky. There is a compromise to make between a higher frequency providing a thinner and more reliable peak and a lower frequency transducer offering less attenuation of the ultrasound in the material. The damping of the probe is another key parameter. Highly damped probes show wide bandwidth, hence giving narrow peak response, while Low damping has more “ringing” but offers better sensitivity. Moreover, since corrosion inspection normally doesn’t require the use of far field, a twin crystal probe can overcome the near field phenomenon issue by using a pitch and catch configuration. This dual element configuration removes the main bang echo which will increase the near surface resolution detection capability.
Hint: For high temperature sensing, some instrument like the D-70 offer the Auto-Zero for dual element transducers. This is feature is a quick pulse-echo action that searches and applies instantly a probe zero correction to compensate temperature variations.
1.3 Scan Plan Nowadays, the user has the latitude to create the inspection configuration and scan plan (grid) directly on the instrument or prepare it in the comfort of the office using a PC software like UTLity. The advantage of building up the configuration on such software is the speed to set parameters and the ease to apply a similar configuration to different instruments one after the other, much useful for a maintenance team for instance.
Figure 3 - Scan Plan on D-70 Figure 4 - Scan Plan on UTLity
4
1.4 Data Acquisition Once the configuration file is properly loaded in the instrument and standard calibration / sensitivity adjustment are done, the inspector is ready to acquire and store thicknesses according to the pre-defined scan plan. Thanks to developments in embedded software, the data acquisition is made easy like in the D-70 “store mode”, as the user only presses one button (OK) to a) record the current thickness reading at the grid location and b) increment automatically to the next one. It is a very simple process where the user can overwrite data he just collected, add an extra datum (a long press) per location for confidence and associate an A-Scan image to the cell. Furthermore, in order to increase data density over a specific zone, a B-Chart of minimum thicknesses can be recorded under a single stripe with high resolution (up to 50 samples/cm). The use of an integrated encoder solution as the Single Element WheelProbe is an optimal approach, yet using time based encoding is another flexible option.
Figure 5 – UT Acquisition Kit
Figure 6 - B-Chart example
1.5 Data Analysis – On the instrument At first glance, once thickness values have been logged, the user can see the overall results. These are displayed using the colour palette that was pre-defined when specifying the material tolerance criteria (See figure 7). Even if the complete data set can be reviewed on the instrument after recording, uploading the data file to a computer for further analysis might be a preferred option.
Figure 7 – Analysis Layout on D-70
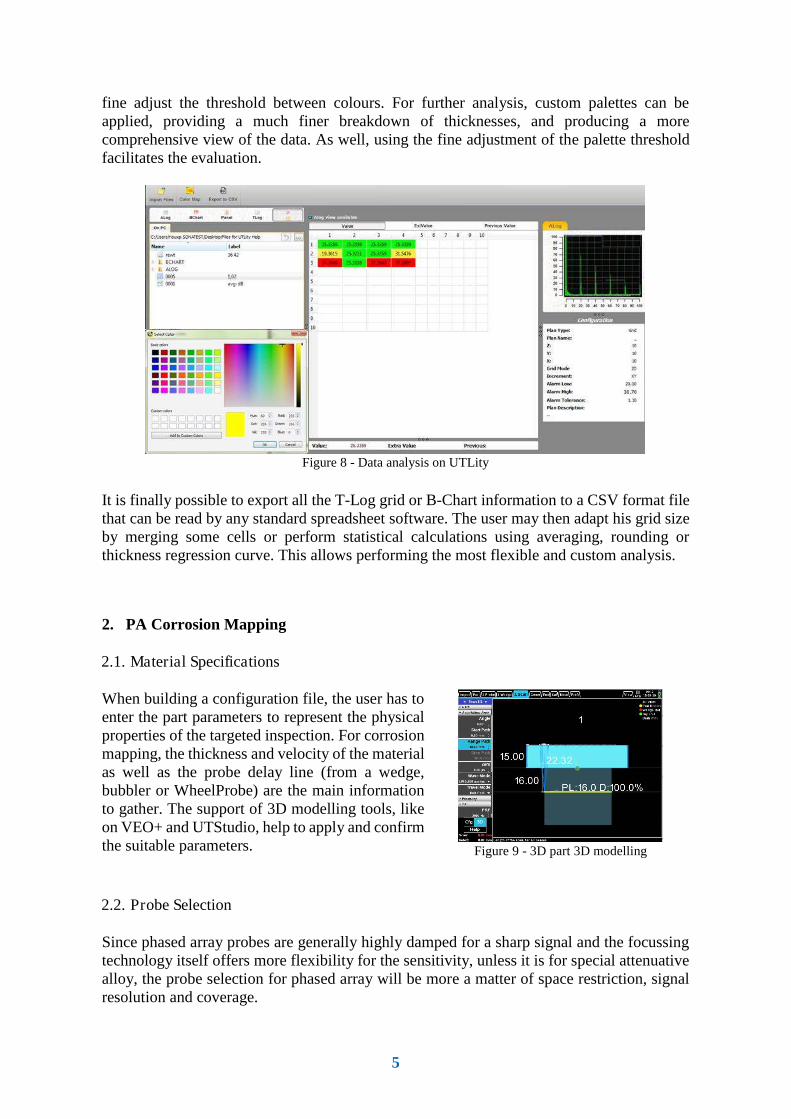
1.6 Data Analysis - On a PC software Once connected to the instrument, a PC software like UTLity can open a file directly on the instrument as this last is seen as a USB memory key by the PC. Files can be managed from DFD to PC and vice versa using a simple drag and drop process. One of the main benefit of using a PC software is that it offers a better visibility of all the T-Log just acquired along with useful information like the inspection plan parameters, the A-Scan per value (if recorded), grid, values, files tree, colour map and CSV exportation. The user can quickly compare the inspection results to those of a previous maintenance job and see any migration of data that could tell about a degradation of the part. For any further analysis, custom palette can be applied, this is as good as the rainbow gradient. The user can
5
fine adjust the threshold between colours. For further analysis, custom palettes can be applied, providing a much finer breakdown of thicknesses, and producing a more comprehensive view of the data. As well, using the fine adjustment of the palette threshold facilitates the evaluation.
Figure 8 - Data analysis on UTLity
It is finally possible to export all the T-Log grid or B-Chart information to a CSV format file that can be read by any standard spreadsheet software. The user may then adapt his grid size by merging some cells or perform statistical calculations using averaging, rounding or thickness regression curve. This allows performing the most flexible and custom analysis.
2. PA Corrosion Mapping
2.1. Material Specifications
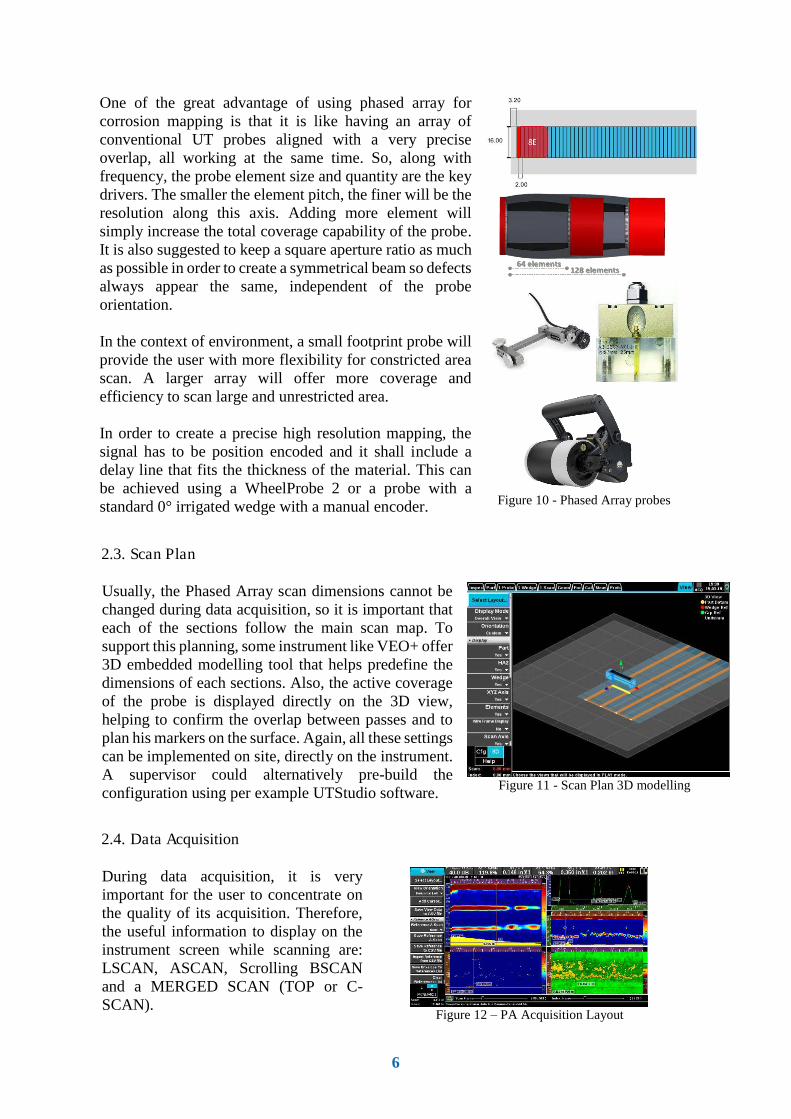
When building a configuration file, the user has to enter the part parameters to represent the physical properties of the targeted inspection. For corrosion mapping, the thickness and velocity of the material as well as the probe delay line (from a wedge, bubbler or WheelProbe) are the main information to gather. The support of 3D modelling tools, like on VEO+ and UTStudio, help to apply and confirm the suitable parameters.
Figure 9 - 3D part 3D modelling
2.2. Probe Selection
Since phased array probes are generally highly damped for a sharp signal and the focussing technology itself offers more flexibility for the sensitivity, unless it is for special attenuative alloy, the probe selection for phased array will be more a matter of space restriction, signal resolution and coverage.
6
One of the great advantage of using phased array for corrosion mapping is that it is like having an array of conventional UT probes aligned with a very precise overlap, all working at the same time. So, along with frequency, the probe element size and quantity are the key drivers. The smaller the element pitch, the finer will be the resolution along this axis. Adding more element will simply increase the total coverage capability of the probe. It is also suggested to keep a square aperture ratio as much as possible in order to create a symmetrical beam so defects always appear the same, independent of the probe orientation. In the context of environment, a small footprint probe will provide the user with more flexibility for constricted area scan. A larger array will offer more coverage and efficiency to scan large and unrestricted area. In order to create a precise high resolution mapping, the signal has to be position encoded and it shall include a delay line that fits the thickness of the material. This can be achieved using a WheelProbe 2 or a probe with a standard 0° irrigated wedge with a manual encoder.
Figure 10 - Phased Array probes
2.3. Scan Plan
Usually, the Phased Array scan dimensions cannot be changed during data acquisition, so it is important that each of the sections follow the main scan map. To support this planning, some instrument like VEO+ offer 3D embedded modelling tool that helps predefine the dimensions of each sections. Also, the active coverage of the probe is displayed directly on the 3D view, helping to confirm the overlap between passes and to plan his markers on the surface. Again, all these settings can be implemented on site, directly on the instrument. A supervisor could alternatively pre-build the configuration using per example UTStudio software.
Figure 11 - Scan Plan 3D modelling
2.4. Data Acquisition
During data acquisition, it is very important for the user to concentrate on the quality of its acquisition. Therefore, the useful information to display on the instrument screen while scanning are: LSCAN, ASCAN, Scrolling BSCAN and a MERGED SCAN (TOP or C-SCAN).
Figure 12 – PA Acquisition Layout
7
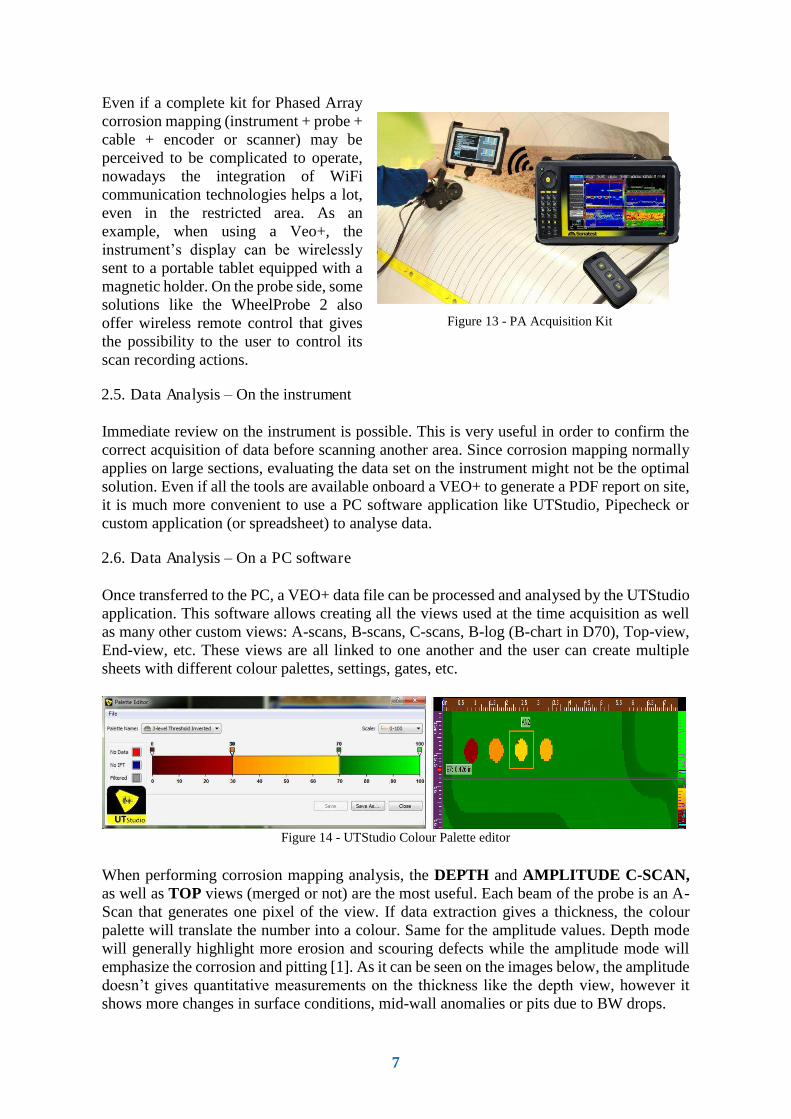
Even if a complete kit for Phased Array corrosion mapping (instrument + probe + cable + encoder or scanner) may be perceived to be complicated to operate, nowadays the integration of WiFi communication technologies helps a lot, even in the restricted area. As an example, when using a Veo+, the instrument’s display can be wirelessly sent to a portable tablet equipped with a magnetic holder. On the probe side, some solutions like the WheelProbe 2 also offer wireless remote control that gives the possibility to the user to control its scan recording actions.
Figure 13 - PA Acquisition Kit
2.5. Data Analysis – On the instrument
Immediate review on the instrument is possible. This is very useful in order to confirm the correct acquisition of data before scanning another area. Since corrosion mapping normally applies on large sections, evaluating the data set on the instrument might not be the optimal solution. Even if all the tools are available onboard a VEO+ to generate a PDF report on site, it is much more convenient to use a PC software application like UTStudio, Pipecheck or custom application (or spreadsheet) to analyse data.
2.6. Data Analysis – On a PC software
Once transferred to the PC, a VEO+ data file can be processed and analysed by the UTStudio application. This software allows creating all the views used at the time acquisition as well as many other custom views: A-scans, B-scans, C-scans, B-log (B-chart in D70), Top-view, End-view, etc. These views are all linked to one another and the user can create multiple sheets with different colour palettes, settings, gates, etc.
Figure 14 - UTStudio Colour Palette editor
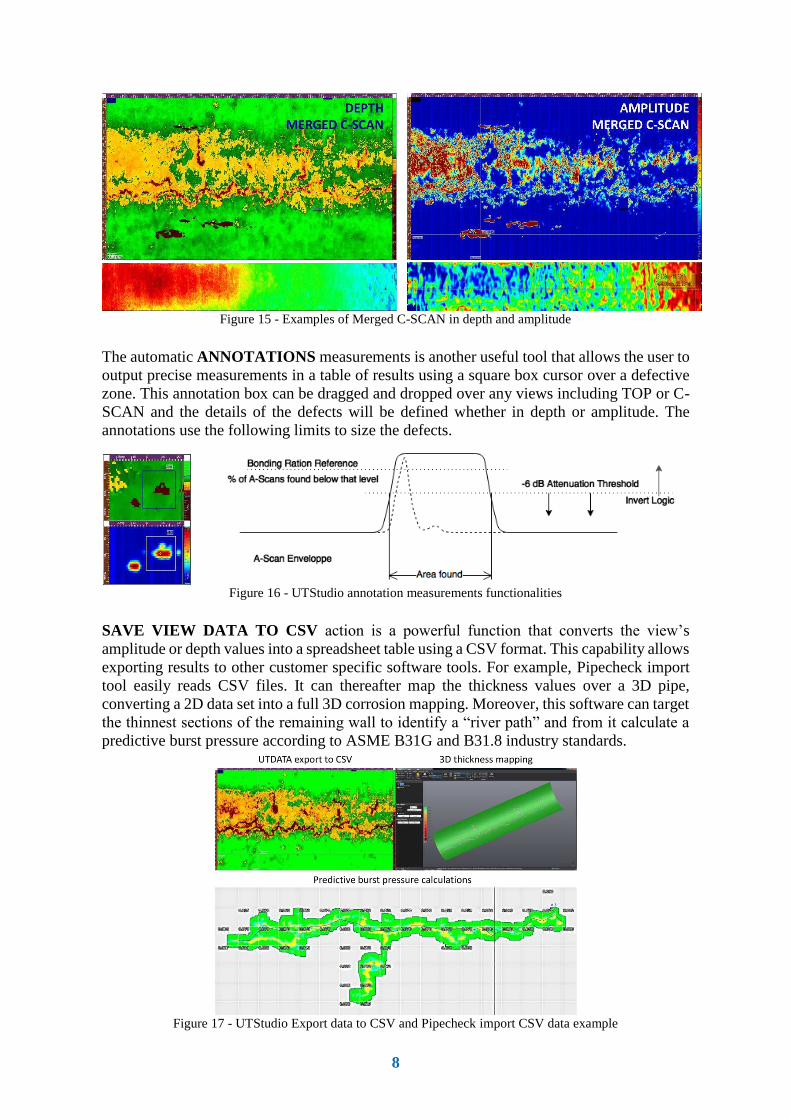
When performing corrosion mapping analysis, the DEPTH and AMPLITUDE C-SCAN, as well as TOP views (merged or not) are the most useful. Each beam of the probe is an A-Scan that generates one pixel of the view. If data extraction gives a thickness, the colour palette will translate the number into a colour. Same for the amplitude values. Depth mode will generally highlight more erosion and scouring defects while the amplitude mode will emphasize the corrosion and pitting [1]. As it can be seen on the images below, the amplitude doesn’t gives quantitative measurements on the thickness like the depth view, however it shows more changes in surface conditions, mid-wall anomalies or pits due to BW drops.
8
Figure 15 - Examples of Merged C-SCAN in depth and amplitude
The automatic ANNOTATIONS measurements is another useful tool that allows the user to output precise measurements in a table of results using a square box cursor over a defective zone. This annotation box can be dragged and dropped over any views including TOP or C-SCAN and the details of the defects will be defined whether in depth or amplitude. The annotations use the following limits to size the defects.
Figure 16 - UTStudio annotation measurements functionalities
SAVE VIEW DATA TO CSV action is a powerful function that converts the view’s amplitude or depth values into a spreadsheet table using a CSV format. This capability allows exporting results to other customer specific software tools. For example, Pipecheck import tool easily reads CSV files. It can thereafter map the thickness values over a 3D pipe, converting a 2D data set into a full 3D corrosion mapping. Moreover, this software can target the thinnest sections of the remaining wall to identify a “river path” and from it calculate a predictive burst pressure according to ASME B31G and B31.8 industry standards.
Figure 17 - UTStudio Export data to CSV and Pipecheck import CSV data example
9
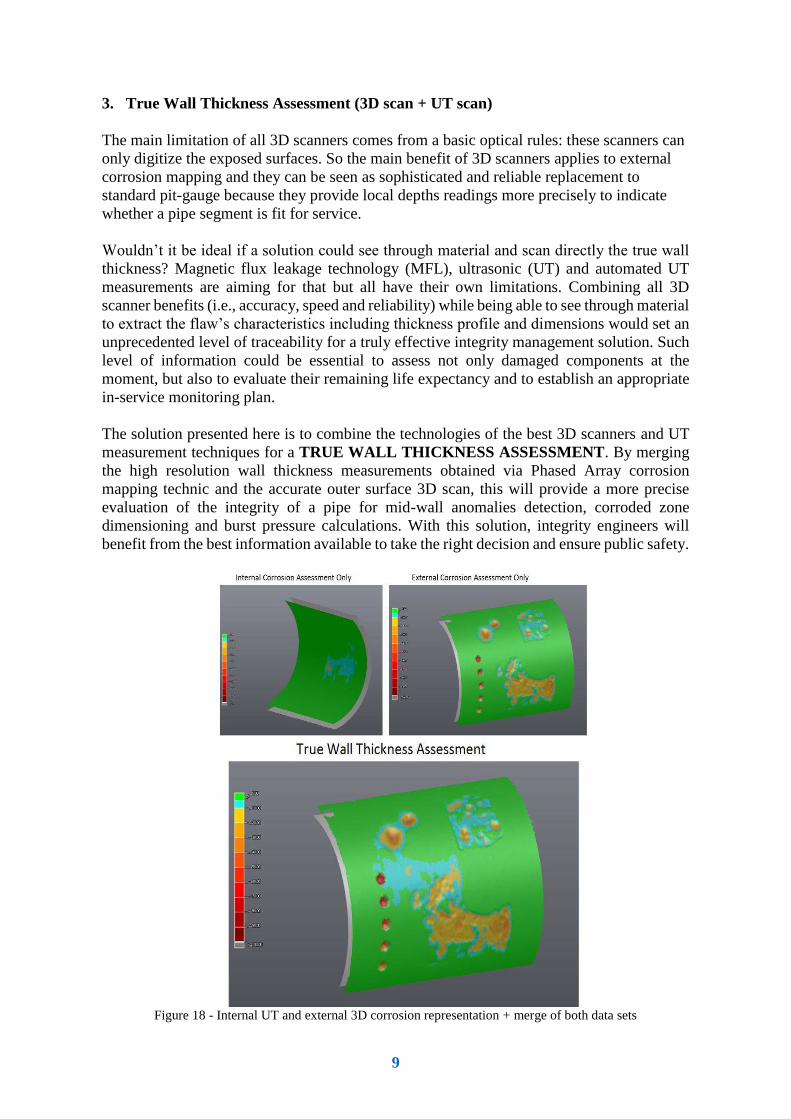
3. True Wall Thickness Assessment (3D scan + UT scan)
The main limitation of all 3D scanners comes from a basic optical rules: these scanners can only digitize the exposed surfaces. So the main benefit of 3D scanners applies to external corrosion mapping and they can be seen as sophisticated and reliable replacement to standard pit-gauge because they provide local depths readings more precisely to indicate whether a pipe segment is fit for service. Wouldn’t it be ideal if a solution could see through material and scan directly the true wall thickness? Magnetic flux leakage technology (MFL), ultrasonic (UT) and automated UT measurements are aiming for that but all have their own limitations. Combining all 3D scanner benefits (i.e., accuracy, speed and reliability) while being able to see through material to extract the flaw’s characteristics including thickness profile and dimensions would set an unprecedented level of traceability for a truly effective integrity management solution. Such level of information could be essential to assess not only damaged components at the moment, but also to evaluate their remaining life expectancy and to establish an appropriate in-service monitoring plan. The solution presented here is to combine the technologies of the best 3D scanners and UT measurement techniques for a TRUE WALL THICKNESS ASSESSMENT. By merging the high resolution wall thickness measurements obtained via Phased Array corrosion mapping technic and the accurate outer surface 3D scan, this will provide a more precise evaluation of the integrity of a pipe for mid-wall anomalies detection, corroded zone dimensioning and burst pressure calculations. With this solution, integrity engineers will benefit from the best information available to take the right decision and ensure public safety.
Figure 18 - Internal UT and external 3D corrosion representation + merge of both data sets
10
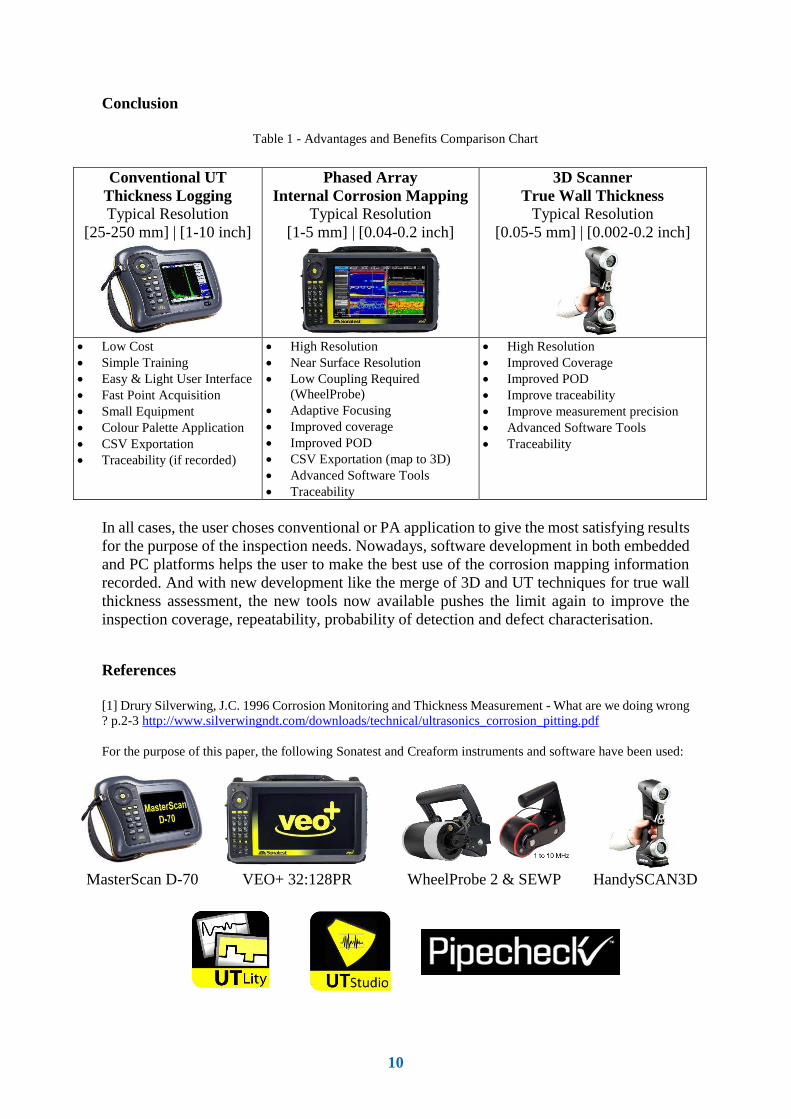
Conclusion
Table 1 - Advantages and Benefits Comparison Chart
Conventional UT Thickness Logging Typical Resolution
[25-250 mm] | [1-10 inch]
Phased Array Internal Corrosion Mapping
Typical Resolution [1-5 mm] | [0.04-0.2 inch]
3D Scanner True Wall Thickness
Typical Resolution [0.05-5 mm] | [0.002-0.2 inch]
Low Cost Simple Training Easy & Light User Interface Fast Point Acquisition Small Equipment Colour Palette Application CSV Exportation Traceability (if recorded)
High Resolution Near Surface Resolution Low Coupling Required (WheelProbe) Adaptive Focusing Improved coverage Improved POD CSV Exportation (map to 3D) Advanced Software Tools Traceability
High Resolution Improved Coverage Improved POD Improve traceability Improve measurement precision Advanced Software Tools Traceability
In all cases, the user choses conventional or PA application to give the most satisfying results for the purpose of the inspection needs. Nowadays, software development in both embedded and PC platforms helps the user to make the best use of the corrosion mapping information recorded. And with new development like the merge of 3D and UT techniques for true wall thickness assessment, the new tools now available pushes the limit again to improve the inspection coverage, repeatability, probability of detection and defect characterisation.
References
[1] Drury Silverwing, J.C. 1996 Corrosion Monitoring and Thickness Measurement - What are we doing wrong ? p.2-3 http://www.silverwingndt.com/downloads/technical/ultrasonics_corrosion_pitting.pdf For the purpose of this paper, the following Sonatest and Creaform instruments and software have been used:
MasterScan D-70 VEO+ 32:128PR WheelProbe 2 & SEWP HandySCAN3D