Embed Size (px)
Citation preview

10.2
017
/ B
ock´
s O
ffice
Authors: (Version: 23-06-2017)
Kenneth Engblom, Director, Sales & Marketing, LNG Infrastructure solutions Wärtsilä Energy Solutions
John Reinlund Business Analyst, LNG Infrastructure solutions Wärtsilä Energy Solutions
Nikolas Leong Business Development Manager, South East Asia Wärtsilä Energy Solutions
TABLE OF CONTENTS
1. Introduction ....................................2
2. Myanmar - Power & Gas Infrastructure ......................................3
3. LNG & Power Plant solutions ..........5
4. Advantage of first movers & Partnership set-ups .......................11
5. Case Myanmar .............................12
6. Conclusion ...................................21
Comparing Various LNG to Power Solutions for Myanmar

Following the lifting of the sanctions, Myanmar has become one of the hottest countries in South East Asia for business, economic and trade activities. In order to fulfil its economic growth and industrial growth, Myanmar needs to substantially increase its current installed generation capacity of 5,215 MW (as of December 2016). As per the Myanmar Energy Master Plan published by the Asian Development Bank, the demand forecast is expected to grow to close to 14,500 MW in 2030.
Myanmar has not yet developed its own fossil fuel resources and is dependent on import. Due to the current domestic gas shortage till 2020, alternative liquid fuel sources should be considered in the short and middle term future for power generation in order not to slow down the economic and industrial development of Myanmar.
Heavy Fuel Oil (HFO), with the high efficiency combustion engine technology, is considered a suitable interim fuel in Myanmar until pipe gas or LNG is available especially when the country needs urgent access to power. But it is very likely that the HFO will be replaced gradually by natural gas or LNG in the coming years. It is also evident that not all locations will be able to connect to a gas pipeline and even if connected the reliability of the gas pipeline may not meet the availability criteria for the Power Plants.
Therefore LNG to Power will definitely be one of the solutions we will see in the future Myanmar. The share of additional capacity that will rely on LNG will be very much dependent on the price and availability of LNG in Myanmar the coming years. Besides availability it will also have an impact on how and where the LNG receiving terminals can be built and how they can be accessed by the small-scale LNG carriers and at the same time connected to power plants nearby.
Firstly, in this paper, we will study Myanmar’s current power system as well as the potential locations of new generation vs. existing gas pipeline. Based on this we will recommend a few places where combined LNG terminals and Power Plants could be built.
Secondly, this paper will study the various possible LNG terminal solutions, both onshore and off-shore, and corresponding LNG logistics. Each of these conceptual solutions will be compared based on the cost of generated electricity. Finally, this paper will present a sensitivity analysis which can be used to compare the various unknowns in the LNG value chain. This can be used to prepare for site differences and future changes in the LNG supply chain and prices.
1. Introduction
2 Comparing Various LNG to Power Solutions for Myanmar | 2017

Myanmar power generation mix
Myanmar is one of the upcoming economies in South East Asia. The recent lifting of international sanctions due to economic and political reforms in the country, along with its strategic location as a land bridge between South and South-East Asia, has brought the country into the spotlight of international investors.
The total generation capacity in Myanmar is 5,307 MW as of November 2016. Hydropower is the dominant constituent of the power mix of Myanmar and it represented 58.85% of the country’s total installed capacity in 2016, while gas power contributed to 40.80% and 0.35% Diesel. The remaining share comprises renewable technologies such as wind, solar, biopower and small hydropower.
Fig 1: Myanmar – total generation capacity
Electricity access in the country is extremely limited, with the national average being around 34%. In urban areas, the highest access rate has been recorded in Yangon City at 67%, while in rural areas this is around 16%. Most of Myanmar’s people reside in rural areas. Myanmar energy consumption is among the lowest in the world. The consumption per capita is 160 kWh per annum – twenty times less than the world average.
On the other hand, Myanmar has abundant power generation resources. Its hydropower potential has been estimated at around 108 GW. More than 300 sites have been identified by the government, with a total generation capacity potential of around 46 GW. The country also has large natural gas reserves, estimated at 11 trillion cubic feet (tcf). This gas is, however, mostly extracted for export. Oil and gas mining and extraction are the largest activities in the country’s industrial sector, although labour employment is low.
Electricity consumption is growing fast in Myanmar. The peak load demand reached 4,000 mega-watts ( MW) in 2016, growing on average 14 percent per annum in the past five years. Electricity shortages and supply disruptions remain prevalent in the country. Accumulated delays in investments in power infrastructure, over-reliance on seasonal hydropower production, together with a rapid increase in electricity demand, which tripled over the last decade, results in large electricity shortages in the whole country.
2. Myanmar – power & gas infrastructure
3 Comparing Various LNG to Power Solutions for Myanmar | 2017

Myanmar gas pipeline network
Myanmar possesses a developed gas transmission system (see Table 1). About 4,500 km of gas pipelines have been constructed onshore and 700 km offshore. It is planned to further extend and enlarge diameters of the pipeline network. There are two international gas pipe lines from Myanmar: one to Thailand and another one to China. Export pipelines are newer and of considerably better condition comparing to domestic pipelines. They are of better design and maintained to the standards, and also possess corrosion prevention system and SCADA system. Domestic pipelines were built following lower standards and have suffered from inadequate maintenance. There are planned activities on rehabilitation of existing pipelines as well as construction of new ones.
Domestic gas pipeline network
Onshore (4” to 20”) - 2874 km Offshore, Yadana to Yangon (24”) - 436 km
Export gas pipeline to PTTEPI
Yadana to Metering Station (36”) - 395 km Yetagun to Metering Station (24”) - 271 km
Myanmar-China crude and gas pipeline (ongoing)
Crude Pipeline (32”), Myanmar side - 760 km Gas Pipeline (40”), Myanmar side - 782 km
Table 1: Details for both domestic and export gas pipelines
83% of the gas produced in Myanmar is currently exported to Thailand. Export of gas to PRC has recently started from the Shwe gas field. The rest of the gas is utilized internally, mainly for power production, but also for transportation, industrial parks and fertilizers industry. There is roughly 0.8 GW of installed capacity of gas fired PPs in Myanmar, however their actual capacity is only one third of that. There are plans for rehabilitation of existing power plants, as well as plans to construct new gas fired PPs to achieve total installed capacity of 4 GW. Besides, there is a programme on conversion of petrol cars into NGVs.
The Government of Myanmar subsidises gas price for power production, bringing it down to 5 USD/MMbtu from the borderline price of 12-13 USD/MMbtu (Yadana) and 15-16 USD/MMbtu (Shwe). MOEE has initiated an increase of gas price to 7.5 USD/MMbtu, and if approved it will apply it to 11.2 USD/MMbtu.
Finally by calculating the cost of electricity produced by LNG for a fictive case based on a few sites in Myanmar, we illustrate the practicalities around planning the optimal logistic chain and choosing the LNG receiving terminal and power plant solutions in order to convert LNG to Power in the most cost efficient and optimal way.
4 Comparing Various LNG to Power Solutions for Myanmar | 2017

3. LNG & Power Plant solutions
3.1 Business case for introducing LNG
Global demand for gas is increasing and especially in the form of LNG. The drivers behind this is that gas is environmentally cleaner than oil and laws are being enforced to phase out coal and oil and replace by renewable energy. Furthermore gas is giving stability to energy prices with an alternative market in the process of de-linking from oil market.
3.2 LNG logistic chain
A major “cost adder” to bring LNG to the final destination comes from the infrastructure requirements and thereby cost of the LNG logistic chain. The logistic chain includes the steps starting with the liquefaction of the natural gas, loading the LNG carrier for the sea transport, unloading the LNG carrier to the receiving terminal via a jetty and unloading systems; and regasification or other means of further re-distribution of LNG with trucks or barges. It is in the end users interest that this logistic chain is as cost efficient as possible.
The key in making liquefied natural gas (LNG) affordable for the end users and still leave some profit for all the stakeholders making the value chain possible is to design an optimal logistics chain. Due to the increasing complexity of handling -163°C LNG as compared to ambient air temperature diesel and heavy fuel oil (HFO), the LNG logistic chain will need a lot more consideration. Furthermore, new solutions and configurations for a small-scale logistic chain is being developed by all the industry players as we speak. This makes the planning and optimization challenging as the equation includes a lot of unknowns.
There are several things that can be done to optimize the logistic chain. The cost of natural gas at the final destination will be dependent on parameters like: The size of the ship(s), shipping route(s), size and location of receiving terminal(s), utilization of BOG in the process and finally the customer’s gas dependence and gas availability and reliability requirements.
In order to optimize the logistic chain with all the interdependent variables, Wärtsilä has developed a tool for this. The end user requirements, infrastructure constraints and commercial parameters are inputs. The tool can also be used to do sensitivity analysis on the final landed LNG price and how it is affected by the various parameters in the logistic chain. In this paper we will use the tool to calculate the cost of delivering LNG from one supplier to three potential receiving consumers. The fictive case is based on delivery from the Singapore LNG terminal to sites in Myanmar.
5 Comparing Various LNG to Power Solutions for Myanmar | 2017

3.3 LNG receiving terminals & consumers
The receiving and redistribution terminal can be of many types. The choice of terminal will depend on the site locations and the volumes required.
Large ScaleFlat Bottom
Concrete tanksFSRU
Mid ScaleConcrete tanks
or Pressurised tanks
LNG Barge (or mini FSRU)
Small ScalePressurised steel tanks
LNG Barge
On-Shore Off-Shore
Fig 2: Principle solutions for LNG terminals based on their size and location
There are both on-shore and off-shore solutions available for the LNG receiving terminals today. For large onshore terminals, flat bottom concrete tanks are the most commonly used. For the small sizes the pressurized steel tanks are becoming popular.
For large-scale terminals there are possibilities to employ an offshore solution with an FSRU (floating storage & regasification unit) or an FSU (floating storage unit) with a regas unit mounted on the jetty. Projects have also been planned using old LNG carriers serving as FSUs. These old LNG carriers can be purchased at a low price because they are not economical to use as carriers anymore due to their old inefficient steam engines.
In locations where an onshore location is not suitable and the gas amounts are too small to make an FSU or FSRU feasible, Wärtsilä’s LNG floating storage & regasification barge (FSRB) can be the best alternative.
6 Comparing Various LNG to Power Solutions for Myanmar | 2017

Fig. 3 - LNG floating storage & regasification barge (FSRB)
Ideal for: locations with shallow protected water, difficult site conditions and expensive local infrastructure.
Advantage: 1) the asset is mobile and modularized in sizes from 7500 m3 to 30,000 m3 and can therefore be multiplied or relocated if demands change. 2) solution needs minimal site work as most of the work is shifted to factories
Fig. 4 - Medium-size LNG terminal based on a flat bottom concrete tank
Ideal for: terminals where a storage capacity over 15,000 m3 is required and there is good availability of local labour and construction equipment.
Advantage: a well-insulated tank and robust terminal that can withstand any type of weather.
7 Comparing Various LNG to Power Solutions for Myanmar | 2017

Fig. 5 - Small-size LNG terminal based on insulated bullet tanks
Ideal for: smaller size terminals where a storage capacity up to 15,000 m3 is required or where there is not sufficient availability of local labour and construction equipment.
Advantage: a solution that needs minimal site work as most of the work is shifted to factories.
Fig. 6 – Floating storage & regasification unit (FSRU)
Ideal for: large size storage from 125,000 m3 and up where there is at least 600 MW offtake.
Advantage: the solution is flexible and can be moved whenever the demand is changing.
3.4 Power plant solutions
Then let’s have a look at the typical main LNG/natural gas consumers, the power plants.
Almost all power plants in operation today have been built on-shore. But there are a few power barges and power ships in operation around the world. Wärtsilä has delivered more than 20 power barges since 1993 and delivered the gen-sets for the majority of the power ships.
On-Shore Off-Shore
Figure 7. Wärtsilä’s power plant solutions for on-shore and off-shore
8 Comparing Various LNG to Power Solutions for Myanmar | 2017

The reasons why people choose an off-shore power barge over a traditional on-shore power plant are typically the same reasons as for choosing an LNG Floating storage and re-gasification barge instead of an on-shore terminal e.g.:• Need for a temporary solution• Need for a quick delivery time, where the site work would be on
the critical path• Need for flexibility and the possibility to move the plant• Building on a site that lacks infrastructure and labour for effective construction• Problem site, with bad soils or difficult to permit.
Wärtsilä power plants are based on combustion engines of unit sizes from 4-22 MW. Typical plant sizes are from 20-500 MW. The largest plant built by Wärtsilä based on the combustion engine technology is 573 MW site-rating (= >600 MW ISO-conditions rating).
Figure 8: On-shore 100 MW power plant layout with full plant infrastructure including switch yard and high voltage transformers, liquid fuel tanks for possible dual-fuel set-up as well as all other service and storage facilities needed.
The power plants can be either gas, diesel, HFO or dual fuel based. The dual fuel option is a very popular solution in locations where the gas or LNG infrastructure is not reliable or under planning. With a dual fuel solution you can start up and produce power on HFO immediately while the LNG infrastructure is under construction. As soon as LNG/gas is available, the plant will be ready the same day to switch fuel. Even during operation on LNG/gas, you have the option to an instant switch to diesel or HFO in case there would be any disturbance in the LNG delivery, which significantly reduces operational risk.
Figure 9: Off-Shore 100 MW power barge. This power barge is excluding the fuel storage switch yard and high voltage transformers which in this case would be located on the shore side.
9 Comparing Various LNG to Power Solutions for Myanmar | 2017

With introduction of intermittent renewable energy like wind and solar, the duty of the gas power plants has increasingly become to provide the grid reliability and support for the renewable energy. The running profile of the existing plants is changing from baseload operation to a more flexible and peaking operation. This is an important change to consider when designing new LNG infrastructure. The consumption might be a lot less than first expected.
Figure 10: Typical consumption and storage size for gas power plants
Storing gas as LNG gives a greater flexibility for a varying load and power factor by not being dependent on the natural gas pipeline fixed capacity.
When planning an LNG receiving terminal it is important to try to include as many off-takers as possible sharing the same terminal. Larger throughput lowers the specific cost of the investment. Including more distribution options in the terminal makes it more expensive, but if this in return increases the throughput, it might still reduce the specific cost of LNG.
Fig 11: A near shore LNG to Power solution vs. an on-shore LNG to Power solution
0
10,000
20,000
30,000
40,000
50,000
60,000
0 5 10 15 20 25 30
Days of storage
200 MW plant (baseload 8000 h/year) 620,000 m3/year (= 280,000 tonnes/year)
50 MW plant (baseload 8000 h/year); OR 100 MW (flexible baseload = 4000 h/year); OR 200 MW (peak load = 2000 h/year)
155,000 m3/year (= 70,000 tonnes/year)
100 MW plant (baseload 8000 h/year) 310,000 m3/year (= 140,000 tonnes/year)
m3 LNG Typical refilling interval
10 Comparing Various LNG to Power Solutions for Myanmar | 2017

Consumers will, unless forced by legislation, normally decide whether it is worthwhile changing fuel based on the estimated cost of LNG. At the same time the cost of LNG will depend on how many consumers that are ready to start using LNG. This is an iterative process where adding more consumers will make the value chain more economical reducing the final LNG price, which will further attract more consumers. But due to heavy investments needed in order to get the LNG logistic chain started it is always difficult to be the first consumer in a new place with an un-developed logistic chain. This is the classical chicken and egg situation that can best be resolved by finding a major anchor customer and appointing a strong project leader.
In parts of the world, we can already see brave companies that have recently got their LNG logistics up-and-running and are now busy looking for additional consumers in order to increase their volumes and get full utilization of their infrastructure investments. Moreover, there will be a lot more first movers that will continue to shape the industry in developing parts of the world. These first movers and entrepreneurs will benefit from being the first in a new market and thereby have the opportunity to sign up customers before anyone else and thereby build the necessary volumes that will make their investments profitable. By being the first in a region and having been able to capture the base load (or base flow) of LNG, you will make it hard for competitors to enter. But this is not without risk. As so many things are changing, there will also be a lot of first movers whose investments, for various reasons, may not be able to attract the volumes and will therefore remain unprofitable. In order to reduce the risk and to ensure successful projects, the team or consortium setting out to develop the project should ideally include experts from all the segments starting from the molecule providers, shipping, permitting and local community knowledge, engineering, procurement and construction (EPC) and operations & maintenance. Wärtsilä’s LNG solutions team can coordinate the work of such a diverse team as well as provide the complete EPC and operations & maintenance of LNG terminals.
4. Advantage of first movers and partnership set-ups
11 Comparing Various LNG to Power Solutions for Myanmar | 2017

5.1 LNG logistics
Now let us illustrate the LNG to Power solutions discussed so far through a fictive case, loosely based on a few sites in Myanmar and assumptions about these sites and the logistic chain. We will estimate the cost price of gas for two alternative project configurations and examine the effects of our preferences:• In Alternative 1 we choose a preference for low CAPEX• In Alternative 2 we choose a preference for low OPEX
As per the map in Figure 13 we have selected three different sites in Myanmar. The main parameters of the locations are described below.
Nga Yoke Kaung:
Located near the city of Pathein (350,000 habitants) with basic industry, universities and some tourism.
LNG consumers:50 MW power plant running at Pf = 80% (average load 40 MW)Will provide power for local population and industry
Site quality:No existing marine infrastructure. Otherwise suitable for an onshore terminal.
Marine data:Deep water (10 m) near shore, location fairly sheltered for winds except from South. Risk for cyclones, flooding and earthquakes.No tugs and no local port authority.
Other infrastructure:Pathein offers little industry and relatively low skill workforce.
Yangon:
Major city with a population of six million. It is the country’s centre for industry, trade, tourism, etc. Chronic power shortages currently limit the factories’ operating hours.
LNG consumers:125 MW power plant running at Pf = 80% (average load 100 MW).
Site quality:Slightly sloped water front, soft soil, low environmental and social impact. Suitable for an onshore terminal.
Marine data:Close to river mouth, water depth 8 m, considerable traffic. The tide is quite strong. Fairly well protected from wind in normal conditions. Risk for cyclones, flooding and earthquakes.Pilotage required.
Other infrastructure:Workforce capable of civil infrastructure works.
5. Case Myanmar
12 Comparing Various LNG to Power Solutions for Myanmar | 2017

Dawei:
Dawei has approximately 150,000 inhabitants. Dawei is the proposed site for a Special Economic Zone (SEZ) with a deep sea port (which we in this case study assume has already been built).
LNG consumers:75 MW power plant running at Pf = 66% (average load 50 MW) providing electricity for industry during the day and for the inhabitants of Dawei primarily in the morning and evening.
Site quality:Deepwater port, good soil conditions, industrial zoning. There are plans for a large onshore LNG terminal or an FSRU, but an intermediate solution is needed in order to enable industry to start producing in the SEZ. Therefore the investors have envisioned a floating storage and regasification barge (FSRB).
Marine data:14 m sea depth, existing breakwater, sheltered quay where LNGC and FSRB can be positioned alongside the quay. Extreme monsoons may cause flooding, but cyclones and earthquakes are less likely in this part of Myanmar.
Other infrastructure:Good availability of heavy lifting equipment.
Site Nga Yoke Kaung Yangon Dawei
Power need 50 MW at Pf 80% 125 MW at Pf 80% 75 MW at Pf 66%
Total LNG consumption
57,400 TPA(10,400 m3/month)
144,000 TPA(26,000 m3/month)
71,700 TPA(13,000 m3/month)
Average daily LNG consumption
342 m3 854 m3 427 m3
Table 2: Calculation of total LNG consumption at each site
The total combined offtake is 272,500 TPA. We assume that the LNG price FOB Singapore is oil linked according to the following formula: Brent price x 14.5% slope, which with an oil price of 55 USD/bbl would result in an LNG price of 7.98 USD/mmBtu. This price is not based on information from the supplier, but as small-scale LNG pricing seldom is transparent, we have chosen a simplified formula.
When examining the sites and planning the logistic chain, we encounter a challenge. The size of carrier that would be needed to make a milk run of all the sites work cannot according to our (fictive) site description reach the Yangon site due to draught limitations. The solution is to create a hub terminal in Dawei and distribute the LNG from there in a smaller vessel to the other sites.
13 Comparing Various LNG to Power Solutions for Myanmar | 2017

Fig 13: Coral Energy, an example of a 15,600 m3 LNG carrier with Wärtsilä dual-fuel engines
For Alternative 1, where we prefer low CAPEX, we need to keep the terminals as small as possible. We calculate that we can make do with an intermediate terminal with 22,500 m3 capacity that would be serviced by a 15,600 m3 LNGC going back and forth to Singapore. For this size of terminal, the FSRB envisioned by the investors will be possible. There will be approximately 8.5 days between filling the tank in Dawei. Moreover, a 5500 m3 LNGC would do a milk run on the route Dawei – Yangon – Nga Yoke Kaung. Such a vessel has a design draught that would enable it to travel to the Yangon site. The terminals in Yangon and Nga Yoke Kaung can make do with fairly little reserve capacity since the milk run is short and the power plant owners have opted for dual-fuel power plants which if needed can run on liquid fuels.
Singapore - Dawei
Round Trip Duration (hours) Loading Unloading TotalLoading (hours) 6.9 13.8 20.7 Port Arrival (hours) 36.0 12.0 48.0 Transportation time incl. Sea margin 134.5
Total Hours Round Trip 203.2 Total Days Round Trip 8.5 Total days in operation 365 Number of trips per year 43.1
Table 3: Calculation of shipping duration Singapore-Dawei (Alternative 1)
Dawei - Yangon - Nga Yoke Kaung
Round Trip Duration (hours) Loading Unloading TotalLoading (hours) 4.8 4.8 9.6 Port Arrival (hours) 12.0 24.0 36.0 Transportation time incl. Sea margin 49.1
Total Hours Round Trip 94.7 Total Days Round Trip 3.9 Total days in operation 365 Number of trips per year 92.5
Table 4: Calculation of shipping duration Dawei-Yangon-Nga Yoke Kaung (Alternative 1)
Fig. 12: The map showing three different sites in Myanmar
14 Comparing Various LNG to Power Solutions for Myanmar | 2017

For Alternative 2, where we prefer low OPEX, we focus on finding a less expensive way of delivering LNG. Hypothetically, we could look for a ship owner that can offer a larger LNG carrier. This would of course come at a higher day rate than the 15,600 m3 LNGC in alternative 1, but this time we manage to sign a flexible agreement that allows us to charter the vessel only for the time period when we need it. With a 45,000 m3 LNGC, we can extend the time between filling the tank in Dawei from 8.5 days to 25 days. The logistics for the Dawei – Yangon – Nga Yoke Kaung milk run remain unchanged.
Fig 14. - Example of a 45,000 m3 LNG carrier currently being built for Saga LNG Shipping. For this LNGC Wärtsilä has been contracted to supply the complete cargo handling system including the fuel system, as well as the main propulsion system.
Singapore - Dawei
Round Trip Duration (hours) Loading Unloading TotalLoading (hours) 13.5 20.3 33.8 Port Arrival (hours) 36.0 12.0 48.0 Transportation time incl. Sea margin 130.2
Total Hours Round Trip 212.0 Total Days Round Trip 8.8 Total days in operation 132 Number of trips per year 14.9
Table 5: Calculation of shipping duration Singapore-Dawei (Alternative 2)
15 Comparing Various LNG to Power Solutions for Myanmar | 2017

Figure 16. Main dimensions and draught requirement for various sizes of Wärtsilä standard LNG carriers
With a longer supply interval, however, it would also make sense to have more reserve capacity at Dawei, so we increase it from four days in Alternative 1 to eight days in Alternative 2. This would require us to build a 60,000 m3 terminal in Dawei at considerably higher CAPEX. The larger LNG storage capacity available gives the power plant investors reassurance that gas will always be available and they decide to prioritize efficiency over dual-fuel capabilities and choose to invest in a gas power plant rather than the dual-fuel power plant that they originally planned. The terminal investors also decide that rather than having two 30,000 m3 FSRB, it would be acceptable to build the terminal as a permanent onshore solution. Can this investment be recovered through the more flexible charter agreement?
Project configurations
Alternative 1 Alternative 2
LNGC Dawei-Singapore 15,600 m3 45,000 m3
Dawei terminal 22,500 m3 FSRB 60,000 m3 onshore
LNGC Dawei-Yangon-Nga Yoke Kaung
5500 m3 5500 m3
Yangon terminal 7500 m3 FSRB 7500 m3 FSRB
Nga Yoke Kaung terminal 2500 m3 onshore 2500 m3 onshore
Table 6: Proposed project configurations for each site in both alternatives
Name Generic Generic GenericWSD50
20KWSD55
12KWSD59
10KWSD59
6.5KWSD59
3K
TypeLNG carrier (Membrane)
LNG carrier (Moss)
LNG carrier (Membrane)
LNG carrier (Type C)
LNG/LPG/LEG carrier
LNG bunkering
vessel
LNG bunkering
vessel
LNG bunkering
vessel
Cargo capacity (m3) 140 000 90 000 40 000 20 000 12 000 10 000 6 500 3 000
Design draught (m) 11.4 10.6 9.2 7.8 6.2 6.6 5.8 4.25
Length overall (m) 280.0 249.5 207.8 147.2 137.0 124.9 98.8 84.7
Design speed (knots) 19.5 18.0 16.0 15.0 14.5 14.0 13.0 12.0
Fuel consumption, design draught (TPD)
80 70 35 18.1 13.5 12.1 9.8 7.5
WSD50 20K
WSD55 12K
WSD59 10K
WSD59 6.5K
WSD59 3K
16 Comparing Various LNG to Power Solutions for Myanmar | 2017
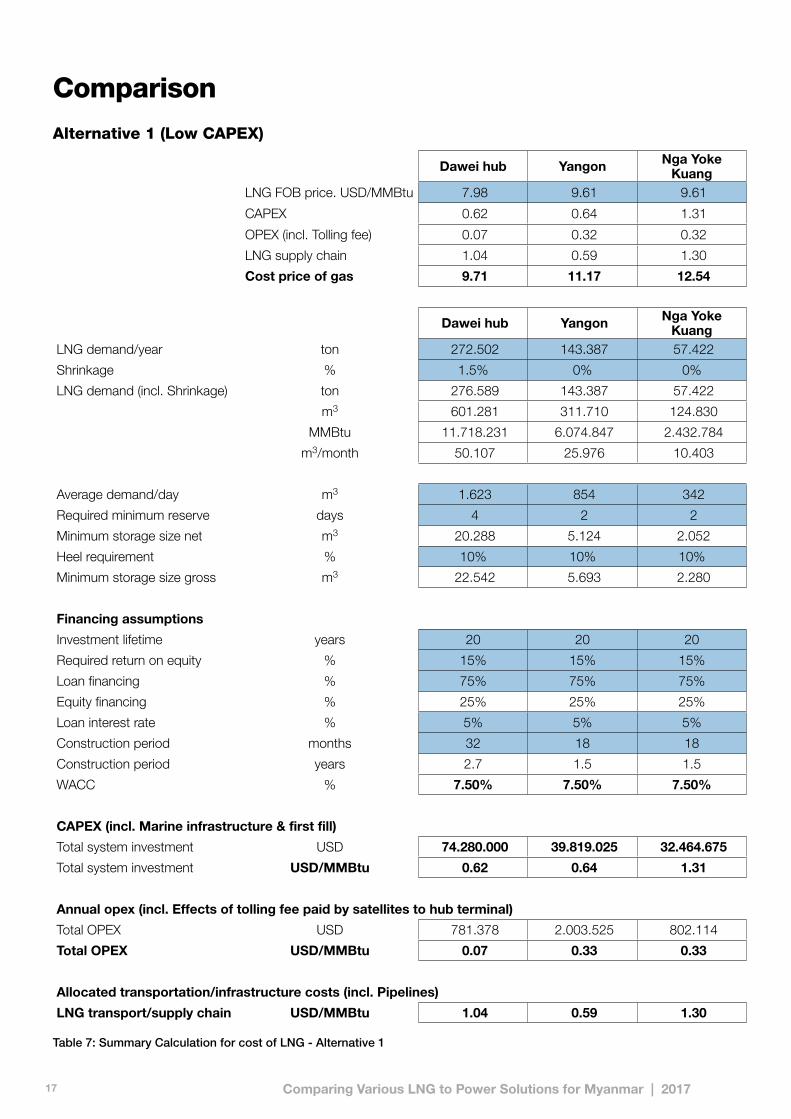
Alternative 1 (Low CAPEX)
Dawei hub Yangon Nga Yoke Kuang
LNG FOB price. USD/MMBtu 7.98 9.61 9.61
CAPEX 0.62 0.64 1.31
OPEX (incl. Tolling fee) 0.07 0.32 0.32
LNG supply chain 1.04 0.59 1.30
Cost price of gas 9.71 11.17 12.54
Dawei hub Yangon Nga Yoke Kuang
LNG demand/year ton 272.502 143.387 57.422
Shrinkage % 1.5% 0% 0%
LNG demand (incl. Shrinkage) ton 276.589 143.387 57.422
m3 601.281 311.710 124.830
MMBtu 11.718.231 6.074.847 2.432.784
m3/month 50.107 25.976 10.403
Average demand/day m3 1.623 854 342
Required minimum reserve days 4 2 2
Minimum storage size net m3 20.288 5.124 2.052
Heel requirement % 10% 10% 10%
Minimum storage size gross m3 22.542 5.693 2.280
Financing assumptions
Investment lifetime years 20 20 20
Required return on equity % 15% 15% 15%
Loan financing % 75% 75% 75%
Equity financing % 25% 25% 25%
Loan interest rate % 5% 5% 5%
Construction period months 32 18 18
Construction period years 2.7 1.5 1.5
WACC % 7.50% 7.50% 7.50%
CAPEX (incl. Marine infrastructure & first fill)
Total system investment USD 74.280.000 39.819.025 32.464.675
Total system investment USD/MMBtu 0.62 0.64 1.31
Annual opex (incl. Effects of tolling fee paid by satellites to hub terminal)
Total OPEX USD 781.378 2.003.525 802.114
Total OPEX USD/MMBtu 0.07 0.33 0.33
Allocated transportation/infrastructure costs (incl. Pipelines)
LNG transport/supply chain USD/MMBtu 1.04 0.59 1.30
Table 7: Summary Calculation for cost of LNG - Alternative 1
Comparison
17 Comparing Various LNG to Power Solutions for Myanmar | 2017

Alternative 2 (Low OPEX)
Dawei hub Yangon Nga Yoke Kuang
LNG FOB price. USD/MMBtu 7.98 9.57 9.57
CAPEX 1.06 0.64 1.31
OPEX (incl. Tolling fee) 0.07 0.32 0.32
LNG supply chain 0.57 0.33 0.74
Cost price of gas 9.67 10.86 11.94
Dawei hub Yangon Nga Yoke Kuang
LNG demand/year ton 272.502 143.387 57.422
Shrinkage % 1.5% 0% 0%
LNG demand (incl. Shrinkage) ton 276.589 143.387 57.422
m3 601.281 311.710 124.830
MMBtu 11.718.231 6.074.847 2.432.784
m3/month 50.107 25.976 10.403
Average demand/day m3 1.623 854 342
Required minimum reserve days 8 2 2
Minimum storage size net m3 53.559 5.124 2.052
Heel requirement % 5% 10% 10%
Minimum storage size gross m3 56.378 5.693 2.280
Financing assumptions
Investment lifetime years 20 20 20
Required return on equity % 15% 15% 15%
Loan financing % 75% 75% 75%
Equity financing % 25% 25% 25%
Loan interest rate % 5% 5% 5%
Construction period months 36 18 18
Construction period years 3.0 1.5 1.5
WACC % 7.50% 7.50% 7.50%
CAPEX (incl. Marine infrastructure & first fill)
Total system investment USD 126.094.325 39.763.225 32.446.075
Total system investment USD/MMBtu 1.06 0.64 1.31
Annual opex (incl. Effects of tolling fee paid by satellites to hub terminal)
Total OPEX USD 850.290 1.954.318 782.409
Total OPEX USD/MMBtu 0.07 0.32 0.33
Allocated transportation/infrastructure costs (incl. Pipelines)
LNG transport/supply chain USD/MMBtu 0.57 0.33 0.74
Table 8: Summary Calculation for cost of LNG - Alternative 1
In this example the Low OPEX solution gave the lowest gas price in all 3 locations. We will use these gas prices in the next chapter to calculate the cost of electricity.
18 Comparing Various LNG to Power Solutions for Myanmar | 2017

4.2 Cost of electricity – LNG to Power
Below we list the estimated EPC costs for the various power plants including the civil work and possible soil preparations. We have used values typical for Wärtsilä power plants’ efficiency and operating cost, showing their impact on the price of the produced electricity. The basic assumption is that the jetty, terminal facilities and power plant systems are located in the same area. This will be very effective when the entire project is being executed under a single EPC contract, allowing both LNG terminal and power plant to be constructed in parallel to shorten overall construction time.
The cost of fuel which is the biggest cost contributor, especially in baseload power plants, is then calculated based on the power plant efficiency and the gas price at power plant inlet from Table 9: The average power output is the actual electricity available for sale after the high voltage transformer at the point of connection to the purchaser’s electrical grid. As these plants run at a variable load, depending on their power purchase agreement and actual demand from the grid, this is then converted into an annual average load.
Power plant average efficiency (average fuel consumption) is also adjusted to the same operational conditions with lot of efficiency losses coming from start and stops and part loading.
Total power plant CAPEX
Total power plant investment comprises the EPC contract value, mobilisation costs and other up-front costs, such as project development, land purchase and connection costs.
Power plant operating costs (OPEX)
The biggest operating cost is fuel. Other operating costs are lube oil consumption along with variable and fixed operation and maintenance (O&M) costs.
Wärtsilä combustion engines typically consume around 0.3 g/kWh of lube oil during operation. Lube oil typically costs around 1.50 USD/litre.
Variable O&M cost for these type of plants are around 6 USD/ MWh; including consumable spare parts and manpower for service activities and operation.
Fixed O&M cost which includes operators and administrative duties at the plant is between 0.5 – 1.2 MUSD dependent on the size, operational requirements and automation level of the plant.
19 Comparing Various LNG to Power Solutions for Myanmar | 2017

Table 9 shows the weight of each of the elements of the final electricity sales tariff including the share of the 15% ROE requirement.
SiteSite 1: Dawei
Site 2: Yangon
Site 3: Nga Yoke Kaung
Total power plantCAPEX(Incl. mobilisation cost, but excluding land purchase and grid connection costs)
65 MUSD75 MW Pure Gas
90 MUSD125 MW DualFuel
50 MUSD50 MW DualFuel
Development cost 10 MUSD 10 MUSD 8 MUSD
AnnualPower Factor (PF)
66% 80% 80%
Power plant average (incl. part loading) net heatrate (efficiency) as new.
8000 kJ/kWh(45.0%)
(Part loading + daily staring & stopping)
8000 kJ/kWh (45.0%)Stable full load most of the time, only weekly
start and stop)
8000 kJ/kWh (45.0%)Stable full load most of the time, only weekly
start and stop)
Lifecycle aging factor 1% 1% 1%
Fixed costs USD/Year 0.8 MUSD 1.2 MUSD 0.8 MUSD
Electricity tariff calculation USD/ MWh(Excluding grid connection costs, all taxes & import duties)
Fuel cost(Gas price from table 8)
74.06(9,67 USD/MMBtu)
83.18(10.86 USD/MMBtu)
91.45(11.94 USD/MMBtu)
PP CAPEX fee 7.97 6.37 7.62
PP fixed OPEX 1.84 1.66 2.28
PP variable OPEX 5.53 6.53 6.53
ROE 6.58 5.27 6.30
Total cost of Power 95.99 103.01 114.19
Table 9: Price of electricity derived from power plant investment, operating & fuel costs
20 Comparing Various LNG to Power Solutions for Myanmar | 2017

6. Conclusion
When planning an LNG to Power project, it is important to understand how the whole LNG logistics and value chain will affect the final cost of power. To illustrate the process and the alternative solutions we have taken a few different type of requirements and site locations where we aim to convert LNG to Power in the most optimal way. The study shows that the cost of produced electricity can be kept at a reasonable level by careful selection of the site. A good site should have existing structures that can be utilised – e.g. harbour facilities, deep enough water for LNG carrier access, existing industrial area making development and construction easier, good land access and a location with good soil bearing capacity. All of this will help reduce the initial infrastructure investment. After selecting the site it is important to choose the most optimal solution based on the conditions at the site.
The landed cost of LNG can be reduced by clustering together several consumers and thereby increasing the volumes. This allows for better purchasing price and using larger sized LNG carrier which is reducing the specific shipping costs.
Looking at the total fuel cost, the purchase price of LNG has by large the biggest impact. It is worth shopping around to find the cheapest supplier. The shipping component of the cost may contribute to a fairly larger part of the final LNG cost as well, unless it is well planned. The impact of the terminal CAPEX cost, which may seem high at the start of the project, has usually a quite low impact on the lifecycle cost.
In this example, the calculations show that the effects of the more flexible charter agreement were considerable. For Nga Yoke Kuang, we managed to reduce the cost price of gas by 0.60 USD/mmBtu, which might have a decisive impact on the financial feasibility of the entire project. Also for the other sites, we managed to reduce the costs despite the effects of significantly higher CAPEX of the terminal.
This case study shows that judging a project’s feasibility simply by looking at CAPEX can be extremely misleading. One can make significant improvements by designing a logistical chain with a good fit with regards to distances, gas consumption and the sizes of available ships. Such optimization should also examine the effects of even the slightest reduction of charter rates or LNG prices on the final cost price of gas.
Then regarding the final electricity tariff, it can be seen that fuel cost dominates the tariff in the plants with a high power factor, while the fixed costs are almost negligible. In a power plant with a low power factor (for example peaking plants or renewable energy followers), the CAPEX and fixed costs ofcourse play a bigger role.
21 Comparing Various LNG to Power Solutions for Myanmar | 2017

WÄRTSILÄ® is a registered trademark. Copyright © 2017 Wärtsilä Corporation.
Specifications are subject to change without prior notice.
www.wartsila.com
10.2
017
/ B
ock´
s O
ffice
Legal disclaimer This document is provided for informational purposes only and may not be incorporated into any agreement. The information and conclusions in this document are based upon calculations (including software built-in assumptions), observations, assumptions, publicly available competitor information, and other information obtained by Wärtsilä or provided to Wärtsilä by its customers, prospective customers or other third parties (the ”information”) and is not intended to substitute independent evaluation. No representation or warranty of any kind is made in respect of any such information. Wärtsilä expressly disclaims any responsibility for, and does not guarantee, the correctness or the completeness of the information. The calculations and assumptions included in the information do not necessarily take into account all the factors that could be relevant.
Nothing in this document shall be construed as a guarantee or warranty of the performance of any Wärtsilä equipment or installation or the savings or other benefits that could be achieved by using Wärtsilä technology, equipment or installations instead of any or other technology.
Wärtsilä is a global leader in complete lifecycle power solutions for the marine and energy markets. By emphasising technological innovation and total efficiency, Wärtsilä maximises the environmental and economic performance of the vessels and power plants of its customers.