Embed Size (px)
Citation preview

Paper presented at the annual meeting of the Midwest Political Science Association, Chicago, April 2-5, 2009. Copyright by the Midwest Political Science Association.
`
Comparing the Topics of Front-Page and Full-Paper Stories in the New York Times
Michelle Wolfe University of Texas, Austin [email protected]
Amber E. Boydstun
University of California, Davis [email protected]
Frank R. Baumgartner Penn State University
[email protected] Abstract Many scholars rely on studies of media coverage of public policy issues in order to study salience. The Policy Agendas Project (www.policyagendas.org) makes available a sample of New York Times stories going back to 1947, based on the published Index to the Times, but this index may soon be discontinued. Boydstun has created a comprehensive database of all stories appearing on the front page of the Times going back to 1998, with plans to extend this dataset back much further. We assess the differences in the two databases. Front-page coverage differs from full-paper coverage in obvious ways, and many elements that regularly appear inside the paper may rarely or never appear on page A-1. Front-page coverage is also more skewed and has a greater orientation toward repeating the topics on which attention focused yesterday (that is, it has higher “friction”), compared to full-paper coverage. Our findings have implications for those interested in constructing media databases and provide further understandings of the nature and characteristics of news coverage of public policy issues. Boydstun has already demonstrated the feasibility of constructing a full database of front-page stories over time. Sampling from a database of all full-paper stories is difficult for technical reasons, however. Automated classification systems may potentially allow for the creation of a full-paper database, but in the meantime is it important to know the differences in topic coverage and other characteristics of the front page versus the entire content of media sources. Scholars should be aware of the differences across approaches to this question and choose their indicators carefully.
Wolfe, Boydstun, and Baumgartner 1
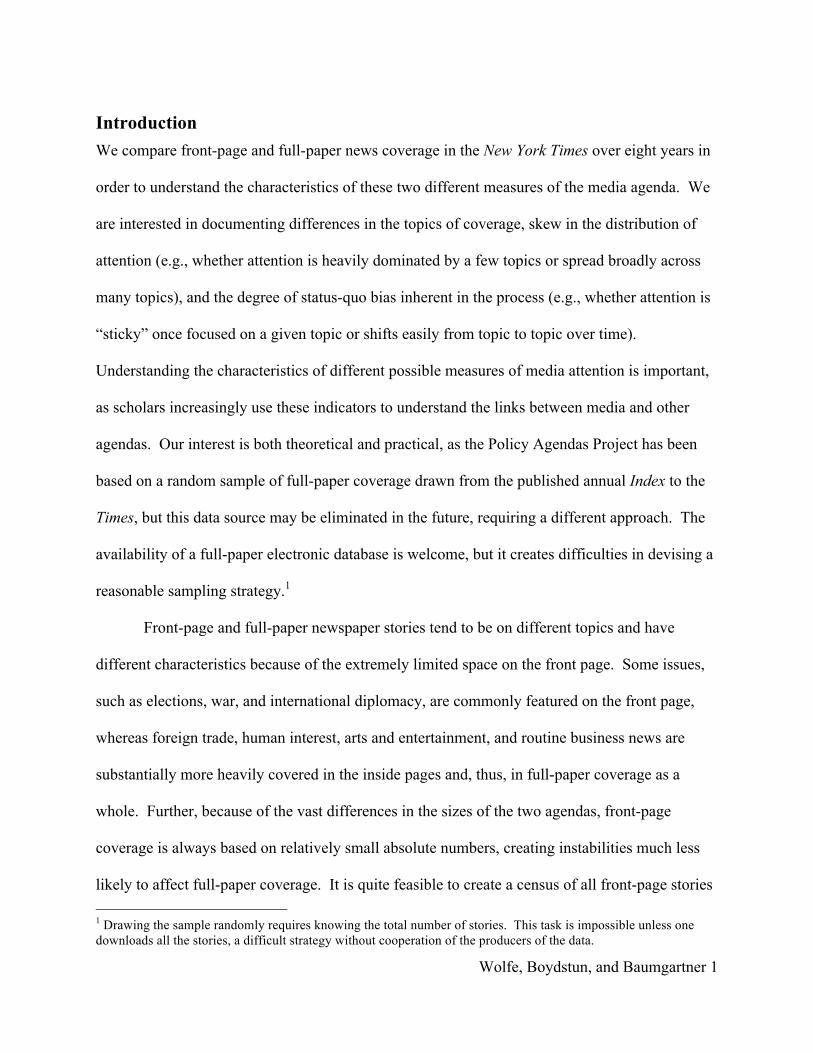
Introduction We compare front-page and full-paper news coverage in the New York Times over eight years in
order to understand the characteristics of these two different measures of the media agenda. We
are interested in documenting differences in the topics of coverage, skew in the distribution of
attention (e.g., whether attention is heavily dominated by a few topics or spread broadly across
many topics), and the degree of status-quo bias inherent in the process (e.g., whether attention is
“sticky” once focused on a given topic or shifts easily from topic to topic over time).
Understanding the characteristics of different possible measures of media attention is important,
as scholars increasingly use these indicators to understand the links between media and other
agendas. Our interest is both theoretical and practical, as the Policy Agendas Project has been
based on a random sample of full-paper coverage drawn from the published annual Index to the
Times, but this data source may be eliminated in the future, requiring a different approach. The
availability of a full-paper electronic database is welcome, but it creates difficulties in devising a
reasonable sampling strategy.1
Front-page and full-paper newspaper stories tend to be on different topics and have
different characteristics because of the extremely limited space on the front page. Some issues,
such as elections, war, and international diplomacy, are commonly featured on the front page,
whereas foreign trade, human interest, arts and entertainment, and routine business news are
substantially more heavily covered in the inside pages and, thus, in full-paper coverage as a
whole. Further, because of the vast differences in the sizes of the two agendas, front-page
coverage is always based on relatively small absolute numbers, creating instabilities much less
likely to affect full-paper coverage. It is quite feasible to create a census of all front-page stories 1 Drawing the sample randomly requires knowing the total number of stories. This task is impossible unless one downloads all the stories, a difficult strategy without cooperation of the producers of the data.
Wolfe, Boydstun, and Baumgartner 2
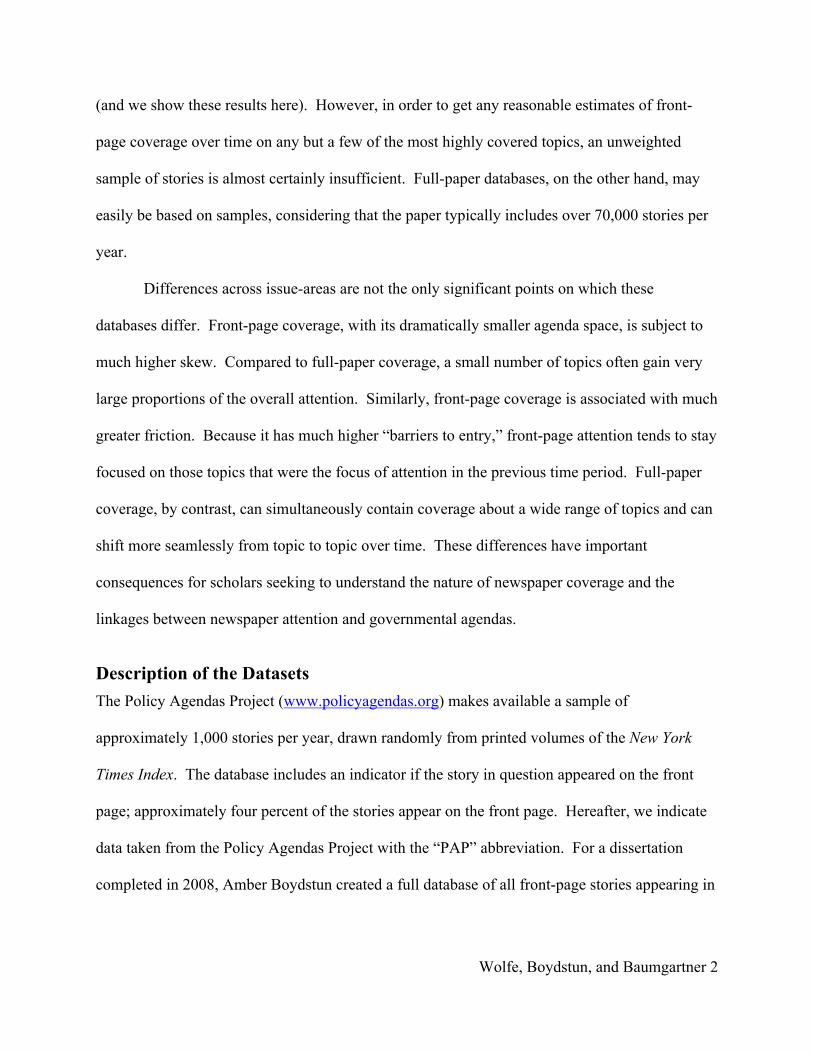
(and we show these results here). However, in order to get any reasonable estimates of front-
page coverage over time on any but a few of the most highly covered topics, an unweighted
sample of stories is almost certainly insufficient. Full-paper databases, on the other hand, may
easily be based on samples, considering that the paper typically includes over 70,000 stories per
year.
Differences across issue-areas are not the only significant points on which these
databases differ. Front-page coverage, with its dramatically smaller agenda space, is subject to
much higher skew. Compared to full-paper coverage, a small number of topics often gain very
large proportions of the overall attention. Similarly, front-page coverage is associated with much
greater friction. Because it has much higher “barriers to entry,” front-page attention tends to stay
focused on those topics that were the focus of attention in the previous time period. Full-paper
coverage, by contrast, can simultaneously contain coverage about a wide range of topics and can
shift more seamlessly from topic to topic over time. These differences have important
consequences for scholars seeking to understand the nature of newspaper coverage and the
linkages between newspaper attention and governmental agendas.
Description of the Datasets The Policy Agendas Project (www.policyagendas.org) makes available a sample of
approximately 1,000 stories per year, drawn randomly from printed volumes of the New York
Times Index. The database includes an indicator if the story in question appeared on the front
page; approximately four percent of the stories appear on the front page. Hereafter, we indicate
data taken from the Policy Agendas Project with the “PAP” abbreviation. For a dissertation
completed in 2008, Amber Boydstun created a full database of all front-page stories appearing in
Wolfe, Boydstun, and Baumgartner 3
the New York Times from 1998 through the end of 2006, some 26,000 stories (Boydstun 2008).
We indicate data taken from Boydstun’s project with the “AEB” abbreviation.
The Policy Agendas Project makes available consistently defined data sampled from the
New York Times from 1947 to 2005, whereas Boydstun’s dataset of front-page Times stories
reaches from 1998 to 2006. In this paper we focus only on the period of 1998 to 2005 common
to both datasets. For this period, the Agendas Project database holds 7,891 stories, of which 309
(about four percent) are on the front page. Boydstun’s full census contains 22,705 stories over
these eight years (about 2,800 per year; 237 per month; eight per day). If the proportion of front-
page stories in the Agendas Project database is accurate, these values suggest a total of almost
575,000 Times stories appearing during this time period, or about 71,850 stories per year (200
per day). If this rate continued for the 1947 to 2009 period, there would be 4.5 million stories.
However, we know (Baumgartner and Jones 2009, Table A-3) that the number is substantially
greater than this value, since the size of the New York Times news hole was much larger in the
1970s. Such numbers commend either a completely automated data collection and classification
system, or a sample.
All stories are coded according to the identical topic classification system as developed
for the Policy Agendas Project. This codebook includes 19 policy-related topics, including
Macroeconomics, Civil Rights, Health Care, Agriculture and others as enumerated in Table 1
below. In addition to the policy-related topics that are also used in other parts of the Policy
Agendas Project (for example, for congressional hearings, presidential statements, executive
orders, and other indicators of governmental activity), the dataset includes eight additional topic
categories that do not appear in the databases relating to the actions of the federal government
(State and Local Government Actions; Weather and Natural Disasters; Fires; Arts and

Wolfe, Boydstun, and Baumgartner 4
Entertainment; Sports; Death Notices; Religion; and Miscellaneous / Human Interest). These
topics were added later to the Policy Agendas Project category system because they never or
rarely appear in congressional hearings or other government-related policy activities. (Congress
does not hold hearings on sports results, burning buildings, movie reviews, the weather, or recent
deaths as a general rule, but there are many newspaper stories on these topics.) Any story
relating to topics similar to those covered in other Policy Agendas Project databases is coded into
the same category, allowing straightforward comparisons of newspaper coverage to other
elements of the political agenda. The eight additional policy topics allow the New York Times
database to be comprehensive. In addition, each category is mutually exclusive. Every story is
coded into one but only one policy topic, based on the primary focus of the article.
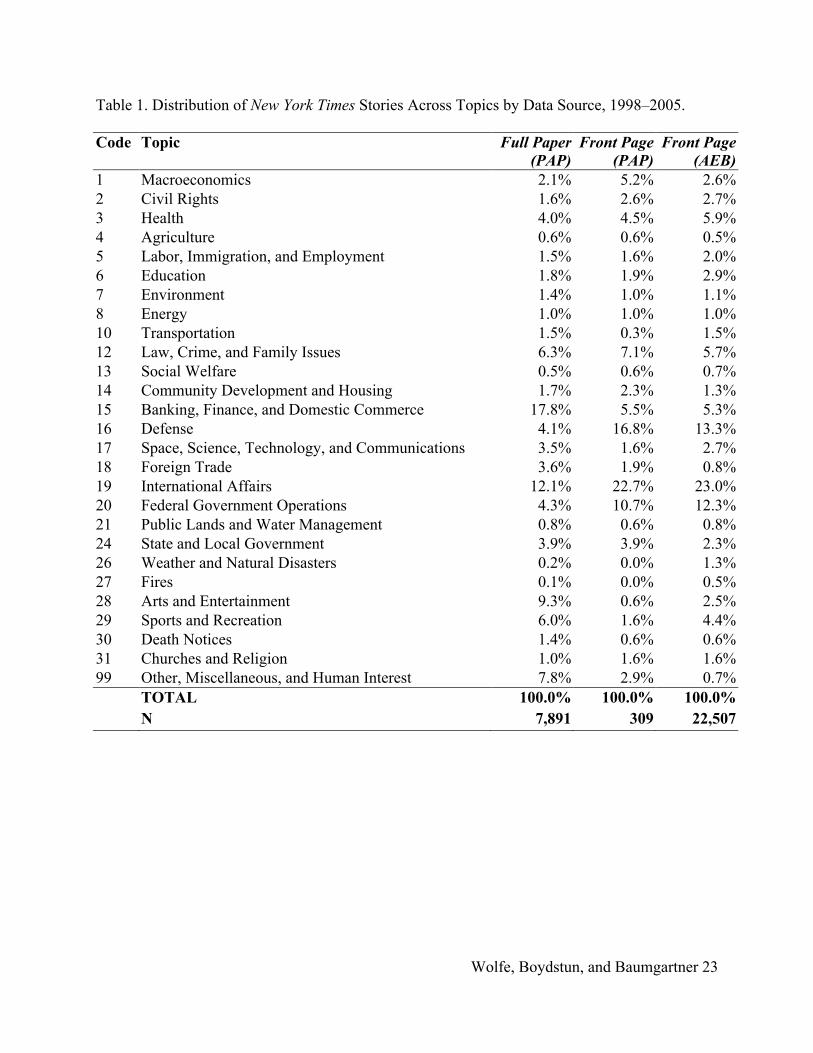
Front-Page v. Full-Paper Attention by Topic Table 1 shows the amount of coverage by policy topic for the full Policy Agendas Project sample
of full-paper stories, the smaller sample of front-page stories from the Policy Agendas Project,
and Boydstun’s complete census of front-page stories, indicating for each dataset the total N on
which the calculations are based.
(Insert Table 1 about here)
We begin by comparing Boydstun’s database of all front-page stories (labelled “Front
Page (AEB)”) with the sample of front-page stories indexed and made available through the
Policy Agendas Project (“Front Page (PAP)”). Three policy topics dominate both datasets, with
the following shares of attention: International Affairs (23.0 percent in the complete census;
22.7 percent in the sample), Defense (13.3; 16.8); and Government Operations (e.g., elections)
(12.3; 10.7). Similarly, those topic areas with extremely low levels of coverage are similar in the
two data sources. In fact, the two series correlate at a level of 0.963. So there is little indication
Wolfe, Boydstun, and Baumgartner 5
that the sample of front-page stories is flawed in any way as relates to the coverage of various
policy topics. However, the extremely low N of the PAP front-page data makes any analysis
over time extremely hazardous, as the sample size is only about 39 observations per year, and as
many of the policy topics generate a total of only one percent or less of the total coverage.
Spread across 27 policy topics, it is clear that no estimate for any particular year is likely to be
very stable. In sum, useful estimates about front-page coverage of particular topics for particular
years need to be based on much larger samples than the PAP front-page data provided here, or a
complete census. This conclusion is in spite of the fact that there appear to be no systematic
flaws in the data made available through the Policy Agendas Project; it is simply too sparse to
provide strong estimates over time, or even very precise estimates of those policy topics that
generate very low levels of front-page.
Table 1 shows that some topics are more commonly covered on the front page; others,
more heavily on the inside pages, as we can see by comparing Boydstun’s census of front-page
stories (“Front Page (AEB)”) to the Policy Agendas Project sample of full-paper stories (“Full
Paper (PAP)”). Almost half (48.6 percent) of all front-page coverage was in the areas of
International Affairs (23.0 percent), Defense (13.3 percent), and Government Operations (12.3
percent). The first two categories cover all discussions of Al Qaeda and the wars in Iraq and
Afghanistan; the last, the presidential elections of 2000 and 2004 as well as other government-
related matters. Just three other topics, Health, Crime, and Business news, garner more than five
percent of the total coverage; the remainder of the coverage is sparsely distributed across the
other categories.
Full-paper coverage is distributed quite differently; first of all, the top three categories
combine for only 39 percent of the total, rather than 49 percent on the front page. More
Wolfe, Boydstun, and Baumgartner 6
strikingly, the issues themselves are Business news (17.8), International Affairs (12.1 percent),
and Arts and Entertainment (9.3 percent). Further, looking at the top attention-getters, many are
non-policy relevant, including Human Interest (7.8 percent) and Sports (6.0 percent). (Crime is
also a top attention-getter, capturing 6.3 percent of the full paper agenda and 5.7 percent of the
front page.)
Figure 1 shows the different foci of front-page and full-paper attention graphically. The
data are sorted by the largest differences, so that those toward the top of the graph receive a
higher proportion of attention on the front page, and those at the bottom are more heavily
covered in the full paper.
(Insert Figure 1 about here)
We have already noted the policy topics that are particularly likely to appear on Page A-
1; these are the heavy-hitters of international and national policy debates, the objects of wide
discussion throughout society: Elections, wars, international diplomacy. Perhaps as striking, a
large number of policy topics are the object of very low media attention across the board. (These
policy topics, such as macroeconomics, social welfare, immigration, energy, agriculture, or
public lands, are by contrast the object of considerable government attention.) Toward the
bottom of the figure we see those policy topics that are more heavily covered on the inside pages
than on the front page: Business news, human interest, sports results, and foreign trade.
We can distinguish among three types of policy topics: The “high politics” of elections,
Defense, and diplomacy; the “non-politics” of routine business news, arts, sports, and
entertainment; and the “low politics” of those many policy domains which generate little media
coverage at all either on the front page or inside the fold. In the next section we discuss some
examples of each.

Wolfe, Boydstun, and Baumgartner 7
Three Examples of Front-Page v. Full-Paper Attention We can lend more meaning to the findings presented above by tracing New York Times front-
page and full-paper attention to individual policy areas over time. We examine two broad policy
topics—Defense and Business—and one narrower policy issue—Capital Punishment—to
understand how the differences between the front-page and full-paper agendas play out in real
policy debates. We examine Defense because it is a “high politics” topic that, along with
International Affairs and Government Operations, receives a much larger share of the front-page
agenda than the full-paper agenda. We examine Business for just the opposite reason. This
policy area is the strongest example of a “non-politics” topic that receives much greater relative
attention in the full newspaper than on the front page. Finally, we look at Capital Punishment to
see how a “low politics” issue that has long maintained a position in national politics but that
rarely dominates the limelight fares differently on these different media agendas. Further, the
Capital Punishment data come from a data source based on a full census, not a sample, of full-
paper Times stories (data come from Baumgartner, De Boef, and Boydstun 2008), allowing us to
trace media attention to a single and relatively specific issue over time.
(Insert Figure 2 about here)
Figure 2 shows the percentage of front-page and full-paper attention to Defense,
quarterly, for the entire available time period. The topic typically occupies less than one percent
of the agenda space in the full paper before September 11, 2001. Even after the terrorist attacks,
it receives only about five percent of the full-paper agenda on average, with a surge of attention,
reaching almost 14 percent, in early 2004. Front-page coverage is consistently higher, especially
during periods of surges in coverage like those following events such as the NATO bombing of
Yugoslavia that began in March, 1999 as part of the Kosovo War; the 9/11 attacks and
subsequent deployment of U.S. troops to Afghanistan beginning in October, 2001; the

Wolfe, Boydstun, and Baumgartner 8
deployment of U.S. troops to Iraq (and the near-immediate capture of ten U.S. soldiers as
prisoners of war) beginning in March 2003; and the Abu Ghraib detainee abuse scandal that
broke in April, 2004. Interestingly, the events surrounding the Abu Ghraib scandal (emphasis on
scandal) receives more attention than any other item in this list, and Abu Ghraib is the only event
to draw more than 10 percent of full-paper attention to Defense across the entire time period. At
that time, this single topic was generating 35 percent of total front-page coverage for the entire
three-month period. The data in Figure 2 show a strong positive correlation (r = 0.78); when
attention rises on the front page, it also rises in the inside pages as well.
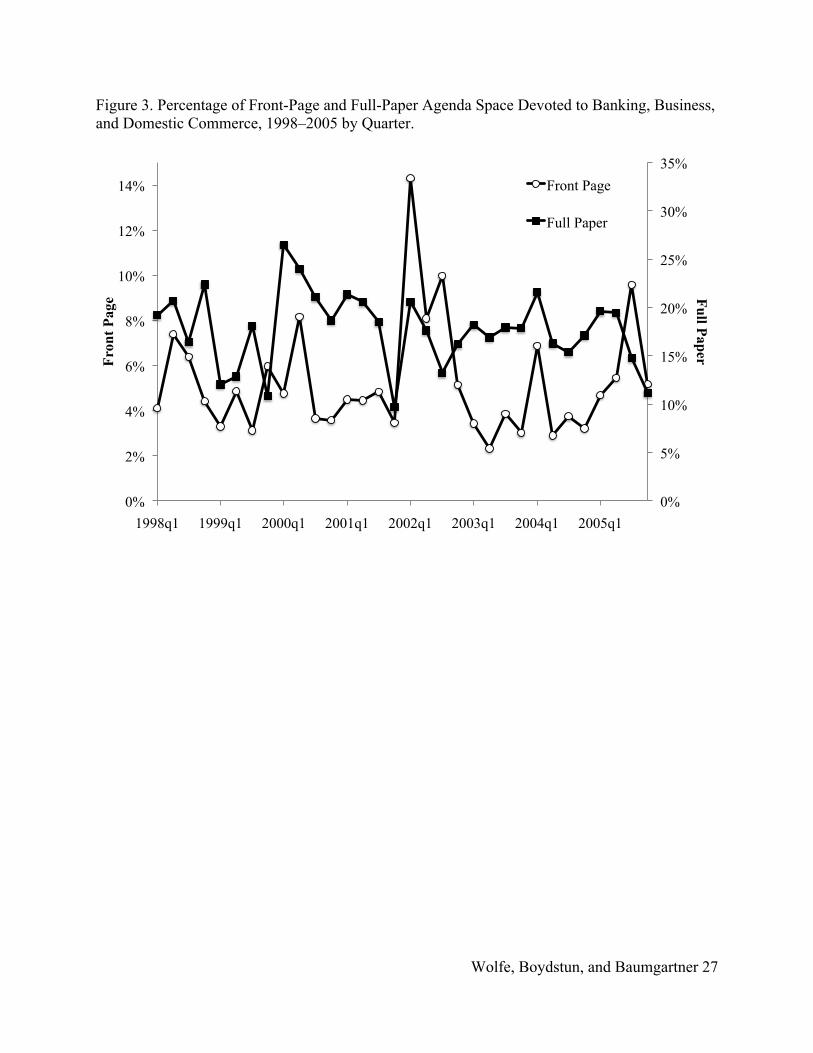
(Insert Figure 3 about here)
Figure 3 presents the same type of information as seen in Figure 2, but this time for the
topic of Business. We see that, as Table 1 summarized, this topic consumes a much larger
portion of the full newspaper than of the front-page agenda. Full-paper coverage of business
contains substantial coverage of routine news, including new appointments and retirements of
individual corporate leaders, stock market analyses, reports of acquisitions and the release of
new products. Front-page business news has a substantially different focus: scandal and crisis.
In fact, while Business never represents less than 10 percent of the full-paper agenda, the only
time this topic exceeds that share of the front-page agenda is during the first quarter of 2002, at
the height of the Enron scandal.
The Enron incident in early 2002 represents one of the only points during this time period
when Business comes close to occupying as much space on the front page (14 percent) as in the
paper as a whole (21 percent). The two agendas converge at this point not only because Enron
seems to have a big effect on front-page attention to Business, but just as importantly because the
effect of Enron on the full-paper agenda was relatively small. Full-paper attention to Business
Wolfe, Boydstun, and Baumgartner 9
hovers around its mean of 18 percent and reaches its peak of about 25 percent in early 2000, two
years before the Enron explosion, at which point it increases only to 21 percent, just three points
above its long-term average. Front-page coverage, by contrast, has a mean value closer to five
percent and surges to a value almost three times that high in conjunction with the scandal. In
fact, in contrast to what we saw with Defense, the correlation between front-page and full-paper
coverage of Business news is very low, just 0.10. While the front page is strongly driven by
crisis and scandal, the full paper is more insulated.
(Insert Figure 4 about here)
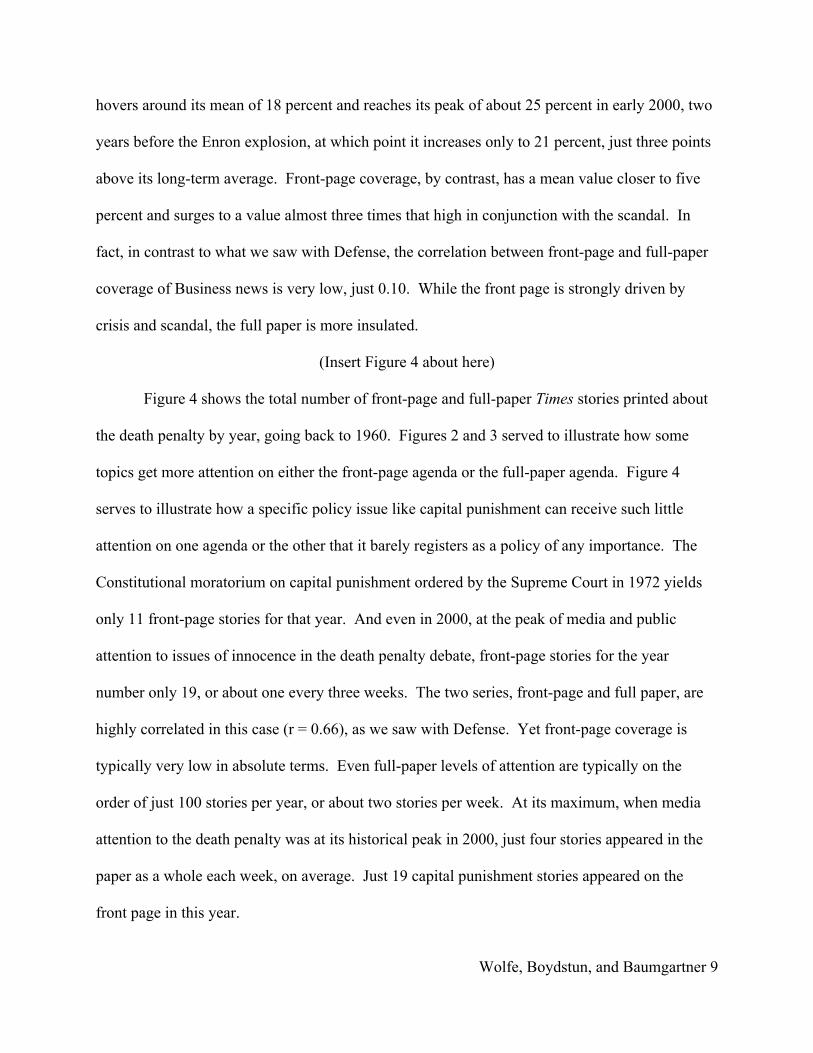
Figure 4 shows the total number of front-page and full-paper Times stories printed about
the death penalty by year, going back to 1960. Figures 2 and 3 served to illustrate how some
topics get more attention on either the front-page agenda or the full-paper agenda. Figure 4
serves to illustrate how a specific policy issue like capital punishment can receive such little
attention on one agenda or the other that it barely registers as a policy of any importance. The
Constitutional moratorium on capital punishment ordered by the Supreme Court in 1972 yields
only 11 front-page stories for that year. And even in 2000, at the peak of media and public
attention to issues of innocence in the death penalty debate, front-page stories for the year
number only 19, or about one every three weeks. The two series, front-page and full paper, are
highly correlated in this case (r = 0.66), as we saw with Defense. Yet front-page coverage is
typically very low in absolute terms. Even full-paper levels of attention are typically on the
order of just 100 stories per year, or about two stories per week. At its maximum, when media
attention to the death penalty was at its historical peak in 2000, just four stories appeared in the
paper as a whole each week, on average. Just 19 capital punishment stories appeared on the
front page in this year.

Wolfe, Boydstun, and Baumgartner 10
The Policy Agendas Project makes information available not about particular policy
issues, but about broad policy topics (the two-digit major topic classifications). With the
exception of certain extremely salient policy topics (such as presidential elections, large-scale
wars, or presidential scandals such as impeachment or Watergate), very few policy issues are
consistently in the press at levels that register significant proportions of overall media attention.
The example of capital punishment is a good reminder of the low absolute levels of coverage
even for an issue that is relatively salient and widely understood by the public. Most policy
issues, most of the time, are simply not part of the media agenda at all.
These three examples illustrate some points worth reinforcing for those who would use
media indicators of various policy issues to understand their public salience. First, as the capital
punishment example shows, many specific policy debates are the object of surprisingly little
media attention. More specific issues, such as mercury contamination of drinking water or lead
hazards in paint or discrimination against the elderly in banking practices, are simply not the
stuff of any significant proportion of the overall media agenda. By contrast, a small number of
high profile items relating to the President, war, and/or diplomacy operate at a different level of
media fascination. Finally, measures based on full-paper and front-page coverage are likely to
generate similar or different estimates of the timing of rises and falls on the agenda depending on
the issue, and the levels of attention may differ substantially. In sum, different measures of
media attention to policy issues generate different results.
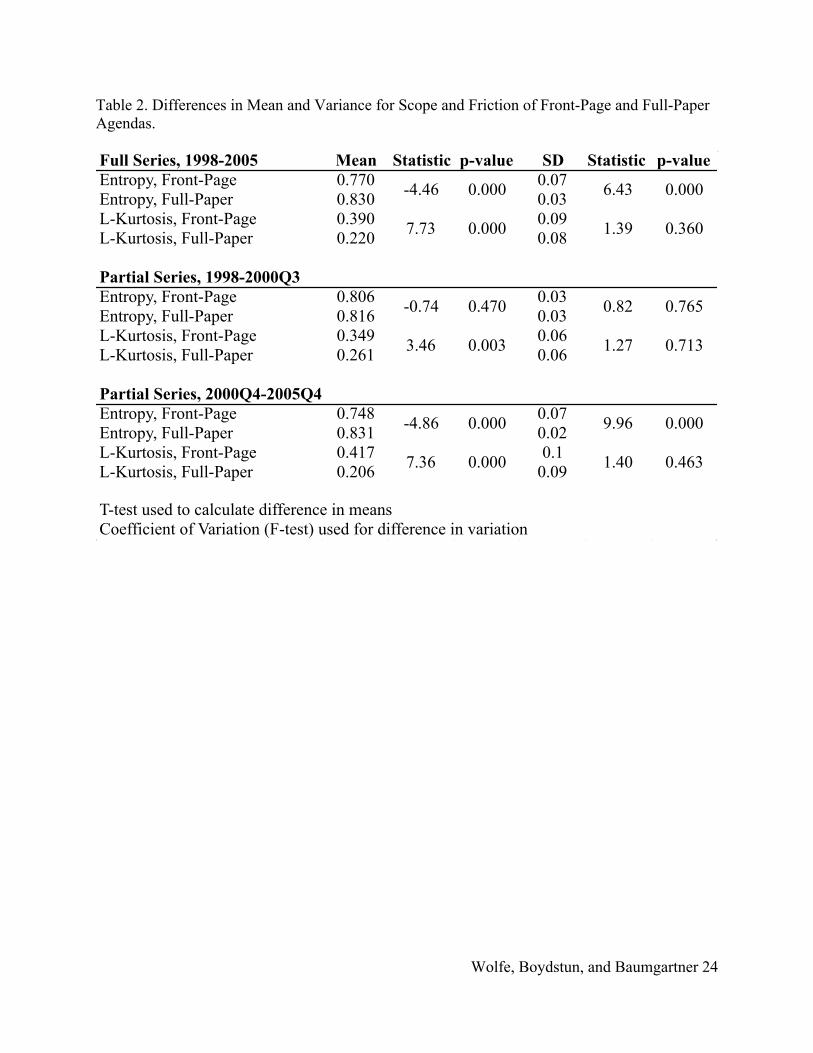
Distributional Differences in the Front-Page and Full-Paper Agendas We now turn to systematic comparisons of the distribution of topic attention across front-page
and full-paper Times coverage. Two summary measures, entropy and l-kurtosis, illuminate the
differences in “scope” and “friction” respectively between the two agendas.
Wolfe, Boydstun, and Baumgartner 11
The scope of an agenda refers to the diversity and spread of attention across topics and is
related to the agenda’s clarity. If a newspaper agenda is very narrow in scope, displaying
relatively large proportions of attention to a small set of issues, then the agenda is clear and the
news consumer can easily discern the nature of the current key issues. As the scope of the
agenda widens through an increase in the diversity of stories and the spread of attention across
issues, the clarity of the agenda decreases, producing an environment of rising agenda
uncertainty. Put simply, the more issues covered, the less clear the agenda; and, the fewer issues
covered, the clearer the agenda. In the analyses to follow, we find that the scopes of the front-
page and full-paper agendas are highly similar for about the first half of the timer period
examined. However, there is a marked difference in the mean and variance of scope starting in
the fourth quarter of 2000.
In addition to scope, the friction of a news agenda is a different way of thinking about the
barriers of entry for issues on the agenda. Issues, and the journalists reporting on them, compete
for attention in the form of a place on the limited agenda. The front page has a premium on
location, and its finite agenda space is especially small. While the full paper too has finite space,
its expanse is greater and the in-fold location cheaper. Thus, there is a much stronger barrier to
entry for an issue (or a journalist’s by-line) to appear on the front page than in the full paper. Put
another way, there should be more friction associated with the front-page agenda than that of the
full paper. And this distinction is exactly what we find. We show that there is greater
variability, instability and in general more friction in front-page news than in the full paper,
which can be characterized by a more inertial time-path. And, as with scope, we find that the
friction of these two agendas begins to diverge in the fourth quarter of 2000 and that this gap
Wolfe, Boydstun, and Baumgartner 12
continues through the end of the dataset, with the front-page agenda markedly higher in friction
than the full paper during this time period.
The findings we present in the sections to follow demonstrate the implications for using
one series over the other in research on the relationship between and among media attention,
governance, and issues. The characteristics of the issue(s) and the breadth of the agenda under
examination should determine the sample—whether it is more appropriate and necessary to
capture the front-page or the full-paper news agenda.
Scope of Coverage We measure the scope of each agenda by calculating the entropy of front-page and full-paper
news across topics and over time. Information entropy or Shannon’s H (Shannon 1948 and
1950; Shannon and Weaver 1949), captures the concentration and categorization of topics in one
single measure and is thus a fitting measure of agenda scope. Entropy has been used in studies
of newspaper competition and agenda diversity (Chaffee and Wilson 1977; Lasorsa 1991),
institutional agenda-setting (Baumgartner et al 2000; Boydstun 2008), comparative policy
attention (Bevan 2008), jurisdictional competition among congressional committees (Sheingate
2006), and the effects of signal clarity on problem prioritization (Wolfe 2008).
Entropy is calculated by multiplying the proportion of attention devoted to a topic by the
log of the inverse proportion of attention (see Equation 1). The entropy measure presents
advantages over other measures of scope. The base of the log takes into account the varying real
or theoretical number of topic dimensions captured in policy debates and agendas. More
relevant here, as our datasets employ the same topic categorization schemes, entropy better
captures lower ends of the distribution of attention and thus changes in variance (Bevan 2008;
Boydstun 2009).

Wolfe, Boydstun, and Baumgartner 13
(Insert Equation 1 about here)
Interpreting entropy is relatively straightforward. Bound at 0 and 1, lower scores indicate
a reduction in information uncertainty while higher scores are a sign of increasing complexity
and uncertainty. Applied to the scope of an agenda, lower scores are associated with low scope
and thus with agenda clarity. As entropy scores increase, scope increases in tandem with a
decrease in agenda clarity. If attention is broadly spread across many topics, entropy will be
high; if focused on just a few topics to the exclusion of others, low.
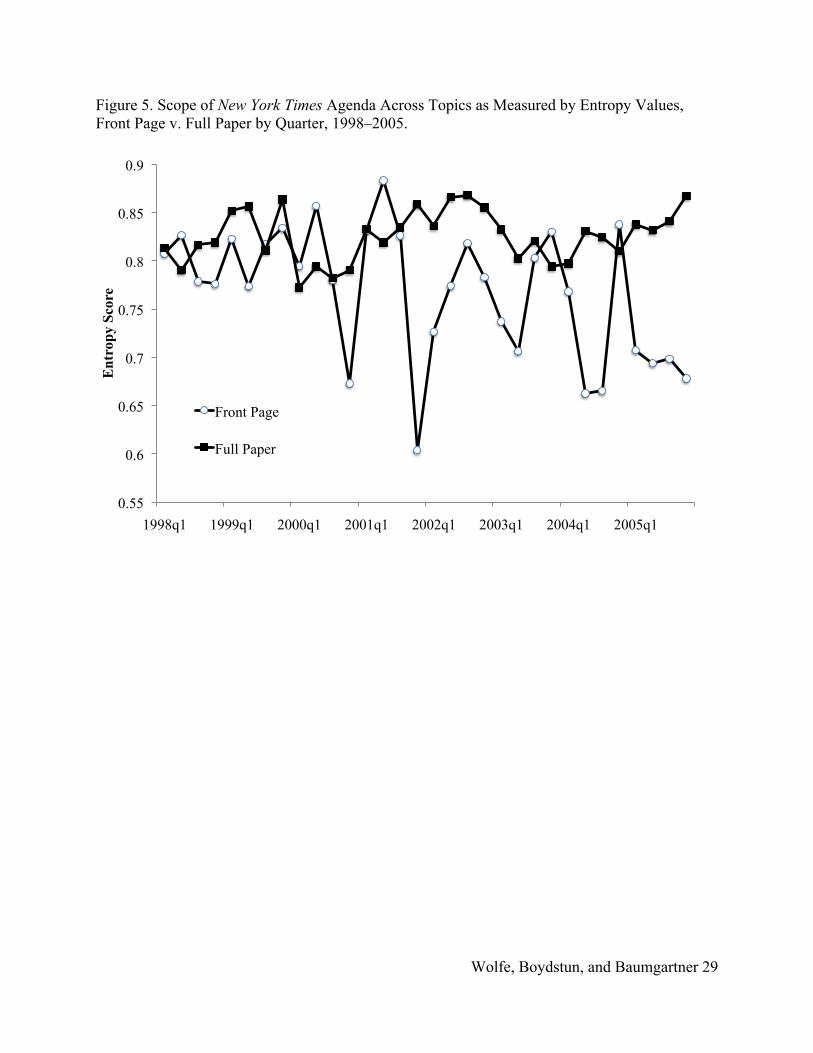
We calculated entropy scores to measure the scope of the quarterly front-page and full-
paper agendas.2 As shown in Figure 5, the relationship between front-page and full-paper scopes
can be divided into two distinct time periods (the same is true for friction as well, which we will
take up in the following section). The first period is from the first quarter of 1998 to the third
quarter of 2000; the fourth quarter of 2000 marks the beginning of the second series. The time
period up until the fourth quarter of 2000 is characterized by strong covariance between the
scope of the front-page and full-paper agendas, which exhibit statistically indistinct means and
variances during this period, as shown in Table 2. In this earlier period, the mean scope for the
front-page agenda is 0.806 with a variance of 0.03, and the full-paper agenda scope shares a
similar mean and variance, 0.816 and 0.03, respectively.3 Accordingly, the scope and hence
clarity of the front-page and full-paper agendas are essentially the same.
(Insert Figure 5 about here)
Looking at the period after 2000q3, the scope of the front-page agenda decreases by
approximately 11% from the third to the fourth quarter of 2000, from 0.78 to 0.673 while the full
2 We aggregate the data to the quarterly level in order to compile enough observations to support meaningful analyses of scope and friction. 3 We report the standard deviation here, as it is easier to interpret than variance.

Wolfe, Boydstun, and Baumgartner 14
paper remains constant (0.782 to 0.791). Not coincidentally, this decrease in scope occurs during
the final months of the highly contested 2000 presidential election. What we expect from the
nature of front-page coverage is evident here: the scope of the front-page decreases as the agenda
is “hogged” by election coverage. Similarly, front-page agenda scope decreases by
approximately 22% from the third to the fourth quarter of 2001 from 0.826 to 0.604, reflecting
the primacy of news attention to the September 11, 2001 attacks. The news agenda is clear here;
the salience and importance of national Defense is unmistakable. Interestingly, the scope of the
full-paper agenda increases during this period, from 0.835 to 0.859, as if “making up” for the
narrow scope of the front-page.
Looking again at Figure 5, disproportionate attention to the invasion of Iraq, the Enron
scandal and the 2004 presidential election periodically narrows the scope of the front-page
agenda from 2003 through 2005. The scope of the front-page is 0.706 during the second quarter
of 2003 while that of the full paper is 0.802. Front-page scope decreases again by nearly 11%
from the first to the second quarter of 2004, from 0.763 to 0.663. Here again the scope of the
full-paper agenda increases, from 0.797 to 0.831. Notably, the scope of the front-page agenda
climbs substantially after each punctuation of low scope as if compensating for the lack of
attention to other issues.
(Insert Table 2 about here)
Remember that in the first period the scope of the front-page and full-paper agendas are
practically and statistically indistinguishable. The same cannot be said of the second period.
The mean and variance of both agenda scopes are statistically different in this period. Average
front-page scope is lower than that of the full-paper agenda (0.748 compared to 0.831) and with
two-and-a-half times greater variance (0.07 compared to 0.02). Overall, the later time period is
Wolfe, Boydstun, and Baumgartner 15
characterized with an agenda scope that is lower but less stable. The narrower scope of the latter
period is expected and reflects the episodic nature of an event-driven front-page.
So what of newspaper scope? Why is agenda clarity important? The media, and no less
the newspaper medium, is a source of information used by the public and the government to
prioritize issues (Baumgartner and Jones 1993, 2005). It does so by sending signals by way of
its agenda to consumers about the relative salience and importance of issues. As scope increases
and agenda clarity lessens, signals become more uncertain and ambiguous and, thus, harder to
interpret. Conversely, signals become easier to receive and process as scope decreases and
agenda clarity grows.
It is worth noting that what we have discovered using quarterly data is a front-page scope
that is unexpectedly high. The pace of the news business is so fast that even though the front-
page agenda tends to get stuck in equilibrium, focusing on a very narrow set of issues (i.e., it has
a very narrow scope) from one day to the next, over the course of a three-month period it is not
unusual for the front page to cycle through so many different equilibria.
The scope of the front-page agenda appears much different when examined in finer
gradations of time. The average scope of the front-page is 0.77 at the quarterly level, meaning
that over the course of an average three-month period the front-page agenda is quite spread out
across topics. There is even more spread across topics over the course of a year; at this level the
average scope is 0.81. In contrast, the average weekly scope for the front-page agenda is 0.63.
Over the course of an average week, the front-page agenda is much more constricted, focusing
on a narrower set of topics than get covered over a period of months. Unfortunately, due to its
sample size, we cannot disaggregate the full-paper data into gradations finer than the quarter for
comparison.
Wolfe, Boydstun, and Baumgartner 16
Friction Next, we compare the friction of front-page and full-paper news coverage. Kurtosis has been
employed as a measure of friction in studies on institutional costs for policymaking (Jones,
Sulkin and Larsen 2003; Jones and Baumgartner 2005), budgeting (Jones and Breunig 2007) and
representation (Jones, Larsen-Price and Wilkerson 2009). Kurtosis is the fourth in moments
used to summarize distributions, the first three being mean, variance and skew. Kurtosis
characterizes the general shape of a distribution in terms of peakedness or flatness. Distributions
with high kurtosis (“leptokurtosis”) have high central peaks and fat tails compared to a normal or
Gaussian distribution (e.g., a “bell curve”). In contrast, low kurtosis (“platykurtosis”) indicates
relatively flat distributions. In the case of a study of agenda friction, the distribution we examine
is that of change over time, with observations similar at timet to what they were at timet-1 falling
at the center (the peak) of the distribution, moderate changes falling in the “shoulders” of the
distribution, and large changes appearing in the tails. High kurtosis is an indicator of friction—a
tendency for tomorrow’s attention to be the same as today’s (hence with a high central peak
associated with no change), interrupted by occasional “alarmed discovery” of new topics
urgently demanding much more attention (hence the fat tails). Smooth adjustments, on the other
hand, would be reflected with a Normal distribution (see Jones and Baumgartner 2005 for more
discussion).
We measure friction by calculating the l-kurtosis of quarterly front-page and full-paper
agendas (see Figure 6 below). Kurtosis becomes problematic in practice due to its sensitivity to
extreme values (Groneveld 1998; Breunig and Jones 2008). L-kurtosis is a kurtosis measure
based on the fourth L-moment and is preferred because it is less sensitive to extreme values and
more reliable when sample size is relatively small (Hosking 1990). L-kurtosis is bound at 0 and
1. A score of 0.123 indicates a normal distribution while numbers below 0.123 are associated
Wolfe, Boydstun, and Baumgartner 17
with platykurtosis (flatness) and numbers above 0.123 indicate leptokurtosis (peakedness).
Translated into an indicator of friction, higher numbers are associated with more friction and
lower numbers with less friction in news agendas.
(Insert Figure 6 about here)
Front-page and full-paper friction over time is displayed in Figure 6. Similar to scope,
the friction of both agendas contains two distinct time periods, the first from 1998 to the third
quarter of 2000 and the second from the fourth quarter of 2000 to the end of the series. Before
we visit these two periods, it is worth noting that the average friction for both full datasets is
statistically distinct, with front-page friction at 0.390 and full-paper friction at 0.220 with
indistinct variance (see Table 2 for difference in means and variance). The overall friction, then,
for every topic over all time points, is 0.354 and 0.199 for front-page and full-paper coverage
respectively. We expect front-page friction to be higher than that of the full paper because the
barriers to entry are much greater and, indeed, we find exactly this pattern.
Turning to the two time periods, the movement and divergence of friction between the
front-page and full-paper agendas mirrors that of their scope. While the average friction for both
agendas is distinct in the first time period, 0.349 and 0.261 for the front page and full paper
respectively, their difference is relatively small at 0.088. During this period the barriers for entry
are higher on the front page, but not markedly so. However, the barrier to entry on the front page
in the second time period is much greater, 0.417 compared to 0.206 of the full paper—a
difference of 0.211. And again, notice that it is primarily the front page that diverges from the
full paper, which does not change as much over time. When major events strike, the front page
is most directly affected, as these events start to consume the limited space on this agenda. The
full paper is better equipped to absorb coverage about major events into its larger agenda and, as

Wolfe, Boydstun, and Baumgartner 18
we have seen, by nature the full paper is less prone than the front page to covering high-salience
events.
The first punctuation in front-page friction occurs during the last few months preceding
the 2000 presidential election when friction grew 18%, while full-paper friction declined by 3%.
Subsequent spikes in front-page friction correspond with the September 11, 2001 attacks,
financial scandals, the war in Iraq and one more presidential election. Again, these findings are
consistent with our understanding of the event-driven dynamics of front-page news. While both
agendas are event-driven by nature, the higher intensity of salient events from the 2000 elections
and onward increases front-page friction even more. Resembling the relationship between front-
page and full-paper scopes, punctuations in front-page friction that arise with an increase in
friction correspond with a decrease in full-paper friction, as if the heightened barriers of issue
entry on the first page are compensated by a more open full-paper agenda. To be sure, once they
break onto the front-page, issues do not disappear on the full-paper agenda, but the periodic
concentration of the front page allows for the emergence of additional issues in the full paper.
Conclusions Our task has been to compare the front-page and full-paper agendas of the New York Times, both
for the theoretical purpose of advancing our understanding of how agenda-setting operates and
for the practical purpose of identifying good guidelines for selecting the media agenda most
appropriate to a given research question. Toward these aims, we have examined the Policy
Agendas Project front-page and full-paper sampled datasets, along with Boydstun’s full census
of front-page stories, slicing each dataset in several ways.
We began by comparing both front-page datasets to ensure an “apples to apples”
comparison—that is, to confirm that the Policy Agendas Topics coding scheme had been applied

Wolfe, Boydstun, and Baumgartner 19
consistently in both datasets; it had. Turning then to comparisons between the Policy Agendas
full-paper data and Boydstun’s front-page data, we documented several differences between the
main topics that dominate each agenda. While front-page attention is devoted primarily to issues
of war, diplomacy, and elections, the full paper gives much more attention to business news,
sports, arts, and entertainment. And we observed that between the “high politics” world of the
front page and the “non politics” world inside the fold exists a realm of “low politics” issues that
don’t get picked up with frequency by either agenda. Turning to more sophisticated
comparisons, we used entropy values to examine the relative scope of each agenda and found
that, as anticipated, the front page exhibits a much narrower scope when observed at smaller
intervals of time than when aggregated across longer periods. Yet at the quarterly level, the
scopes of the front-page and full-paper agendas look remarkably similar, at least when the front
page isn’t consumed by major events, such as the 2000 elections or 9/11, at which points the
front page narrows considerably by comparison. Finally, we employed l-kurtosis values to
examine the relative friction on each agenda. We found much higher levels of friction on the
front page, consistent with our expectation that the front page, with its much smaller agenda
space, has an even more difficult time than the full paper in churning through issues
incrementally and, thus, displays both a stronger status-quo bias and a much higher volatility.
And as the breadth of scope of the front page has narrowed since 2000, friction on the front page
has increased.
What do all these findings tell us? In a nutshell, that these two versions of the media
agenda behave very differently, and that the same researcher would likely draw different
conclusions about the media agenda depending on whether she studied the full paper or the front
page. Most researchers have a basic awareness of the distinction between the “hot topics” of the
Wolfe, Boydstun, and Baumgartner 20
front page and the fuller treatment given to non-policy news inside the fold. Yet differences in
the scope and friction of these agendas are more difficult to discern without an explicit study as
we have presented here, and the implications of these differences are every bit as meaningful.
By documenting the tendency of the front page to exhibit less entropy (i.e., narrower scope), we
have put an empirical value on the scarcity of front-page attention relative to the full paper. The
front page doesn’t just cover different types of topics than the full paper; it generally covers far
fewer topics too. And our finding of higher levels of friction on the front page tells us we must
pay careful attention to dynamics when selecting and interpreting a media agenda.
In short, the differences in barriers to entry revealed by our study hold particular
implications for the researcher. The event-driven dynamics of the front page lend to focusing on
certain topics—Defense and national security, elections, and government operations, for
example—at certain points in the policymaking process. The full paper lends to studying the
dynamics of issues throughout their lifespan and at varying levels of salience. Full-paper
agendas are able to capture high, medium and low salience issues and can follow policies from
their subsystems to their breakout on the macropolitical arena. Put simply, the issues under
study and their temporal dynamics should dictate whether the researcher employs a front-page or
full-paper sample of media coverage. As the examples of Defense, Business, and Capital
Punishment illustrated, the conclusions we draw about media attention depend critically on
which agenda we measure in the first place.
With all these points in mind, we can make some practical assessments about the relative
merits of the front-page and full-paper agendas. For the purposes of data collection, gathering a
full census of front-page stories (not just of the Times, but of any newspaper) is entirely more
feasible than collecting a full population of stories from the paper as a whole. Additionally, the
Wolfe, Boydstun, and Baumgartner 21
differences in levels of salience between the front page and the full paper is exactly what makes
the front page an attractive agenda for many researchers; if you’re going to study media signals,
one might say, why not go directly to the source of the hot topics at the very top of the agenda?
At the same time, the full-paper agenda might be a more attractive data source for researchers for
exactly this reason. Since the front-page agenda only has room for the most pressing problems
of the day, most specific issues need to be tracked in the context of the full paper in order to
provide frequency levels that can support any kind of statistical analysis. More to the point,
because the full paper presents a lower barrier to entry for issues, researchers interested in any
subsystem issue not linked to a war, election, or scandal will likely need to look inside the fold to
find pertinent coverage. Yet again, data collection is a real problem here. With so many full-
paper stories, the sample size needs to be massive in order to be representative across policy
topics. As we saw with the Policy Agendas Project full-paper data, even a sample size of 1,000
stories per year is only big enough to support analysis at the quarterly level. And since even
quarterly-level analysis is a theoretical stretch given the much faster pace of the media agenda, a
sample size greater than 1,000 full-paper stories per year would be much better.
We believe that the answer to this data collection conundrum may be found in the form of
automated content analysis. Using one of several different algorithms designed to categorize a
non-coded “virgin” text based on existing categorizations of coded “reference” seed texts,
automated text analysis allows a researcher to collect and code a substantially larger set of stories
than she would be able to do by hand. There are drawbacks to automated content analysis of
course, including the considerable start-up time needed to test an applicable algorithm and
perfect the technique for training the algorithm with seed data in order to maximize the accuracy
of its predictions for virgin texts, not to mention the risk of lower coding accuracy that can
Wolfe, Boydstun, and Baumgartner 22
sometimes result despite the best-laid techniques. Yet in our experience, automated text analysis
is a viable and cost-effective solution for collecting and coding large collections of news stories.
And when the task is categorizing texts into basic topic and specific issue categories (e.g., the 4-
digit codes of the Policy Agendas codebook), our experience reveals that computer coding yields
a high level of accuracy, comparable to undergraduate coders.
However, the use of automated content analysis in no way mitigates the important
differences between front-page and full-paper attention. And so any data collection effort—
especially a large-scale effort supported by computer coding—should be based on a careful
consideration of the theoretical and practical distinctions between these agendas. Might the best
use of time and resources be to collect all front-page stories much farther back in time (the New
York Times Historical Archive is available back to 1851 for example!) or to devise a way to draw
a much larger sample of full-paper stories than collected in the original Policy Agendas Project
dataset, somehow estimating a total population size in the electronic database? Good question.
Wolfe, Boydstun, and Baumgartner 23
Table 1. Distribution of New York Times Stories Across Topics by Data Source, 1998–2005. Code Topic Full Paper
(PAP) Front Page
(PAP) Front Page
(AEB) 1 Macroeconomics 2.1% 5.2% 2.6% 2 Civil Rights 1.6% 2.6% 2.7% 3 Health 4.0% 4.5% 5.9% 4 Agriculture 0.6% 0.6% 0.5% 5 Labor, Immigration, and Employment 1.5% 1.6% 2.0% 6 Education 1.8% 1.9% 2.9% 7 Environment 1.4% 1.0% 1.1% 8 Energy 1.0% 1.0% 1.0% 10 Transportation 1.5% 0.3% 1.5% 12 Law, Crime, and Family Issues 6.3% 7.1% 5.7% 13 Social Welfare 0.5% 0.6% 0.7% 14 Community Development and Housing 1.7% 2.3% 1.3% 15 Banking, Finance, and Domestic Commerce 17.8% 5.5% 5.3% 16 Defense 4.1% 16.8% 13.3% 17 Space, Science, Technology, and Communications 3.5% 1.6% 2.7% 18 Foreign Trade 3.6% 1.9% 0.8% 19 International Affairs 12.1% 22.7% 23.0% 20 Federal Government Operations 4.3% 10.7% 12.3% 21 Public Lands and Water Management 0.8% 0.6% 0.8% 24 State and Local Government 3.9% 3.9% 2.3% 26 Weather and Natural Disasters 0.2% 0.0% 1.3% 27 Fires 0.1% 0.0% 0.5% 28 Arts and Entertainment 9.3% 0.6% 2.5% 29 Sports and Recreation 6.0% 1.6% 4.4% 30 Death Notices 1.4% 0.6% 0.6% 31 Churches and Religion 1.0% 1.6% 1.6% 99 Other, Miscellaneous, and Human Interest 7.8% 2.9% 0.7% TOTAL 100.0% 100.0% 100.0% N 7,891 309 22,507
Wolfe, Boydstun, and Baumgartner 24
Table 2. Differences in Mean and Variance for Scope and Friction of Front-Page and Full-Paper Agendas.
Full Series, 1998-2005 Mean Statistic p-value SD Statistic p-value
Entropy, Front-Page 0.770 0.07
Entropy, Full-Paper 0.830 0.03
L-Kurtosis, Front-Page 0.390 0.09
L-Kurtosis, Full-Paper 0.220 0.08
Partial Series, 1998-2000Q3
Entropy, Front-Page 0.806 0.03
Entropy, Full-Paper 0.816 0.03
L-Kurtosis, Front-Page 0.349 0.06
L-Kurtosis, Full-Paper 0.261 0.06
Partial Series, 2000Q4-2005Q4
Entropy, Front-Page 0.748 0.07
Entropy, Full-Paper 0.831 0.02
L-Kurtosis, Front-Page 0.417 0.1
L-Kurtosis, Full-Paper 0.206 0.09
T-test used to calculate difference in means
Coefficient of Variation (F-test) used for difference in variation
-4.86 0.000 9.96 0.000
7.36 0.000 1.40 0.463
0.765
0.713
-4.46 0.000
7.73 0.000
6.43 0.000
1.39 0.360
-0.74
3.46
0.470
0.003
0.82
1.27

Wolfe, Boydstun, and Baumgartner 25
Figure 1. Percentage of New York Times Agenda Space by Topic, Front Page v. Full-Paper, 1998–2005.
Note: Data are the same as presented in Table 1. The top three topics—International Affairs, Defense, and Government Operations—are significantly more prominent on the front page than on the inside pages, with differences of over 8 percent; no other issue domain is more than 1.9 percent over-represented on the front page. At the bottom, Foreign Trade, Arts, Human Interest, and Domestic Commerce stories show much more attention in the paper overall than on the front page. Data are based on 22,507 front-page stories collected by Boydstun and a sample of 7,891 stories drawn from all pages of the New York Times Index, 1998 to 2005.
0% 5% 10% 15% 20% 25%
International Affairs Defense
Federal Government Operations Health
Civil Rights Weather & Natural Disasters
Education Churches & Religion
Macroeconomics Labor, Immigration, & Employment
Fires Social Welfare
Public Lands & Water Management Transportation
Energy Agriculture
Environment Community Development & Housing
Law, Crime, & Family Issues Death Notices
Space, Science, Tech, & Communications State and Local Government
Sports & Recreation Foreign Trade
Arts & Entertainment Other, Miscellaneous, & Human Interest
Banking, Finance, & Domestic Commerce
Front Page
Full Paper

Wolfe, Boydstun, and Baumgartner 26
Figure 2. Percentage of New York Times Agenda Space Devoted to Defense, Front Page v. Full Paper by Quarter, 1998–2005.
0%
2%
4%
6%
8%
10%
12%
14%
0%
5%
10%
15%
20%
25%
30%
35%
1998q1 1999q1 2000q1 2001q1 2002q1 2003q1 2004q1 2005q1
Fu
ll Pa
per F
ron
t P
ag
e
Front Page
Full Paper
Wolfe, Boydstun, and Baumgartner 27
Figure 3. Percentage of Front-Page and Full-Paper Agenda Space Devoted to Banking, Business, and Domestic Commerce, 1998–2005 by Quarter.
0%
5%
10%
15%
20%
25%
30%
35%
0%
2%
4%
6%
8%
10%
12%
14%
1998q1 1999q1 2000q1 2001q1 2002q1 2003q1 2004q1 2005q1
Fu
ll Pa
per F
ron
t P
ag
e
Front Page
Full Paper

Wolfe, Boydstun, and Baumgartner 28
Figure 4. Number of New York Times Stories Devoted to Capital Punishment, Front Page v. Full Paper by Year, 1960–2005.
0
50
100
150
200
250
300
0
2
4
6
8
10
12
14
16
18
20
1960 1965 1970 1975 1980 1985 1990 1995 2000 2005
Fu
ll Pa
per
Fro
nt
Pa
ge
Front Page
Full Paper
Wolfe, Boydstun, and Baumgartner 29
Figure 5. Scope of New York Times Agenda Across Topics as Measured by Entropy Values, Front Page v. Full Paper by Quarter, 1998–2005.
0.55
0.6
0.65
0.7
0.75
0.8
0.85
0.9
1998q1 1999q1 2000q1 2001q1 2002q1 2003q1 2004q1 2005q1
En
tro
py
Sco
re
Front Page
Full Paper

Wolfe, Boydstun, and Baumgartner 30
Figure 6. Friction of New York Times Agenda as Measured by L-Kurtosis Values, Front Page v. Full Paper by Quarter, 1998–2005.
0.0
0.1
0.2
0.3
0.4
0.5
0.6
0.7
1998q1 1999q1 2000q1 2001q1 2002q1 2003q1 2004q1 2005q1
L-K
urto
sis
S
co
re
Front Page
Full Paper
Overall (Full Dataset) L-Kurtosis
Front Page (AEB) = 0.354
Full Paper (PAP) = 0.199

Wolfe, Boydstun, and Baumgartner 31
Equation 1. Shannon’s H Information Entropy.
where: is a topic
is the proportion of the agenda given to a topic is the number of topics or categories
Entropy = − p(xi )∑ logk p(xi )
Wolfe, Boydstun, and Baumgartner 32
References Baumgartner, Frank R., Suzanna L. De Boef, and Amber E. Boydstun. 2008. The Decline of the
Death Penalty and the Discovery of Innocence. New York: Cambridge University Press.
Baumgartner, Frank R., and Bryan D. Jones. 2009. Agendas and Instability in American
Politics, 2nd ed. Chicago: University of Chicago Press.
Baumgartner, Frank R. and Bryan D. Jones. 1993. Agendas and Instability in American
Politics. Chicago, IL: The University of Chicago Press.
Baumgartner, Frank R., Bryan D. Jones, and Michael C. MacLeod. 2000. The Evolution of
Legislative Jurisdictions. Journal of Politics 62(2): 321-49.
Bevan, Shaun. 2008. Effects on the Scope of Agendas: The Reasons Why the Dog Did Not
Bark. Working Paper.
Boydstun, Amber E. 2008. Measuring the Scope of Political Communication. Paper presented
at the Visions in Methodology Conference, October 2-4, in Columbus, OH.
Boydstun, Amber E. 2008. How Policy Issues Become Front-Page News. PhD diss., The
Pennsylvania State University, University Park.
Chaffee, Steven H. and Donna G. Wilson. 1977. Media Rich, Media Poor: Two Studies of
Diversity in Agenda-Holding. Journalism Quarterly 54(3): 466-476
Groneveld, Richard A. 1998. A Class of Quintile Measures for Kurtosis. American Statistician
51: 325-29.
Hosking, Jonathan R. M. 1998. L-moments. In Encyclopedia of statistical sciences, update vol.
2, ed. S. Kotz, C. Read and D. L. Banks. New York: Wiley. 357-362.
Jones, Bryan D. and Frank R. Baumgartner. 2005. The Politics of Attention: How Government
Prioritizes Problems. Chicago, IL: University of Chicago Press.

Wolfe, Boydstun, and Baumgartner 33
Jones, Bryan D., Tracy Sulkin and Heather Larsen. 2003. Policy Punctuations in American
Political Institutions. American Political Science Review 97: 151-70.
Jones, Bryan D. and Christian Breunig. 2007. Noah and Joseph Effects in Government Budgets:
Analyzing Long-Term Memory. Policy Studies Journal 35: 329-348.
Jones, Bryan D., Heather Larsen-Price, and John D. Wilkerson. 2009. “Representation and
American Governing Institutions.” Journal of Politics 71(1): 277-290.
Lasorsa, Dominic L. 1991. Effects of Newspaper Competition on Public Opinion Diversity.
Journalism Quarterly 68(1): 38-47.
Shannon, Claude. 1948. A Mathematical Theory of Communication. Bell Systems Technical
Journal, 27: 379-423, 623-656.
Shannon, Claude E. 1950. "Prediction and Entropy of Printed English." The Bell System
Technical Journal 30: 50-64.
Shannon, Claude E. and Warren Weaver. 1949. The Mathematical Theory of Communications.
Urbana, IL: University of Illinois Press.
Sheingate, Adam D. 2006. Structure and Opportunity: Committee Jurisdiction and Issue
Attention in Congress. American Journal of Political Science 50 (4): 844-859.
Wolfe, Michelle. 2008. Public Opinion Signaling and Signal Strength: Issue Priority, Issue
Salience and Information Environments. Working Paper.