Embed Size (px)
Citation preview
Comparing population displacement estimates from mobile network data
and other sources
Working paper: evidence from
the Highlands earthquake in Papua New Guinea
Pamungkas Prahara, Annissa Zahara, Muhammad Rheza,
Muhammad Rizal Khaefi, Dikara Alkarisya, Yulistina Riyadi,
Rajius Idzalika, George Hodge
Background paper to the main report
2
Comparing Population Displacement Estimates from Mobile Network Data and Other Sources Working Paper: Evidence from the Highlands Earthquake in Papua New Guinea
Pamungkas Prahara, Annissa Zahara, Muhammad Rheza, Muhammad Rizal Khaefi, Dikara Alkarisya, Yulistina Riyadi, Rajius Idzalika, George Hodge - Pulse Lab Jakarta
Abstract
Accurate and timely measurement of population displacement due to natural hazards and other drivers of displacement has proven to be complicated. This research paper explores anonymous mobile network data as a source of insights on displacement and compares the findings to the current good practice for displacement tracking, namely IOM’s displacement tracking matrix. We also compare the insights against information on the targeting of humanitarian resources, finding that the targeting of surveys and the allocation of humanitarian assistance are respectably efficient. The findings offer new perspectives on the quantification of displacement and underline the potential of mobile network data to offer highly valuable information during what are often chaotic days and weeks following a natural disaster.
3
Introduction
Papua New Guinea (PNG) experienced an earthquake of magnitude 7.5 on the Richter scale during the early hours of Monday, 26th February 2018, as well as significant aftershocks in the days and weeks that followed. The worst affected areas were identified as Hela and Southern Highlands provinces,1 and as of 1st March a State of Emergency was declared in the provinces of Enga, Hela, Southern Highlands and Western to expedite the restoration of essential public services.2 A few days later, aerial assessments provided evidence of significant damage and large landslides, based on which the UN Office for the Coordination for Humanitarian Affairs (OCHA) estimated that up to 465,000 people may have been affected by the disaster, and that 247,000 people were likely to require immediate humanitarian assistance.3 Estimates of the affected population grew to 544,000 people in late March, based on figures released by the National Disaster Centre,4 and as of late May, a combined assessment by the Government and the UN estimated that 11,761 households (approximately 58,300 people) remained displaced, of which 1,672 households are staying in eleven care centres while 10,089 households are staying with host communities.5 Due to its geographical location, on the Pacific Ring of Fire, Papua New Guinea is familiar with natural disasters. The country accounts for 25 percent of disaster events in the Pacific between 1950 and 2008.6 According to the Global Facility for Disaster Reduction and Recovery, the country has a high level of exposure to floods, earthquakes, landslides and tsunamis, as well as cyclones, volcanoes and wildfires.7 Furthermore, Papua New Guinea is ranked within the top six countries in Asia-Pacific as having the highest percentage of population exposed to earthquakes, and ranked close behind the Philippines, Indonesia, and Vanuatu in having the highest percentage of population exposed to severe risks of volcanic eruption.8 A more recent development can be seen in the growth of the mobile industry. Connectivity at present is delivered through a combination of mobile, satellite, undersea cables and fixed networks, and these technologies will continue to serve as the backbone of communications in the future.9 According to the National Information and Communications Technology Authority, Papua New Guinea has a mobile penetration rate of 54 per cent, with nearly all of these subscribers served by Digicel, which holds 94 per cent market share as of 2016,10 and maintains 95 per cent coverage of populated areas as of 2018.11
1 Reliefweb, 2018. Papua New Guinea – Earthquake Update. (GDACS, USGS, Copernicus EMS, Media) (ECHO Daily Flash of 27 February 2018), https://bit.ly/2FGbmFR 2 Reliefweb, 2018. State of Emergency declared in Highlands Earthquake Disaster area, K450 million provided for relief and restoration. https://bit.ly/2QPeYY9 3 Reliefweb, 2018. Asia and the Pacific: Weekly Regional Humanitarian Snapshot (27 February - 5 March 2018), https://bit.ly/2VVvidy 4 PNG Disaster Management Team, 2018. Papua New Guinea: Highlands Earthquake Situation Report No. 4, https://bit.ly/2RLaDtF 5 Reliefweb, 2018. Papua New Guinea: Highlands Earthquake Situation Report No. 10 (as of 28 May 2018), https://bit.ly/2MjXKBC 6 UNDP in Papua New Guinea, no year. Disaster Risk Management, https://bit.ly/21xLm1i 7 Global Facility for Disaster Reduction and Recovery, no year. Papua New Guinea, https://bit.ly/2MdtA2V 8 UNDP in Papua New Guinea, no year. Disaster Risk Management, https://bit.ly/21xLm1i 9 GSMA Intelligence, 2015. The Mobile Economy Pacific Islands 2015, https://bit.ly/2CqiCT5 10 National Information and Communications Technology Authority - Papua New Guinea, 2016. Status of Spectrum Management Papua New Guinea, https://bit.ly/2MhI29P 11 Digicel Papua New Guinea, no year. Coverage map, https://bit.ly/2AQJoEl
4
The relative prevalence of this consumer technology across Papua New Guinea, the importance of mobile communications to disaster affected communities, and the market dominance of one mobile network operator means that the data generated by Digicel and associated digital services could provide a variety of insights with value for humanitarian action. Research specifically on displacement as a result of crises, such as natural hazards and violent conflict, has been limited by methodological difficulties in data collection and issues associated with isolating the cause of the population movements.12 The observed tendency for disaster affected individuals and groups to retain their mobile devices during displacement,13 the fact that about half of PNG’s eight million residents14 own mobile phones, and the detail and tractability of the digital exhaust from the network implies that anonymised mobile network data may be used to circumvent some of the methodological problems of earlier research. Several prior studies in other countries and contexts have used mobile network data to understand population flows during crises with success; this paper benefits from their precedents. This research paper explores anonymous mobile network data as a source of insights on displacement following the Highlands earthquake in Papua New Guinea in February 2018. The varying estimates of post-earthquake displacement shared by the Government of PNG and different UN agencies, as well as other stakeholders, invites a more detailed exploration of this alternative data source. The research is conducted as a collaboration between the Government of Papua New Guinea, the United Nations Country Team in Papua New Guinea, Digicel and UN Global Pulse, Jakarta Lab. In particular, the research team has benefitted from the cooperation of the Digicel Shared Value Team, the UN Resident Coordinator’s Office and the International Organisation for Migration (IOM) Office in PNG. The research is in support of other Government-sponsored analysis of the impact of the Highlands earthquake. Our analysis of mobile network data under this research project complies with the GSM Association privacy guidelines for the use of mobile phone data,15 originally developed in response to the Ebola outbreak in West Africa between 2013 and 2016. Specifically, the guidelines dictate that subscriber data be anonymised, that subscriber data not be transferred outside of the mobile network operator’s systems, that all analysis take place on the mobile network operator’s systems and under operator supervision, that no analysis be undertaken that singles out identifiable individuals, and that only the output of the analysis (i.e. the resulting non-sensitive data, aggregate statistics, indicators, etc.) be made available to relevant and approved aid agencies, government or research agencies that can use these inputs in their modelling and planning efforts. The mobile network data used for this research initiative is accessed via a data partnership with Digicel. The rest of the paper is structured as follows: the section on related work highlights existing knowledge on the topics covered by this research paper, the section on data description offers an overview of the data sets used in the research, following which several sections combining methods and findings explore the spatial distribution of mobile network subscribers, the impact of the earthquake on network activity
12 Lu, X., Wrathall, D. J., Sundsøy, P. R., Nadiruzzaman, M., Wetter, E., Iqbal, A., ... & Bengtsson, L., 2016. Unveiling hidden migration and mobility patterns in climate stressed regions: A longitudinal study of six million anonymous mobile phone users in Bangladesh. Global Environmental Change, https://bit.ly/2DfaIxn 13 Yang, C., Yang, J., Luo, X., & Gong, P., 2009. Use of mobile phones in an emergency reporting system for infectious disease surveillance after the Sichuan earthquake in China. Bulletin of the World Health Organization, https://bit.ly/2TTkDOP 14 The World Bank, no year. Papua New Guinea, https://bit.ly/2IplSj4 15 GSMA, 2014. GSMA guidelines on the protection of privacy in the use of mobile phone data for responding to the Ebola outbreak, https://bit.ly/2Ub0Pqb
5
at the tower level, the locations of displacement of anonymous mobile network subscribers, and a comparison of the insights from both mobile network data and surveys, including data on the targeting of humanitarian assistance. Following these sections, the paper comments on some of the limitations of the use of mobile network data in this context, before concluding on the analysis to date and commenting on future directions for the research.
Related Work
Accurate and timely measurement of population displacement due to natural hazards and other drivers of displacement has proven to be complicated. Over twenty-five years of research and attention to the issue of internal displacement, since its first emergence on the global policy agenda in the early 1990s, has resulted in significant advances in the aid community’s understanding of the numbers of displaced persons, their locations, as well as the duration and severity of their displacement, but policy development is still constrained by data gaps. These include gaps in geographic coverage, challenges in distinguishing between types of displacement (new, secondary or tertiary; as well as internal vs. international), and difficulties in collecting/obtaining disaggregated and geospatially referenced data.16 Of particular relevance to this paper, research has consistently found that information on Internally Displaced Persons (IDPs) living in host communities or other dispersed settings is of significantly poorer quality than the data on IDPs who take refuge at official or collective sites.17 The impact of these data gaps on policy development and operational delivery of assistance is significant: a full global picture of the phenomenon remains elusive undermining international engagement in and cooperation to address the drivers of the issue and limiting the effectiveness of mitigating measures. Also, the different needs and vulnerabilities of individuals and families experiencing different types of displacement remain hidden resulting in sub-optimally designed assistance.18 It is within this context that the potential of alternative data sources on population displacement invites further exploration, to which the academic community has responded over the past decade. A cogent summary of the potential of mobile network data as a tool of social research to inform public policy is provided by UN Global Pulse19 and well as Sundsøy.20 Once anonymized and aggregated to appropriate levels, mobile network data can provide a variety of insights with tremendous value for development and humanitarian action, including on human mobility, social interaction and economic activity. These insights are also relevant to fields as diverse as urban planning and epidemiology. The human mobility signatures contained within anonymised mobile network data are the underlying theme of this research paper. Before reviewing the literature on modelling and analysis of mobile network data from this perspective, it is important to explore the value of the data set as a tool for sensing in general. To this end, in previous research,21 the authors of this paper applied multifractal
16 Internal Displacement Monitoring Centre, 2018. Global Report on Internal Displacement 2018, https://bit.ly/2Iqyvuz 17 Internal Displacement Monitoring Centre, 2018. Methodological Annex to the Global Report on Internal Displacement 2018, https://bit.ly/2Iqyvuz 18 Internal Displacement Monitoring Centre, 2018. Global Report on Internal Displacement 2018, https://bit.ly/2Iqyvuz 19 United Nations Global Pulse, 2013. Mobile Network Data for Development, https://bit.ly/2QUNSyI 20 Sundsøy, P., 2017. Measuring patterns of human behaviour through large-scale mobile phone data-Big Data for social sciences, https://bit.ly/2FFOxCn 21 United Nations Global Pulse, 2019, Strengthening Humanitarian Action with Insights from Mobile Network Data, https://bit.ly/2ReIQNE
6
analysis to mobile network traffic signals from six cell towers in Vanuatu to understand whether regular high-level patterns of usage exist over the short and medium term, finding, as expected, that the data set is not random, confirming its value as a general source of indicators and insights on outliers, of use for real-time sensing. Specific to a natural hazard, Kapoor et al.22 explore anomalies in mobile network data linked to the February 2008 earthquake in the Lac Kivu region of the Democratic Republic of the Congo, finding that the seismic event can be detected based on analysis of the mobile network data alone, that the distribution of anomalies in the mobile network data at cell tower level can be used to infer the location of the earthquake epicentre at a respectable degree of accuracy, that region-specific persistence of anomalous activity over time is an indication of the need for assistance, and, linked to the previous finding, that the data set can be used to target further assessments as part of relief efforts. In terms on understanding human mobility using mobile network data, the definition of what constitutes a meaningful location is important. Blumenstock et al.,23 cogently summarise the limitations of traditional empirical methods used to measure and evaluate migration and also how arbitrary the definition of migration can be when looking at human mobility signatures. When inferring migration from mobile network data, Blumenstock and colleagues define a migration as occurring at month m if the individual remained in one location for a fixed number of β months prior to m, and was also stationary for β months after and including m, but that the locations pre- and post-m were different, assuming that the distance between the two locations is greater than the subscriber’s area of influence (for which they use radius of gyration). Specific to Rwanda they find that when a migration is defined as a minimum stay of two months, the migration rate is over seven times higher than when a migration is defined as a minimum stay of 12 months. This is relevant when examining internal displacement at the timescale of months and years, but this research paper operates at the timescale of days and weeks, thus reference to studies of commuting patterns is instructive. Zagatti et al.24 use a lower-resolution grid-based data mining approach to identify important locations to a subscriber, using the centroid of a subscriber’s mobile network interactions over a certain time period to identify the relevant grid-cell of a meaningful location. This contrasts to higher-resolution approaches using the most frequent cell tower to infer location, which can suffer from error when using a short time frame of data, especially in urban settings due to the high density of cell towers and to fluctuations in coverage between cell towers. Relevant to identifying displacement, Song et al.25 measure the entropy of a mobile network subscriber’s trajectory for insights into the predictability of human mobility, finding a remarkable lack of variability in predictability despite significant differences in travel patterns and the distances covered by subscribers. The finding that our daily mobility is characterized by a deep-rooted regularity is important as it suggests that using the entropy of a
22 Kapoor, A., Eagle, N., & Horvitz, E. (2010, March). People, Quakes, and Communications: Inferences from Call Dynamics about a Seismic Event and its Influences on a Population. In AAAI spring symposium: artificial intelligence for development, https://bit.ly/2DgiKGA 23 Blumenstock, J. E., 2012, Inferring patterns of internal migration from mobile phone call records: evidence from Rwanda. Information Technology for Development, https://bit.ly/2Bb0Pj2 24 Zagatti, G. A., Gonzalez, M., Avner, P., Lozano-Gracia, N., Brooks, C. J., Albert, M., ... & Tatem, A. J., 2018, A trip to work: Estimation of origin and destination of commuting patterns in the main metropolitan regions of Haiti using CDR. Development Engineering, https://bit.ly/2CsaP77 25 Song, C., Qu, Z., Blumm, N., & Barabási, A. L., 2010, Limits of predictability in human mobility. Science, https://bit.ly/2QRIfkY
7
subscriber’s trajectory before and after a natural hazard could be a useful way to identify cohorts of the population experiencing forced displacement. Studies of migration and commuting using mobile network data have also examined human mobility insights through the lens of socio-economic status. The work of Frias-Martinez et al.26 found that wealthier populations are strongly associated with larger mobility ranges when compared to poorer populations, although other measures of mobility such as distance travelled in total as well as during or between phone calls has no relationship with socio-economic status. The work of Xu et al.27 added more nuance to the findings of Frias-Martinez et al., suggesting that the link between human mobility and socio-economic status is context specific. Xu and colleagues found that phone subscriber groups that are broadly of higher socio-economic status tend to travel shorter in Singapore but longer in Boston, hypothesising that the difference is due to the fact that rich neighbourhoods in the two cities are respectively central and peripheral. Fernando et al.28 report similar insights based on mobile network data analysis in Sri Lanka, finding that subscribers from wealthier regions in Western Province tend to travel further than subscribers from poorer regions, while the inverse is the case when considering subscribers resident in Northern Province. Moving on to the topic of human mobility in the context of a natural disaster, Bengtsson et al.29 developed an approach for the near real-time tracking of population movements connected to the Haiti earthquake in January 2010. The research assumes that the ratio of mobile phone subscribers to the general population can be used to generalise the mobility insights from mobile network data. But the authors recognise that if underrepresented groups, such as children, the elderly, the poorest, and women have substantially different movement patterns to groups with high mobile phone use the results would be biased. Later work by Wesolowski et al.30 in the context of migration and commuting confirms that the use of mobile network data alone tends to overestimate the mobility of populations, but also finds that the estimates can mitigate for the coverage bias via combination with survey data on socioeconomic status, mobile phone ownership, and usage patterns. Concerning the predictability of population displacement, Lu et al.31 share interesting insights from the Haiti earthquake, in particular the observations that the predictability of people’s movements remained high and even increased slightly during the three-month period after the earthquake. They also found that the destinations of internally displaced people who left the capital after the earthquake were highly correlated with their movements during normal times, and specifically with the locations in which people had significant social bonds. The authors conclude that it may be possible to use the population
26 Frias-Martinez, V., Virseda, J., & Frias-Martinez, E., 2010, Socio-economic levels and human mobility, In Qual meets quant workshop-QMQ, https://bit.ly/2FyNsN8 27 Xu, Y., Belyi, A., Bojic, I., & Ratti, C., 2018. Human mobility and socioeconomic status: Analysis of Singapore and Boston. Computers, Environment and Urban Systems, https://bit.ly/2ARFv1G 28 Fernando, L., Surendra, A., Lokanathan, S., Gomez, T., 2018, Predicting population-level socio-economic characteristics using Call Detail Records (CDRs) in Sri Lanka. DSMM'18 Proceedings of the Fourth International Workshop on Data Science for Macro-Modeling with Financial and Economic Datasets, https://bit.ly/2FYMPfi 29 Bengtsson, L., Lu, X., Thorson, A., Garfield, R., & Von Schreeb, J., 2011, Improved response to disasters and outbreaks by tracking population movements with mobile phone network data: a post-earthquake geospatial study in Haiti. PLoS medicine, https://bit.ly/2TTG1DB 30 Wesolowski, A., Eagle, N., Noor, A. M., Snow, R. W., & Buckee, C. O., 2013, The impact of biases in mobile phone ownership on estimates of human mobility. Journal of the Royal Society Interface, https://bit.ly/2sy06ni 31 Lu, X., Bengtsson, L., & Holme, P., 2012,. Predictability of population displacement after the 2010 Haiti earthquake. Proceedings of the National Academy of Sciences, https://bit.ly/2FxN4hV
8
distribution during the holidays as a way to estimate the distribution of displacement during and after a disaster, but due to the use of only one case study, this conclusion needs to be confirmed by multi-country and event comparisons. Building on the work in Haiti, Wilson et al.32 take a significant step for the humanitarian sector in developing near real-time displacement insights linked to the 2015 Nepal Earthquake which they were able to share with stakeholders to inform humanitarian operations. To date, we are not aware of research that compares post-disaster displacement insights from mobile network data and other sources, such as enumerator observation and surveys; we draw on many of the precedents and insights described above as we explore these data sources over the following sections.
Data Description
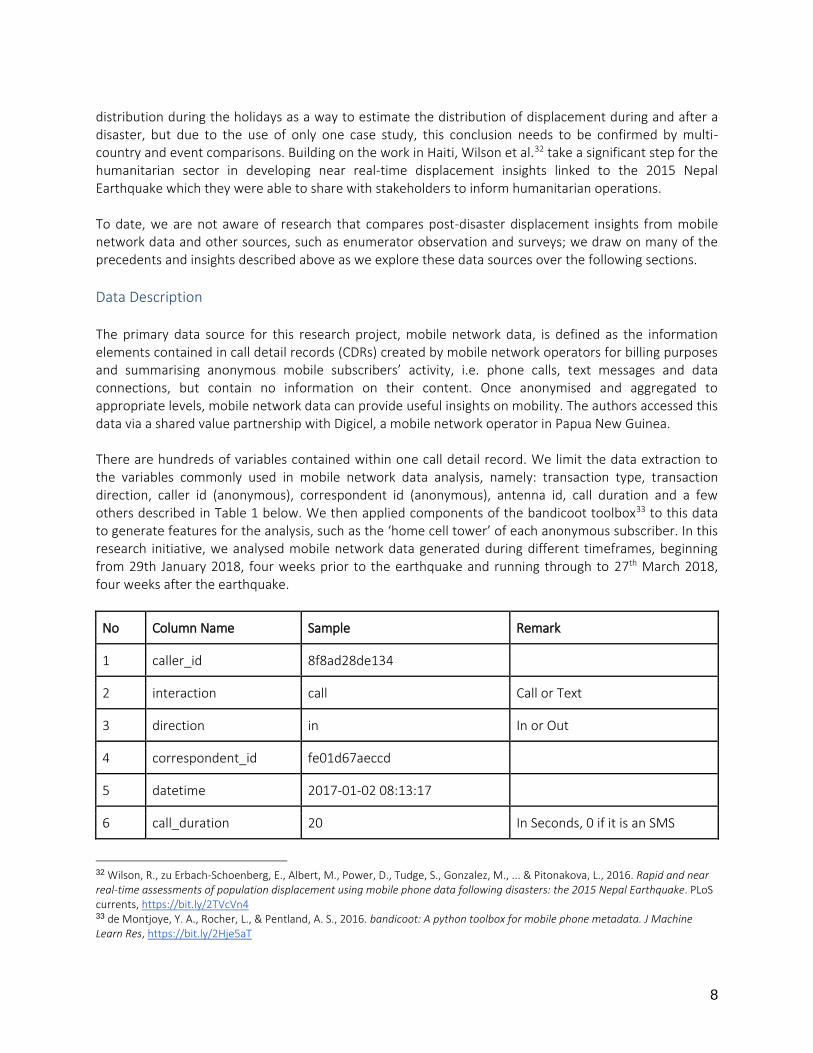
The primary data source for this research project, mobile network data, is defined as the information elements contained in call detail records (CDRs) created by mobile network operators for billing purposes and summarising anonymous mobile subscribers’ activity, i.e. phone calls, text messages and data connections, but contain no information on their content. Once anonymised and aggregated to appropriate levels, mobile network data can provide useful insights on mobility. The authors accessed this data via a shared value partnership with Digicel, a mobile network operator in Papua New Guinea. There are hundreds of variables contained within one call detail record. We limit the data extraction to the variables commonly used in mobile network data analysis, namely: transaction type, transaction direction, caller id (anonymous), correspondent id (anonymous), antenna id, call duration and a few others described in Table 1 below. We then applied components of the bandicoot toolbox33 to this data to generate features for the analysis, such as the ‘home cell tower’ of each anonymous subscriber. In this research initiative, we analysed mobile network data generated during different timeframes, beginning from 29th January 2018, four weeks prior to the earthquake and running through to 27th March 2018, four weeks after the earthquake.
No Column Name Sample Remark
1 caller_id 8f8ad28de134
2 interaction call Call or Text
3 direction in In or Out
4 correspondent_id fe01d67aeccd
5 datetime 2017-01-02 08:13:17
6 call_duration 20 In Seconds, 0 if it is an SMS
32 Wilson, R., zu Erbach-Schoenberg, E., Albert, M., Power, D., Tudge, S., Gonzalez, M., ... & Pitonakova, L., 2016. Rapid and near real-time assessments of population displacement using mobile phone data following disasters: the 2015 Nepal Earthquake. PLoS currents, https://bit.ly/2TVcVn4 33 de Montjoye, Y. A., Rocher, L., & Pentland, A. S., 2016. bandicoot: A python toolbox for mobile phone metadata. J Machine Learn Res, https://bit.ly/2Hje5aT
9
7 antenna_id 10030 antenna ID
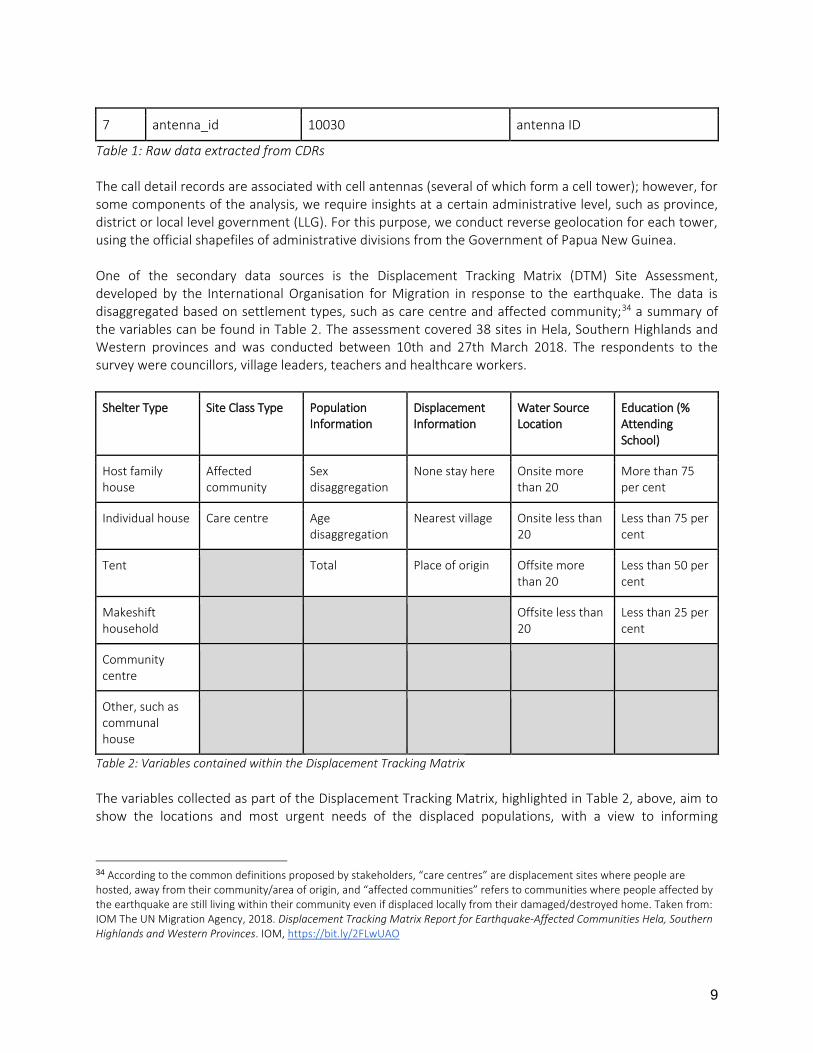
Table 1: Raw data extracted from CDRs The call detail records are associated with cell antennas (several of which form a cell tower); however, for some components of the analysis, we require insights at a certain administrative level, such as province, district or local level government (LLG). For this purpose, we conduct reverse geolocation for each tower, using the official shapefiles of administrative divisions from the Government of Papua New Guinea. One of the secondary data sources is the Displacement Tracking Matrix (DTM) Site Assessment, developed by the International Organisation for Migration in response to the earthquake. The data is disaggregated based on settlement types, such as care centre and affected community;34 a summary of the variables can be found in Table 2. The assessment covered 38 sites in Hela, Southern Highlands and Western provinces and was conducted between 10th and 27th March 2018. The respondents to the survey were councillors, village leaders, teachers and healthcare workers.
Shelter Type Site Class Type Population Information
Displacement Information
Water Source Location
Education (% Attending School)
Host family house
Affected community
Sex disaggregation
None stay here Onsite more than 20
More than 75 per cent
Individual house Care centre Age disaggregation
Nearest village Onsite less than 20
Less than 75 per cent
Tent Total Place of origin Offsite more than 20
Less than 50 per cent
Makeshift household
Offsite less than 20
Less than 25 per cent
Community centre
Other, such as communal house
Table 2: Variables contained within the Displacement Tracking Matrix
The variables collected as part of the Displacement Tracking Matrix, highlighted in Table 2, above, aim to show the locations and most urgent needs of the displaced populations, with a view to informing
34 According to the common definitions proposed by stakeholders, “care centres” are displacement sites where people are hosted, away from their community/area of origin, and “affected communities” refers to communities where people affected by the earthquake are still living within their community even if displaced locally from their damaged/destroyed home. Taken from: IOM The UN Migration Agency, 2018. Displacement Tracking Matrix Report for Earthquake-Affected Communities Hela, Southern Highlands and Western Provinces. IOM, https://bit.ly/2FLwUAO
10
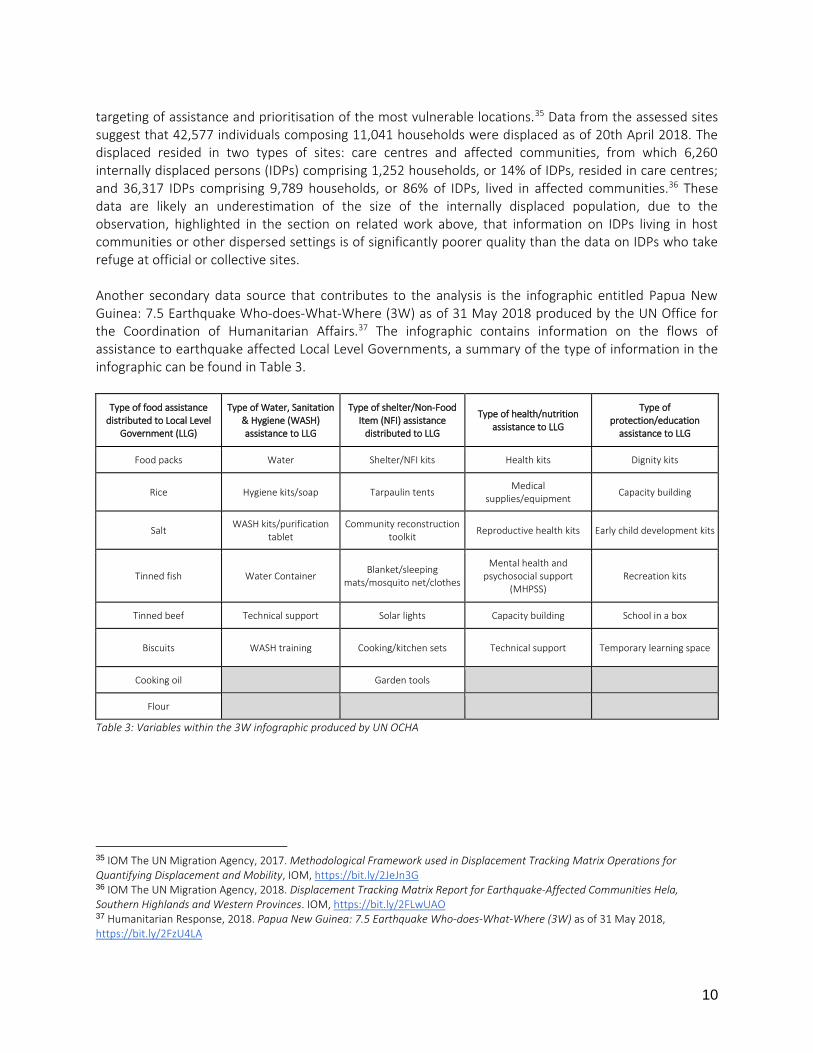
targeting of assistance and prioritisation of the most vulnerable locations.35 Data from the assessed sites suggest that 42,577 individuals composing 11,041 households were displaced as of 20th April 2018. The displaced resided in two types of sites: care centres and affected communities, from which 6,260 internally displaced persons (IDPs) comprising 1,252 households, or 14% of IDPs, resided in care centres; and 36,317 IDPs comprising 9,789 households, or 86% of IDPs, lived in affected communities.36 These data are likely an underestimation of the size of the internally displaced population, due to the observation, highlighted in the section on related work above, that information on IDPs living in host communities or other dispersed settings is of significantly poorer quality than the data on IDPs who take refuge at official or collective sites. Another secondary data source that contributes to the analysis is the infographic entitled Papua New Guinea: 7.5 Earthquake Who-does-What-Where (3W) as of 31 May 2018 produced by the UN Office for the Coordination of Humanitarian Affairs.37 The infographic contains information on the flows of assistance to earthquake affected Local Level Governments, a summary of the type of information in the infographic can be found in Table 3.
Type of food assistance distributed to Local Level
Government (LLG)
Type of Water, Sanitation & Hygiene (WASH) assistance to LLG
Type of shelter/Non-Food Item (NFI) assistance
distributed to LLG
Type of health/nutrition assistance to LLG
Type of protection/education
assistance to LLG
Food packs Water Shelter/NFI kits Health kits Dignity kits
Rice Hygiene kits/soap Tarpaulin tents Medical
supplies/equipment Capacity building
Salt WASH kits/purification
tablet Community reconstruction
toolkit Reproductive health kits Early child development kits
Tinned fish Water Container Blanket/sleeping
mats/mosquito net/clothes
Mental health and psychosocial support
(MHPSS) Recreation kits
Tinned beef Technical support Solar lights Capacity building School in a box
Biscuits WASH training Cooking/kitchen sets Technical support Temporary learning space
Cooking oil Garden tools
Flour
Table 3: Variables within the 3W infographic produced by UN OCHA
35 IOM The UN Migration Agency, 2017. Methodological Framework used in Displacement Tracking Matrix Operations for Quantifying Displacement and Mobility, IOM, https://bit.ly/2JeJn3G 36 IOM The UN Migration Agency, 2018. Displacement Tracking Matrix Report for Earthquake-Affected Communities Hela, Southern Highlands and Western Provinces. IOM, https://bit.ly/2FLwUAO 37 Humanitarian Response, 2018. Papua New Guinea: 7.5 Earthquake Who-does-What-Where (3W) as of 31 May 2018, https://bit.ly/2FzU4LA
11
Network Subscriber Density and Population Density
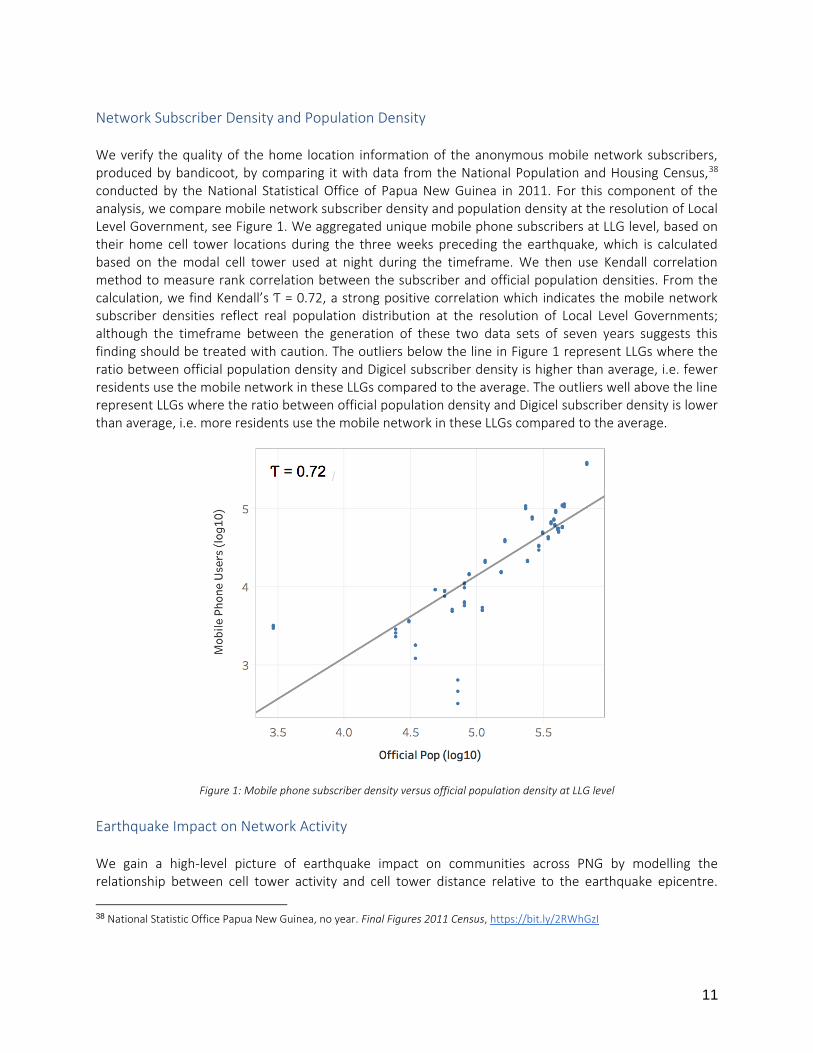
We verify the quality of the home location information of the anonymous mobile network subscribers, produced by bandicoot, by comparing it with data from the National Population and Housing Census,38 conducted by the National Statistical Office of Papua New Guinea in 2011. For this component of the analysis, we compare mobile network subscriber density and population density at the resolution of Local Level Government, see Figure 1. We aggregated unique mobile phone subscribers at LLG level, based on their home cell tower locations during the three weeks preceding the earthquake, which is calculated based on the modal cell tower used at night during the timeframe. We then use Kendall correlation method to measure rank correlation between the subscriber and official population densities. From the calculation, we find Kendall’s Ƭ = 0.72, a strong positive correlation which indicates the mobile network subscriber densities reflect real population distribution at the resolution of Local Level Governments; although the timeframe between the generation of these two data sets of seven years suggests this finding should be treated with caution. The outliers below the line in Figure 1 represent LLGs where the ratio between official population density and Digicel subscriber density is higher than average, i.e. fewer residents use the mobile network in these LLGs compared to the average. The outliers well above the line represent LLGs where the ratio between official population density and Digicel subscriber density is lower than average, i.e. more residents use the mobile network in these LLGs compared to the average.
Figure 1: Mobile phone subscriber density versus official population density at LLG level
Earthquake Impact on Network Activity
We gain a high-level picture of earthquake impact on communities across PNG by modelling the relationship between cell tower activity and cell tower distance relative to the earthquake epicentre.
38 National Statistic Office Papua New Guinea, no year. Final Figures 2011 Census, https://bit.ly/2RWhGzI
12
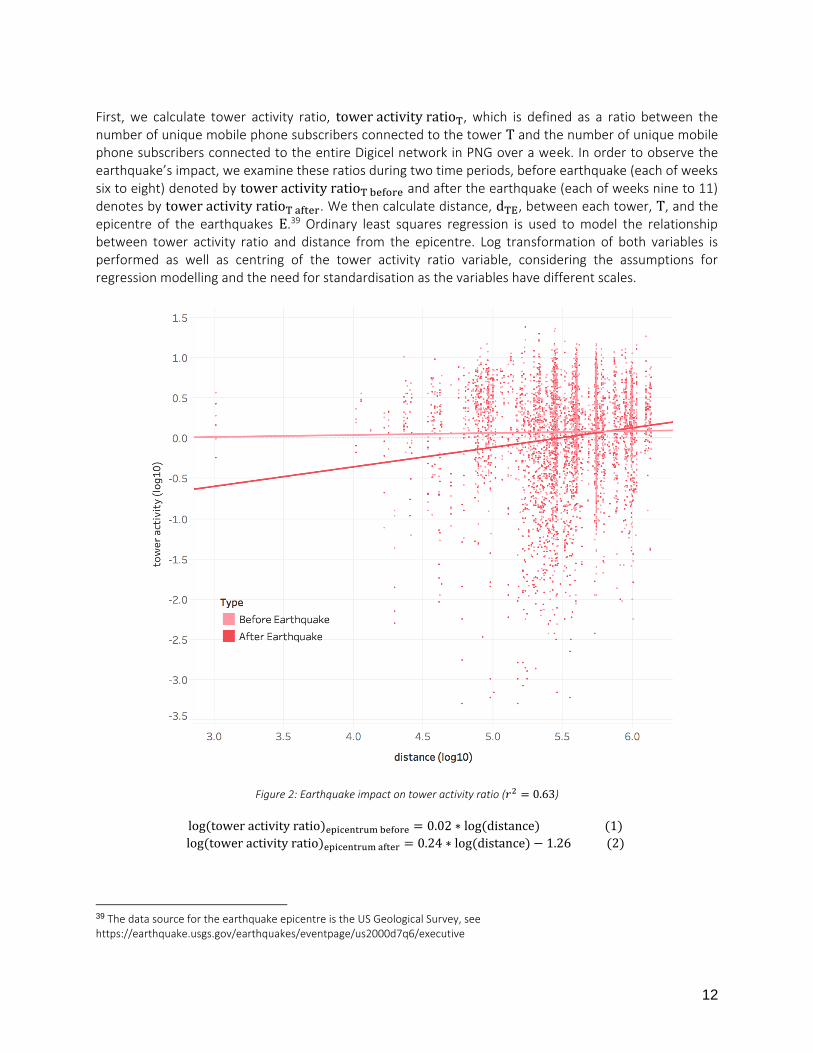
First, we calculate tower activity ratio, tower activity ratioT, which is defined as a ratio between the number of unique mobile phone subscribers connected to the tower T and the number of unique mobile phone subscribers connected to the entire Digicel network in PNG over a week. In order to observe the earthquake’s impact, we examine these ratios during two time periods, before earthquake (each of weeks six to eight) denoted by tower activity ratioT before and after the earthquake (each of weeks nine to 11) denotes by tower activity ratioT after. We then calculate distance, dTE, between each tower, T, and the epicentre of the earthquakes E.39 Ordinary least squares regression is used to model the relationship between tower activity ratio and distance from the epicentre. Log transformation of both variables is performed as well as centring of the tower activity ratio variable, considering the assumptions for regression modelling and the need for standardisation as the variables have different scales.
Figure 2: Earthquake impact on tower activity ratio (𝑟2 = 0.63)
log(tower activity ratio)epicentrum before = 0.02 ∗ log(distance) (1)
log(tower activity ratio)epicentrum after = 0.24 ∗ log(distance) − 1.26 (2)
39 The data source for the earthquake epicentre is the US Geological Survey, see https://earthquake.usgs.gov/earthquakes/eventpage/us2000d7q6/executive
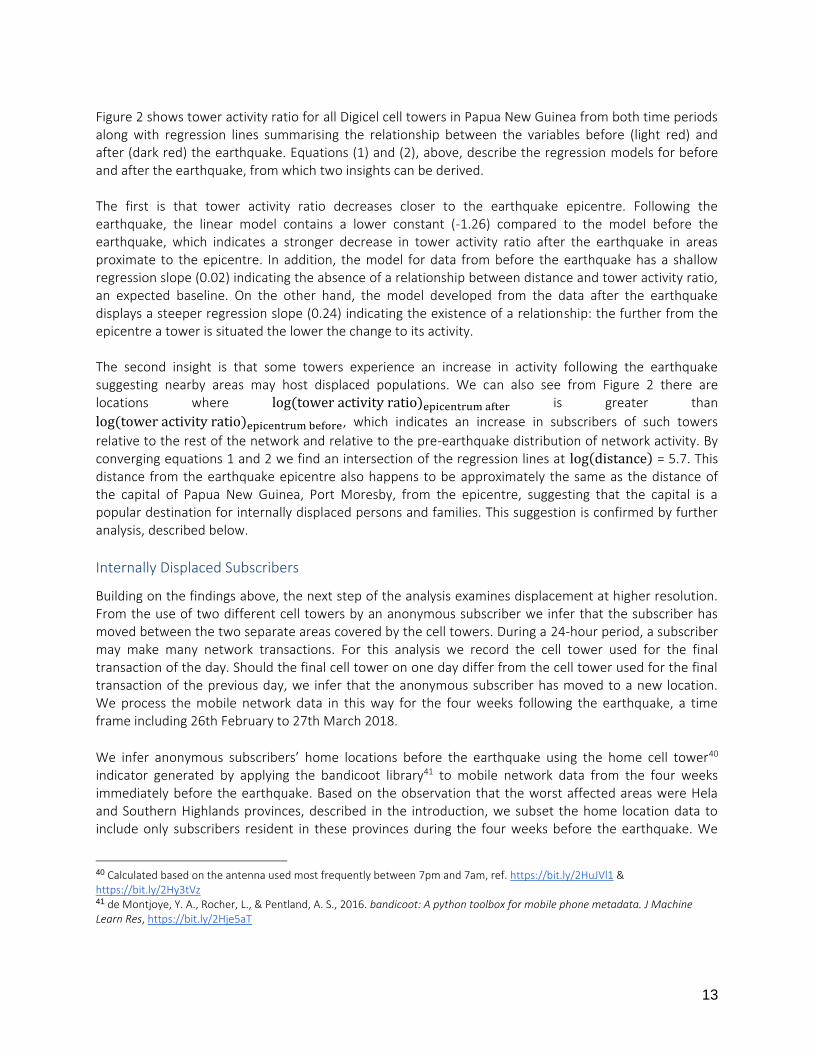
13
Figure 2 shows tower activity ratio for all Digicel cell towers in Papua New Guinea from both time periods along with regression lines summarising the relationship between the variables before (light red) and after (dark red) the earthquake. Equations (1) and (2), above, describe the regression models for before and after the earthquake, from which two insights can be derived. The first is that tower activity ratio decreases closer to the earthquake epicentre. Following the earthquake, the linear model contains a lower constant (-1.26) compared to the model before the earthquake, which indicates a stronger decrease in tower activity ratio after the earthquake in areas proximate to the epicentre. In addition, the model for data from before the earthquake has a shallow regression slope (0.02) indicating the absence of a relationship between distance and tower activity ratio, an expected baseline. On the other hand, the model developed from the data after the earthquake displays a steeper regression slope (0.24) indicating the existence of a relationship: the further from the epicentre a tower is situated the lower the change to its activity. The second insight is that some towers experience an increase in activity following the earthquake suggesting nearby areas may host displaced populations. We can also see from Figure 2 there are locations where log(tower activity ratio)epicentrum after is greater than
log(tower activity ratio)epicentrum before, which indicates an increase in subscribers of such towers
relative to the rest of the network and relative to the pre-earthquake distribution of network activity. By converging equations 1 and 2 we find an intersection of the regression lines at log(distance) = 5.7. This distance from the earthquake epicentre also happens to be approximately the same as the distance of the capital of Papua New Guinea, Port Moresby, from the epicentre, suggesting that the capital is a popular destination for internally displaced persons and families. This suggestion is confirmed by further analysis, described below.
Internally Displaced Subscribers
Building on the findings above, the next step of the analysis examines displacement at higher resolution. From the use of two different cell towers by an anonymous subscriber we infer that the subscriber has moved between the two separate areas covered by the cell towers. During a 24-hour period, a subscriber may make many network transactions. For this analysis we record the cell tower used for the final transaction of the day. Should the final cell tower on one day differ from the cell tower used for the final transaction of the previous day, we infer that the anonymous subscriber has moved to a new location. We process the mobile network data in this way for the four weeks following the earthquake, a time frame including 26th February to 27th March 2018.
We infer anonymous subscribers’ home locations before the earthquake using the home cell tower40 indicator generated by applying the bandicoot library41 to mobile network data from the four weeks immediately before the earthquake. Based on the observation that the worst affected areas were Hela and Southern Highlands provinces, described in the introduction, we subset the home location data to include only subscribers resident in these provinces during the four weeks before the earthquake. We
40 Calculated based on the antenna used most frequently between 7pm and 7am, ref. https://bit.ly/2HuJVl1 & https://bit.ly/2Hy3tVz 41 de Montjoye, Y. A., Rocher, L., & Pentland, A. S., 2016. bandicoot: A python toolbox for mobile phone metadata. J Machine Learn Res, https://bit.ly/2Hje5aT
14
then fuse the home location data set with the day-to-day subscriber location data set, resulting in a subscriber trajectory data set similar to Table 4, and exclusive to subscribers normally resident in Hela and Southern Highlands provinces. Of note, the number of active subscribers classified as living in Hela and Southern Highlands provinces is around 17 per cent smaller during the month following the earthquake (26th February to 27th March) than prior to the earthquake.
Subscriber ID (anonymised)
Home Location
26th Feb 27th Feb --- 26th March 27th March
8f8ad28de134
Tower 56 Tower 60 Tower 65 --- Tower 65 Tower 56
fe01d67aeccd Tower 87 NA Tower 32 --- Tower 87 Tower 87
z2xe16d67adp
Tower 98 Tower 98 Tower 98 --- Tower 12 NA
Table 4: Subscriber locations before and after the earthquake
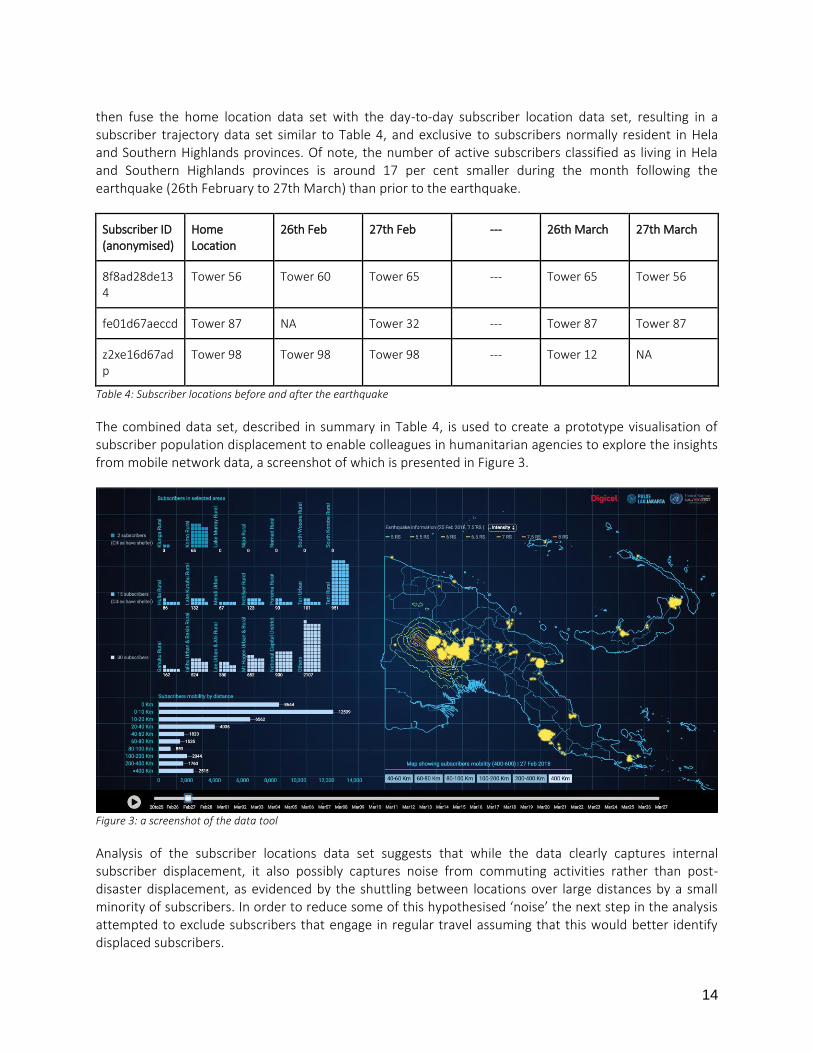
The combined data set, described in summary in Table 4, is used to create a prototype visualisation of subscriber population displacement to enable colleagues in humanitarian agencies to explore the insights from mobile network data, a screenshot of which is presented in Figure 3.
Figure 3: a screenshot of the data tool
Analysis of the subscriber locations data set suggests that while the data clearly captures internal subscriber displacement, it also possibly captures noise from commuting activities rather than post-disaster displacement, as evidenced by the shuttling between locations over large distances by a small minority of subscribers. In order to reduce some of this hypothesised ‘noise’ the next step in the analysis attempted to exclude subscribers that engage in regular travel assuming that this would better identify displaced subscribers.
15
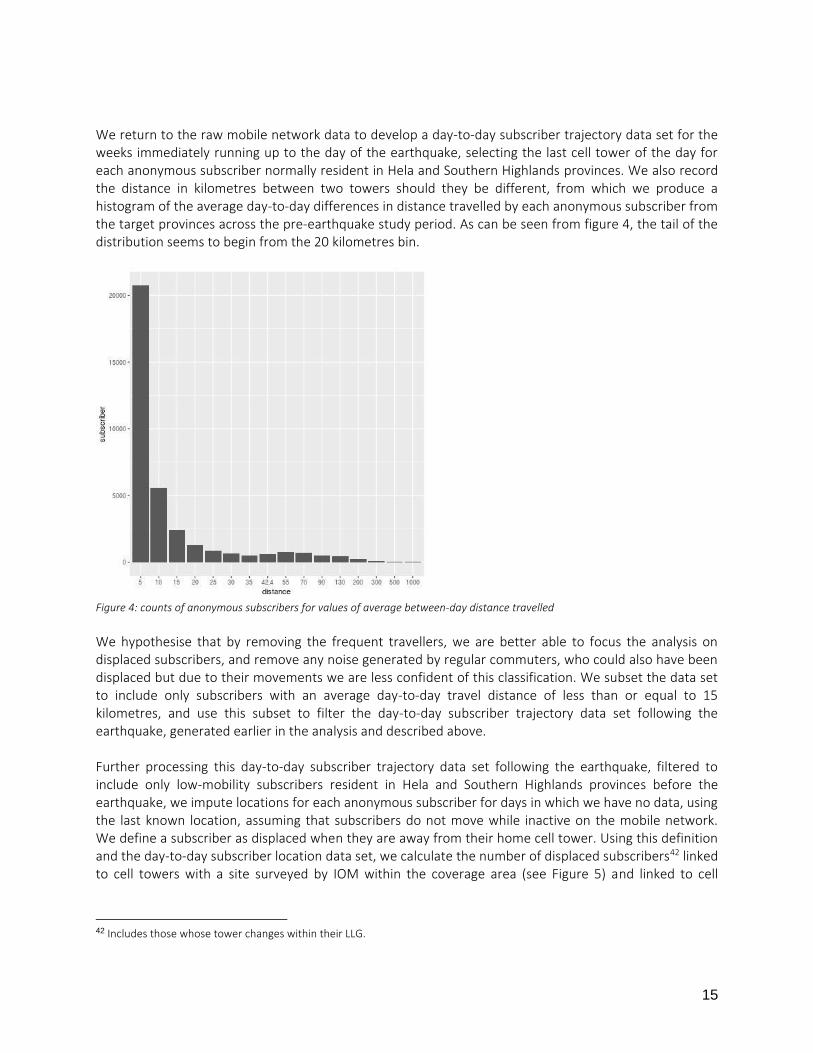
We return to the raw mobile network data to develop a day-to-day subscriber trajectory data set for the weeks immediately running up to the day of the earthquake, selecting the last cell tower of the day for each anonymous subscriber normally resident in Hela and Southern Highlands provinces. We also record the distance in kilometres between two towers should they be different, from which we produce a histogram of the average day-to-day differences in distance travelled by each anonymous subscriber from the target provinces across the pre-earthquake study period. As can be seen from figure 4, the tail of the distribution seems to begin from the 20 kilometres bin.
Figure 4: counts of anonymous subscribers for values of average between-day distance travelled
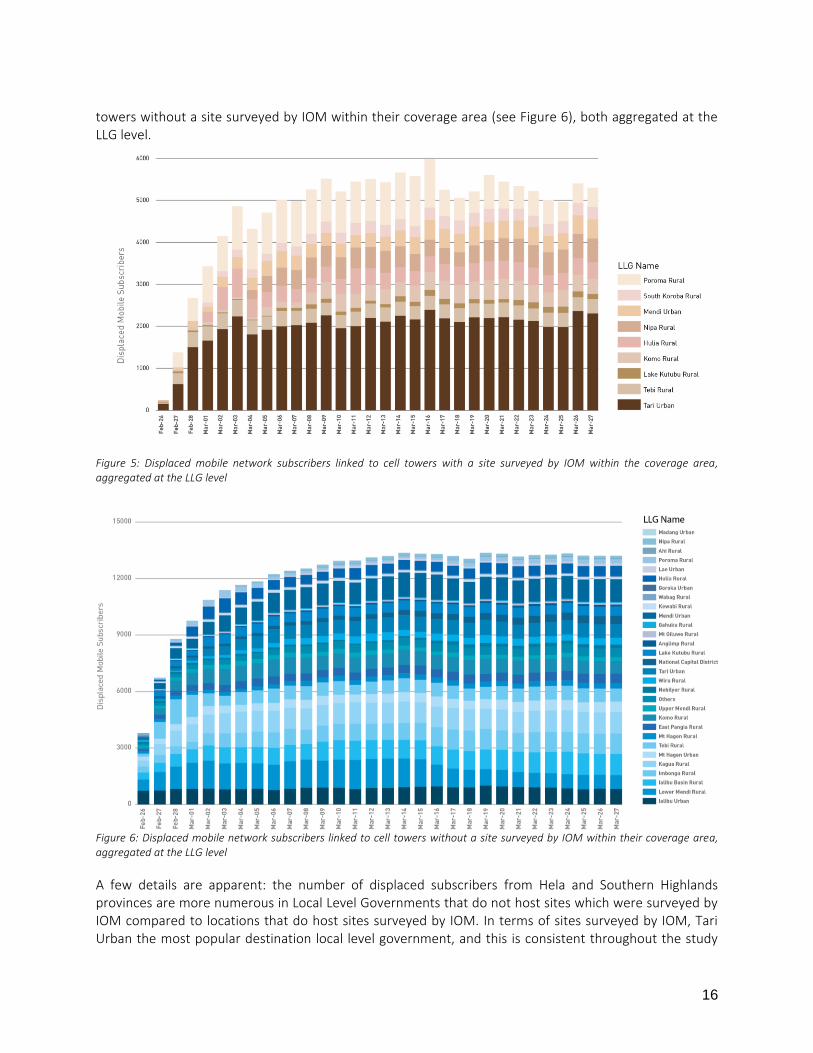
We hypothesise that by removing the frequent travellers, we are better able to focus the analysis on displaced subscribers, and remove any noise generated by regular commuters, who could also have been displaced but due to their movements we are less confident of this classification. We subset the data set to include only subscribers with an average day-to-day travel distance of less than or equal to 15 kilometres, and use this subset to filter the day-to-day subscriber trajectory data set following the earthquake, generated earlier in the analysis and described above. Further processing this day-to-day subscriber trajectory data set following the earthquake, filtered to include only low-mobility subscribers resident in Hela and Southern Highlands provinces before the earthquake, we impute locations for each anonymous subscriber for days in which we have no data, using the last known location, assuming that subscribers do not move while inactive on the mobile network. We define a subscriber as displaced when they are away from their home cell tower. Using this definition and the day-to-day subscriber location data set, we calculate the number of displaced subscribers42 linked to cell towers with a site surveyed by IOM within the coverage area (see Figure 5) and linked to cell
42 Includes those whose tower changes within their LLG.
16
towers without a site surveyed by IOM within their coverage area (see Figure 6), both aggregated at the LLG level.
Figure 5: Displaced mobile network subscribers linked to cell towers with a site surveyed by IOM within the coverage area, aggregated at the LLG level
Figure 6: Displaced mobile network subscribers linked to cell towers without a site surveyed by IOM within their coverage area, aggregated at the LLG level
A few details are apparent: the number of displaced subscribers from Hela and Southern Highlands provinces are more numerous in Local Level Governments that do not host sites which were surveyed by IOM compared to locations that do host sites surveyed by IOM. In terms of sites surveyed by IOM, Tari Urban the most popular destination local level government, and this is consistent throughout the study

17
period. The displaced population is fairly stable from a week after the earthquake through to the end of the study period, suggesting that we need to extend the timeframe to understand returns.
Different Sources of Insights on Internal Displacement
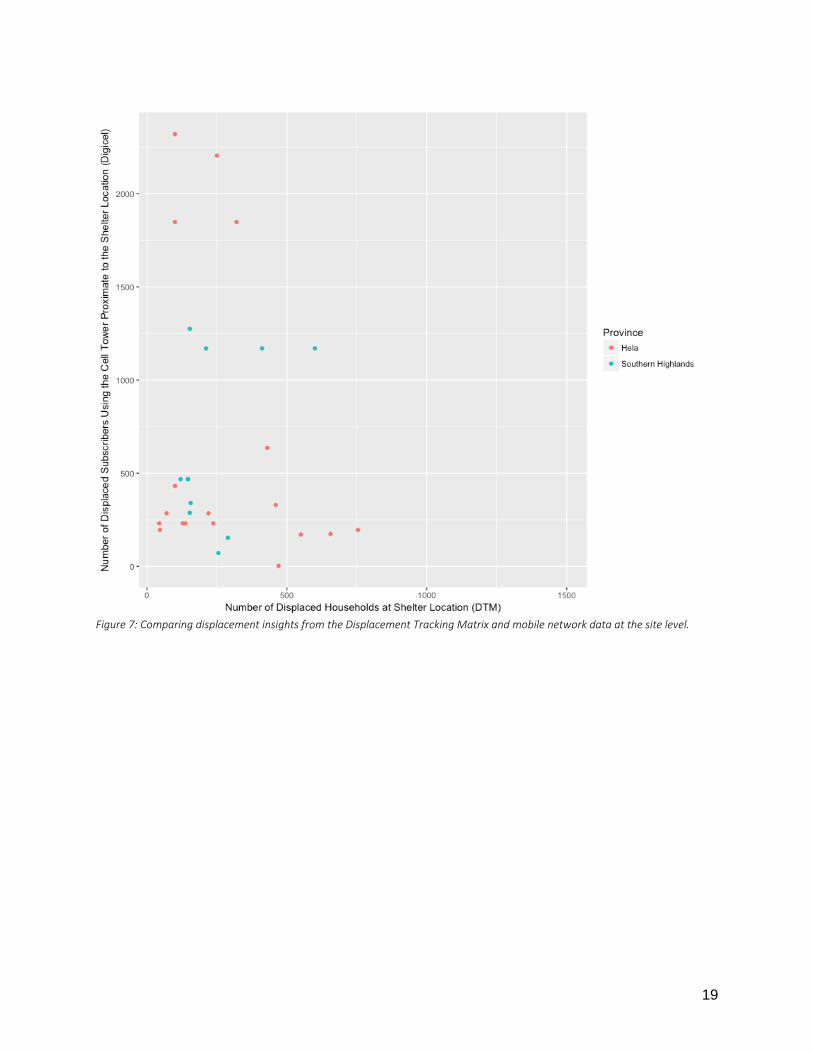
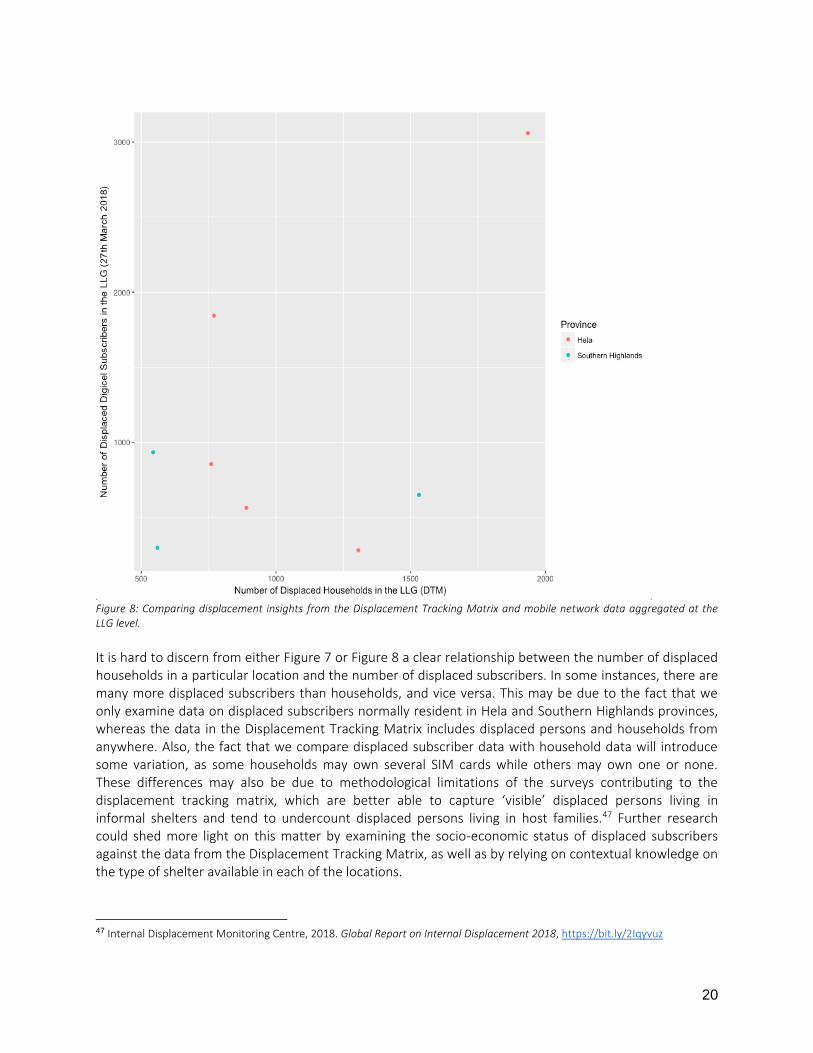
Building on the insights described above, this section compares different sources of data on displacement, namely the Displacement Tracking Matrix (see Table 2) and the daily subscriber trajectory data set, developed from mobile network data.43 This section also examines if a relationship exists between the number of displaced persons in an LLG and the targeting of humanitarian assistance (see Table 3). The combined data set covers a total of 36 LLGs spread across four provinces known to have received assistance: Hela, Southern Highlands, Western and Enga. One additional province without information on flows of humanitarian assistance, East Sepik, is also included in the combined data set because one of its constituent LLGs is found to host a site surveyed by IOM. The combined data set contains missing values due to the mismatch between the locations of shelters, the locations of cell towers, and the targeting of assistance. Not only does the fusion of the data sets suffer from issues with spatial coverage, but the sampling frequency also differs: the site assessments that contribute to the Displacement Tracking Matrix capture the number of displaced households (and in some instances the number of IDPs) in the survey location on the date of the survey, whereas the displacement insights from mobile network data are available on a daily basis, and the index on the targeting of humanitarian assistance covers all support to communities aggregated at the LLG level over the entire time frame of crisis response. This index is developed based on the average number of assistance types44 received by each LLG, weighted by the number of organisations engaged in the provision of assistance; it does not include information on the amount of assistance or the frequency of delivery which limits our analysis and should be borne in mind when interpreting the figures below. Due to the mismatch between the spatial and temporal coverage of the data sets, to improve comparability we extract the displacement insights from the subscriber trajectory data set to match the same date as the displacement tracking survey; for example, if the survey took place in a particular site on 10th March, we would use the displacement insights from subscriber trajectory data set from the tower with that site within its coverage area on the same date. When comparing displacement insights with the targeting of humanitarian assistance, we use the last day for which we have developed daily displacement insights from the subscriber trajectory data set summed at the LLG level, namely 27th March 2018, we also sum the insights from the Displacement Tracking Matrix at the LLG level to facilitate comparison with the data on the targeting of humanitarian assistance. As you can see from Figure 5 and Figure 6 above, the data suggests that no significant returns of displaced persons had begun by 27th March, so displacement insights on this date remains valid as a basis for comparison against the targeting of humanitarian assistance, acknowledging that the day-to-day variation in locations would create slightly different results were another day chosen. In Figure 7 and Figure 8, below, we compare the number of displaced persons identified by the Displacement Tracking Matrix and the subscriber trajectory data set respectively at different levels of resolution, namely the site level (Figure 7) and the LLG level (Figure 8). As highlighted in the previous
43 Described at the end of the section entitled Internally Displaced Subscribers. 44 Consisting of assistance for food (eight types), WASH (six types), shelter (seven types), health (six types) and education (six types). See Table 3 for more information.
18
section the subscriber trajectory data set includes only low-mobility subscribers resident in Hela and Southern Highlands provinces before the earthquake and that the locations of subscribers on days for which we have no data are imputed assuming that subscribers do not move while inactive on the mobile network. We define a subscriber as displaced when they are away from their home cell tower and using this definition, we calculate the number of displaced subscribers at the site and the LLG level. There are more data points at the site level due to some of the data coverage issues described above. We use the number of households from the Displacement Tracking Matrix as this variable has greater coverage across the different sites than the number of displaced persons in each shelter. We chose not to convert45 the number of households to a figure for displaced persons by multiplying by Papua New Guinea’s average family size due to the additional uncertainties this would bring and because research by Watson and Duffield46 highlights that non-phone owners use relatives mobile phones, suggesting that the mobile network data associated with a SIM (subscriber identity module) card may also represent more than one individual. Based on the above, it is clear that both estimates for the number of displaced persons lack precision, but we may still glean useful information from the relationship between the two variables.
45 See Internal Displacement Monitoring Centre, 2018. Global Report on Internal Displacement 2018, https://bit.ly/2Iqyvuz for a more detailed description on the conversion. 46 Watson, A. H., & Duffield, L. R., 2016. From garamut to mobile phone: Communication change in rural Papua New Guinea. Mobile Media & Communication, https://bit.ly/2FJrlCX
19
Figure 7: Comparing displacement insights from the Displacement Tracking Matrix and mobile network data at the site level.
20
Figure 8: Comparing displacement insights from the Displacement Tracking Matrix and mobile network data aggregated at the LLG level.
It is hard to discern from either Figure 7 or Figure 8 a clear relationship between the number of displaced households in a particular location and the number of displaced subscribers. In some instances, there are many more displaced subscribers than households, and vice versa. This may be due to the fact that we only examine data on displaced subscribers normally resident in Hela and Southern Highlands provinces, whereas the data in the Displacement Tracking Matrix includes displaced persons and households from anywhere. Also, the fact that we compare displaced subscriber data with household data will introduce some variation, as some households may own several SIM cards while others may own one or none. These differences may also be due to methodological limitations of the surveys contributing to the displacement tracking matrix, which are better able to capture ‘visible’ displaced persons living in informal shelters and tend to undercount displaced persons living in host families.47 Further research could shed more light on this matter by examining the socio-economic status of displaced subscribers against the data from the Displacement Tracking Matrix, as well as by relying on contextual knowledge on the type of shelter available in each of the locations.
47 Internal Displacement Monitoring Centre, 2018. Global Report on Internal Displacement 2018, https://bit.ly/2Iqyvuz
21
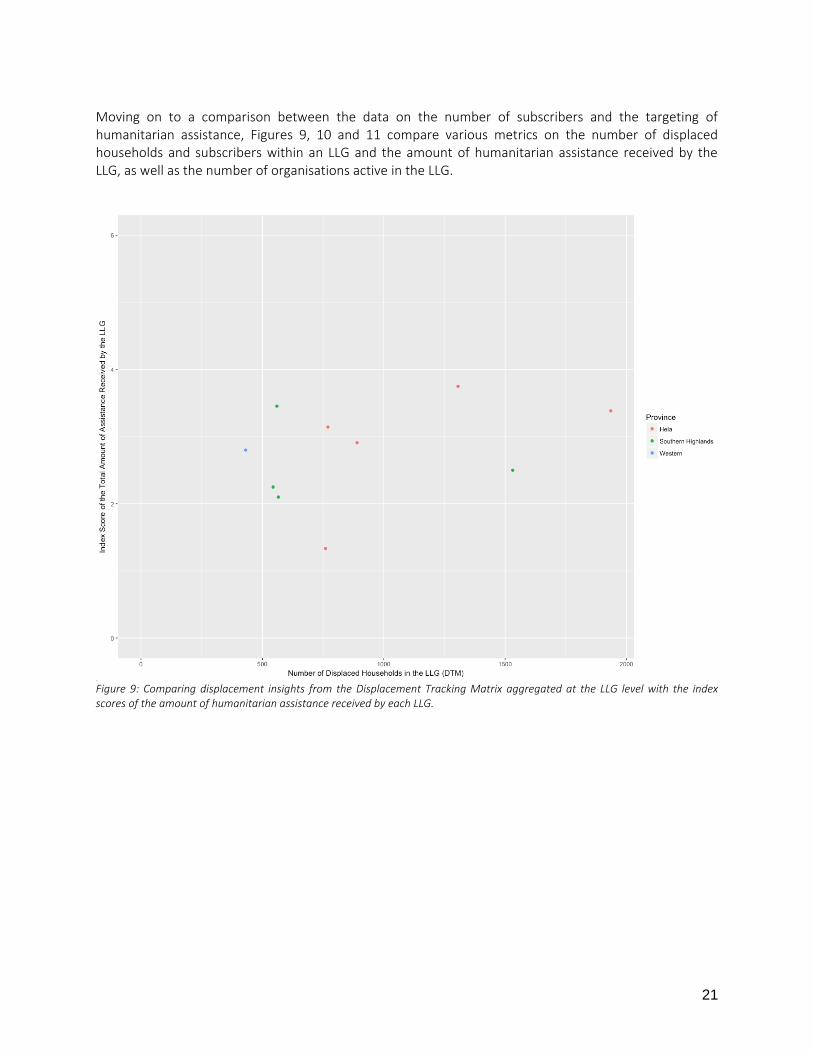
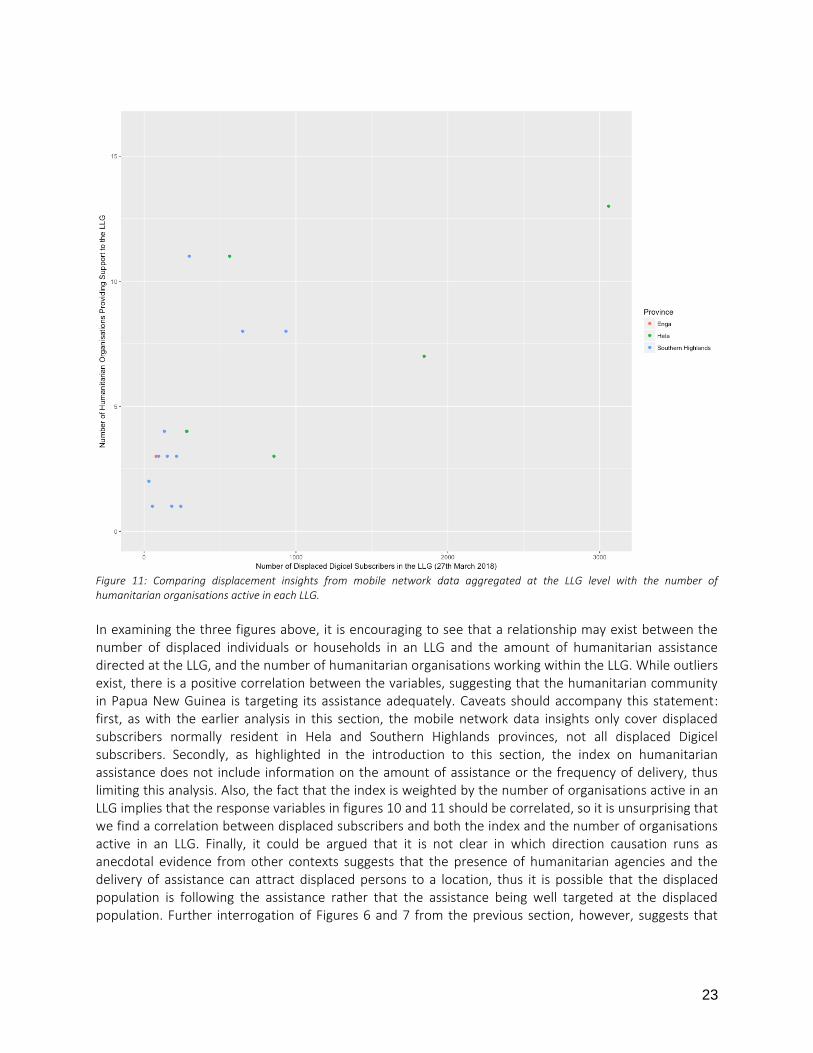
Moving on to a comparison between the data on the number of subscribers and the targeting of humanitarian assistance, Figures 9, 10 and 11 compare various metrics on the number of displaced households and subscribers within an LLG and the amount of humanitarian assistance received by the LLG, as well as the number of organisations active in the LLG.
Figure 9: Comparing displacement insights from the Displacement Tracking Matrix aggregated at the LLG level with the index scores of the amount of humanitarian assistance received by each LLG.
22
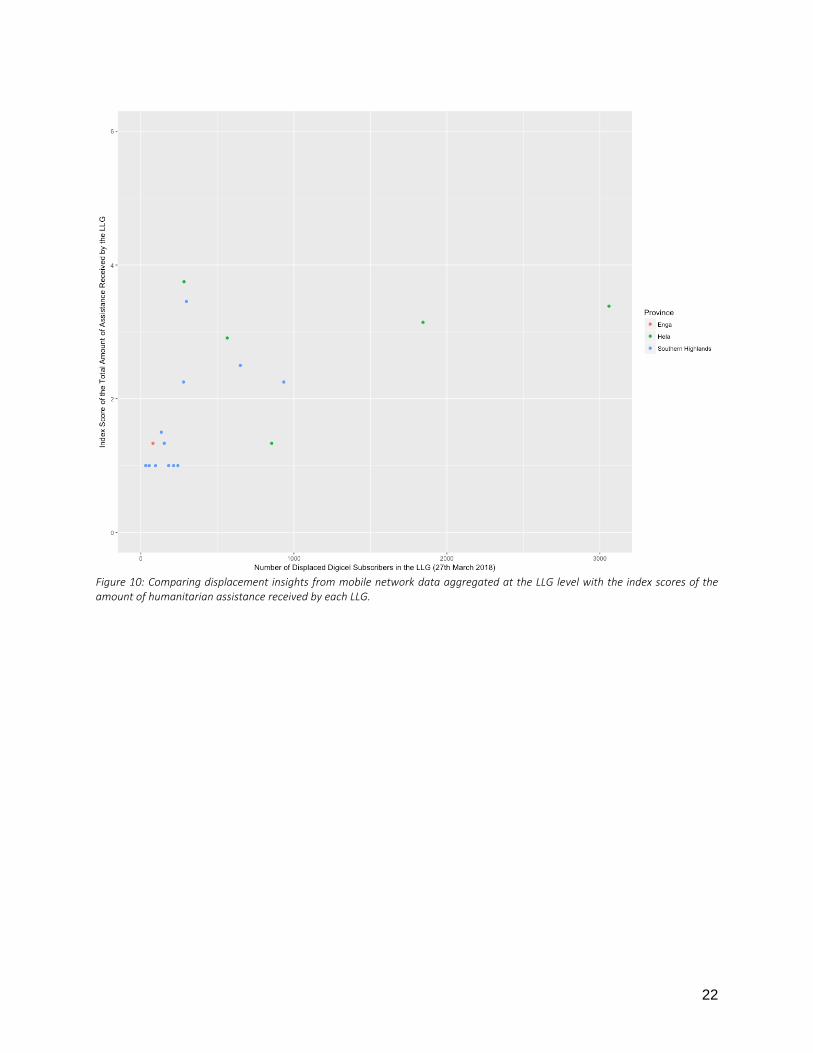
Figure 10: Comparing displacement insights from mobile network data aggregated at the LLG level with the index scores of the amount of humanitarian assistance received by each LLG.
23
Figure 11: Comparing displacement insights from mobile network data aggregated at the LLG level with the number of humanitarian organisations active in each LLG.
In examining the three figures above, it is encouraging to see that a relationship may exist between the number of displaced individuals or households in an LLG and the amount of humanitarian assistance directed at the LLG, and the number of humanitarian organisations working within the LLG. While outliers exist, there is a positive correlation between the variables, suggesting that the humanitarian community in Papua New Guinea is targeting its assistance adequately. Caveats should accompany this statement: first, as with the earlier analysis in this section, the mobile network data insights only cover displaced subscribers normally resident in Hela and Southern Highlands provinces, not all displaced Digicel subscribers. Secondly, as highlighted in the introduction to this section, the index on humanitarian assistance does not include information on the amount of assistance or the frequency of delivery, thus limiting this analysis. Also, the fact that the index is weighted by the number of organisations active in an LLG implies that the response variables in figures 10 and 11 should be correlated, so it is unsurprising that we find a correlation between displaced subscribers and both the index and the number of organisations active in an LLG. Finally, it could be argued that it is not clear in which direction causation runs as anecdotal evidence from other contexts suggests that the presence of humanitarian agencies and the delivery of assistance can attract displaced persons to a location, thus it is possible that the displaced population is following the assistance rather that the assistance being well targeted at the displaced population. Further interrogation of Figures 6 and 7 from the previous section, however, suggests that
24
this is not the case, as the displaced population in each LLG remains fairly stable across the timeframe of the analysis.
Limitations
Limitations specific to the data mining methods are covered in some of the sections above, this section concerns more general limitations of the use of mobile network data in population displacement analysis. As highlighted in the introduction, the mobile phone penetration rate in Papua New Guinea stands at 54 per cent. Any penetration rate below ubiquity introduces coverage error into the research: due to the ‘digital divide’48 we cannot analyse the mobility of people who do not use a mobile phone. In addition, the analysis only examines data from Digicel, which holds a majority market share, but the absence of data from the other mobile network operator, Vodafone, as well as the fact that neither network has network coverage of all populated areas introduces some additional coverage error. Further coverage error is introduced by SIM card churn, the process by which subscribers abandon SIM cards, and by extension their numbers, for new ones, meaning that an instance of displacement would not be captured in the data.49 The research requires subscribers to interact with the network in order to generate transaction records for displacement analysis, thus subscribers that use the network very infrequently would not be included50; however, this effect could be suppressed by the fact that the natural disasters trigger higher subscriber activity on the mobile network.51 In previous research, some attempts are made to scale the insights from mobile network data to be more representative of the general population, by reference to the difference between subscriber densities and population densities captured by the census. This assumes that the coverage error is not due to any structural exclusions of certain social groups, and hence does not translate into coverage bias. The authors do not attempt to do this under this analysis due to questions raised by stakeholders in Papua New Guinea as to the quality of the most recent census. This notwithstanding, it is possible that coverage error leads to coverage bias due to the finding by Rice and Katz52 that patterns of technology adoption are not random. The cost of using the services can be exclusionary of less well-off individuals, or gender norms, roles and power dynamics within the community and household can exclude women, or other reasons such as age or poor health can impact technology adoption. The net result of these coverage errors and biases is that the displacement captured by the mobile network data analysis is likely an underestimation in terms of absolute numbers, but, further to Wesolowski et al.53, an overestimation in terms of proportions.
48 Salganik, M. J., 2017. Bit by bit: social research in the digital age. Princeton University Press, https://bit.ly/2DhJaYf 49 Reality Check Approach, UN Global Pulse and World Bank Indonesia, 2018. People’s Perspectives of Urban Poverty and Rural to Urban Migration, Jakarta, The Palladium Group and World Bank Indonesia, https://bit.ly/2APwkiw 50 Zagatti, G. A., Gonzalez, M., Avner, P., Lozano-Gracia, N., Brooks, C. J., Albert, M., ... & Tatem, A. J., 2018. A trip to work: Estimation of origin and destination of commuting patterns in the main metropolitan regions of Haiti using CDR. Development Engineering, https://bit.ly/2CsaP77 51 Moumni, B., Frias-Martinez, V., & Frias-Martinez, E., 2013. Characterizing social response to urban earthquakes using cell-phone network data: the 2012 oaxaca earthquake. In Proceedings of the 2013 ACM conference on Pervasive and ubiquitous computing adjunct publication, https://bit.ly/2CxiwJd 52 Rice, R. E., & Katz, J. E., 2003. Comparing internet and mobile phone usage: digital divides of usage, adoption, and dropouts. Telecommunications Policy, https://bit.ly/2W1dm1l 53 Wesolowski, A., Eagle, N., Noor, A. M., Snow, R. W., & Buckee, C. O., 2013. The impact of biases in mobile phone ownership on estimates of human mobility. Journal of the Royal Society Interface, https://bit.ly/2sy06ni
25
An additional limitation concerns the mapping of cell towers to Local Level Governments, where the analysis opted for a direct mapping to the administrative boundary. Due to the coverage of cell towers often crossing administrative boundaries, this may have led to a few subscribers being mislabelled under a neighbouring LLG. Specific to the mobile network subscribers, it is not clear what a number or SIM represents in the context of Papua New Guinea. For some numbers it will be an individual, but, further to the work of Watson and Duffield54 who found that up to 46 per cent of their survey respondents who did not own a phone reported infrequent use of mobile phones (less than five times per month), this is not necessarily always the case.
Conclusions
This research paper has explored anonymous mobile network data as a source of insights on displacement following the Highlands earthquake in Papua New Guinea in February 2018. In an approach similar to Kapoor et al.55, we find a relationship between network perturbations in terms of the ratio of subscribers connected to different cell towers and proximity to the epicentre of the earthquake. We then developed insights on displacement flows and stocks by mining the anonymised mobile network data to develop day-to-day subscriber trajectories, which we filtered to include only low-mobility subscribers resident in Hela and Southern Highlands provinces before the earthquake. We defined a subscriber as displaced when they are away from their home cell tower. We found that the number of displaced subscribers from Hela and Southern Highlands provinces are more numerous in locations that were not surveyed by IOM compared to locations that were surveyed, but that the sites surveyed by IOM host a large number of displaced mobile network subscribers, suggesting that the targeting of limited survey resources was efficient. Assuming that our data mining and definition of displacement are optimal, this is an important finding in that it suggests that site assessments and surveys can miss large proportions of displaced mobile network subscribers, in this case the majority, but also that mobile network data can inform the targeting of limited survey resources. Whether these are representative of the general displaced population remains an open question.
Based on these findings we attempted to make direct comparisons between the numbers of displaced identified by mobile network data mining and the site assessments composing the Displacement Tracking Matrix. We were unable to discern a clear relationship between the number of displaced households in a particular location and the number of displaced mobile network subscribers. In some instances, there were many more displaced subscribers than households, and vice versa, but there was no consistent proportionality. Mining the data associated with all subscribers in earthquake affected areas, rather than the provinces of Hela and Southern Highlands alone, might go some way to addressing this issue, and would shift the focus onto what one mobile network number represents (an individual or family, even a community), as well as the methodological limitations of the surveys. Moving on to the targeting of humanitarian operations, we found a relationship between the number of displaced individuals or households in an LLG and the variety of humanitarian assistance directed at the
54 Watson, A. H., & Duffield, L. R., 2016. From garamut to mobile phone: Communication change in rural Papua New Guinea. Mobile Media & Communication, https://bit.ly/2FJrlCX 55 Kapoor, A., Eagle, N., & Horvitz, E., 2010. People, Quakes, and Communications: Inferences from Call Dynamics about a Seismic Event and its Influences on a Population. In AAAI spring symposium: artificial intelligence for development, https://bit.ly/2DgiKGA

26
LLG. A positive correlation between the variables, and the fact that the displaced population in each LLG remains fairly stable across the timeframe of the analysis, suggested that the humanitarian community in Papua New Guinea is targeting its assistance adequately and that the assistance was not attracting displaced persons to the locations of humanitarian operations. In reflecting on the limitations of using mobile network data for displacement analysis, we find that coverage errors and biases exist in the data set, and that the displacement captured by mobile network data analysis is likely an underestimation in terms of absolute numbers, but an overestimation in terms of proportions. Due to the lack of recent census data and other concerns, we make no attempt to scale the insights from mobile network data in order to generalise the findings to all displaced persons and households. In light of this, it would be useful in future if the surveys and site assessments composing the Displacement Tracking Matrix collected data on mobile phone ownership. Notwithstanding the coverage errors of mobile network data and the fact that our analysis focuses on the two provinces most impacted by the earthquake, the findings offer new perspectives on the quantification of displacement in the context of a natural disaster. It is clear that mobile network data offers higher frequency and higher resolution insights on internal displacement when compared to existing methods. We are still unsure as to the level of overlap between the figures developed by the two approaches at the locations of displacement sites, but it is clear that the mobile network data offers new data and insights on internally displaced persons and households living in host communities or other dispersed settings, a major blind spot of current methods. Further research needs to address the question of the representativeness of insights from mobile network data across all locations, as well as contextualise the insights by developing information on the socio-economic status of the anonymous subscribers, which would enable the further targeting of humanitarian assistance based on vulnerability. While mobile network data holds great potential, it will always need to be supplemented by insights from surveys and other forms of site assessment to address the more specific needs of displaced persons and households. It does, however, offer a highly valuable information during what are often chaotic days and weeks following a natural disaster.
References
1. Bengtsson, L., Lu, X., Thorson, A., Garfield, R., & Von Schreeb, J., 2011, Improved response to disasters and outbreaks by tracking population movements with mobile phone network data: a post-earthquake geospatial study in Haiti. PLoS medicine, https://bit.ly/2TTG1DB
2. Blumenstock, J. E., 2012, Inferring patterns of internal migration from mobile phone call records: evidence from Rwanda. Information Technology for Development, https://bit.ly/2Dghtza
3. de Montjoye, Y. A., Rocher, L., & Pentland, A. S., 2016, bandicoot: A python toolbox for mobile phone metadata. J Machine Learn Res, https://bit.ly/2Hje5aT
4. Digicel Papua New Guinea, no year, Coverage map, https://bit.ly/2AQJoEl 5. Fernando, L., Surendra, A., Lokanathan, S., Gomez, T., 2018, Predicting population-level socio-
economic characteristics using Call Detail Records (CDRs) in Sri Lanka. DSMM'18 Proceedings of the Fourth International Workshop on Data Science for Macro-Modeling with Financial and Economic Datasets, https://bit.ly/2FYMPfi
6. Frias-Martinez, V., Virseda, J., & Frias-Martinez, E., 2010, Socio-economic levels and human mobility, In Qual meets quant workshop-QMQ, https://bit.ly/2FyNsN8
27
7. Global Facility for Disaster Reduction and Recovery, no year, Papua New Guinea, https://bit.ly/2MdtA2V
8. GSMA, 2014, GSMA guidelines on the protection of privacy in the use of mobile phone data for responding to the Ebola outbreak, https://bit.ly/2Ub0Pqb
9. GSMA Intelligence, 2015, The Mobile Economy Pacific Islands 2015, https://bit.ly/2CqiCT5 10. Humanitarian Response, 2018, Papua New Guinea: 7.5 Earthquake Who-does-What-Where (3W)
as of 31 May 2018, https://bit.ly/2FzU4LA 11. Internal Displacement Monitoring Centre, 2018, Global Report on Internal Displacement 2018,
https://bit.ly/2Iqyvuz 12. Internal Displacement Monitoring Centre, 2018, Methodological Annex to the Global Report on
Internal Displacement 2018, https://bit.ly/2Iqyvuz 13. IOM The UN Migration Agency, 2017, Methodological Framework used in Displacement Tracking
Matrix Operations for Quantifying Displacement and Mobility, https://bit.ly/2JeJn3G 14. IOM The UN Migration Agency, 2018, Displacement Tracking Matrix Report for Earthquake-
Affected Communities Hela, Southern Highlands and Western Provinces, https://bit.ly/2FLwUAO 15. Kapoor, A., Eagle, N., & Horvitz, E., 2010. People, Quakes, and Communications: Inferences from
Call Dynamics about a Seismic Event and its Influences on a Population. In AAAI spring symposium: artificial intelligence for development, https://bit.ly/2DgiKGA
16. Lu, X., Bengtsson, L., & Holme, P., 2012, Predictability of population displacement after the 2010 Haiti earthquake. Proceedings of the National Academy of Sciences, https://bit.ly/2FxN4hV
17. Lu, X., Wrathall, D. J., Sundsøy, P. R., Nadiruzzaman, M., Wetter, E., Iqbal, A., ... & Bengtsson, L., 2016. Unveiling hidden migration and mobility patterns in climate stressed regions: A longitudinal study of six million anonymous mobile phone users in Bangladesh, Global Environmental Change, https://bit.ly/2DfaIxn
18. Moumni, B., Frias-Martinez, V., & Frias-Martinez, E., 2013, Characterizing social response to urban earthquakes using cell-phone network data: the 2012 oaxaca earthquake. In Proceedings of the 2013 ACM conference on Pervasive and ubiquitous computing adjunct publication, https://bit.ly/2CxiwJd
19. National Information and Communications Technology Authority - Papua New Guinea, 2016, Iran, Status of Spectrum Management Papua New Guinea, https://bit.ly/2MhI29P
20. National Statistic Office Papua New Guinea, no year, Final Figures 2011 Census, https://bit.ly/2RWhGzI
21. PNG Disaster Management Team, 2018, Papua New Guinea: Highlands Earthquake Situation Report No. 4, https://bit.ly/2RLaDtF
22. Reality Check Approach, UN Global Pulse and World Bank Indonesia, 2018, People’s Perspectives of Urban Poverty and Rural to Urban Migration, Jakarta, The Palladium Group and World Bank Indonesia, https://bit.ly/2APwkiw
23. Reliefweb, 2018, Asia and the Pacific: Weekly Regional Humanitarian Snapshot (27 February - 5 March 2018), https://bit.ly/2VVvidy
24. Relief Web, 2018, Papua New Guinea: 7.5 Earthquake Who-does-What-Where (3W) as of 31 May 2018, https://bit.ly/2CrPdrH
25. Reliefweb, 2018, Papua New Guinea – Earthquake Update (GDACS, USGS, Copernicus EMS, Media) (ECHO Daily Flash of 27 February 2018), https://bit.ly/2FGbmFR
26. Reliefweb, 2018, Papua New Guinea: Highlands Earthquake Situation Report No. 10 (as of 28 May 2018), https://bit.ly/2MjXKBC
27. Reliefweb, 2018, State of Emergency declared in Highlands Earthquake Disaster area, K450 million provided for relief and restoration, https://bit.ly/2QPeYY9
28
28. Rice, R. E., & Katz, J. E., 2003, Comparing internet and mobile phone usage: digital divides of usage, adoption, and dropouts. Telecommunications Policy, https://bit.ly/2W1dm1l
29. Salganik, M. J., 2017, Bit by bit: social research in the digital age. Princeton University Press, https://bit.ly/2DhJaYf
30. Sundsøy, P., 2017, Measuring patterns of human behaviour through large-scale mobile phone data-Big Data for social sciences, https://bit.ly/2FFOxCn
31. Song, C., Qu, Z., Blumm, N., & Barabási, A. L., 2010. Limits of predictability in human mobility. Science, https://bit.ly/2QRIfkY
32. The World Bank, no year, Papua New Guinea, https://bit.ly/2IplSj4 33. United Nations Global Pulse, 2013, Mobile Network Data for Development,
https://bit.ly/2QUNSyI 34. United Nations Global Pulse, 2019, Strengthening Humanitarian Action with Insights from Mobile
Network Data, https://bit.ly/2ReIQNE 35. UNDP in Papua New Guinea, no year, Disaster Risk Management, https://bit.ly/21xLm1i 36. Watson, A. H., & Duffield, L. R., 2016, From garamut to mobile phone: Communication change in
rural Papua New Guinea. Mobile Media & Communication, https://bit.ly/2FJrlCX 37. Wesolowski, A., Eagle, N., Noor, A. M., Snow, R. W., & Buckee, C. O., 2013, The impact of biases in
mobile phone ownership on estimates of human mobility. Journal of the Royal Society Interface, https://bit.ly/2sy06ni
38. Wilson, R., zu Erbach-Schoenberg, E., Albert, M., Power, D., Tudge, S., Gonzalez, M., ... & Pitonakova, L., 2016, Rapid and near real-time assessments of population displacement using mobile phone data following disasters: the 2015 Nepal Earthquake. PLoS currents, https://bit.ly/2TVcVn4
39. Xu, Y., Belyi, A., Bojic, I., & Ratti, C., 2018, Human mobility and socioeconomic status: Analysis of Singapore and Boston. Computers, Environment and Urban Systems, https://bit.ly/2ARFv1G
40. Yang, C., Yang, J., Luo, X., & Gong, P., 2009, Use of mobile phones in an emergency reporting system for infectious disease surveillance after the Sichuan earthquake in China. Bulletin of the World Health Organization, https://bit.ly/2TTkDOP
41. Zagatti, G. A., Gonzalez, M., Avner, P., Lozano-Gracia, N., Brooks, C. J., Albert, M., ... & Tatem, A. J., 2018, A trip to work: Estimation of origin and destination of commuting patterns in the main metropolitan regions of Haiti using CDR. Development Engineering, https://bit.ly/2CsaP77