Embed Size (px)
Citation preview

COMPARING
PERFORMANCE: MANAGED CARE AND FEE-FOR-SERVICE
January 2015
MANAGED CARE IN MISSOURI
Size of Populations
MC 420,443 48%
MC – like – FFS 219,132 25%
ABD - FFS 233,263 27%
2
Number of Counties
Eastern Region (13)
Central Region (28)
Western Region (13)
Current Health Plans
HealthCare USA
Home State Health Plan
Missouri Care Health Plan

CONFLICTING ARGUMENTS REGARDING
THE IMPACTS OF MANAGED CARE
Cost Managed Care (MC) reduces cost by better management
MC increases cost due to administrative overhead
Utilization of Services and Provider Access MC improves access and properly manages utilization by better rates and
coordinated strategy
MC reduces access by closed panels and burdensome prior authorizations
Clinical Quality MC fosters quality through care management
MC impairs quality by restricting services
3

COMPARING
PERFORMANCE:
COST

RETROSPECTIVE COST COMPARISON
BY MERCER
Review last done by Mercer for SFY 2009 found MC saved 2.7% ($38 million) compared to FFS
Compared MC and FFS costs with adjustments
MC total cost = capitation payments + FFS services carved out + MHD admin costs of managing contracts
FFS total costs = FFS costs + MHD admin costs for operating FFS
Compared MC eligibility groups with the same eligibility groups in FFS in non-MC parts of state
5

CATEGORIES OF SERVICES REVIEWED MC covers standard benefit minus carved-out services provided through FFS
Medical Services Covered under MC
Inpatient, outpatient, physician services, dental, mental health, transportation, etc.
Medical Services Carved out from MC Pharmacy, specialty mental health, some adult dental and transplants
Other Medical Transactions Included
FQHC and RHC wrap-around
Other medical costs transactions excluded Hospital direct payment and waiver services
6

5% GEOGRAPHIC ADJUSTMENT
The previous Mercer report comparing MC to fee-for-service (FFS) costs in 2008 used a
5% adjustment factor
For the ABD population the rural/urban difference for CY2005-2008 was 9.6%
When managed-care expanded in the central region and 2008 Mercer’s total adjustment
was 6%.
3% adjustment area
3% lower cost in the central region than the Eastern and Western regions
Medicare per capita expenditures or St. Louis and Kansas City are 4.6% higher than the
surrounding rural areas
7
Rationale: Medical care is more expensive in urban areas than in rural areas
The current SFY 2010 – 2013 analysis uses a 5% adjustment factor
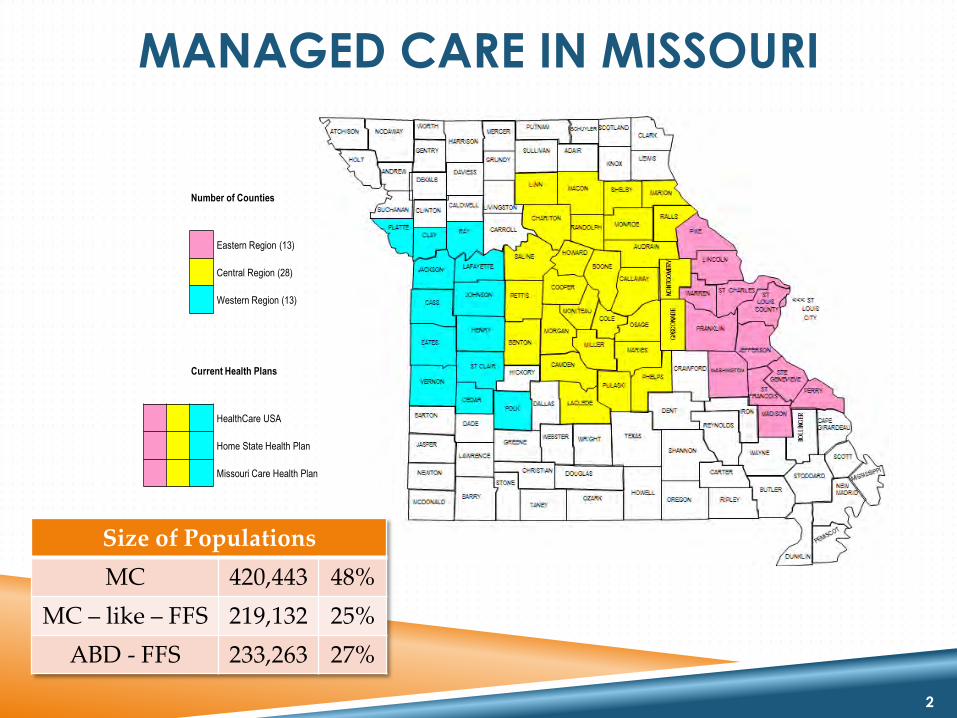
RE-ALLOCATION ADJUSTMENTS
Retroactive Eligibility and the first 15 days allowed for MC plan enrollment
Special health care needs opt out population
Specialty Behavioral Health Services - CPR, CSTAR, TCM
Pharmacy and Transplants
MHD Administrative and IT services supporting MC contracting and
payments
8

MC & FFS RETROSPECTIVE COSTS AMOUNTS REFLECT TOTAL GR AND FEDERAL EXPENSE
SFY 2010 SFY 2011 SFY 2012 SFY 2013 Average
Fee for Service (FFS)
$1.524 Billion
$1.517 Billion
$1.579 Billion
$1.644 Billion
$1.566 Billion
Managed Care (MC)
$1.501 Billion
$1.481 Billion
$1.578 Billion
$1.596 Billion
$1.539 Billion
Savings 23 Million 36 Million 2 Million 48 Million 27 Million
Percent 1.5% 2.4% 0.1% 2.9% 1.7%
9
Source: MANAGED CARE COST AVOIDANCE MODEL - December 2014
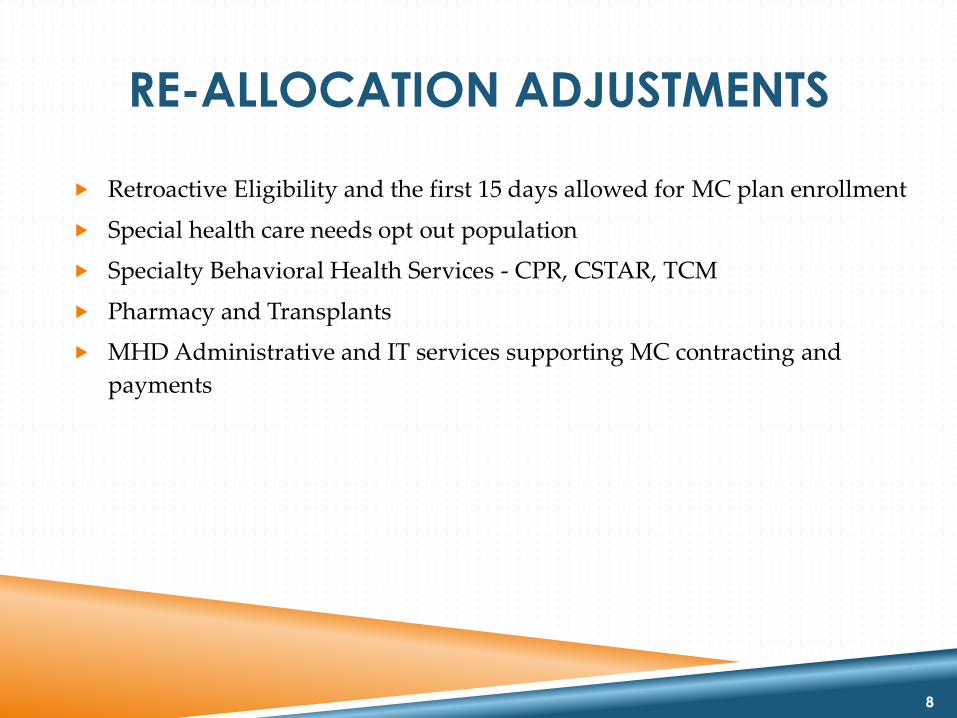
KEY FINDINGS
Annual savings in MC ranged from 0.1% to 2.9% ($2 to $48 million) over the four-year period. Much of the variation between years is due to rate increases.
The four year average annual savings was 1.7%
$5.33 PMPM
$27 million average
Compared to FFS, MC….
Reduces medical costs/payments to providers by $23.81 PMPM (8% decrease)
Increases administrative costs by $18.48 PMPM (149% increase)
For every $1 PMPM of reduced state costs due to MC, medical costs/payment to providers is reduced by $4.47 PMPM and administrative costs are increased by $3.47 PMPM
10

HOW DOES MISSOURI COMPARE?
Why lower savings in MC?
Missouri carves-out specialty behavioral health services and pharmacy services.
Missouri runs a FFS program with strong management of pharmacy and Health Homes, similar to MC.
Missouri’s unique reimbursement structure for facilities may impede the ability of MC to manage cost and utilization.
FFS provider rates that are already as low or lower than MC provider
contract rates.
11
Mercer reports that “typical” MC savings are 3-6%

ESTIMATING PROSPECTIVE IMPACT OF
EXPANDING MC IN CY 2015
Mercer estimated 2.2% savings ($14.2 million) for a typical and mature MC
program expanded to serving the remaining non-elderly, similarly participating
women and children currently in FFS.
Expected savings would be lower for at least the first two years of program.
The estimate deducts from savings 2.814% factor due to administrative costs of
the ACA health insurer fee.
Mercer also noted that achieving “typical” MC savings levels would be limited
by:
Missouri’s policy of carving out certain services such as specialty behavioral health and
FFS provider rates that are already as low or lower than MC provider contract rates.
12
COMPARING
PERFORMANCE:
UTILIZATION

UTILIZATION AND QUALITY
COMPARISONS
The results following our initial analysis by MHD in the process of being cross checked by MERCER
The cause of the variation in results could be due to several different explanations
Further analysis is in process (e.g. Behavioral Health)
14

FFS VS. MC COMPARISON:
HOSPITAL ADMISSIONS
Re-admitted more often – Higher portion of persons discharged re-admitted within 30 days (6.4% vs. 5.2%)
15
Admitted less – Enrollees with hospital admissions
(5.4% vs. 6.8%)
Discharged more quickly – Shorter average length of stay
(4.1 days vs. 5.6 days)
Compared to the same eligibility groups in FFS, MC enrollees are:

FFS VS. MC COMPARISON:
HOSPITAL ADMISSIONS
Group
% of Patients with a Hospital Admission
Average Length of
Stay
% of Patients with a Re-Admission
MCO 5.41% 4.12 days 6.43%
FFS* 6.79% 5.63 days 5.20%
16
*For similar population as MCOs
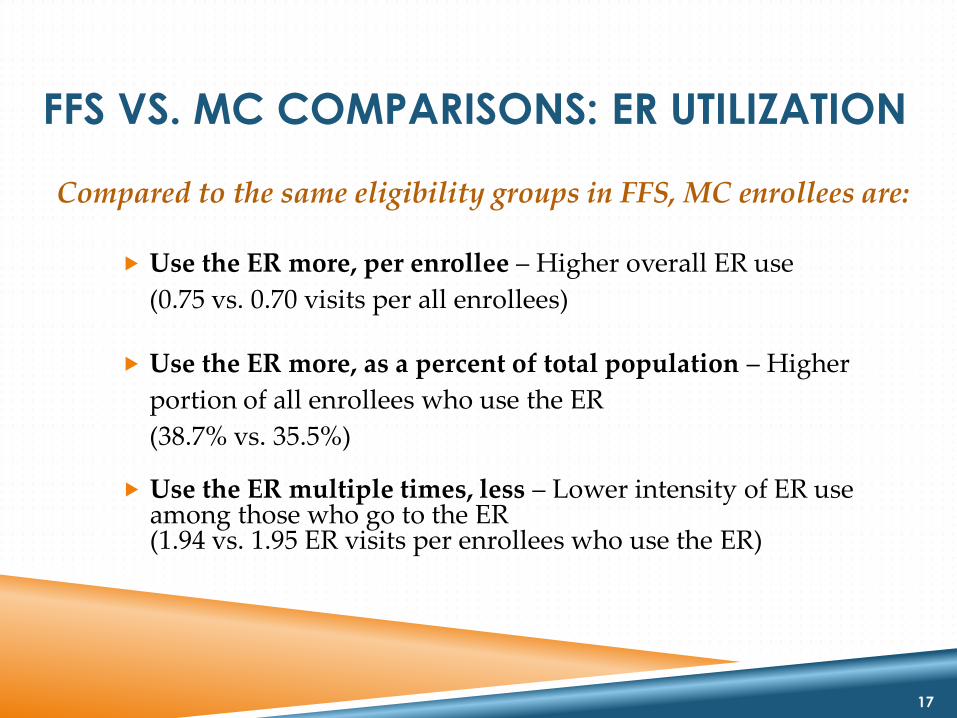
FFS VS. MC COMPARISONS: ER UTILIZATION
17
Use the ER multiple times, less – Lower intensity of ER use among those who go to the ER (1.94 vs. 1.95 ER visits per enrollees who use the ER)
Use the ER more, per enrollee – Higher overall ER use
(0.75 vs. 0.70 visits per all enrollees)
Use the ER more, as a percent of total population – Higher
portion of all enrollees who use the ER
(38.7% vs. 35.5%)
Compared to the same eligibility groups in FFS, MC enrollees are:

FFS VS. MC COMPARISONS:
ER UTILIZATION
Group
Percentage of
Patients with an ER Visit
ER Visits per
patient
ER Visits per
patient using ER
MCO 38.7% 0.75 1.94
FFS* 35.5% 0.70 1.96
18
*For similar population as MCOs

FFS VS. MC COMPARISONS:
OFFICE VISITS (E&M)
19
Visit the office multiple times, less – Lower intensity of outpatient use among those who use any outpatient (3.76 vs. 4.20 outpatient visits per enrollees who use any outpatient)
Visit the office less, per enrollee – Lower overall outpatient use
(2.40 vs. 2.93 visits per all enrollees)
Visit the office less, as a percent of total population – Lower portion
(63.7% vs. 69.5%)
Compared to the same eligibility groups in FFS, MC enrollees are:

FFS VS. MC COMPARISONS:
OFFICE VISITS (E&M)
Group
Percentage of Patients with
Outpatient Visit
PCP Visits per patient
Visits per patient using
Outpatient
MCO 63.7% 2.40 3.76
FFS* 69.5% 2.93 4.20
20
*For similar population as MCOs

COMPARING
PERFORMANCE: CLINICAL QUALITY

MC QUALITY BETTER THAN FFS
22
MC
FFS
0 10 20 30 40 50
Breast Cancer Screenings
MC
FFS
40.6%
33.8%

FFS QUALITY BETTER THAN MC
23
0 20 40 60 80 100
Postpartum Care
Diabetes Care
Alcohol & Drug Treatment Initiation
Persistent Meds - ACE Inhibitor
Persistent Meds - Anticonvulsants
MC
FFS
60.2%
47.5%
63.3% 70.6%
60.2%
39.4% 43.0%
76.9%
49.8%
70.3%
86.1%

QUALITY COMPARISONS UNDER
DEVELOPMENT
Cervical Cancer Screening
Chlamydia Screening
Diabetes Care – Cholesterol (LDL)
Alcohol & Drug Treatment Engagement
Follow up in 7 & 30 Days after Psych Hospitalization
Persistent Meds – Diuretics
Antidepressant Adherence – Acute & Continuation
Antipsychotic Adherence for Schizophrenia
Adult Body Mass Index (BMI)
24

ACTUAL MC PERFORMANCE
Clinical Quality
Lower on 5 of 6 clinical quality measures
(12 more pending)
25
Cost
Lower overall cost (1.7%)
Higher care management and administrative costs (149%)
Utilization of Services and Provider Access
Fewer hospital admissions and shorter length of stay
More readmissions after discharge and more ER visits
Fewer outpatient visits