Embed Size (px)
Citation preview
lable at ScienceDirect
Journal of Cleaner Production 18 (2010) 355–364
Contents lists avai
Journal of Cleaner Production
journal homepage: www.elsevier .com/locate/ jc lepro
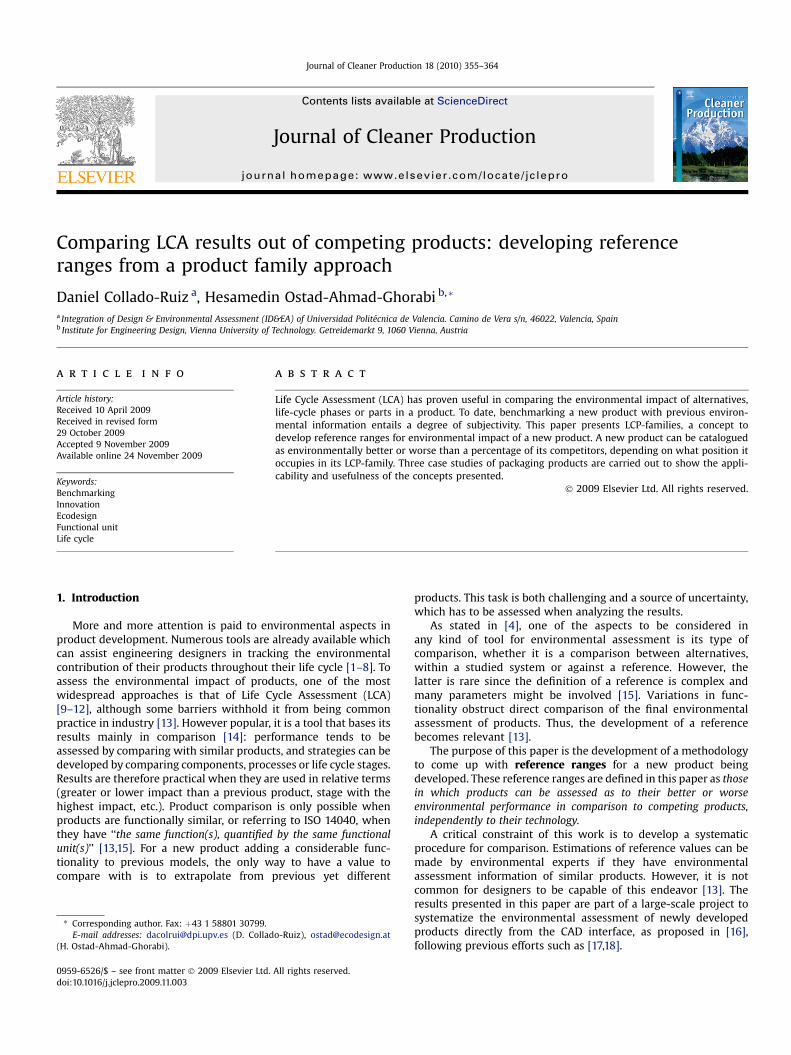
Comparing LCA results out of competing products: developing referenceranges from a product family approach
Daniel Collado-Ruiz a, Hesamedin Ostad-Ahmad-Ghorabi b,*
a Integration of Design & Environmental Assessment (ID&EA) of Universidad Politecnica de Valencia. Camino de Vera s/n, 46022, Valencia, Spainb Institute for Engineering Design, Vienna University of Technology. Getreidemarkt 9, 1060 Vienna, Austria
a r t i c l e i n f o
Article history:Received 10 April 2009Received in revised form29 October 2009Accepted 9 November 2009Available online 24 November 2009
Keywords:BenchmarkingInnovationEcodesignFunctional unitLife cycle
* Corresponding author. Fax: þ43 1 58801 30799.E-mail addresses: [email protected] (D. Collad
(H. Ostad-Ahmad-Ghorabi).
0959-6526/$ – see front matter � 2009 Elsevier Ltd.doi:10.1016/j.jclepro.2009.11.003
a b s t r a c t
Life Cycle Assessment (LCA) has proven useful in comparing the environmental impact of alternatives,life-cycle phases or parts in a product. To date, benchmarking a new product with previous environ-mental information entails a degree of subjectivity. This paper presents LCP-families, a concept todevelop reference ranges for environmental impact of a new product. A new product can be cataloguedas environmentally better or worse than a percentage of its competitors, depending on what position itoccupies in its LCP-family. Three case studies of packaging products are carried out to show the appli-cability and usefulness of the concepts presented.
� 2009 Elsevier Ltd. All rights reserved.
1. Introduction
More and more attention is paid to environmental aspects inproduct development. Numerous tools are already available whichcan assist engineering designers in tracking the environmentalcontribution of their products throughout their life cycle [1–8]. Toassess the environmental impact of products, one of the mostwidespread approaches is that of Life Cycle Assessment (LCA)[9–12], although some barriers withhold it from being commonpractice in industry [13]. However popular, it is a tool that bases itsresults mainly in comparison [14]: performance tends to beassessed by comparing with similar products, and strategies can bedeveloped by comparing components, processes or life cycle stages.Results are therefore practical when they are used in relative terms(greater or lower impact than a previous product, stage with thehighest impact, etc.). Product comparison is only possible whenproducts are functionally similar, or referring to ISO 14040, whenthey have ‘‘the same function(s), quantified by the same functionalunit(s)’’ [13,15]. For a new product adding a considerable func-tionality to previous models, the only way to have a value tocompare with is to extrapolate from previous yet different
o-Ruiz), [email protected]
All rights reserved.
products. This task is both challenging and a source of uncertainty,which has to be assessed when analyzing the results.
As stated in [4], one of the aspects to be considered inany kind of tool for environmental assessment is its type ofcomparison, whether it is a comparison between alternatives,within a studied system or against a reference. However, thelatter is rare since the definition of a reference is complex andmany parameters might be involved [15]. Variations in func-tionality obstruct direct comparison of the final environmentalassessment of products. Thus, the development of a referencebecomes relevant [13].
The purpose of this paper is the development of a methodologyto come up with reference ranges for a new product beingdeveloped. These reference ranges are defined in this paper as thosein which products can be assessed as to their better or worseenvironmental performance in comparison to competing products,independently to their technology.
A critical constraint of this work is to develop a systematicprocedure for comparison. Estimations of reference values can bemade by environmental experts if they have environmentalassessment information of similar products. However, it is notcommon for designers to be capable of this endeavor [13]. Theresults presented in this paper are part of a large-scale project tosystematize the environmental assessment of newly developedproducts directly from the CAD interface, as proposed in [16],following previous efforts such as [17,18].

Nomenclature
C Commonality indexFU Functional unit{FUp} Set of functional unit parameterrFUpr Quantity of functional unit parameterFUp Functional unit parameterFUpc Functional unit parameter, constraintFUpp Functional unit parameter, physicalI Assessed impactnFUp,Common Number of common functional unit parameters
between a product and the new product beinginvestigated
nFUp,New Number of functional unit parameters in the newproduct
a0 Constanta1, a2 Slopep Amount of products3 Term to be minimized,m Mean, used for the mean of environmental impactss Standard deviationsm Proportion factor
D. Collado-Ruiz, H. Ostad-Ahmad-Ghorabi / Journal of Cleaner Production 18 (2010) 355–364356
A set of products is necessary to serve as references for thoseranges. A systematic way to group similar products (although notcommonly used for environmental comparison) is that of productfamilies. Advantages of establishing product families have long beendefended in literature [19,20]. Further approaches have been devel-oped to use product families to rationalize product development formass customization [21–23]. Modularization concepts andapproaches for identifying modules have been developed to furtheroptimize product development [24,25]. However, in order to conve-niently facilitate environmental comparisons, the concept of productfamilies needs to be revisited to include ecodesign strategies [26].
A new form of grouping products is presented and developed:that of product families for LCA comparison (or LCA-comparisonproduct families, LCP-families). This concept spawns from the ideaof product familydof grouping products with common traitstogetherdbut adapts to the purpose doing this from environmentalpoint of view.
This is not the first effort in benchmarking LCA results ofproducts. On consumer level, Nissinen et al. [27] use the concept ofanchoring to develop usable benchmark information. Hojer et al.categorize potential LCA scenarios based on historical data [28].Similarly, the LCP-family shall constitute a benchmark that can bedeveloped already in early product development stages just afterthe product specification, allowing to set targets for environmentalimpact values to be assessed in the later stages when LCA data areavailable [29]. It will be then possible to assess whether thisproduct is performing better than most products in the market,over average but like some other products in the market, underaverage but in the range of other products or worse than mostproducts in the market.
With this assessment, the engineering designers can takedecisions to meet the environmental impact targets. Furthermore,they can retrieve information about those products that havea lower environmental impact and may use this information for theimprovement of their own design. For the development of a newproduct, the retrieved improvement strategies can be part of thespecification of the next generation of products to assist in thedesign process. Additionally to comparative assessment, lists ofimprovement strategies can be appended to them based on theirLCA results [30,31].
Fig. 1 shows that it is not only important to assess whether theproduct has a higher or lower impact, but also to what extent.LCP-families will have to consider this assessment.
The next sections present the concept of LCP-family, itsparameterization and its characteristics. In Section 5 referenceranges are derived from them for target setting. New products canbe therefore assessed, as is shown in the case studies presented inSection 6. Finally, Section 7 sums up the main conclusions of thispaper and outlines further research in this area.
2. LCP-families
To systematically develop a range in which the environmentalimpact of a product is considered to be acceptable, those productsto serve as reference should fulfill a set of requirements:
� Their life cycle assessment should share common traits.� A limited set of parameters should be able to represent their
life cycle.� Those parameters should allow scaling of the LCA results to
a point in which decisions can be made and targets can be set.In order to ensure representativeness of this scaling, thevariability of LCA results within those products should beassessable.
In general, a family is defined as a set of different products thathave a common set of traits. A product family would be a family thathas common functions, parts or properties. Product families havebeen developed in industry, mostly based on heuristics [32] byjoining together those products that have these traits in common.The functional approach has been further developed in many casesinto systematic methods [19,32,33], normally of great complexity. Itcan be seen that the group of products which is able to fulfill therequirements above goes beyond the merely functional or physicalcommonality in conventional product families.
To group products from an environmental point of view,a different sort of family with different properties is needed. To beable to distinguish it from conventional product families, they willbe named ‘‘product families for LCA comparison’’, or LCA-ComparisonProduct families, (LCP-families), since they constitute a group ofproducts that share traits that are appropriate for the comparison oftheir LCA results [34]. An LCP-family can be understood as a set ofproducts whose life cycle assessment shares a common behavior, andcan therefore be compared in a practical way. Behavior in functionalterms is defined in LCA by means of the functional unit (FU). ISO14044 defines FU as the quantified performance of a product systemfor use as a reference unit [14]. Its correct definition [35] can be usedas a base to form the LCP-family.
An LCP-family should be able to fulfill the following:
� Scalability: LCA results should be scalable when referred toa set of parameters, like those that define the FU. However,further development, as will be presented later, is needed toprepare it for scaling purposes. Results inferred from thisscaling process should be representative of the final product ata general level, although they should not be considered asa rigorous estimation. They will only be intended to be used forcomparative purposes (see Fig. 1).� Pragmatism: Carrying out an LCA is a complex process, and
potential improvements of this process will most probably beset aside if they incur in greater workload. This is particularlytrue within the design process. Therefore, LCP-families must bedefined as those that are useful for the LCA practitioner or thedesigner.

Fig. 1. Developing reference ranges to allow comparison of LCA-results.
D. Collado-Ruiz, H. Ostad-Ahmad-Ghorabi / Journal of Cleaner Production 18 (2010) 355–364 357
By LCP-families it is possible to judge whether a new producthas a high or low environmental impact. This is achieved bycalculating a reference range for the environmental impacts, as willbe shown later in this paper.
3. Functional units in LCP-families
The definition of FU implies that products with a higherquantified performance cannot be compared with those with a lowone, as they will be presumed to be found in a higher range ofenvironmental impact. From an ethical standpoint, higher perfor-mance is normally allowed higher impacts, and the correlationgenerally exists (e.g., as in a 42-inch television screen compared toone of 21 inches). The definition of the FU can be taken to compareLCA results of products through LCP-families.
However, the formulation of FU in practice tends to be toosimplified, insufficient for LCP-family purposes. In many cases, onlythe main functionality is stated, and critical parameters are notmentioned. This would be the case of defining the FU of a car askilometers driven. In this case any car would be equally comparable
Table 1Types of FUp.
Type of FUp Description Ex
Physical unit They are modeled in the form of a physicalmagnitude that represents the main functionsof the product, and thus have values to scale with
Cotr
Functionalconstraint
They constitute a constraint to design, or anadditional function or performance specificationthat the product must fulfill. Their nature can bedichotomic (true/false), or of any other whichexplains the phenomenon
Prentrso
(indifferent of horsepower or quality), as well as any other vehiclesuch as a bicycle or skates. Obviously these products satisfycompletely different and complementary demands.
Additionally, FUs can be expressed in different ways, e.g. a bot-tle’s FU could be defined as ‘‘containing a certain amount of liquid’’or ‘‘transporting a certain amount of beverage’’. Both definitionswould be suitable for an LCA, regardless of their different expres-sion and functional implications. To be able to use FUs inLCP-families, the formulation of FU needs to be systematized, hencestandardized in some sense. Common parameters of the FUs shouldbe defined. Physical magnitudes can be used as such, although thesame magnitude can have different implications.
One initial step for this is to develop an understanding of the FUin a parameterized way. The FU needs to be defined as a delimitedset of parameters, called FU parameters (FUps). Many of them will bephysical magnitudes, although most probably not all of them. Someparameters might represent other traits of the product such assecondary functions, aesthetics or intangible added value, makingthe products non comparable. Therefore, it is important to makethe division into two sorts of FUps, as shown in Table 1.
amples Unit Representation
ntained volume, lifted weight,ansmitted power, etc
m3, kg, W, etc FUpp
otection from corrodingvironment, ease of access,
ansparency, type of energyurce used, etc
y/n, 1–9 FUpc
D. Collado-Ruiz, H. Ostad-Ahmad-Ghorabi / Journal of Cleaner Production 18 (2010) 355–364358
Functional constraints are very general in nature, and should betreated differently depending on whether they classify or describethe product. Those classifying variables will be called FUpc1, andwill be:
� Additional magnitudes. They have physical units, but representa different sort of magnitude to that of the main function orfunctions. They imply restrictions in the technology or physicalimplementations that the product can have. Any sort ofphysical magnitude, if not part of the FUpps, can be an exampleof this.� Scalable subjective constraints. They can take a value out of
a subjective scale, such as 1 to 9 [36]. Examples of this arehygienic or ergonomic constraints, or the level of bonding ofthe product with the user.
Describing variables will be represented by FUpc2, and will be:
� Classifications or selections from a set of options, with a limitedsubset of answers. Examples of this are types of energy used orproduced.� Requirements as dichotomies. They set a constraint for some-
thing that has to be accomplished in the design, and aremodeled as a Boolean variable (true/false). Examples of this arerequirements for transparency or corrosion resistance.
The structure of FU is then as follows:
fFUg ¼n
FUppi ; FUpc1
j ; FUpc2k
o(1)
with i, j, k as the number of FUps necessary to meet all physical FUpsand constraints.
4. Properties of LCP-families
Due to the nature of LCA and FU, LCP-families will have a veryparticular set of properties. Their forming, as well as the relationsbetween their members, are studied in this section.
4.1. Dynamicity of LCP-families
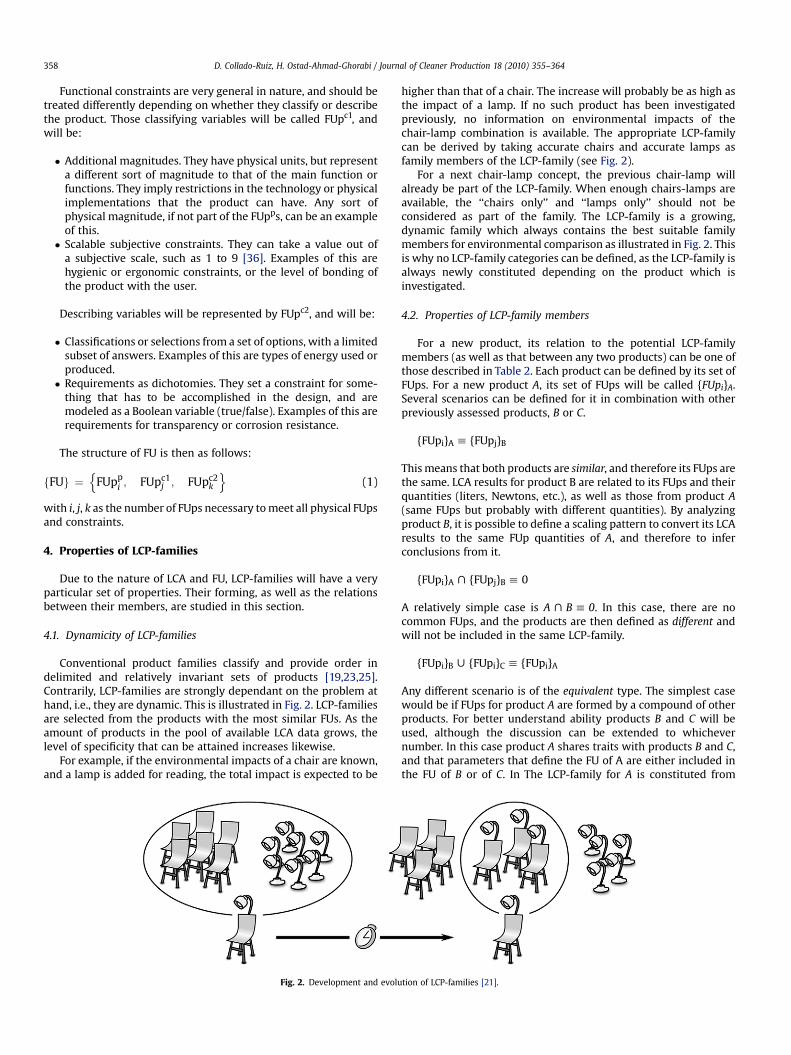
Conventional product families classify and provide order indelimited and relatively invariant sets of products [19,23,25].Contrarily, LCP-families are strongly dependant on the problem athand, i.e., they are dynamic. This is illustrated in Fig. 2. LCP-familiesare selected from the products with the most similar FUs. As theamount of products in the pool of available LCA data grows, thelevel of specificity that can be attained increases likewise.
For example, if the environmental impacts of a chair are known,and a lamp is added for reading, the total impact is expected to be
Fig. 2. Development and evolu
higher than that of a chair. The increase will probably be as high asthe impact of a lamp. If no such product has been investigatedpreviously, no information on environmental impacts of thechair-lamp combination is available. The appropriate LCP-familycan be derived by taking accurate chairs and accurate lamps asfamily members of the LCP-family (see Fig. 2).
For a next chair-lamp concept, the previous chair-lamp willalready be part of the LCP-family. When enough chairs-lamps areavailable, the ‘‘chairs only’’ and ‘‘lamps only’’ should not beconsidered as part of the family. The LCP-family is a growing,dynamic family which always contains the best suitable familymembers for environmental comparison as illustrated in Fig. 2. Thisis why no LCP-family categories can be defined, as the LCP-family isalways newly constituted depending on the product which isinvestigated.
4.2. Properties of LCP-family members
For a new product, its relation to the potential LCP-familymembers (as well as that between any two products) can be one ofthose described in Table 2. Each product can be defined by its set ofFUps. For a new product A, its set of FUps will be called {FUpi}A.Several scenarios can be defined for it in combination with otherpreviously assessed products, B or C.
{FUpi}A h {FUpj}B
This means that both products are similar, and therefore its FUps arethe same. LCA results for product B are related to its FUps and theirquantities (liters, Newtons, etc.), as well as those from product A(same FUps but probably with different quantities). By analyzingproduct B, it is possible to define a scaling pattern to convert its LCAresults to the same FUp quantities of A, and therefore to inferconclusions from it.
{FUpi}A X {FUpj}B h 0
A relatively simple case is A X B h 0. In this case, there are nocommon FUps, and the products are then defined as different andwill not be included in the same LCP-family.
{FUpi}B W {FUpi}C h {FUpi}A
Any different scenario is of the equivalent type. The simplest casewould be if FUps for product A are formed by a compound of otherproducts. For better understand ability products B and C will beused, although the discussion can be extended to whichevernumber. In this case product A shares traits with products B and C,and that parameters that define the FU of A are either included inthe FU of B or of C. In The LCP-family for A is constituted from
tion of LCP-families [21].

Table 2Types of relations between products.
Similar FUpps are the same, but they have different valuesfor the different products. Example: various bottlesof the same condition varying in their volumetriccontent.
Equivalent Some of the FUpps are the same (not necessarily withthe same values), and some others are not. There isat least one FUpp in common, and there is at least onedifference in FUpps. Example: chairs with and withoutmobility (wheels, for example). These products will beor not part of the same LCP-family depending on theproblem.
Different There are no common FUpps. Example: a diesel motorand a wooden table. There is no potential for comparison.
D. Collado-Ruiz, H. Ostad-Ahmad-Ghorabi / Journal of Cleaner Production 18 (2010) 355–364 359
products represented by B and C, and the procedure should befollowed as in the case of similarity.
{FUpi}A ˛ {FUpi}B
In this case, every FUp in A is represented in B, even if some ofthe ones in B are not represented in A. Those FUps that are notshared will have to be cancelled in order to do the scaling, i.e.their effect should be minimized, so that they do not influencethe results. A combination of the previous strategies can beused to solve a more general problem represented by{FUpi}A ˛ {FUpi}B W {FUpi}C.
Other
Another possibility is that of {FUpi}A ˛ {FUpi}B W {FUpi}C, whichis a sub-case of {FUpi}A ˛ {FUpi}B with additional mathematicalcomplexity. More difficulties might arise in case {FUpi}A ; {FU-pi}B. B might be scalable through part of the FUps in A, but notthrough all of them. Additional FUps in A could have a consider-able effect on the environmental impact, therefore makingscaling very difficult or sometimes impossible. It is a similar caseif {FUpi}A ; {FUpi}B W {FUpi}C.
4.3. Scalability
The purpose of scaling is to infer a reference range of LCA resultsfrom the environmental impacts of the LCP-family members. Thesimplest scaling is that of similar products. As an example, the caseof one single FUpp can be taken, and then extrapolated to moreFUpps. The purpose is to find out the relation between the LCAresults for the different products in the LCP-family and their FUpps,and then to calculate a reference range for the FUpp quantity of thenew product. In this scenario, the average environmental impact
Fig. 3. Scaling of similar products. Left: Relation between LCA results and FUp, Right: Relat
can be calculated out of the LCP-family as a function of its FUpps.A range can then be derived for it, where a high percentage ofLCP-family members are located. Since many problems in LCAbehave almost linearly (e.g. double weight of a same material willlead to double impact), linear scaling will be assumed and furtherinvestigated.
With several FUpps, the only increase is in the mathematicalcomplexity, as can be seen in Fig. 3. Methods, such as least squareminimization, can be applied to whatever number of FUpps.
Conclusions might also be drawn for equivalent products. A firststep is to find out which of the available products will be repre-sentative of the new product. For that, a commonality index (C) iscalculated according to the number of common FUps between thenew product and any product for which information is available(nFUp,Common). This value is divided by the total number of FUps inthe new product (nFUp,New). The commonality index C is thusdefined as:
C ¼nFUp;Common
nFUp;New(2)
In the first step, the group of products with the highest value of C isselected as reference to build a model of how the environmentalimpact should behave in relation with the FUps. To ensure repre-sentativeness, it is important that all FUps in the new product areincluded in the model. If this is not the case, additional searcheswill be carried out looking for those common FUps missing, leadingto the inclusion of some additional products into the model.
The next step is to check whether the amount of selectedproducts is enough to develop a consistent model that can beminimally assessed. For scaling purposes, the minimum number ofproducts to be compared with and the number of FUpps are related.A linear model is possible if the number of products is at leastAmount of FUpp þ 1. For the case of only one FUpp this scenariowould be equal to drawing a linear graph through two points (seeFig. 4). From an assessment point of view, such a model would notbe reliable, since no reference range can be defined to judgewhether the product is doing same, better or worse from anenvironmental point of view (see Fig. 4). Additionally, there is noextra information to check the consistency.
To draw consistent conclusions, the number of available prod-ucts needs to be at least Amount of FUpp þ 2. In this case, not onlya line can be drawn through the averages, but also ranges can beestablished for the products (see Fig. 4). If there are as manyproducts as Amount of FUpp þ 3, the model will potentially beconsistent as will be shown later in the case study.
Embedding the approach and the calculations of C discussedabove into a computer based algorithm will help to build theLCP-family automatically out of the new product’s FUps. Fig. 5shows this algorithm.
ion between LCA results and two FUps, with the additional mathematical complexity.

Fig. 4. Evolution of the linear model depending on the amount of products assessed.
D. Collado-Ruiz, H. Ostad-Ahmad-Ghorabi / Journal of Cleaner Production 18 (2010) 355–364360
5. Deriving ranges
The average value for environmental impact of the LCP-family(m) is derived by trying to minimize the deviation (linear regressionmodel and least square formulation for the problem). Nevertheless,due to the differences in life cycle inventories, the environmentalimpact of the products will differ from this average. Once the modelfor the average is built, the deviation for each product can becalculated.
To derive the ranges, the products within the LCP-family will beconsidered as a sample of a bigger population. Therefore, statisticslike standard deviation (s) can be used to assess how muchdispersion the population has. Nevertheless, it must be treated ina particular way, since the mean of the environmental impactdepends on the quantities of the FUpps (m(rFUp
i r)). The standarddeviation shall be defined as proportional to this mean (s ¼ sm$m
where sm is the proportion factor), since the higher theassessed environmental impact, the higher the potential variation.
Fig. 5. Algorithm to derive LCP-families.
To calculate s as a percentage of m, the following formula (for oneFUpp) will be used:
s�jFUppj
�¼ sm$m
�jFUppj
�
¼
ffiffiffiffiffiffiffiffiffiffiffiffiffiffiffiffiffiffiffiffiffiffiffiffiffiffiffiffiffiffiffiffiffiffiffiffiffiffiffiffiffiffiffiffiffiffiffiffiffiffiffiffiffiffiffi1n
$Xn
i
xi � m
�jFUpp
i j�
m�jFUpp
i j�
!2vuuut $m
�jFUppj
�(3)
This way, the deviation in percentage is assessed. Different rangescan be defined, depending on if they intend to include more or lesspercentage of the products. Twice the value of sigma is an advisablefigure, since most of the products (over 95%) will be included in therange. This range would go between m� 2$s and mþ 2$s. Newproducts with a lower impact than m� 2$s are environmentallyoutperforming most of the LCP-family. Products with a higherimpact than mþ 2$s have an excessively high environmentalimpact for their FU. The range for the impact, I, when applying sm,will thus be:
m� 2$s < I < mþ 2$s Def : s ¼ sm$mm� 2$sm$m < I < mþ 2$sm$m
m$�1� 2$sm
��I < m$
�1þ 2$sm
� (4)
Additionally, products within the range of the LCP-family can bedivided in those over and those under average. That way, it is alsopossible to evaluate the performance products within this range.Thanks to the ranges presented in Table 4, it is possible to informthe designer or the LCA-practitioner about how well the product isenvironmentally performing in comparison to the other products inthe LCP-family. This gives a relative value, which is more easilyinterpretable than absolute figures.
6. Case study
In order to clarify the different concepts about LCP-families,dynamicity and scalability, a case study is developed for 32packages, comprising: one-way bottles, reusable bottles, cans,boxes, bagsdboth paper and plasticdTupperware and bothaluminum and plastic foils. A database was developed in whichthe following data was recorded for each of the consideredproducts:
� Life cycle inventory data for all life cycle phases (materials,manufacture, distribution, use and end of life). Available datafrom the Ecoinvent database [37] was used. Assessment wasconducted for this inventory, not going further on weightingand normalization. To calculate the environmental impacts ofthe different products, the impact category indicator Cumula-tive Energy Demand (CED) (in MJ), available in the LCA soft-ware SimaPro [38] was taken. Any other impact categoryindicator (e.g. CO2-eq, SO2-eq, etc.) could also serve the aim ofthe calculations. CED was used since, as opposed to others likeEDIP [39], it can provide a single score that is representative of

D. Collado-Ruiz, H. Ostad-Ahmad-Ghorabi / Journal of Cleaner Production 18 (2010) 355–364 361
environmental impact. Although some precision in the envi-ronmental assessment might be lost (like with the use of toxicsubstances), it will be correlated with most environmentalimpacts.� Definition of FU for each product. Its definition was organized
by using FUps as stated in the previous sections.
Once the database was set, several new products were investi-gated and assessed according to the previously introducedapproaches and algorithms:
� A steel can, similar to those included in the database. Thisproduct has a relatively simple inventory and functional unit,making its scalability easy when compared to similar productswith similar constraints.� A PET bottle, similar to those included in the database. In this
case, the higher number of FUps sets a more interesting target.� A glass wine bottle, similar to bottles included in the database.
It has no perceptible difference in FUpps when compared toother bottles, but it also has a very different performance thanthat of, for example, PET reusable bottles. This shows theimportance of analyzing FUpcs. No individual study can beperformed out of other glass bottles, so a rough estimate has tobe obtained out of bottles in general. The sorts of conclusionsthat can be extracted are considerably different.
Fig. 6. Reference ranges for the steel can.
6.1. Case A
The FU of the steel can, with a volume of 0.2 liters, can bephrased as ‘‘containing 0.2 l of matter’’. This can be defined bya single FUpp named ‘‘Volume contained’’, with a quantity of0.2 liters.
Taking the algorithm to define LCP-families as presented inFig. 5, five products with identical FUpps and similar FUpcs can bedetected in the database: an aluminum can, a can made ofa mixture of aluminum and PP, two food steel cans and a steelbeverage can.
With these five products, it is possible to set up a consistentmodel, since the criterion Amount of FUpp þ 2 is fulfilled for thefamily, as the only FUpp considered is the volume of the products.
In order to set up a reference range for the environmentalimpact, an averaged impact (m) needs to be calculated. The generalformula for a linear model takes the following form:
m�
FUppi
�¼ a0 þ
Xn
i¼1
ai$��FUpp
i
�� (5)
where a0 is a constant, ai the slope, jFUppi j constitutes the quantity
of FUppi and n is the amount of defined FUpps.
The only FUpp describing all the products in the LCP-family ofthe can is ‘‘volume’’. For this case, formula (5) turns to be:
mðVolumeÞ ¼ a0 þ a1$Volume (6)
For each of the products within the constituted LCP-family, theenvironmental impact is known, since it is assessed using theinventory data. To calculate a0 and ai, Least Square method isapplied to the problem. According to it, the best fit for the equationis when the sum of squared residuals is a minimum. For the casestudy, following condition has to be fulfilled:
3 ¼Xp
j¼1
�Ij � m
����FUppjj��2
/min (7)
with p as the amount of the products in the LCP-family. For theLCP-family of the studied steel can p ¼ 5 is valid.
Newton-Raphson iterative method was used to solve equation(7). Solving the problem, the following solutions are retrieved forthe case study:
3min ¼ 2:11a0 ¼ 1:72a1 ¼ 4:26
(8)
Therefore, the model for the average is:
mðVolumeÞ ¼ 1:72þ 4:26$Volume (9)
Inserting the volume of 0.2 liters of the investigated steel can into(9) gives the averaged impact for the new can which is:
mð0:2Þ ¼ 1:72þ 4:26$0:2 ¼ 2:57 MJ (10)
To calculate the reference range, the standard deviation (s) is used.In this case, formula (3) will become:
sðVolumeÞ ¼
ffiffiffiffiffiffiffiffiffiffiffiffiffiffiffiffiffiffiffiffiffiffiffiffiffiffiffiffiffiffiffiffiffiffiffiffiffiffiffiffiffiffiffiffiffiffiffiffiffiffiffiffiffiffiffi1n
$Xn
i
xi � mðVolumeÞ
mðVolumeÞ
2vuut $mðVolumeÞ (11)
When the numerical values are introduced in the previous formula:
sðVolumeÞ ¼ 0:20$mðVolumeÞ (12)
Table 4 sums up the results of the calculations above for each of theproducts. The new can is presented in bold typeface.
The reference range will therefore go from 1.54 MJ to 3.60 MJ.95% of products with the same FUpps are expected to be found inthis range. From the average value 2.57 MJ to each of those limitsthe better-performing and worse-performing products within thisrange can be found.
Fig. 6 shows the plot of the products within the LCP-family, theplot of the reference ranges and the position of the new can.
The only product that considerably outperforms the average isthe steel drinking can, due to its better weight-to-volume ratio.Therefore, this information should be considered for the develop-ment of the new product.
6.2. Case B
Case B deals with a new PET bottle to be designed and assessed.Its FU can be phrased as following: ‘‘Containing 0.33 l of matter andcapable of 30 storages’’. The PET bottles are described by two FUpps:volume and number of storages (this is equal to number of cycles in

Table 4Summary of calculations.
Product Volume(l)
Assessedimpact I(MJ)
Averagedimpact m
(MJ)
Standarddeviation(s)
Lowerlimit(MJ)
Higherlimit(MJ)
Aluminum can 0.33 4.04 3.13 0.63 1.88 4.38PP þ Alum can 0.33 3.32 3.13 0.63 1.88 4.38Food can (steel) 0.5 3.30 3.85 0.77 2.31 5.39Food can (steel) 0.6 4.62 4.28 0.86 2.57 5.99Steel drinking can 0.33 2.22 3.13 0.63 1.88 4.38New can 0.2 2.15 2.57 0.514 1.54 3.60
D. Collado-Ruiz, H. Ostad-Ahmad-Ghorabi / Journal of Cleaner Production 18 (2010) 355–364362
which it is going to be reused). The new bottle to be investigatedhas a volume of 0.33 liters and is designed for 30 use cycles.
The database contains data of five PET bottles. These bottles aretaken to form the LCP-family. The followed approach to calculatethe average environmental impact (m) and the reference range isthe same as described for case A. Since there are two FUpps involvedto describe the bottles, the general formula in (5) takes thefollowing form:
m�FUpp
1; FUpp2
�¼ a0 þ a1$
��FUpp1
��þ a2$��FUpp
2
�� (13)
With ‘‘volume’’ and ‘‘number of storages’’ as the two FUps of theproduct, the more specific form is:
mðVolume; Number of storagesÞ¼ a0 þ a1$Volumeþ a2$Number of storages (14)
Again, Least Square method is applied to solve the problem inequation (7). By doing so, equation (14) turns into:
mðVolume; Number of storagesÞ¼ �72:1þ 45:84$Volumeþ 7:23$Number of storages
(15)
Inserting the volume of 0.33 liters and the number of storages of 30into (14), the averaged impact would be of 160.09 MJ. Using thestandard deviation in (3) a reference range can be obtained. Thelower limit follows to be 154.32 MJ and the higher limit is165.90 MJ. The assessed impact I for the PET bottle is I ¼ 105.20 MJ;it lies below the lower limit of the range and is therefore per-forming better than 95% of similar products. The product is to befound, according to Table 3 in the green area.
6.3. Case C
In case C, a group of products can be found with identical FUpps,but their number is insufficient for a proper calculation. Therefore,some solutions are presented. The product modeled is a wine bottleof volume 0.7 liters that gets reused 20 times in average. Thedatabase includes three more reusable glass bottles, see Table 5.
Since the product has two FUpps, there should be at least fourproducts to fulfill Amount of FUpp þ 2 criterion. Since the Amount ofFUpp þ 2 criterion is not met (for this case study only Amount ofFUpp þ 1 is valid), no dispersion can be studied, and therefore noranges can be defined. Inferring the impact from Amount ofFUpp þ 1 criterion would be equal to extrapolating from a lineargraph defined by two points, see Fig. 4.
Two alternative approaches can be taken at this point, withdifferent levels of abstraction:
� Alternative 1: The one derived from the algorithm for derivingLCP-families: if the criterion Amount of FUpp þ 2 is not met, the
Table 3Areas to assess the performance of a new product.
Green area I < ð1� 2$smÞ$m Good performanceYellow-green
areað1� 2$smÞ$m < I < m Performance similar to other
well-performing products.Orange area m < I < ð1þ 2$smÞ$m Performance similar to other
products, but can be improvedimitating successful strategiesfrom other products.
Red area ð1þ 2$smÞ$m < I Bad performance. Strategies ofsuccessful products (or fromalmost any product within theLCP-family) should be followed.
most similar products from the database will be selected. Inthis case, other bottles that have a high commonality index Cwill be included in the study.� Alternative 2: Considering the new wine bottle to develop the
model. Although less rigorousdand giving less informa-tiondthis will tell if the newly developed product is among thebest or worst performing products.
If alternative 1 is taken, the analysis is performed by all bottles inthe database. Deviation is expected to be higher than in theprevious cases, so the ranges will probably be wide. The experimentis initially carried out for all bottles with the same two FUpps, aswell as common FUpcs. Calculating the values of a0, a1 and a2 byapplying Least-Square method, equation (13) turns into:
mðVolume; Number of storagesÞ¼ �107:50þ 58:90$Volumeþ 8:10$Number of storages
(16)
In this case, the standard deviation (s) is of 0.001 times the mean(m) for each product.
As can be seen in Table 6, the environmental impact of the newwine bottle is, 219.79 MJ and is over the range [88.06, 100.68].Therefore, it has a higher environmental impact than it should.Additional search reveals that it takes more water per liter whilewashed, because of its shape, so in order to perform better thanother products, this issue should be addressed. The better mod-elsdthose closer to their lower limit than to their higher limit, suchas the PET bottle of 1.5 liters or the 0.33 liter glass bottledcan betaken as a reference as to which parameters have lead to the lowerenvironmental impact and retrieve improvement strategies for thenew product.
In alternative 2 a model is to be developed with the products inthe database and the new product. The criterion Amount of FUpp þ 2of available products will then be met. If the product has a diver-gently high environmental impact, it will still be over the averagevalue. It will be much more difficult, however, for it to be beyondthe limits.
Adding the wine bottle to the LCP-family and solving equation(13) results in:
a0 ¼ 69:34a1 ¼ 134:19a2 ¼ 2:30
(17)
and (16) changes to:
Table 5Glass bottles defined in the database.
Product Volume(l)
No. ofstorages(#)
Assessedimpact MJ)
Glass bottle (water) 1 40 285.34Glass bottle (refreshment) 0.33 40 226.02Glass bottle (refreshment) 0.2 30 143.79

Table 6Products and ranges for case study C.
Product Volume(l)
No. ofstorages
Assessed impact I(MJ)
Averaged impact m
(MJ)Standarddeviation(s)
Lower limit(MJ)
Higher limit(MJ)
Glass bottle 1 40 285.34 272.62 9.11 254.40 290.85PET bottle 1.5 30 209.25 221.79 7.41 206.97 236.62PET bottle 1.25 30 208.67 207.06 6.92 193.22 220.90PET bottle thin 1.5 20 140.36 141.51 4.73 132.04 150.97PET bottle slim 1.5 15 105.86 101.36 3.39 94.59 108.14Glass bottle 0.33 40 226.02 233.15 7.79 217.56 248.73PET bottle 0.5 30 166.28 162.88 5.44 151.99 173.76Glass bottle 0.2 30 143.79 145.20 4.85 135.49 154.90New wine bottle 0.7 20 219.79 94.37 3.15 88.06 100.68
D. Collado-Ruiz, H. Ostad-Ahmad-Ghorabi / Journal of Cleaner Production 18 (2010) 355–364 363
mðVolume; Number of storagesÞ¼ 69:34þ 134:19$Volumeþ 2:30$Number of storages
(18)
This would give a lower limit of 167.10 MJ and a higher limit of251.24 MJ. Since the wine bottle has an environmental impact of219.80 MJ, it would be performing within the LCP-family rangedaswas predicteddbut closer to the higher limit. Therefore, improve-ments would need to be done on the bottle, potentially looking forideas in better-performing products such as the 0.33 liter bottle.
7. Conclusion
When an LCA is carried out, the results tend to have the formof absolute values for environmental impacts. People withLCA experience might be able to assess these values, althoughengineering designers will have to rely on previous studies. Forinnovative products, those studies will probably not be available.For decision-making, it is necessary to have an evaluation of howmuch environmental impact is acceptable for the new product.LCP-families use available environmental information to bench-mark new products, so they can be assessed as having alike, betteror worse environmental behavior than its family members.
LCP-families group different products based on FU similarity, forwhich a standardized formulation of FUs was introduced. Averageenvironmental impact of products in the LCP-family is scaledaccording to their FUpps. By calculating the standard deviation (s) itis possible to assess whether the product is performing better orworse than most competitor products. With a 2$s approach, rangescomprise 95% of the total population of products.
It has been seen in this paper that the validity and rigor of thecalculations and LCA-results strongly depends on two points:
� The amount of available products to compare with. Lownumbers of products will generate wide ranges, and notenough information can be drawn from them.� The precision in the definition of the FU and FUps. Lack of
standardization of FUps can lead to problems in wording orlevel of detail, and that to inappropriate selection of LCP-familymembers.
Representativeness of the selection of LCP-family members hasbeen verified through the case studies. In all three cases, mathe-matical models were successfully set up for target-setting. For thenew products, their impact was categorized as a high or low (overor under 95% of the products), as well as over or under average. Thisgave a total of four ranges.
In order to comply with scalability and pragmatism require-ments, LCP-families need to have dynamic nature. Although
making them more difficult to understand, this property ensuresthe effectiveness in finding solutions to the problem, as was seen inthe case studies.
To fully implement LCP-families into a product developmentenvironment, some additional steps are still to be taken. The mostimportant is to develop a standardized definition for FUs by usingaccurate FUps. One of the authors’ main lines of further research isto study additional products to gain insight in the behavior of FUs.
In a bigger scope, the final purpose is the inclusion of scalingpossibilities in CAD software [40]. This will constitute one stepfurther in integrating environmental assessment into the designprocess. Most engineering designers handle enough information tocarry out an environmental assessment after all. Being able to settargets for environmental impacts should facilitate the consider-ation of environmental criteria within the decision-makingprocesses in product development.
References
[1] Ostad-Ahmad-Ghorabi H, Wimmer W. Tools and approaches for innovationthrough ecodesigndSustainable product development. Journal of MechanicalEngineering Design 2005;8(2):6–13.
[2] Lofthouse V. Ecodesign tools for designers: defining the requirements. Journalof Cleaner Production 2006;14(15–16):1386–95.
[3] Karlsson R, Luttropp C. EcoDesign: what’s happening? An overview of thesubject area of EcoDesign and of the papers in this special issue. Journal ofCleaner Production 2006;14:1291–8.
[4] Finnveden G, Moberg A. Environmental systems analysis toolsdan overview.Journal of Cleaner Production 2005;13:1165–73.
[5] Simon M, Evans S, McAloone TC, Sweatman A, Bhamra T, Poole S. EcodesignNavigatordA Key resource in the drive towards environmentally efficientproduct design. Manchester, UK: Manchester Metropolitan University,Cranfield University & EPSRC; 1998.
[6] Ernzer M, Birkhofer H. 2002. Selecting methods for life cycle design based onthe needs of a company. In: D. Marjanovic, editor. Proceedings of the Design2002d7th International Design Conference. Dubrovnik (Croatia), 2002:1305–1310.
[7] Wrisberg N, Udo de Haes HA, Triebswetter U, Eder P, Clift R. Analytical tools forenvironmental design and management in a systems perspective. Dordrecht:Kluwer Academic Publishers; 2000.
[8] Mizuki C, Sandborn PA, Pitts G. Design for environment- A survey of currentpractices and tools. Proceedings of International Symposium on ElectronicsIEEE 1996:1–6.
[9] Jeswiet J, Hauschild M. EcoDesign and future environmental impacts. Mate-rials & Design 2005;26(7):629–34.
[10] Germani M, Mandorli F, Corbo P, Mengoni M. How to facilitate the use of LCAtools in SMEsda practical example. In: Proceedingsof 12th SETAC Europe LCACase Studies Symposium, 2004: 163–166.
[11] Nielsen PH, Wenzel H. Integration of environmental aspects in productdevelopment: a stepwise procedure based on quantitative life cycle assess-ment. Journal of Cleaner Production 2002;10:247–57.
[12] Erzner M, Gruner C, Birkhofer H, 2001. Implementation of DfE in the daily designworkdan approach derived from surveys. In: Proceedings of 2001 ASME DesignEngineering Technical Conference (DETC 2001), Pittsburgh, 2001.
[13] Millet D, Bistagnino L, Lanzavecchia C, Camous R, Poldma R. Does the potentialof the use of LCA match the design team needs? Journal of Cleaner Production2007;15:335–46.
[14] ISO 14044. Environmental managementdLife cycle assessmentdRequire-ments and guidelines (ISO 14044:2006). Brussels: CEN (European Committeefor Standardisation); 2006.

D. Collado-Ruiz, H. Ostad-Ahmad-Ghorabi / Journal of Cleaner Production 18 (2010) 355–364364
[15] Keoleian GA, Kar GA. Elucidating complex design and management tradeoffsthrough life cycle design: air intake manifold demonstration project. Journal ofCleaner Production 2003;11:61–77.
[16] Ostad Ahmad Ghorabi H, Bey N, Wimmer W. Parametric ecodesigndanintegrative approach for implementing ecodesign into decisive early designstages. In: Marjanovic D, editor. Proceedings of the Design 2008d10th Inter-national Design Conference. Dubrovnik (Croatia), 2008: 1327–1334.
[17] Roche T. The design for environmental compliance workbench tool. In:Talaba D, Roche T, editors. Product engineering. eco-design, technologies andgreen energy. Springer; 2004. 2004.
[18] Otto HE, Kimura F, Mandorli F, Germani M. Integration of CAD models with LCA.In: Proceedings of EcoDesign 2003: Third International Symposium on Envi-ronmentally Conscious Design and Inverse Manufacturing. Tokyo, Japan; 2003.
[19] Erens F, Verhulst K. Architectures for product families. Computers in Industry1997;33:165–78.
[20] Lenau T, Frees N, Olsen SI, Willum O, Molin C, Wenzel H. Ecodesign in productfamiliesda handbook. Copenhagen, Denmark: Danish EnvironmentalProtection Agency; 2002. MiljøNyt Nr. 67.
[21] Jiao J, Tseng MM, Dufty VG, Lin F. Product family modeling for masscustomization. Computers & Industrial Engineering 1998;35(3–4):495–8.
[22] Jiao J, Tseng MM. A methodology of developing product family architecture formass customization. Journal of Intelligent Manufacturing 1999;10(1):3–20.
[23] Thevenot HJ, Simpson TW. Guidelines to minimize variation when estimatingproduct line commonality through product family dissection. Design Studies2007;28:175–94.
[24] Stone RB. A heuristic method for identifying modules for product architec-tures. Design Studies 2000;21(1):5–31.
[25] Muffatto M, Roveda M. Developing product platforms: analysis of the devel-opment process. Technovation 2000;20:617–30.
[26] Kobayashi H. Strategic evolution of eco-products: a product life cycle planningmethodology. Research in Engineering Design 2005;16(1):1–16.
[27] Nissinen A, Gronroos J, Heiskanen E, Honkanen A, Katajajuuri JM, Kurppa S,et al. Developing benchmarks for consumer-oriented life cycle assessment-
based environmental information on products, services and consumptionpatterns. Journal of Cleaner Production 2007;15:538–49.
[28] Hojer M, Ahlroth S, Dreborg KH, Ekvall T, Finnveden G, Hjelm O, et al.Scenarios in selected tools for environmental systems analysis. Journal ofCleaner Production 2008;16:1958–70.
[29] Lindahl M. Engineering designers’ requirements on design for environmentmethods and tools. PhD Thesis KTH, Sweden, 2005.
[30] Luttropp C, Lagerstedt J. EcoDesign and The Ten Golden Rules: generic advicefor merging environmental aspects into product development. Journal ofCleaner Production 2006;2006(14):1396–408.
[31] Wimmer W, Zust R. ECODESIGN Pilotdproduct investigation, learning andoptimization tool for sustainable product development. Ecodesign PILOT.Netherlands: Kluwer Academic Publishers; 2001.
[32] Dahmus JB, Gonzalez-Zugasti JP, Otto KN. Modular product architecture.Design Studies 2001;22:409–24.
[33] Alizon F, Shooter SB, Simpson TW. Improving an existing product family basedon commonality/diversity, modularity and cost. Design Studies2007;28(4):387–409.
[34] Ostad-Ahmad-Ghorabi H. Parametric Ecodesignddevelopment of a frame-work for the integration of life cycle assessment into computer aided design.Unpublished PhD Thesis, Vienna University of Technology.
[35] Krozer J, Vis JC. How to get LCA in the right direction? Journal of CleanerProduction 1998;6:53–61.
[36] Saaty TL. The analytic hierarchy process. McGraw Hill; 1980.[37] Ecoinvent Centre. Swiss Centre for Life Cycle Inventories. 2008.[38] Sima Pro. life cycle assessment software, version 7.0, Netherlands; 2008.[39] Wenzel H, Hauschild M, Alting L. Environmental assessment of products,
vol. 1: methodology, tools and case studies in product development. London,UK: Chapman & Hall; 1997.
[40] Ostad-Ahmad-Ghorabi H, Collado-Ruiz D, Wimmer W. Towards IntegratingLCA in CAD. In Norell M, Grimheden M, Skogstad P, editors. Proceedings of theInternational Conferenceon Engineering Design. Stanford, California, USA,2009. 7: 301–310.