Embed Size (px)
Citation preview
Public Library Funding:
Comparing Charlotte Mecklenburg Library and
Selected Library Systems (FY 2008–FY 2012)
A Report Prepared for the Charlotte Mecklenburg Library
By the UNC Charlotte Urban Institute
March 2012

ACKNOWLEDGEMENTS
The Charlotte Mecklenburg Library commissioned the University of North Carolina at Charlotte Urban Institute to conduct this study of local government funding of public library systems as an update to the 2011 report conducted by the Institute for the Future of the Library Task Force. This work was funded by the Charlotte Mecklenburg Library.
The Institute would also like to acknowledge the staff of the Charlotte Mecklenburg Library, in particular Finance Director Charles J. Mallas and library consultant Sean Hogue who provided details on the Library’s financial data, and Chief Executive Officer Vick Phillips for providing guidance and feedback. Finally, a special thank you to the staff from the thirteen comparable library systems. Without their input and cooperation, this study would not have been possible.
About the Charlotte Mecklenburg Library
In 1891, a group of citizens formed what is now known as the Charlotte Mecklenburg Library. Today the Library has 20 locations, including the Main Library in Uptown Charlotte, and continues to provide learning services and outreach to the citizens of Mecklenburg County. According to the Library’s website, the Library serves some 3.4 million patrons who come through its doors, and lends over 5.5 million items annually. To learn more about the Charlotte Mecklenburg Library, visit http://www.cmlibrary.org/.
About the Authors & Research Team
The Institute’s research team was led by Social Research Specialist Eric Caratao, who coordinated the research efforts for collecting secondary data and served as the primary author for this report. Additional support was provided by Graduate Research assistant Rebecca Schell. UNC Charlotte Urban Institute Director Jeff Michael and Senior Associate Director Linda Shipley provided guidance and oversight throughout the research process.
About the UNC Charlotte Urban Institute
The UNC Charlotte Urban Institute (“the Institute”) was created in 1969 as a non-profit, non-partisan, applied research and consulting service outreach unit of the University of North Carolina at Charlotte. The Institute provides a wide range of services to the region and beyond in fulfillment of its mission to seek solutions to the economic, environmental, and social challenges facing our communities. For more information about the Institute, visit http://ui.uncc.edu/.

EXECUTIVE SUMMARY
In this report, we provide findings from a project in which researchers from the University of North Carolina at Charlotte’s Urban Institute (the Institute) compared the general funding levels received by fourteen library systems from fiscal year 2008 to 2012. The results are based on Charlotte Mecklenburg Library and thirteen comparable library systems in the country. This report is a revisit of a 2011 report that the Institute conducted for the Charlotte Mecklenburg Future of the Library Task Force.
Research and Findings
In January 2012, the Charlotte Mecklenburg Library retained the Institute to collect and present information about governmental revenues and library funding for 13 particular communities for FY 2012. The key questions and findings are the following:
How do the local governments in the study compare in the size of the annual revenues and expenditures budgets?
The average General Fund revenue for the 14 communities studied was approximately $777 million during FY 2012, which was an increase of 1.1% when compared to FY 2011. In comparison, the average General Fund expenditures was approximately $781 million, a 1.0% increase from last year’s budget. Mecklenburg County is one of only two communities (the other being Baltimore County) to have General Fund revenues and expenditures over the $1 billion mark for all years studied (FY 2008 through FY 2012). Mecklenburg County budgets show slightly larger than average declines in General Fund revenue from fiscal years 2008 to 2011, and more than average increase in FY 2012. However, the County’s General Fund expenses in FY 2012 were about the same in FY 2008.
How do the local governments in the study compare in the major public services they are responsible for funding?
Mecklenburg County is comparable to most other communities in the study in funding all four major public services: schools, public safety, parks & recreation, and of course, public libraries. It is less comparable to Austin, Dallas, Greensboro, or Jacksonville/Duval, which do not fund schools, or to Durham County, which does not fund parks & recreation. Among all the 14 communities compared, the top expenditure was either Public Education or Public Safety.
How do the l ibrary systems in those communit ies compare in the size of the revenues and expenditures budgets?
The average General Fund revenue for the 14 library systems was approximately $22 million during FY 2012, which was a decline of -2.5% from FY 2011. In comparison, the average General Fund expenditures were approximately $23 million, -4.4% less than last year’s budget. Between FY 2008 and FY 2012 the average General Fund revenues for the 14 library systems declined by -13.7%, while the average General Fund expenditures declined by -13.8% during the same period.
Charlotte Mecklenburg Library’s FY 2012 budgeted revenues are above average, both in total revenues ($27 million) and in General Fund revenues ($26 million), although the library experienced one of the largest reductions from FY 2008 levels among the 14 library systems compared. In fact, the Charlotte Mecklenburg Library received a much greater reduction in funding, on average, than did the majority of libraries in the other communities over the five-year period. Dallas Public Library

and Tampa-Hillsborough County Public Library were the only other library systems to suffer greater loss in revenue than Charlotte Mecklenburg Library.
Charlotte Mecklenburg Library’s FY 2012 Total Revenue budget on a per capita basis ($29.34) (reflecting Mecklenburg County population) is below the group average ($30.21). In the four years prior (fiscal years 2008 through 2011), they were above the group average. The Total Revenue per Capita decreased for Charlotte Mecklenburg Library between fiscal years 2011 and 2012 (from $33.86 to $29.34). The FY 2012 expense budget on a per capita basis for Charlotte Mecklenburg Library ($29.34) is almost equal to the group average ($29.36), although it was well above the average in fiscal years 2008 through 2010 and slightly above for FY 2011. Charlotte Mecklenburg Library’s General Fund revenue budgets on a per capita basis was also well above the average in fiscal years 2008 through 2010, but declined in the last two fiscal years to be just slightly above the average. The General Fund revenue on a per capita basis decreased for Charlotte Mecklenburg Library between fiscal years 2008 and 2012 (from $40.86 to $28.98).
How do the l ibrary systems in those communit ies compare in the major expenses categories they administer through their budgets?
Five of the library systems were responsible for all the expense categories (building maintenance; building security; human resources; information technology; communications; and utilities) examined. Charlotte Mecklenburg Library, on the other hand, administers fewer of the major expense categories through its budget than ten of the other library systems. Based on the recommendations of a joint County-Library steering committee, Charlotte Mecklenburg Library turned over responsibility for both human resources and information technology to the county. As of FY 2012, the library is only budgetary responsible for utilities and communications.
What is the relative impact of the national economic si tuation on local government and l ibrary budgets in those communit ies?
The recent economic conditions over the last five years have resulted in the shrinkage of General Fund revenues for local governments and their library systems. Overall, the results show an average decline of -13.7% over five years in the library’s General Fund revenue while their local government experienced an average drop of -2.9% in General Fund revenue over the same period. This indicates that while the economy has disrupted the tendency of library system General Fund Revenue budgets to move in tandem with those of their local governments, library systems are associated with larger proportional differences in the degree of change in the two sets of budgets. For instance, in the most recent budget cycle, only three communities saw their General Fund revenue decline while ten of the library systems saw a loss in their General Fund revenue. In the case of Mecklenburg County,
over the past five fiscal years the county experienced a -4.2% decrease in General Fund revenue while the Charlotte Mecklenburg Library experienced a -29.1% decrease.

Table of Contents
Acknowledgements
Executive Summary
I. Introduction 1
II. Results 3
General Fund Revenues (County/City) 3
General Fund Expenditure Trends (County/City) 5
Selected Major Expenditures (County/City) 6
Library’s General Fund Trends (In Dollars) 10
Library’s General Fund Trends (In Percentages) 14
General Fund Annual Percent Change (County/City & Library) 21
Total Revenue Trends (Library) 8
Expenditure Trends (Library) 12
Selected Expenditure Paid by Library System 14
Library Total Revenue per Capita 16
Library General Fund Revenue per Capita 18
Library Expenditure per Capita 20
IV. CONCLUSION 26
Appendices
Appendix A: Methodology
Appendix B: Communities-At-A-Glance
Appendix C: Community Budget Highlights
Appendix D: Bibliography
Appendix E: List of Source Data Tables
Appendix F: Detailed Source Tables see attached CD
List of Tables
Table 1: General Fund Revenues of Local Government 4
Table 2: County's (City's) General Fund Expenditure 5
Table 3: List of "Big Item" Expenditures for the County/City 6
Table 4: Library's Total Revenue 9
Table 5: Library's Revenue from General Fund (In Dollars) 11
Table 6: Library Expenditures 13
Table 7: Expenses Administered through Library Budget 14
Table 8: Library's Share of General Fund (In Percentages) 15
Table 9: Library Total Revenue per Capita 17
Table 10: Library General Fund Revenue per Capita 19
Table 11: Library's Expenditures per Capita 21
Table 12: Annual Percent Change in General Fund Revenue for Local Government
(County/City) and for their Library System 24

P u b l i c L i b r a r y F u n d i n g | p. 1
I. INTRODUCTION
Purpose and Organization of this Report
This report is based on findings of a study conducted between January and March 2012 by the
University of North Carolina at Charlotte’s Urban Institute (the Institute) for the Charlotte
Mecklenburg Library. The purpose of the study was to revisit the Institute’s 2011 report to the
Charlotte Mecklenburg Future of the Library Task Force (the Task Force), for which the Charlotte
Mecklenburg Library and thirteen-selected library systems were compared in terms of their
funding levels between the fiscal years 2008 and 2011. (This report will subsequently be
referred to as the 2011 Institute Report.) In this current report, the most recent budget reports
available as of February 2012 were reviewed to ascertain any changes since the 2011 Institute
Report was conducted. First, this introduction provides a brief overview of the history and context
for the 2011 Institute Report, as well as the methodology applied. The next section outlines the
results of the study. The report’s final section summarizes the results of the study, particularly in
comparison to findings reported in the 2011 Institute Report. At the end of the report are
appendices providing a description of the methodology and the communities under study, as well
as a listing of data sources and references.
Project Background
Like many public libraries across the country, the Charlotte Mecklenburg Library had to face fiscal
constraints in recent years. Indeed, the FY 2011 budgeted funding of the Charlotte Mecklenburg
Library was reduced by 39% compared with the prior year. Determined to create a sustainable
future for the Library, the Board of County Commissioners and the Board of Trustees of Charlotte
Mecklenburg Library agreed to form the Task Force.* In November 2010, the Task Force
engaged the Institute to examine the funding levels of the Charlotte Mecklenburg Library relative
to thirteen comparable library systems in the country. Specifically, the Task Force charged the
Institute to answer the following questions:
1. How do the local governments in the study compare in:
a. The size of their annual revenues and expenditures budgets?
b. The major public services they are responsible for funding?
2. How do the library systems in those communities compare in:
a. The size of their revenue and expenditures budgets?
b. The major expense categories they administer through their budgets?
c. What is the relative impact of the national economic situation on local government
and library budgets in those communities?
* For more information, see http://charmeck.org/mecklenburg/county/CountyManagersOffice/OpenMeck/change/libraryfuture/Pages/default.aspx.
P u b l i c L i b r a r y F u n d i n g | p. 2
Mecklenburg County and the Charlotte Chamber of Commerce chose thirteen metropolitan areas and their public library systems as peer communities. The fourteen library systems included in the study are, in alphabetical order:
1. Atlanta-Fulton Public Library System (GA)
2. Austin Public Library (Travis County, TX)
3. Baltimore County Public Library (MD)
4. Charlotte Mecklenburg Library (Mecklenburg County, NC)
5. Dallas Public Library (Dallas County, TX)
6. Durham County Public Library (NC)
7. Forsyth County Public Library (NC)
8. Greensboro Public Library (City of Greensboro, NC)
9. Jacksonville Public Library (Duval County, FL)
10. Memphis/Shelby County Public Library & Information Center (TN)
11. Nashville Public Library (Davidson County, TN)
12. Orange County Library System (FL)
13. Tampa-Hillsborough County Public Library (FL)
14. Wake County Public Libraries (NC)
Analytical Strategy The same methodology approach used in the 2011 Institute Report was applied for this present
study. A detailed methodology description is available as an appendix to this report. To
summarize, the Institute conducted the following:
• Collected financial reports of revenues and expenditures for FY 2012, and noted any
additional changes to data previously collected for the 2011 Institute Report. Financial
reports from each library systems and from the relevant local government responsible for
library funding were collected and reviewed.
• Performed calculations to determine changes in the general fund revenues of local
governments and their library systems.
• Utilized the latest data from the Public Library Data Service to obtain the most current
population of legal service area of library communities under study.
• Calculated the per capita information for the library’s revenue and expenditures.
• Identified which communities provide funding for their public schools, public safety
services, and parks and recreation.
• Evaluated which major expenses are administered by the library budget or directly by
the local government.

P u b l i c L i b r a r y F u n d i n g | p. 3
II. RESULTS The results of the study are presented in this section of the report, beginning with examination of data relating to the local governments themselves, followed by a look at the library systems they fund. This section concludes with a comparison of the year-to-year percent change in General Fund revenue for both the local governments and the library systems they fund.
In the narrative presentation of results below, “Mecklenburg County” and “Charlotte
Mecklenburg Library” are bolded to help the reader note their standing among their respective peers. In the tables below, Mecklenburg County and Charlotte Mecklenburg Library are highlighted in blue and presented in the first row. All other local governments or library systems are listed in alphabetical order. In addition, the budget figures in the narrative were rounded off for ease of presentation. Note that Appendix C contains highlights from the fourteen communities’ published budget reports to help explain some of the factors affecting each community’s particular budget situation.
Annual Revenue and Expense Budgets In this section, the report looks at General Fund Revenues followed by General Fund Expenditures for fiscal years 2008 through 2012.
General Fund Revenues (County/City)
For many communities the General Fund is the principal operating fund that provides for most basic governmental services (except those required to be accounted for in another fund). Table 1 presents the General Fund revenue (in dollars) for each community.
For FY 2012, the average General Fund revenue is approximately $777 million, an increase of 1.1% from the previous fiscal year. Baltimore had the highest ($1.6 billion), and Greensboro had the lowest ($249 million). Mecklenburg County had the second highest General Fund revenue budget at $1.3 billion. All communities, except for four (Greensboro, Jacksonville, Orange County, and Hillsborough County), saw an increase in General Fund Revenue between FY 2011 and FY 2012.
On average, communities experienced a decline of -2.9% in General Fund revenue from FY 2008 to FY 2012. Seven of the communities showed decreased General Fund revenues over that time period. Durham County showed the largest decline in General Fund revenue with -44.1%. However, it should be noted that Durham County’s Department of Social Services (DSS) received Pass-Through Funds in fiscal years 2008 through 2010 that were reported in the General Fund. If DSS Pass-Through Funds were not taken into account, the percent change of the county’s General Fund revenue between FY 2008 and FY 2012 was actually an increase of 1.6%. Atlanta-Fulton County shows the second largest decline in General Fund revenue with a reduction of -17.1%, while Tampa-Hillsborough County was in third with a decline of -13.9%. Mecklenburg County, with a decline of -4.2%, showed the fifth largest reduction in General Fund revenue between FY 2008 and FY 2012. In comparison to the 2011 Institute report, Mecklenburg County experienced the fourth largest reduction (-6.6%) between FY 2008 and FY 2011. At the other end of the spectrum, seven communities showed increased General Fund revenues over the past five years, ranging from 1.8% (Nashville) to 27.1% (Memphis). However, it should be noted that

P u b l i c L i b r a r y F u n d i n g | p. 4
Memphis’ General Fund budget for FY 2011 included a transfer of $41.0 million from the city’s Debt Service Fund to pay for school funding commitments. Austin showed the second highest increase in General Fund revenue with 16.7%, followed by Forsyth County, which increased by 7.1% during the same period.
TABLE 1: GENERAL FUND REVENUES OF LOCAL GOVERNMENT (COUNTY/CITY),
FY 2008–FY 2012
County's (City's) General Fund % Change (FY 2008– FY 2012)
%Change (FY 2011–FY 2012)
FY 2008 FY 2009 FY 2010 FY 2011 FY 2012
Mecklenburg County1
$1,366,131,430 $1,408,074,179 $1,344,987,698 $1,275,452,798 $1,308,131,222 -4.2% 2.6%
(Atlanta) Fulton County
$627,704,466 $669,138,036 $561,444,533 $493,764,298 $520,426,146 -17.1%2 5.4%
Austin $593,013,240 $621,031,730 $614,914,833 $650,241,640 $691,758,774 16.7% 6.4%
Baltimore County
$1,662,606,079 $1,719,528,210 $1,673,876,467 $1,600,149,508 $1,603,784,784 -3.5% 0.2%
Dallas $1,043,103,414 $1,080,447,722 $994,491,287 $998,491,965 $1,011,365,209 -3.0% 1.3%
Durham County $641,243,022 $683,911,355 $705,376,451 $343,550,235 $358,568,344 -44.1%3 4.4%
Forsyth County4 $480,451,219 $487,951,973 $498,751,271 $511,527,556 $514,717,914 7.1% 0.6%
Greensboro5 $242,076,401 $256,163,933 $255,627,763 $254,946,402 $249,416,556 3.0% -2.2%
Jacksonville, FL $937,282,838 $971,441,489 $981,500,413 $990,365,838 $957,927,122 2.2% -3.3%
Memphis $541,782,738 $580,802,239 $577,300,012 $677,422,4886 $688,583,596 27.1% 1.6%
Nashville7 $706,294,800 $691,757,000 $667,744,700 $700,682,100 $719,103,300 1.8% 2.6%
Orange County (Orlando, FL)8
$752,796,213 $774,489,749 $748,697,920 $717,095,160 $711,428,926 -5.5% -0.8%
(Tampa) Hillsborough
County9 $691,525,001 $704,555,844 $624,052,920 $601,352,438 $595,473,932 -13.9%10 -1.0%
Wake County $920,031,000 $984,360,000 $953,600,000 $951,220,000 $952,100,000 3.5% 0.1%
14-Community Average
$800,431,562 $830,975,247 $800,169,019 $769,462,697 $777,341,845 -2.9% 1.1%
NOTES 1: ALL FIGURES IN BLACK FONT COLOR WERE “APPROVED” OR “ADOPTED” BUDGET. THE EXCEPTIONS WERE THE
FOLLOWING: FIGURES IN RED FONT WERE “ACTUAL NUMBERS,” FIGURES IN GREEN FONT WERE “OPERATING BUDGET” NUMBERS,
AND FIGURES IN BLUE FONT WERE “PLANNED” OR “TENTATIVE” BUDGET NUMBERS.
1 Mecklenburg County’s General Fund included “Fund Balance & Retained Earnings.” 2 Fulton County’s property tax revenue fell by about 17.8% between FY 2008 and FY 2011, which was about a shortfall of $83.4 million. From FY 2011 to FY 2012, property tax revenues increased by 5% or $23.2 million. 3 It should be noted that Durham County’s General Fund revenue for fiscal years 2008, 2009, and 2010 included DSS Pass-Through Funds of $288,458,174 for FY 2008, $319,444,380 for FY 2009, and $368,393,153 for FY 2010. 4 Forsyth County’s General Fund included beginning fund balance. 5 Greensboro’s General Fund included “Appropriated Fund Balance.” 6The General Fund for Memphis increased by over $100 million from FY 2010 to FY 2011. There are several explanations for this. One is that the city transferred $41 million from its Debt Service Fund to pay for school funding commitments. Another possible explanation for this increase is that due to the city’s strong property tax revenue, the FY 2011 included $36.3 million revenue from property taxes compared to FY 2010. To further illustrate the robustness of Memphis’ property tax revenue, its property tax revenue increased by 15.7% ($57.3 million) between FY 2008 and FY 2011. 7 Nashville’s General Fund included “Appropriated Fund Balance.” 8 Orange County’s General Fund included fund balance. 9 Hillsborough County’s General Fund included fund balance. 10 Hillsborough County’s property tax revenue declined by about 26.1% between FY 2008 and FY 2012, which was about a $132 million shortfall.

P u b l i c L i b r a r y F u n d i n g | p. 5
General Fund Expenditures (County/City)
Table 2 below presents General Fund Expenditures budgets. The fourteen-community average General Fund Expenditure budget for FY 2012 was about $781 million. Baltimore had the highest expenditure budget ($1.6 billion) and Greensboro had the lowest ($249 million). Mecklenburg County had the second-highest expenditure budget at $1.3 billion.
The average change in General Fund Expenditure budgets from FY 2008 to FY 2012 was a decline of -1.6%. Following Durham, which experienced a -44.1% decline, Tampa-Hillsborough County showed the second largest decline in its General Fund expenditures (-13.9%), followed by Atlanta-Fulton (-10.9%), Orange County (-5.5%), Baltimore County (-3.5%), and Dallas (-3.0%). Mecklenburg County’s General Fund expenditures for FY 2012 were at the same level as FY 2008 (0% change). The remaining communities' budget show an increase in General Fund expenditures for FY 2012 compared with FY 2008. Of the fourteen communities, only two did not increase revenue and expenditures proportionally from FY 2011 to FY 2012. Atlanta-Fulton increased revenue by 5.4% but only increased expenditures by 1%. Memphis budgeted a 1.6% revenue increase, but expenditures increased by 5%.
TABLE 2: COUNTY'S (CITY'S) GENERAL FUND EXPENDITURE TRENDS, FY 2008–FY 2012
County's (City's) General Fund Expenditures % Change (FY 2008– FY 2012)
% Change (FY 2011– FY 2012)
FY 2008 FY 2009 FY 2010 FY 2011 FY 2012
Mecklenburg County
$1,308,527,725 $1,352,143,614 $1,344,987,698 $1,275,452,798 $1,308,131,222 0.0% 2.6%
(Atlanta) Fulton County
$671,469,078 $665,839,742 $588,501,411 $594,968,520 $598,154,051 -10.9% 0.5%
Austin $513,628,403 $539,508,073 $536,204,230 $650,241,640 $691,758,774 34.7% 6.4%
Baltimore County
$1,662,606,079 $1,719,548,210 $1,673,876,467 $1,600,149,508 $1,603,784,784 -3.5% 0.2%
Dallas $1,043,103,414 $1,093,969,372 $1,018,358,684 $1,006,046,874 $1,011,365,209 -3.0% 0.5%
Durham County11
$641,243,022 $683,911,355 $705,376,451 $343,550,235 $358,568,344 -44.1% 4.4%
Forsyth County $480,451,219 $487,951,973 $498,751,271 $511,527,556 $514,717,914 7.1% 0.6%
Greensboro $242,076,401 $256,163,933 $255,627,763 $254,946,402 $249,416,557 3.0% -2.2%
Jacksonville, FL $937,282,838 $971,441,489 $981,500,413 $990,365,838 $957,927,121 2.2% -3.3%
Memphis12 $540,084,302 $580,762,588 $561,419,764 $630,559,624 $661,400,768 22.5% 4.9%
Nashville $706,294,800 $691,757,000 $667,744,700 $700,682,100 $719,103,300 1.8% 2.6%
Orange County (Orlando, FL)
$752,796,213 $774,489,749 $748,697,920 $717,095,160 $711,428,926 -5.5% -0.8%
(Tampa) Hillsborough
County $691,525,001 $704,555,844 $624,052,920 $601,352,438 $595,473,932 -13.9% -1.0%
Wake County $920,031,000 $984,360,000 $953,600,000 $951,220,000 $952,100,000 3.5% 0.1%
14-Community Average
$793,651,393 $821,885,924 $797,049,978 $773,883,859 $780,952,207 -1.6% 1.0%
NOTES 2: ALL FIGURES IN BLACK FONT COLOR WERE “APPROVED” OR “ADOPTED” BUDGET. THE EXCEPTIONS WERE THE
FOLLOWING: FIGURES IN RED FONT WERE “ACTUAL NUMBERS,” FIGURES IN GREEN FONT WERE “OPERATING BUDGET” NUMBERS,
AND FIGURES IN BLUE FONT WERE “PLANNED” OR “TENTATIVE” BUDGET NUMBERS.
11 It should be noted that Durham County’s General Fund revenue for fiscal years 2008, 2009, and 2010 included DSS Pass-Through Funds. DSS Pass-Through Funds were not reported for fiscal year 2011 or 2012. 12 The increase in General Fund expenditures was due to increase in school expenses in FY 2011 and FY 2012.

P u b l i c L i b r a r y F u n d i n g | p. 6
Major Public Services Funded
Public libraries are one of four major expense categories identified by the Charlotte Mecklenburg Future of the Library Task Force for examination in comparing the fourteen communities. Table 3 below illustrates the major services each community is required to fund. The responsibility of paying for these major services may affect the priority of local funding for public libraries. The following seven communities were directly responsible for all four of the major expense categories (library, education, public safety, and parks & recreation): Mecklenburg County, Baltimore County, Forsyth County, Memphis, Nashville, Orange County, and Wake County. Six of the fourteen communities of interest (Austin, Dallas, Greensboro, Jacksonville, Orange, and Tampa-Hillsborough) were not directly responsible for appropriating local income revenues to their public school systems. However, it should be noted that two of them had an independent special taxing district. Durham County was not responsible for parks and recreation.
TABLE 3: LIST OF "BIG ITEM" EXPENDITURES FOR THE COUNTY/CITY
Community Pu
bli
c Li
bra
ry
Pu
bli
c Ed
uca
tio
n1
3
Pu
bli
c Sa
fety
Pa
rks
&
Recr
ea
tio
n
Mecklenburg County Y Y Y Y
Atlanta-Fulton County Y Y14 Y Y
Austin, TX Y N Y Y
Baltimore County Y Y Y Y
Dallas, TX Y N Y Y
Durham County Y Y Y N
Forsyth County (Winston-Salem, NC) Y Y Y Y
Greensboro (Guilford County) Y N Y Y
Jacksonville, FL Y N Y Y
Memphis/Shelby County Y Y Y Y
Nashville, TN Y Y Y Y
Orange County (Orlando, FL)15 Y N Y Y
Tampa-Hillsborough County16 Y N Y Y
Wake County Y Y Y Y
13 In addition to public schools (K-12), some communities may include funding community colleges. 14Public education is not consolidated in Fulton County. There is the Atlanta Public Schools System and the Fulton County Schools System with differing general fund revenue stream, for which the former received funding allocations primarily from the City of Atlanta while the latter from Fulton County. 15Orange County Schools System functioned as an independent special taxing district, which derived its principal funding from property taxes. 16Tampa-Hillsborough County Public Schools functioned as an independent special taxing district, which derived its principal funding from property taxes.

P u b l i c L i b r a r y F u n d i n g | p. 7
Whenever possible, the Institute used FY 2012 financial reports to estimate the percentage of
General Funds allocated to “Big Item” expenditures and found that among all fourteen
communities, the top expenditure was either Public Education or Public Safety. The percent of
General Fund revenue for communities with Public Education as an expenditure ranged from 11%
(Memphis/Shelby County) to 44% (Baltimore County). About 41% of Mecklenburg County’s
General Fund expenditure was Public Education. In terms of communities with Public Safety as
expenditure, the percent of General Fund revenue that was allocated to Public Safety ranged
from 3% (Wake County) to 65% (Austin County). Public Safety was about 10% of Mecklenburg
County’s General Fund expenditure. In comparison, the Institute estimated that the percent of
General Fund revenue for Public Library in each community ranged from 1% (Forsyth County) to
6% (Atlanta-Fulton County and Tampa-Hillsborough County). For Mecklenburg County, about
2% of its FY 2012 General Fund expenditures was for Public Library.

P u b l i c L i b r a r y F u n d i n g | p. 8
B. Library Systems
Annual Revenues and Expense Budgets
In this section, the report looks first at library systems’ Total Revenues, then at General Fund Revenues, followed by Total Expenditures.
Total Revenue (Library)
Table 4 displays the Total Revenue for each of the fourteen comparable library systems of interest. This amount included the budgeted amount from the county’s General Fund as well as any other revenue sources, such as grants or donations. For FY 2012, the average budgeted Total Revenue was about $24 million, which was a decrease of -3.1% from the previous fiscal year (2011). Baltimore had the highest Total Revenue at $41 million and Forsyth, the lowest, at just under $8 million. Charlotte Mecklenburg Library was a little over the average with $27 million.
Between fiscal years 2008 and 2012, the average decline in Total Revenue was -15.3%.
However, three library systems showed at least a -30.0% reduction in their Total Revenue: Dallas
Public Library (-42.8%), Tampa-Hillsborough County Public Library (-36.2%) and Charlotte
Mecklenburg Library (-32.0%). During the same period, only three library systems showed an
increase in their total revenue: Austin Public Library (12.4%), Wake County Public Library (5.0%)
and Baltimore County Public Library (0.4%).
Four libraries experienced revenue growth from FY 2011 to FY 2012. Nashville saw the greatest
growth at 6.3%. The remaining three libraries (Austin, Baltimore, and Forsyth) saw revenue
growth under 1%. Of the ten libraries that experienced a revenue decrease from FY 2011 to
FY 2012, Charlotte Mecklenburg Library experienced the largest at -13.3%.

P u b l i c L i b r a r y F u n d i n g | p. 9
TABLE 4: LIBRARY'S TOTAL REVENUE, FY 2008–FY 2012
Library's Total Revenue % Change (FY 2008– FY 2012)
% Change (FY 2011– FY 2012) FY 2008 FY 2009 FY 2010 FY 2011 FY 2012
Charlotte Mecklenburg
Library $39,411,696 $41,239,738 $41,728,896 $30,939,59017 $26,809,40218 -32.0% -13.3%19
Atlanta-Fulton Public Library
System $35,031,128 $32,393,575 $31,503,876 $31,515,784 $30,008,898 -14.3% -4.8%
Austin Public Library
$23,735,783 $25,303,226 $25,044,207 $26,523,279 $26,687,509 12.4% 0.6%
Baltimore County Public Library
$41,271,213 $42,154,791 $41,349,398 $41,130,917 $41,449,927 0.4% 0.8%
Dallas Public Library
$33,096,373 $31,950,417 $22,976,086 $20,344,598 $18,921,431 -42.8% -7.0%
Durham County Public Library
$10,002,949 $10,575,912 $9,299,748 $9,608,832 $9,515,713 -4.9% -1.0%
Forsyth County Public Library
$8,155,005 $8,020,985 $8,158,728 $7,672,910 $7,724,080 -5.3% 0.7%
Greensboro Public Library
$8,579,472 $8,656,169 $8,268,982 $8,405,129 $8,380,308 -2.3% -0.3%
Jacksonville, FL Public Library
$40,753,386 $39,688,105 $42,997,315 $40,422,600 $39,816,875 -2.3% -1.5%
Memphis/Shelby County Public
Library & Info Ctr. $16,995,000 $17,103,000 $16,910,288 $17,503,447 $16,252,395 -4.4% -7.1%
Nashville Public Library
$22,233,100 $20,604,300 $19,717,700 $19,863,400 $21,121,800 -5.0% 6.3%
Orange County Library System (Orlando, FL)
$41,525,688 $41,525,024 $38,212,399 $34,049,474 $33,190,665 -20.1% -2.5%
Tampa-Hillsborough County Public
Library
$55,694,247 $49,293,311 $43,129,664 $37,888,356 $35,555,021 -36.2% -6.2%
Wake County Public Library
$17,619,122 $18,627,968 $17,644,001 $18,774,469 $18,498,300 5.0% -1.5%
14-Community Average
$28,150,297 $27,652,609 $26,210,092 $24,617,342 $23,852,309 -15.3% -3.1%
NOTES 3: ALL FIGURES IN BLACK FONT COLOR WERE “APPROVED” OR “ADOPTED” BUDGET. THE EXCEPTIONS WERE THE
FOLLOWING: FIGURES IN RED FONT WERE “ACTUAL” OR “AUDITED” NUMBERS, FIGURES IN GREEN FONT WERE “OPERATING
BUDGET” NUMBERS, AND FIGURES IN BLUE FONT WERE “PLANNED” OR “TENTATIVE” BUDGET NUMBERS.
17 Total Revenue has been updated from the 2011 Urban Institute report. It now represents Charlotte Mecklenburg Library’s audited Total Revenue. Also, this amount includes a one-time payment of $1,938,358 from the city of Charlotte and surrounding towns in Mecklenburg County. 18 It should be noted that while the Charlotte Mecklenburg Library is not responsible for building maintenance, security, human resources, and information technology, the Library is required to show in their annual financials the value of these services that Mecklenburg County provides to the Library (i.e., “paid on behalf by Mecklenburg County”). Charlotte Mecklenburg Library’s Total Revenue for FY 2008 through 2011 includes amounts “paid on behalf by Mecklenburg County” as reported in the Library’s annual audit reports: $1.5 million (FY 2008), $2.9 million (FY 2009), $6.6 million (FY 2010), and $4.2 million (FY 2011). Charlotte Mecklenburg Library’s 2012 Total Revenue includes the budgeted costs for human resources and information technology. Moreover, human resources and information technology expenses were not turned over to Mecklenburg County until November 2011. 19 If the one-time payment of $1,938,358 for FY 2011 was not included in Charlotte Mecklenburg Library’s Total Revenue, the percentage change would be -7.6%. This is still the largest revenue decrease between FY 2011 and FY 2012 among the 14 library systems. The 14-community average would also change from -3.1% to -2.6%.
P u b l i c L i b r a r y F u n d i n g | p. 10
Library’s Revenue from General Fund
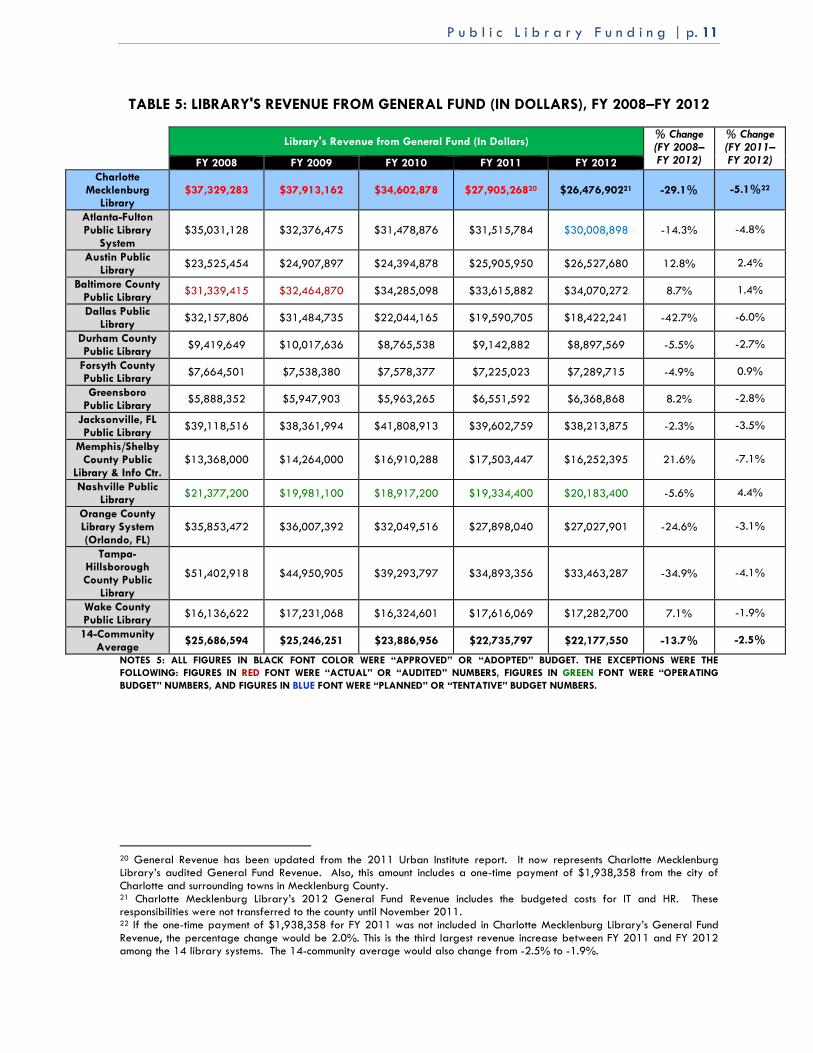
Table 5 exhibits the dollar amount of funding budgeted for each of the fourteen comparable library systems from their local government’s General Fund during fiscal years 2008 through 2012. The average budget amount for FY 2012 was $22 million. Jacksonville had the highest budget ($38 million) and Greensboro, the lowest ($6 million). Charlotte Mecklenburg Library fell just above the average at $26 million.
Between FY 2008 and FY 2012, the average General Fund revenues declined by -13.7%. In comparison, FY 2011-2012 saw a -2.5% drop. The library system that experienced the greatest decline in General Funds from FY 2008 to FY 2012 was Dallas Public Library with a -42.7% reduction, followed by Tampa-Hillsborough County Public Library (-34.9%) and Charlotte
Mecklenburg Library (-29.1%). In contrast, Memphis/Shelby County Public Library’s General Fund revenue increased by 21.6%, followed by Austin Public Library with 12.8%.
P u b l i c L i b r a r y F u n d i n g | p. 11
TABLE 5: LIBRARY'S REVENUE FROM GENERAL FUND (IN DOLLARS), FY 2008–FY 2012
Library's Revenue from General Fund (In Dollars)
% Change (FY 2008– FY 2012)
% Change (FY 2011– FY 2012) FY 2008 FY 2009 FY 2010 FY 2011 FY 2012
Charlotte Mecklenburg
Library $37,329,283 $37,913,162 $34,602,878 $27,905,26820 $26,476,90221 -29.1% -5.1%22
Atlanta-Fulton Public Library
System $35,031,128 $32,376,475 $31,478,876 $31,515,784 $30,008,898 -14.3% -4.8%
Austin Public Library
$23,525,454 $24,907,897 $24,394,878 $25,905,950 $26,527,680 12.8% 2.4%
Baltimore County Public Library
$31,339,415 $32,464,870 $34,285,098 $33,615,882 $34,070,272 8.7% 1.4%
Dallas Public Library
$32,157,806 $31,484,735 $22,044,165 $19,590,705 $18,422,241 -42.7% -6.0%
Durham County Public Library
$9,419,649 $10,017,636 $8,765,538 $9,142,882 $8,897,569 -5.5% -2.7%
Forsyth County Public Library
$7,664,501 $7,538,380 $7,578,377 $7,225,023 $7,289,715 -4.9% 0.9%
Greensboro Public Library
$5,888,352 $5,947,903 $5,963,265 $6,551,592 $6,368,868 8.2% -2.8%
Jacksonville, FL Public Library
$39,118,516 $38,361,994 $41,808,913 $39,602,759 $38,213,875 -2.3% -3.5%
Memphis/Shelby County Public
Library & Info Ctr. $13,368,000 $14,264,000 $16,910,288 $17,503,447 $16,252,395 21.6% -7.1%
Nashville Public Library
$21,377,200 $19,981,100 $18,917,200 $19,334,400 $20,183,400 -5.6% 4.4%
Orange County Library System (Orlando, FL)
$35,853,472 $36,007,392 $32,049,516 $27,898,040 $27,027,901 -24.6% -3.1%
Tampa-Hillsborough County Public
Library
$51,402,918 $44,950,905 $39,293,797 $34,893,356 $33,463,287 -34.9% -4.1%
Wake County Public Library
$16,136,622 $17,231,068 $16,324,601 $17,616,069 $17,282,700 7.1% -1.9%
14-Community Average
$25,686,594 $25,246,251 $23,886,956 $22,735,797 $22,177,550 -13.7% -2.5%
NOTES 5: ALL FIGURES IN BLACK FONT COLOR WERE “APPROVED” OR “ADOPTED” BUDGET. THE EXCEPTIONS WERE THE
FOLLOWING: FIGURES IN RED FONT WERE “ACTUAL” OR “AUDITED” NUMBERS, FIGURES IN GREEN FONT WERE “OPERATING
BUDGET” NUMBERS, AND FIGURES IN BLUE FONT WERE “PLANNED” OR “TENTATIVE” BUDGET NUMBERS.
20 General Revenue has been updated from the 2011 Urban Institute report. It now represents Charlotte Mecklenburg Library’s audited General Fund Revenue. Also, this amount includes a one-time payment of $1,938,358 from the city of Charlotte and surrounding towns in Mecklenburg County. 21 Charlotte Mecklenburg Library’s 2012 General Fund Revenue includes the budgeted costs for IT and HR. These responsibilities were not transferred to the county until November 2011. 22 If the one-time payment of $1,938,358 for FY 2011 was not included in Charlotte Mecklenburg Library’s General Fund Revenue, the percentage change would be 2.0%. This is the third largest revenue increase between FY 2011 and FY 2012 among the 14 library systems. The 14-community average would also change from -2.5% to -1.9%.
P u b l i c L i b r a r y F u n d i n g | p. 12
Expenditures (Library)
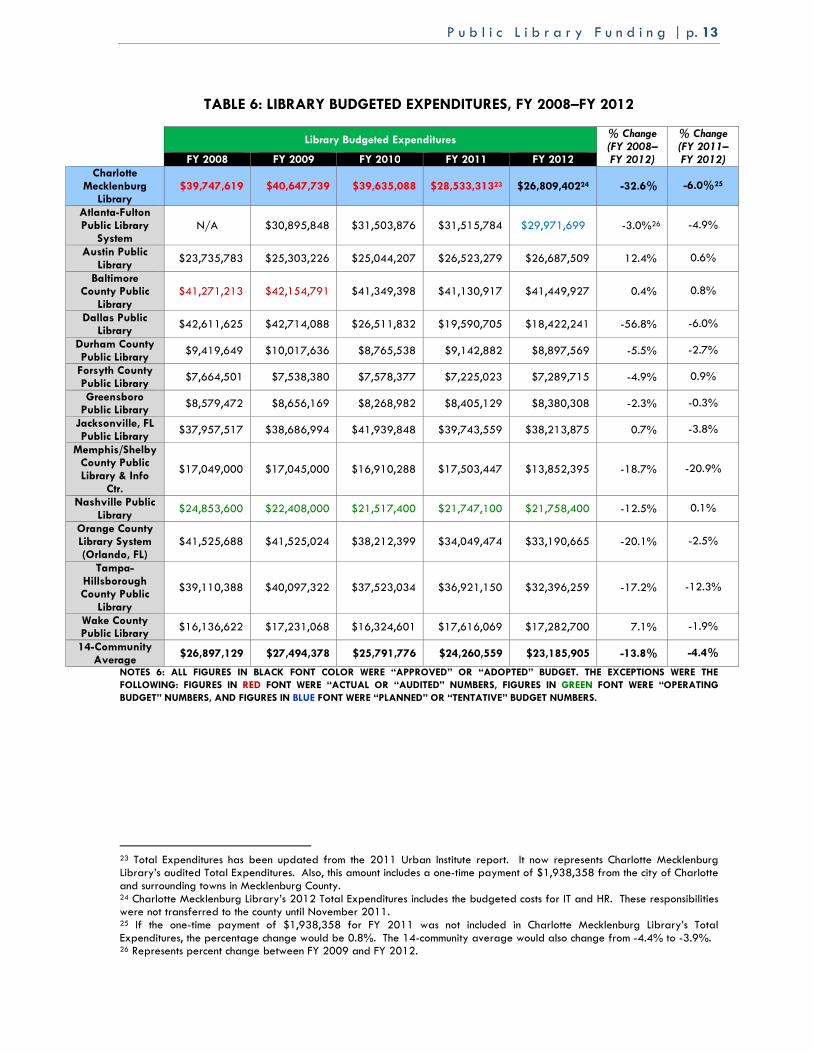
Table 6 illustrates each of the fourteen comparable library systems’ Total Expenditure budgets between fiscal years 2008 and 2012. The average expenditure budget for FY 2012 was $23 million. The largest was Baltimore’s ($41 million) and the smallest was Forsyth’s ($7 million). Charlotte Mecklenburg Library was slightly over the average at $27 million. The average Expenditure budget, between FY 2008 and FY 2012, saw a decline of -13.8%. The three library systems that showed the largest decline in Expenditures were Dallas Public Library (-56.8%), followed by Charlotte Mecklenburg Library (-32.6%) and Orange County Public Library System (-20.1%).
Between FY 2011 and FY 2012, the average Total Expenditures Budget for the 14 library systems declined by -4.4%. Memphis Public Library had the largest reduction at -20.9%, followed by Tampa-Hillsborough County Public Library at -12.3%. Charlotte Mecklenburg
Library and Dallas Public Library both experienced a -6.0% reduction in their Total Expenditures Budget.
P u b l i c L i b r a r y F u n d i n g | p. 13
TABLE 6: LIBRARY BUDGETED EXPENDITURES, FY 2008–FY 2012
Library Budgeted Expenditures
% Change (FY 2008– FY 2012)
% Change (FY 2011– FY 2012) FY 2008 FY 2009 FY 2010 FY 2011 FY 2012
Charlotte Mecklenburg
Library $39,747,619 $40,647,739 $39,635,088 $28,533,31323 $26,809,40224 -32.6% -6.0%25
Atlanta-Fulton Public Library
System N/A $30,895,848 $31,503,876 $31,515,784 $29,971,699 -3.0%26 -4.9%
Austin Public Library
$23,735,783 $25,303,226 $25,044,207 $26,523,279 $26,687,509 12.4% 0.6%
Baltimore County Public
Library $41,271,213 $42,154,791 $41,349,398 $41,130,917 $41,449,927 0.4% 0.8%
Dallas Public Library
$42,611,625 $42,714,088 $26,511,832 $19,590,705 $18,422,241 -56.8% -6.0%
Durham County Public Library
$9,419,649 $10,017,636 $8,765,538 $9,142,882 $8,897,569 -5.5% -2.7%
Forsyth County Public Library
$7,664,501 $7,538,380 $7,578,377 $7,225,023 $7,289,715 -4.9% 0.9%
Greensboro Public Library
$8,579,472 $8,656,169 $8,268,982 $8,405,129 $8,380,308 -2.3% -0.3%
Jacksonville, FL Public Library
$37,957,517 $38,686,994 $41,939,848 $39,743,559 $38,213,875 0.7% -3.8%
Memphis/Shelby County Public Library & Info
Ctr.
$17,049,000 $17,045,000 $16,910,288 $17,503,447 $13,852,395 -18.7% -20.9%
Nashville Public Library
$24,853,600 $22,408,000 $21,517,400 $21,747,100 $21,758,400 -12.5% 0.1%
Orange County Library System (Orlando, FL)
$41,525,688 $41,525,024 $38,212,399 $34,049,474 $33,190,665 -20.1% -2.5%
Tampa-Hillsborough County Public
Library
$39,110,388 $40,097,322 $37,523,034 $36,921,150 $32,396,259 -17.2% -12.3%
Wake County Public Library
$16,136,622 $17,231,068 $16,324,601 $17,616,069 $17,282,700 7.1% -1.9%
14-Community Average
$26,897,129 $27,494,378 $25,791,776 $24,260,559 $23,185,905 -13.8% -4.4%
NOTES 6: ALL FIGURES IN BLACK FONT COLOR WERE “APPROVED” OR “ADOPTED” BUDGET. THE EXCEPTIONS WERE THE
FOLLOWING: FIGURES IN RED FONT WERE “ACTUAL OR “AUDITED” NUMBERS, FIGURES IN GREEN FONT WERE “OPERATING
BUDGET” NUMBERS, AND FIGURES IN BLUE FONT WERE “PLANNED” OR “TENTATIVE” BUDGET NUMBERS.
23 Total Expenditures has been updated from the 2011 Urban Institute report. It now represents Charlotte Mecklenburg Library’s audited Total Expenditures. Also, this amount includes a one-time payment of $1,938,358 from the city of Charlotte and surrounding towns in Mecklenburg County. 24 Charlotte Mecklenburg Library’s 2012 Total Expenditures includes the budgeted costs for IT and HR. These responsibilities were not transferred to the county until November 2011. 25 If the one-time payment of $1,938,358 for FY 2011 was not included in Charlotte Mecklenburg Library’s Total Expenditures, the percentage change would be 0.8%. The 14-community average would also change from -4.4% to -3.9%. 26 Represents percent change between FY 2009 and FY 2012.
P u b l i c L i b r a r y F u n d i n g | p. 14
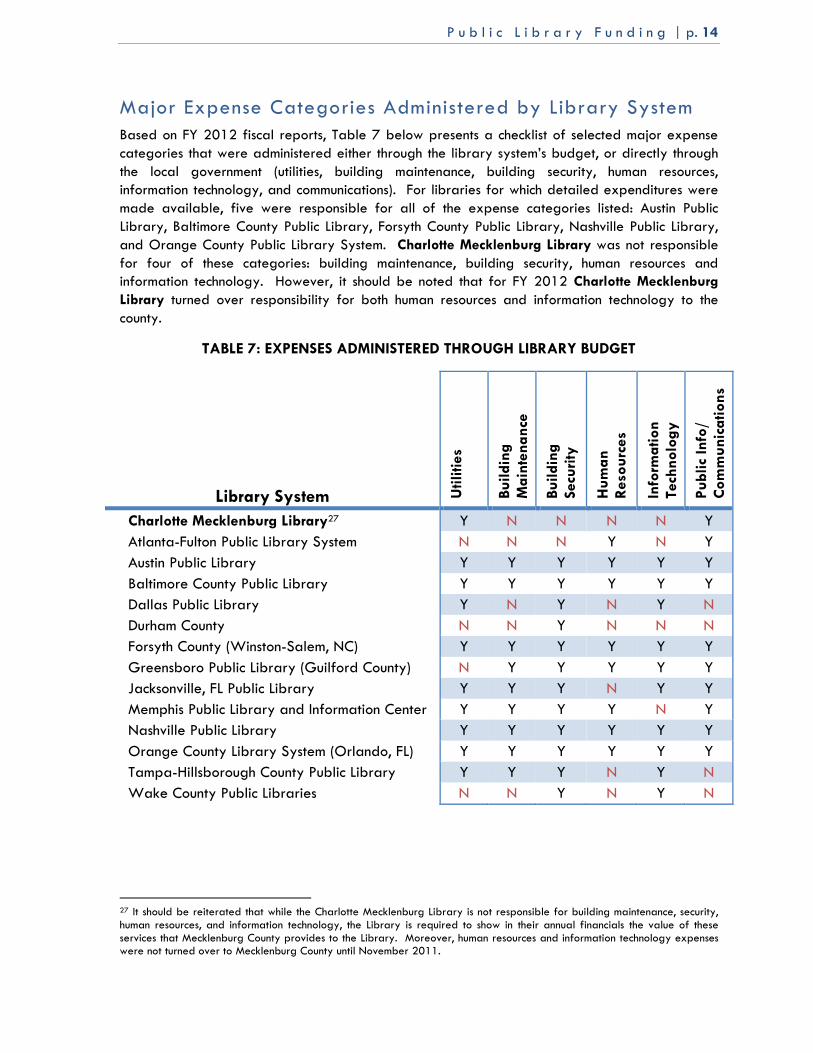
Major Expense Categories Administered by Library System Based on FY 2012 fiscal reports, Table 7 below presents a checklist of selected major expense categories that were administered either through the library system’s budget, or directly through the local government (utilities, building maintenance, building security, human resources, information technology, and communications). For libraries for which detailed expenditures were made available, five were responsible for all of the expense categories listed: Austin Public Library, Baltimore County Public Library, Forsyth County Public Library, Nashville Public Library, and Orange County Public Library System. Charlotte Mecklenburg Library was not responsible for four of these categories: building maintenance, building security, human resources and information technology. However, it should be noted that for FY 2012 Charlotte Mecklenburg
Library turned over responsibility for both human resources and information technology to the county.
TABLE 7: EXPENSES ADMINISTERED THROUGH LIBRARY BUDGET
Library System Uti
liti
es
Bu
ild
ing
M
ain
ten
an
ce
Bu
ild
ing
Secu
rity
Hu
ma
n
Reso
urc
es
Info
rma
tio
n
Tech
no
log
y
Pu
bli
c In
fo/
Co
mm
un
ica
tio
ns
Charlotte Mecklenburg Library27 Y N N N N Y
Atlanta-Fulton Public Library System N N N Y N Y
Austin Public Library Y Y Y Y Y Y
Baltimore County Public Library Y Y Y Y Y Y
Dallas Public Library Y N Y N Y N
Durham County N N Y N N N
Forsyth County (Winston-Salem, NC) Y Y Y Y Y Y
Greensboro Public Library (Guilford County) N Y Y Y Y Y
Jacksonville, FL Public Library Y Y Y N Y Y
Memphis Public Library and Information Center Y Y Y Y N Y
Nashville Public Library Y Y Y Y Y Y
Orange County Library System (Orlando, FL) Y Y Y Y Y Y
Tampa-Hillsborough County Public Library Y Y Y N Y N
Wake County Public Libraries N N Y N Y N
27 It should be reiterated that while the Charlotte Mecklenburg Library is not responsible for building maintenance, security, human resources, and information technology, the Library is required to show in their annual financials the value of these services that Mecklenburg County provides to the Library. Moreover, human resources and information technology expenses were not turned over to Mecklenburg County until November 2011.

P u b l i c L i b r a r y F u n d i n g | p. 15
Share of Local Government Budget
Library’s Share of General Fund
Table 8 shows library General Fund revenue shares as a percent of the total General Fund available. For FY 2012, the average library share of General Fund revenues was 2.9%. This represents a -0.1% drop from FY 2011. Atlanta-Fulton Public Library System received the highest share (5.8%) and Forsyth received the lowest share (1.4%). Charlotte Mecklenburg Library’s
share was 2.0%, which was the fourth lowest of the fourteen library systems under study. Atlanta-Fulton Public Library was the only library to see an increase (albeit, less than one percentage point) in their General Fund share from FY 2011 to FY 2012.
TABLE 8: LIBRARY'S SHARE OF GENERAL FUND (IN PERCENTAGES), FY 2008–FY 2012
Library's Share of General Fund (In Percentages) 5-Year Average FY 2008 FY 2009 FY 2010 FY 2011 FY 2012
Charlotte Mecklenburg
Library 2.7% 2.7% 2.6% 2.2%28 2.0% 2.4%
Atlanta-Fulton Public Library
System 5.6% 4.8% 5.6% 5.0% 5.8% 5.6%
Austin Public Library
4.0% 4.0% 4.0% 4.0% 3.8% 4.0%
Baltimore County Public Library
1.9% 1.9% 2.0% 2.1% 2.1% 2.0%
Dallas Public Library
3.1% 2.9% 2.2% 2.0% 1.8% 2.4%
Durham County Public Library
1.5% 1.5% 1.2% 2.7% 2.5% 1.9%
Forsyth County Public Library
1.6% 1.5% 1.5% 1.4% 1.4% 1.5%
Greensboro Public Library
2.4% 2.3% 2.3% 2.6% 2.6% 2.4%
Jacksonville, FL Public Library
4.2% 3.9% 4.3% 4.0% 4.0% 4.1%
Memphis/Shelby County Public
Library & Info Ctr. 2.5% 2.5% 2.9% 2.6% 2.4% 2.6%
Nashville Public Library
3.0% 2.9% 2.8% 2.8% 2.8% 2.9%
Orange County Library System (Orlando, FL)
4.8% 4.6% 4.3% 3.9% 3.8% 4.3%
Tampa-Hillsborough County Public
Library
7.4% 6.4% 6.3% 5.7% 5.6% 6.3%
Wake County Public Library
1.8% 1.8% 1.7% 1.9% 1.8% 1.8%
14-Community Average
3.3% 3.1% 3.1% 3.0% 2.9% 3.0%
28 If the one-time payment of $1,938,358 for FY 2011 was not included in Charlotte Mecklenburg Library’s General Fund Revenue, its share would change from 2.2% to 2.0%. The 14-community average would also change from -3.0% to -2.9%.

P u b l i c L i b r a r y F u n d i n g | p. 16
Per Capita Library Budgets
Library Total Revenue per Capita
The library Total Revenue per Capita is presented in Table 9. Using population data from the 2011 Public Library Data Service Statistical Report, the 2012 average budgeted Total Revenue per Capita was calculated at $30.21.29 The highest Total Revenue per Capita figure was $52.54 (Baltimore) and the lowest was $14.37 (Dallas). Charlotte Mecklenburg Library was below the group average at $29.34. While the group average had not changed much since FY 2008 ($34.24 then versus $30.21 in FY 2012), the relative position of Charlotte Mecklenburg
Library has: its budgeted Total Revenue per Capita was $43.14 in FY 2008 versus $29.34 in FY 2012, dropping from fourth among the fourteen libraries to ninth.
When the five-year average for Total Revenue per Capita by library was calculated, it showed that the library with the highest Total Revenue per Capita was Baltimore County Public Library ($52.56), followed by Jacksonville Public Library ($47.87), Charlotte Mecklenburg Library ($39.43). Memphis/Shelby County Public Library ($20.82) and Dallas Public Library ($19.34) had the lowest Total Revenue per Capita.
29 It should be noted that when using the population data from the 2010 Public Library Data Service Statistical Report, the 2012 average budgeted Total Revenue per Capita was calculated at $30.06, a 0.15-cent difference. Please refer to Appendix A for detailed information on how per capita calculations were performed.

P u b l i c L i b r a r y F u n d i n g | p. 17
TABLE 9: LIBRARY'S TOTAL REVENUE PER CAPITA
Library's Total Revenue per Capita 2010
Population30 FY 2008 FY 2009 FY 2010 FY 2011 FY 2012
5-Year Average
Charlotte Mecklenburg
Library 913,639 $43.14 $45.14 $45.67 $33.8631 $29.34 $39.43
Atlanta-Fulton Public Library
System 1,003,653 $34.90 $32.28 $31.39 $31.40 $29.90 $31.97
Austin Public Library
774,636 $30.64 $32.66 $32.33 $34.24 $34.45 $32.87
Baltimore County Public Library
788,994 $52.31 $53.43 $52.41 $52.13 $52.54 $52.56
Dallas Public Library
1,316,350 $25.14 $24.27 $17.45 $15.46 $14.37 $19.34
Durham County Public Library
265,670 $37.65 $39.81 $35.00 $36.17 $35.82 $36.89
Forsyth County Public Library
359,638 $22.68 $22.30 $22.69 $21.34 $21.48 $22.10
Greensboro Public Library
369,857 $23.20 $23.40 $22.36 $22.73 $22.66 $22.87
Jacksonville, FL Public Library
850,962 $47.89 $46.64 $50.53 $47.50 $46.79 $47.87
Memphis/Shelby County Public
Library & Info Ctr. 814,322 $20.87 $21.00 $20.77 $21.49 $19.96 $20.82
Nashville Public Library
635,710 $34.97 $32.41 $31.02 $31.25 $33.23 $32.57
Orange County Library System (Orlando, FL)
1,052,782 $39.44 $39.44 $36.30 $32.34 $31.53 $35.81
Tampa-Hillsborough County Public
Library
1,205,269 $46.21 $40.90 $35.78 $31.44 $29.50 $36.77
Wake County Public Library
866,410 $20.34 $21.50 $20.36 $21.67 $21.35 $21.04
14-Community Average
801,278 $34.24 $33.94 $32.43 $30.93 $30.21 $32.35
NOTE: ALL FIGURES IN BLACK FONT COLOR WERE “APPROVED” OR “ADOPTED” BUDGET. THE EXCEPTIONS WERE FIGURES IN RED
FONT, WHICH WERE BASED ON “ACTUAL” OR “AUDITED” NUMBERS.
30 Since population data for calculating the per capita measure were not available for each year in the study, the Institute used the 2010 population for the Legal Service Area of each library system as reported by the Public Library Association 2011 Survey Report. It should be noted that Wake County Public Library did not participate in the 2010 Survey Report and thus its population was derived from the 2009 Survey Report of the Public Library Association. Please refer to Appendix A for detailed information on how per capita calculations were performed. 31 If the one-time payment of $1,938,358 for FY 2011 was not included in Charlotte Mecklenburg Library’s Total Revenue, then its FY 2011 Total Revenue per Capita would be $31.74 and its 5-year average would be $39.01. The 14-community average for FY 2011 would also change from $30.93 to $30.78 and its 5-year average would be $32.32 instead of $32.35.
P u b l i c L i b r a r y F u n d i n g | p. 18
Library General Fund Revenue per Capita
The library General Fund revenue per Capita is presented in Table 10. Using the 2011 Public Library Data Service Statistical Report population data, the FY 2012 average budgeted General Fund Revenue per Capita was calculated at $27.95.32 The highest General Fund Revenue per Capita figure was $44.91 (Jacksonville) and the lowest was $13.99 (Dallas). Charlotte
Mecklenburg Library was just above the group average at $28.98. While the group average had not changed much since 2008 ($31.02 then versus $27.95 in 2012), the relative position of Charlotte Mecklenburg Library has: its budgeted General Fund Revenue per Capita was $40.86 in FY 2008 versus $28.98 in FY 2012, dropping from third among the fourteen libraries to seventh.
The five-year average showed that the library with the highest budgeted General Fund Revenue
per Capita was Jacksonville Public Library ($46.33) followed by Baltimore County Public Library
($42.02), and Charlotte Mecklenburg Library ($35.95). Memphis/Shelby County Public Library
($19.23), Dallas Public Library ($18.79), and Greensboro Public Library ($16.61) had the lowest
General Fund Revenue per Capita.
32 It should be noted that when using the population data from the 2010 Public Library Data Service Statistical Report, the 2012 average budgeted General Fund Revenue per Capita was calculated at $27.63, a 0.15-cent difference. Please refer to Appendix A for detailed information on how per capita calculations were performed.

P u b l i c L i b r a r y F u n d i n g | p. 19
TABLE 10: LIBRARY'S GENERAL FUND REVENUE PER CAPITA
Library's General Fund Revenue per Capita 5-Year Average
2010 Population33
FY 2008 FY 2009 FY 2010 FY 2011 FY 2012
Charlotte Mecklenburg
Library 913,639 $40.86 $41.50 $37.87 $30.5434 $28.98 $35.95
Atlanta-Fulton Public Library
System 1,003,653 $34.90 $32.26 $31.36 $31.40 $29.90 $31.97
Austin Public Library
774,636 $30.37 $32.15 $31.49 $33.44 $34.25 $32.34
Baltimore County Public Library
788,994 $39.72 $41.15 $43.45 $42.61 $43.18 $42.02
Dallas Public Library
1,316,350 $24.43 $23.92 $16.75 $14.88 $13.99 $18.79
Durham County Public Library
265,670 $35.46 $37.71 $32.99 $34.41 $33.49 $34.81
Forsyth County Public Library
359,638 $21.31 $20.96 $21.07 $20.09 $20.27 $20.74
Greensboro Public Library
369,857 $15.92 $16.08 $16.12 $17.71 $17.22 $16.61
Jacksonville, FL Public Library
850,962 $45.97 $45.08 $49.13 $46.54 $44.91 $46.33
Memphis/Shelby County Public
Library & Info Ctr. 814,322 $16.42 $17.52 $20.77 $21.49 $19.96 $19.23
Nashville Public Library
635,710 $33.63 $31.43 $29.76 $30.41 $31.75 $31.40
Orange County Library System (Orlando, FL)
1,052,782 $34.06 $34.20 $30.44 $26.50 $25.67 $30.17
Tampa-Hillsborough County Public
Library
1,205,269 $42.65 $37.30 $32.60 $28.95 $27.76 $33.85
Wake County Public Library
866,410 $18.62 $19.89 $18.84 $20.33 $19.95 $19.53
14-Community Average
801,278 $31.02 $30.80 $29.48 $28.52 $27.95 $29.55
NOTE: ALL FIGURES IN BLACK FONT COLOR WERE“APPROVED” OR “ADOPTED” BUDGET. THE EXCEPTIONS WERE FIGURES IN RED
FONT, WHICH WERE BASED ON “ACTUAL” OR “AUDITED” NUMBERS.
33 Since population data for calculating the per capita measure were not available for each year in the study, the Institute used the 2009 population for the Legal Service Area of each library system as reported by the Public Library Association 2010 Survey Report. It should be noted that Wake County Public Library did not participate in the 2010 Survey Report and thus its population was derived from the 2009 Survey Report of the Public Library Association. Please refer to Appendix A for detailed information on how per capita calculations were performed. 34 If the one-time payment of $1,938,358 for FY 2011 was not included in Charlotte Mecklenburg Library’s General Fund Revenue, then its FY 2011 General Fund Revenue per Capita would be $28.42 and its 5-year average would be $35.53. The 14-community average for FY 2011 would also change from $28.52 to $28.37 and its 5-year average would be $29.52 instead of $29.55.
P u b l i c L i b r a r y F u n d i n g | p. 20
Library Expenditure per Capita
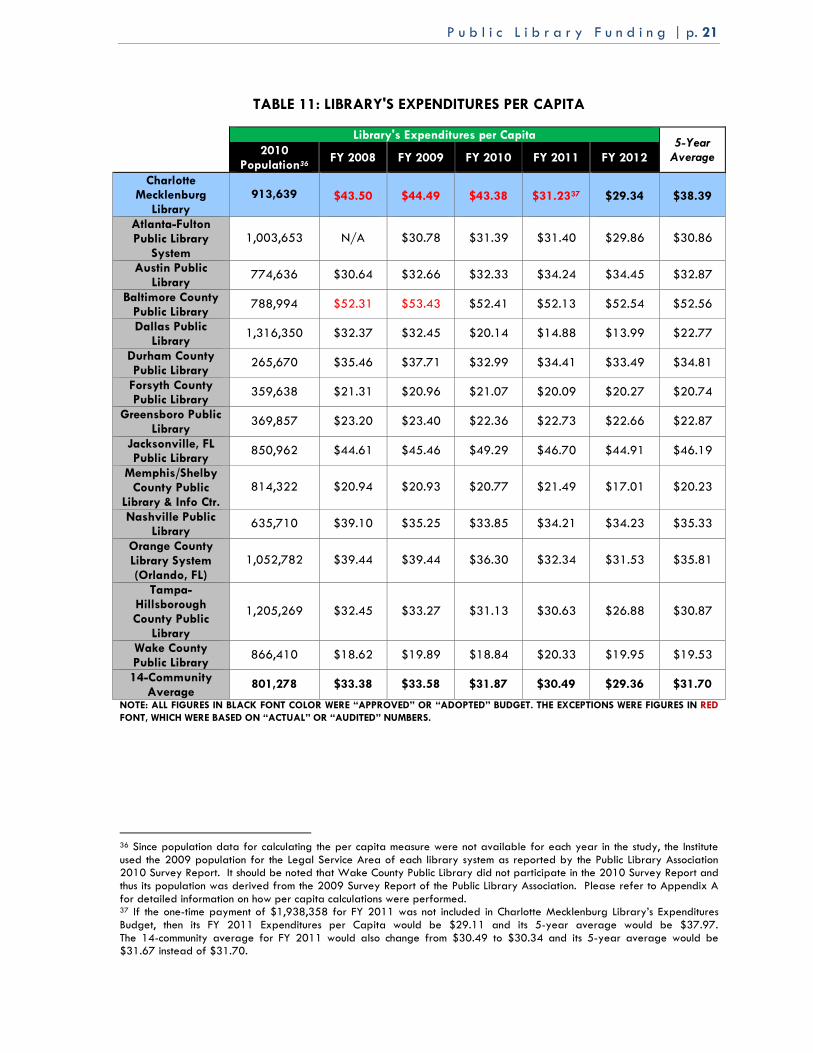
The Library Expenditure per Capita is presented in Table 11. The fourteen-community average for FY 2012 was $29.36.35 Baltimore ($52.54) and Dallas ($13.99) once again stood out as the highest and lowest in the group, respectively. Charlotte Mecklenburg Library’s FY 2012 budget included $29.34 in Expenditures per Capita.
When the five-year average for Library Expenditure per Capita was calculated, it showed that the library with the highest Library Expenditure per Capita was Baltimore County Public Library ($52.56) followed by Jacksonville Public Library ($46.19) and Charlotte Mecklenburg Library ($38.39). Greensboro Public Library ($22.87), Forsyth County Public Library ($20.74), Memphis/Shelby County Public Library ($20.23), and Wake County Public Library ($19.53) had the lowest Expenditure per Capita.
35 It should be noted that when using the population data from the 2010 Public Library Data Service Statistical Report, the 2012 average budgeted Expenditures per Capita was calculated at $29.22, a 0.14-cent difference. Please refer to Appendix A for detailed information on how per capita calculations were performed.
P u b l i c L i b r a r y F u n d i n g | p. 21
TABLE 11: LIBRARY'S EXPENDITURES PER CAPITA
Library's Expenditures per Capita 5-Year Average
2010 Population36
FY 2008 FY 2009 FY 2010 FY 2011 FY 2012
Charlotte Mecklenburg
Library 913,639 $43.50 $44.49 $43.38 $31.2337 $29.34 $38.39
Atlanta-Fulton Public Library
System 1,003,653 N/A $30.78 $31.39 $31.40 $29.86 $30.86
Austin Public Library
774,636 $30.64 $32.66 $32.33 $34.24 $34.45 $32.87
Baltimore County Public Library
788,994 $52.31 $53.43 $52.41 $52.13 $52.54 $52.56
Dallas Public Library
1,316,350 $32.37 $32.45 $20.14 $14.88 $13.99 $22.77
Durham County Public Library
265,670 $35.46 $37.71 $32.99 $34.41 $33.49 $34.81
Forsyth County Public Library
359,638 $21.31 $20.96 $21.07 $20.09 $20.27 $20.74
Greensboro Public Library
369,857 $23.20 $23.40 $22.36 $22.73 $22.66 $22.87
Jacksonville, FL Public Library
850,962 $44.61 $45.46 $49.29 $46.70 $44.91 $46.19
Memphis/Shelby County Public
Library & Info Ctr. 814,322 $20.94 $20.93 $20.77 $21.49 $17.01 $20.23
Nashville Public Library
635,710 $39.10 $35.25 $33.85 $34.21 $34.23 $35.33
Orange County Library System (Orlando, FL)
1,052,782 $39.44 $39.44 $36.30 $32.34 $31.53 $35.81
Tampa-Hillsborough County Public
Library
1,205,269 $32.45 $33.27 $31.13 $30.63 $26.88 $30.87
Wake County Public Library
866,410 $18.62 $19.89 $18.84 $20.33 $19.95 $19.53
14-Community Average
801,278 $33.38 $33.58 $31.87 $30.49 $29.36 $31.70
NOTE: ALL FIGURES IN BLACK FONT COLOR WERE “APPROVED” OR “ADOPTED” BUDGET. THE EXCEPTIONS WERE FIGURES IN RED
FONT, WHICH WERE BASED ON “ACTUAL” OR “AUDITED” NUMBERS.
36 Since population data for calculating the per capita measure were not available for each year in the study, the Institute used the 2009 population for the Legal Service Area of each library system as reported by the Public Library Association 2010 Survey Report. It should be noted that Wake County Public Library did not participate in the 2010 Survey Report and thus its population was derived from the 2009 Survey Report of the Public Library Association. Please refer to Appendix A for detailed information on how per capita calculations were performed. 37 If the one-time payment of $1,938,358 for FY 2011 was not included in Charlotte Mecklenburg Library’s Expenditures Budget, then its FY 2011 Expenditures per Capita would be $29.11 and its 5-year average would be $37.97. The 14-community average for FY 2011 would also change from $30.49 to $30.34 and its 5-year average would be $31.67 instead of $31.70.

P u b l i c L i b r a r y F u n d i n g | p. 22
C. Change in Annual Budgets (Local Government & Library)
Table 12 displays the Annual Percent Change in General Fund Revenue for local government as well as the Annual Percent Change in the amount that each library system received from their community’s “local income” (i.e., the county or city government’s General Fund Revenue).
General Findings
Overall, the fourteen local governments have experienced a pattern of growth and decline In General Fund Revenue since 2008. From FY 2008 to FY 2009 local governments saw an average growth of 3.8%, followed by two years of decline (-3.7% FY 2009-2010; -3.9% FY 2010-011). Most recently, for FY 2011-2012, local governments once again saw an average increase of 1.1% in General Fund Revenue.
Meanwhile, library systems, on average, have maintained four straight years of decline. From FY 2008-2011 Mecklenburg County Library has followed the local governments’ average pattern, although with larger percentage declines in FY 2009-2010 and FY 2010-2011. Charlotte Mecklenburg Library reported an increase in General Fund Revenues in the first fiscal year (-1.7% vs. 1.6% for FY 2008-2009) and then larger than average declines in both the second (-5.4% vs. -8.7% for FY 2009-2010) and third years (-4.8% vs. -19.4% for FY 2010 to 2011). For the most recent year, Charlotte Mecklenburg Library saw a decrease in General fund Revenue that exceeded the average for all libraries (-2.5% vs. -5.1% for FY 2011-2012).
From FY 2008 to FY 2011, the 14-community average percent change in local government General Fund Revenue was -2.9%. During this period, the highest percentage declines in local government General Fund Revenue were budgeted for selected years in Fulton County, GA (-16.1% in 2010 and -12.1% in 2011), Hillsborough County, FL (-11.4% in 2010), and Dallas County, TX (-8.0% in 2010). Between FY 2011 and FY 2012 saw a reversal of such large declines. For this time period, Jacksonville, FL experienced the largest decline (-3.3%), followed by Greensboro, NC (-2.2%). Mecklenburg County (-4.2%) reported neither the highest nor the lowest percentage change in General Fund Revenue budget from FY 2008 to FY 2012.
Among the library systems, the highest percentage annual cuts in General Fund Revenue budgets for FY 2008 through FY 2011 were reported by Dallas (-30.0% in 2010 and -11.1% in 2011), Charlotte Mecklenburg (-19.4% in 2011), Tampa-Hillsborough (-12.6% in 2009, another -12.6% in 2010, and -11.2% in 2011), Durham (-12.5% in 2010), and Orange County, FL (-11.0% in 2010 and -13.0% in 2011). While, on average, library systems saw a decrease between FY 2011 and FY 2012, the cuts were much lower than those seen in previous years. For the most recent year, Memphis Public Library saw a General Fund Revenue budget loss of -7.1%, Dallas Public Library saw a -6.0% loss, and Charlotte Mecklenburg Library saw a -5.1% loss.

P u b l i c L i b r a r y F u n d i n g | p. 23
Year to Year Findings
Looking at individual communities and library systems during the first time period, between fiscal years 2008 and 2009, almost all local governments in the study, including Mecklenburg County
(3.1%), showed increases in General Fund Revenue. The one exception was Nashville, which reported a decline of -2.1%. Among the library systems, eight showed an increase during the same time period, including Charlotte Mecklenburg Library (1.6% increase).
When comparing the Annual Percent Change between fiscal years 2009 and 2010, most of the communities showed a decrease in General Fund Revenue, including Mecklenburg County (-4.5%). Only three communities showed an increase in General Fund Revenue during this time period. As for the library systems, nine showed a decrease in their share of General Fund Revenue, including Charlotte Mecklenburg Library (-8.7%).
For FY 2010 and FY 2011, most communities saw an Annual Percent Change that represents a loss in General Fund Revenue. During this time period, eight communities showed a decrease in General Fund Revenue, including Mecklenburg County (-5.2%). Half of the library systems had an increase in their share of the General Fund and half showed a decrease, including Charlotte
Mecklenburg Library (-19.4%).
The annual percentage change in General Fund Revenue for FY 2011 and 2012 increased for the majority of communities, including Mecklenburg County (2.6%). Only three communities saw a General Fund Revenue loss. Library systems suffered a much greater loss. Of the fourteen library systems, ten saw a loss in General Fund Revenue. Among the ten, Charlotte Mecklenburg Library experienced the third highest loss (-5.4%).

P u b l i c L i b r a r y F u n d i n g | p. 24
TABLE 12: ANNUAL PERCENT CHANGE IN GENERAL FUND REVENUE FOR LOCAL
GOVERNMENT (COUNTY/CITY) AND FOR THEIR LIBRARY SYSTEM, FY 2008–FY 2012
% Change (FY 2008–FY 2009)
% Change (FY 2009–FY 2010)
% Change (FY 2010–FY 2011)
% Change (FY 2011–FY 2012)
City/County Library City/County Library City/County Library City/County Library Charlotte
Mecklenburg Library
3.1% 1.6% -4.5% -8.7% -5.2% -19.4%38 2.6% -5.1%
Atlanta-Fulton Public Library
System 6.6% -7.6% -16.1% -2.8% -12.1% 0.1% 5.4% -4.8%
Austin Public Library
4.7% 5.9% -1.0% -2.1% 5.7% 6.2% 6.4% 2.4%
Baltimore County Public Library
3.4% 3.6% -2.7% 5.6% -4.4% -2.0% 0.2% 1.4%
Dallas Public Library
3.6% -2.1% -8.0% -30.0% 0.4% -11.1% 1.3% -6.0%
Durham County Public Library
6.7% 6.3% 3.1% -12.5% -51.3%39 4.3% 4.4% -2.7%
Forsyth County Public Library
1.6% -1.6% 2.2% 0.5% 2.6% -4.7% 0.6% 0.9%
Greensboro Public Library
5.8% 1.0% -0.2% 0.3% -0.3% 9.9% -2.2% -2.8%
Jacksonville, FL Public Library
3.6% -1.9% 1.0% 9.0% 0.9% -5.3% -3.3% -3.5%
Memphis/Shelby County Public
Library & Info Ctr. 7.2% 6.7% -0.6% 18.6% 17.3%40 3.5% 1.6% -7.1%
Nashville Public Library
-2.1% -6.5% -3.5% -5.3% 4.9% 2.2% 2.6% 4.4%
Orange County Library System (Orlando, FL)
2.9% 0.4% -3.3% -11.0% -4.2% -13.0% -0.8% -3.1%
Tampa-Hillsborough County Public
Library
1.9% -12.6% -11.4% -12.6% -2.6% -11.2% -1.0% -4.1%
Wake County Public Library
7.0% 6.8% -3.1% -5.3% -0.2% 7.9% 0.1% -1.9%
14-Community
Average 3.8% -1.7% -3.7% -5.4% -3.9% -4.8% 1.1% -2.5%
38 If the one-time payment of $1,938,358 for FY 2011 was not included in Charlotte Mecklenburg Library’s General Fund Revenue, its annual percent change would change from -19.4% to -25.0% for FY 2011 and from -5.1% to 2.0% for FY 2012. For FY 2011 the 14-community average would also change from -4.8% to -5.4% and the FY 2012 average would change from -2.5% to -1.9%. 39 It should be noted that Durham County’s General Fund revenue for fiscal years 2008, 2009, and 2010 includes DSS Pass-Through Funds of $288,458,174 for FY2008, $319,444,380 for FY2009, and $368,393,153 for FY2010. DSS Pass-Through Funds were not reported for fiscal year 2011. If we calculate the percent change between FY 2010 and FY 2011 without including the DSS Pass-Through for FY 2010, the percent change is 1.9%. 40 The General Fund for Memphis increased by over $100 million from FY2010 to FY2011. There are several explanations for this. One is that the city transferred $41 million from its Debt Service Fund to pay for school funding commitments. Another possible explanation for the increase is due to the city’s strong property tax revenue (FY2011 includes $36.3 million revenue from property taxes compared to FY2010).

P u b l i c L i b r a r y F u n d i n g | p. 25
Relationship between local government and library system General Fund Revenue budgets
One of the reasons for examining annual percent change in General Fund Revenue figures in a side-by-side comparison of library systems and their local governments was to see if there were any consistent patterns between those two sets of funding, both from year to year and community by community. For example, is it generally true that library funding from General Revenue Fund changes in the same direction and same proportion as the local government’s General Fund Revenue does? If there are such patterns, how consistently do they appear across the communities examined in this study?
Table 12 shows that library systems’ General Fund Revenue budget moved in the same direction as their respective local governments’ General Fund Revenue budget about 63% of the time (a similar trend found in the 2011 Institute report). However, even when the two budgets moved in the same direction, they changed in similar proportions only about 43% of the time. In fact, except for the most recent fiscal year, Austin was the only community of the fourteen to budget both the same direction and magnitude of change in General Fund Revenue for both its local government and its public library system. Mecklenburg County and Charlotte Mecklenburg
Library provided a prime example of the more typical case, in that the two General Fund Revenue budgets grew and shrank together in three of the four time periods examined, but in very different proportions in each direction.
Interestingly, it appeared that as the effects of the recession became more deeply felt, the relationship between local government General Fund Revenues and library system General Fund Revenue changed. Between FY 2008 and FY 2009, changes in local government General Fund Revenue were virtually all positive and larger in magnitude than the typically positive changes in their corresponding library systems’ budgets. That is, the libraries generally did not see as large an increase as the local governments, or they saw a budget cut (typically less than 5%) despite an increase in the local government budget. In only two communities did the library systems receive a larger percentage increase in budget than did the local government. In the next two time periods (FY 2009–FY 2011), the balance shifted slightly in the library systems’ favor: five or six communities in each time period gave their libraries either a smaller percentage cut or a larger increase than was reflected in the percentage change in the local government budget. The remaining communities were split between those that showed comparable percent change in both local government and library system General Revenue Fund budgets, and those (including Mecklenburg County and the Charlotte Mecklenburg Library) that funded their library systems with either larger cuts or smaller increases than budgeted for the local government as a whole.
For the most recent budget, there appears to be almost no overall pattern in General Fund Revenue allocation for both the communities and libraries. Three library systems saw a larger increase in revenue for the Library than the community. Four library systems saw a loss in General Fund Revenue greater than that of the community. At the same time, six library systems saw a loss in revenue although the corresponding communities saw an increase in revenue (including Charlotte
Mecklenburg Library). In general, the libraries suffered a much greater loss in General Fund Revenue than communities did between FY 2011 and FY 2012. This indicated that libraries are continuing to suffer from the recession while communities are bouncing back.
P u b l i c L i b r a r y F u n d i n g | p. 26
IV. CONCLUSION When its total revenue is scrutinized, the Charlotte Mecklenburg Library experienced a -32.0% reduction between FY 2008 and FY 2012. This is about double the average reduction for the 14 library systems (-15.3%) under study. Between FY 2011 and FY 2012, the total revenue of Charlotte Mecklenburg Library decreased by -13.3%, this is the greatest decrease among the ten libraries that reported a revenue loss for this time period. Between FY 2010 and FY 2011, the Charlotte Mecklenburg Library received the highest decrease (-19.4%) in General Fund revenue.
Among the other library systems to report reduction in total revenue between FY 2011 and 2012, Memphis/Shelby County Public Library (-7.1%) and Dallas Public Library (-7.0%) had the second and third highest reductions.
When comparing the General Fund revenue of Charlotte Mecklenburg Library to its peer library systems, it was found that Charlotte Mecklenburg Library experienced the third highest decrease (-5.4%) in general funding between FY 2011 and FY 2012. Over a five-year period, the Charlotte Mecklenburg Library continues to be one of five library systems that received a higher than average reduction in its General Fund Revenue (about -29.1% difference between FY 2008 and FY 2012). In fact, the Dallas Public Library (-42.7%) and Tampa-Hillsborough County Library (-34.9%) were the only other library systems to experience a greater reduction since FY 2008 than Charlotte Mecklenburg Library.
Overall, the average General Fund Revenue of the 14 communities under study is still below what it was in 2008 (about -2.9% less). However, the average General Fund Revenue of these communities increased slightly (1.1%) between FY 2011 and FY 2012, signaling some improvement. In comparison, the average General Fund Revenue of the library systems is lower than it was in 2008 (about -13.7% less) and it decreased by -2.5% between FY 2011 and FY 2012. This reiterates that the General Fund revenue of communities and libraries is improving, but libraries are still lagging behind compared to five years ago.

APPENDICES

A p p e n d i x A : M e t h o d o l o g y | p. A-1
APPENDIX A: METHODOLOGY The same methodology approach used in the 2011 Institute Report was applied for this present study. The
Institute began its research by collecting financial reports of revenues and expenditures for FY 2012 from
each library system included in the study. The Institute also collected financial reports for FY 2012 from the
relevant local government responsible for library funding. The amounts shown for the local government entity
were the budgeted amounts of the General Fund, which was the fund that accounted for the majority of
financial transactions, excluding only those required to be accounted for in other funds. Since public libraries
were primarily funded by their local government’s General Fund, and because General Fund amounts were
more consistent year to year, the Institute chose to present the General Fund trends instead of “Total
Revenue”. Furthermore, revenue included in Total Revenue varied from community to community and
fluctuated from one year to the next because of pass-through funds from federal and state aid. Some
communities reported pass-through funds while some did not. Whenever possible, to maximize consistency
between the fourteen communities’ data, the Institute relied on reports of “approved” or “adopted” revenue
and expense budgets (including amended budgets if mid-year changes were made) and used “actual”
revenue and expense figures only when there was no other option.
For library systems, three financial measures were examined: Total Revenues, General Fund Revenues, and
Total Expenditures. Library systems’ Total Revenues were more consistently defined and showed less year-to-
year fluctuation than did their corresponding local governments’ Total Revenues, making this data a useful
point of comparison with the Library systems’ General Fund Revenues. Also, note that while budget breakouts
for “Expenditures from General Fund” were usually available for the local governments, a comparable
breakout was not typically made within the library system budgets, and so only library system total
expenditures was examined.
From its review of these documents and of those collected for the 2011 Institute report, the Institute compiled
a dataset containing FY 2008–FY 2012 data for each library system and each local government, for these
variables:
• Local Government General Fund Revenue (locally-generated revenues and fees only, excluding state
and federal grants, or designated restricted use revenues)
• Local Government General Fund Expenditures (expenditures from the General Fund only)
• Library System Total Revenue (revenue from all sources, including local government appropriations,
other grants and donations, and other fees)
• Library System General Fund Revenue (library revenue appropriated from local government, General
Funds only)
• Library System Expenditures (total expenditures, regardless of funds source)
The Institute then calculated these additional variables using the data referred to above:
• Change in Local Government General Fund Revenue (annual percent change over prior year)
• Library System Share of General Fund Revenue (as a percent of local government general fund
revenue)
• Change in Library System General Fund Revenue (annual percent change over prior year)

A p p e n d i x A : M e t h o d o l o g y | p. A-2
• Per Capita Library Expenditures (Library System Expenditures divided by the population in the local
government’s jurisdiction; see Appendix B for detailed methodology and sources of population
estimates and projections)
Furthermore, the Task Force defined three major public services in addition to the public library that local
governments may provide that could compete with libraries for a share of local government funding. For
each local government in the study, the Institute determined whether these services are currently provided:
• Public Schools • Public Safety1 • Parks & Recreation
Finally, the Task Force identified six categories of library expenses that may be administered either through
the library expense budgets or directly by the local government. The Institute determined which library
systems have expense budget responsibility for:
• Utilities • Building Maintenance • Building Security
• Human Resources • Information Technology • Public Information & Communications
In compiling the data for the study, the Institute encountered difficulties related to differences in how the
communities and library systems reported financial data. The three issues that were commonly encountered
are discussed below:
• Budget processes
• “Adopted” versus “Actual” budgets
• Organizational relationship of library system to the local government
First, and perhaps the most obvious, was that the budget process for most communities differed, particularly
for approving or adopting budgets. Some communities will approve budget figures for the next two fiscal
year budget cycles, but will make budget changes or recommendations at mid-year points. Communities also
differed regarding their fiscal year end dates (June 30th for eight of the study communities, September 30th
for five, and December 31st for one community). It should be noted that the Institute collected financial
information for each fiscal year 2008 through 2012 as reported by the source as its corresponding fiscal
year, regardless of the month in which the fiscal year ended.
A second common issue that researchers identified during the data collection process was the different terms
used for budgets by the communities in their financial reports. Published budgets were variously labeled as
“Actual Budget,” “Recommended,” “Approved,” or “Adopted.” “Actual Budget” could refer either to a final
adopted budget or to a retrospective report on actual revenues received and expenses incurred. In the latter
case, there was typically a one-year lag before the data was reported. Some communities will publish their
”Recommended” budgets with the understanding that the local government must approve or adopt it by the
start of the new fiscal year, but if no action is taken, the recommended budget is used as the approved or
adopted budget. For consistency, the research team collected “Adopted” or “Approved” budget figures
whenever possible. Any deviations from using “Adopted” or “Approved” budget figures contained in this
report are noted in the results section.
1Public Safety may include: Police, Fire Department, Emergency Medical Services, Homeland Security, Emergency Management, and other similar services.

A p p e n d i x A : M e t h o d o l o g y | p. A-3
The third common issue related to how the library is positioned within the local government. Some communities
have their library as a unit or sub-unit of a county/city department (e.g., Culture and Recreation) while others
have their library as a separate entity. How the library was situated within the local governing body
affected what reports were available. Libraries generally published their budget reports if the library was a
separate entity. Otherwise, library revenue and expense data were included in the larger community
budget, which may make it difficult to identify all categories of library revenues and expenses. However,
separate library budget reports sometimes created difficulty in matching up what the library reported as
revenue with what the county/city reported as appropriations to the library. To learn more about the various
sources that were used to collect financial data for each community and their library system, please refer to
Appendix B. Additional highlights from the fourteen communities’ published budget reports are also available
in Appendix C and further detailed information on the line items included in the budget reports can be found
in Appendix F.
Population Estimates & Per Capita Methodology
To err on the side of consistency, the “Population of Legal Service Area” in the 2011 Public Library Data
Service Statistical Report was used to calculate per capita information for fiscal years 2008 through 2012.2
While population figures may change from year to year, using the “Population of Legal Service Area” from
the Public Library Association (PLA) provided a more accurate definition of the geographic boundaries that
each of the 14 library systems served. Using the PLA report helped to eliminate potential inaccuracies caused
by community differences in funding sources, geographic service areas, and methods of reporting.
Library System Population of Legal Service Area
• Charlotte Mecklenburg Library 913,639
• Atlanta-Fulton County Library System 1,003,653
• Austin Public Library 774,636
• Baltimore County Public Library 788,994
• Dallas Public Library 1,316,350
• Durham County Public Library 265,670
• Forsyth County Public Library 359,638
• Greensboro Public Library 369,857
• Jacksonville Public Library 850,962
• Memphis/Shelby County Public Library 814,322
• Nashville Public Library 635,710
• Orange County Library System 1,052,782
• Tampa-Hillsborough County Public Library 1,205,269
• Wake County Public Library 806,489
2 The Public Library Data Service (PLDS) Statistical Report is designed to meet the needs of public library administrators and others, including media outlets, for timely and relevant library-specific data that supports a wide variety of management decisions. Published annually, the PLDS Statistical Report collects information from more than 800 public libraries across the United States and Canada on finances, library resources, annual use figures and technology. In addition, each annual PLDS report contains a special survey highlighting statistics on one service area or public library topic. It should be noted that Wake County Public Library did not participate in the 2010 Survey Report and thus its population was derived from the 2009 Survey Report of the Public Library Association.
A p p e n d i x A : M e t h o d o l o g y | p. A-4
Per Capita Calculations
Per capita calculations for “Library Total Income,” “Library Operating Expenditures,” and “Library General
Fund Income” are a function of those income and expenditure numbers being divided by the population of the
respective legal services area for the corresponding year. For example, in the “Library Total Income” column
shown in Table 4, the Charlotte-Mecklenburg Public Library Total Income for 2008 ($39,411,696) was
divided by the 2008 population estimate in the “Population of Legal Service Area” (890,515) from the Public
Library Data Service Statistical Report.
So: ($39,411,696)/ (890,515) = $44.26 (per capita library income in 2008 for the Charlotte-Mecklenburg
Public Library).

A p p e n d i x B : C o m m u n i t i e s A t - A - G l a n c e | p. B-1
APPENDIX B: COMMUNITIES AT-A-GLANCE This section informs the readers about the various sources that were used to determine the budget trends for each of the fourteen communities. In addition, this section provides an overview of the library systems of interest to this project. Whenever possible, this section also mentions if the county (or city) is responsible for public school funding. The logic for doing so is that public schools and public libraries may compete for the county dollars.
1. Mecklenburg County
Published financial information on Mecklenburg County was obtained from the county’s government website. The following budget reports were referenced for this report: FY 2012 Adopted Budget, FY 2011 Adopted Budget, FY 2010 Adopted Budget, FY 2009 Adopted Budget, FY 2008 CML Annual Audit, FY 2009 CML Annual Audit, FY 2010 CML Annual Audit, FY 2011 CML Annual Audit, FY 2011 Revised Budget from correspondence with Library Consultant Sean Hogue, and FY 2012 Library Budget.
For fiscal years 2009 through 2012, county funds were reported from the Adopted Budget for each year. The FY 2008 Adopted Budget report did not contain tables consistent with later years, so figures were based on the adopted budget amounts shown for 2008 in the 2009 report. Library budget information was found in the Charlotte-Mecklenburg Libraries Annual Audit report for FY 2008 through 2011. For FY 2012 this audit was not available, a Revised Budget was used instead.
Charlotte-Mecklenburg Public Library*
The Charlotte Mecklenburg County Public Library is comprised of twenty branches, including the Main Library located in uptown Charlotte.
Charlotte is home to ImaginOn, a unique collaborative venture of the Charlotte Mecklenburg Library and Children’s Theatre of Charlotte. ImaginOn brings stories to life through cutting edge services and award-winning professional theatre and education programs.
The Charlotte Mecklenburg County Public Library System is currently receiving much (approximately 90%) of its funding from Mecklenburg County property taxes of county residents. Other funding sources include the State of North Carolina, the Alcohol Beverage Control (ABC) Board and the City of Charlotte. Additionally, the library receives money from charges for services, contributions, special events and grants. Following recommendations from the Library Task Force, for FY 2012 the library transferred IT and HR responsibilities from the library to the county.
In addition, citizens have established several funds to help the Charlotte Mecklenburg Public Library expand the number of books available, produce educational programs and fund special programs or projects including technology enhancements. Funds are supported by private contributions, such as cash gifts, stocks, a designated recipient of all or part of an estate, a designated beneficiary of a memorial/honorary gift, a charitable endowment account and sponsorship or membership through places of employment. The Library’s annual budget is only partially covered by county dollars so citizens are encouraged to donate. Citizens can also give charitable gifts through the Charlotte Mecklenburg Library Commitment to Excellence umbrella endowment account. This fund currently consists of twelve accounts that help to fund various collections programs and activities including the enlargement of the Carolina Room collection, to honor the Library Staff Member of the Year and to purchase children’s materials. Corporate Foundation Grants or Gifts, such as the John S. and James L. Knight Foundation Fund and the Bill and Melinda Gates Foundation, help to support bilingual orientation and system-wide computer replacement.

A p p e n d i x B : C o m m u n i t i e s A t - A - G l a n c e | p. B-2
There is also a Friends of the Charlotte Mecklenburg Library group, established in 1982 for the sole purpose of supporting the Public Library, its collections, programs and services, and being a vocal advocate before elected officials, community leaders and citizens, as well as raising funds. Friends of the Charlotte Mecklenburg Library is a state chartered non-profit corporation.
The Charlotte Mecklenburg Library is a separate independent entity created by a charter from the State of North Carolina. It is not a department of the Mecklenburg County Government but Mecklenburg County provides most of its sustainable funding.
Charlotte-Mecklenburg School System*
The public school system in Mecklenburg County is consolidated with the city of Charlotte. Charlotte-Mecklenburg Schools (CMS) serves more than 141,000 students in Pre-K through 12th in 159 schools throughout the cities and towns of Mecklenburg County.
*For additional information, visit www.charmeck.org, www.cmlibraryfriends.org, www.plcmc.lib.nc.us, and www.cms.k12.nc.us
2. Atlanta-Fulton County
Published financial information on Fulton County was obtained from the county government’s website. The following budget reports were referenced for this report: FY 2012 Tentative Budget, FY 2012 Proposed Budget, FY 2011 Final Proposed Budget, FY 2011 Final Adopted Budget, FY 2010 Final Adopted Budget, FY 2009 Final Budget, and FY 2008 Final Budget.
Only a limited amount of published financial information on Atlanta-Fulton County Public Library was available online. Through an email request, the library’s branch group manager provided actual budget revenue figures for fiscal years 2008 through 2012 that were adopted by the Fulton County Commission. However, not all figures match up with the library information found in published budget reports from Fulton County. To remain consistent with using “adopted” budget figures, the library’s financial information was gathered from Fulton County’s FY 2011 & FY 2012 Proposed Budget, FY 2009 Final Adopted Budget, and FY 2008 Final Budget. It should be noted that published information on the library’s expenditures could only be found in Fulton County’s FY 2011 & 2012 Proposed Budget (except figures for FY 2008, for which no data could be found). The requested library adopted expenditures for fiscal years 2008 through 2011 were not made available by the library’s branch group manager, but were available for FY 2012.
Atlanta-Fulton Public Library System*
“The present Atlanta-Fulton County Library System began in 1902 as the Carnegie Library of Atlanta.” In 1935, library services were extended to all of Fulton County. However, it wasn’t until 1983 that the responsibility for the library system was transferred from the City of Atlanta to the County and the system “was renamed the Atlanta-Fulton Public Library.” The system has a Central Library, for which a major renovation was completed in 2002, and a total of 34 branches.
A p p e n d i x B : C o m m u n i t i e s A t - A - G l a n c e | p. B-3
Atlanta-Fulton County School System*
It is perhaps worth noting that all public education is not consolidated in Fulton County. There is the Atlanta Public Schools System with an enrollment of approximately 50,000 students and the Fulton County Schools System with a student enrollment of about 92,600.
*For additional information, visit www.afpls.org, www.fultonschools.org, www.atlanta.k12.ga.us, and www.fultoncountyga.gov
3. City of Austin
Published financial information on the City of Austin was obtained through the city’s government website. The following budget reports were referenced for this report: FY 2012 Approved Budget, FY 2011 Approved Budget, FY 2010 Approved Budget, Austin Approved Budget FY 2009, and Austin Approved Budget FY 2008.
All of the city and library budget information came from yearly Approved Budget reports. A breakdown of the library’s revenues and expenditures was found within each report.
Austin Public Library*
The first public library in Austin opened its doors in 1926. In addition to the main library, the Austin Public Library system operates twenty branches, the Austin History Center and Recycled Reads.
The library operates as a department within the City of Austin and is funded as such. However, the Austin Public Library serves the entire Travis County with minor exceptions. For example, the towns of Round Rock and West Lake Hills have their own public libraries, each of which functions as a department within the township. The annual budget of the West Lake Hills Library is approximately $1.3 million, with the funding coming from 0.5% of an 8.5% sales tax collected within the district. Travis County does not operate a public library.
The Austin Public Library is overseen by the Library Commission which “acts as an advisory board to the City Council, the City Manager, and the Library.”
Austin School System*
The city of Austin is not responsible for public school funding, but its county (Travis County) is. There are multiple school districts within Travis County. By far, the largest is the Austin Independent School District. It serves most of the City of Austin, two small communities, and the unincorporated areas in Travis County. “AISD currently enrolls about 87,000 students.”
*For additional information, visit www.ci.austin.tx.us/library, www.ci.austin.tx.us, www.westbank.lib.tx.us/auxiliary/annual_reports/annual_report_2010.pdf, and www.austinisd.org
A p p e n d i x B : C o m m u n i t i e s A t - A - G l a n c e | p. B-4
4. Baltimore County
Published financial information on Baltimore County was obtained from the county’s government website. The following budget reports were referenced for this report: : FY 2012 Annual Operation and Capital Budgets, FY 2012 Adopted Operating Budget Supporting Detail, FY 2011 Annual Operation and Capital Budgets, FY 2011 Adopted Operating Budget Supporting Detail, FY 2010 Annual Operation and Capital Budgets, FY 2010 Adopted Operating Budget Supporting Detail, and the FY 2009 Annual Operation and Capital Budgets.
It should be noted that full reports were not available for all years studied. For 2009, the adopted budget information for the county was available, but financial information for the library had to be taken from the FY 2011 Adopted Operating Budget Supporting Detail report. For this reason, actual values were used instead of adopted values for the fiscal year 2009 library information. No reports were available for fiscal year 2008. For the county totals for all funds, the actual numbers from the FY 2010 Annual Operation and Capital Budgets were used. This report did not have information on the 2008 general fund, so the estimates from the FY 2009 Annual Operation and Capital Budgets report were used. Financial information for the library’s revenues and expenditures for 2008 was obtained from the FY 2010 Adopted Operating Budget Supporting Detail report.
Baltimore County Public Library*
In 1948, twelve independent libraries were consolidated to form the Baltimore County Public Library. The system now consists of a central office, four bookmobiles and seventeen branch libraries distributed throughout much of the county.
The City of Baltimore did not participate in the consolidation. It operates its own library system, referred to as the Enoch Pratt Free Library, which has twenty-two branches in addition to the central library.
The Baltimore County Public Library is not a department of the county. While it is considered to be an Agency Controlled by Charter and/or County Funding, it is legally separate from the county. It is governed by a seven-member Board of Library Trustees appointed by the County Executive.
Baltimore County School System*
Baltimore County is also responsible for a public school system that enrolls approximately 105,000 students.
*For additional information, visit www.bcpl.info, www.bcps.org, www.prattlibrary.org and www.baltimorecountymd.gov.

A p p e n d i x B : C o m m u n i t i e s A t - A - G l a n c e | p. B-5
5. City of Dallas
Published financial information on the city of Dallas was obtained from the city’s government website. The following budget reports were referenced for this report: Dallas City Adopted Budget FY 2012, Dallas City Adopted Budget FY 2011, Dallas City Adopted Budget FY 2010, Dallas City Adopted Budget FY 2009, and Dallas City Adopted Budget FY 2008.
All city and library financial information was available from the Adopted Budget for each year. Library adopted expenditure amounts were not available in the FY 2008 Adopted Budget. Therefore, the estimated amounts were used from the FY 2009 Adopted Budget.
Dallas Public Library*
The Dallas Public Library is a department of the City of Dallas, but provides services to most of Dallas County through a central library and twenty-seven branches. Some towns, for example, Garland and Mesquite, operate their own public libraries.
The Dallas Public Library is overseen by a fifteen-member Municipal Library Board. The chair is an “at-large” appointment made by the Mayor. Each other member is from a specific district and is appointed by the member of the City Council who represents that district.
Dallas School System*
The city is not responsible for the funding of the school system, but the county that shares its name with the city is. There are several school districts in Dallas County, including the Dallas Independent School District. Representing one of the largest school districts in the county, Dallas Independent School district currently enrolls more than 157,000 students.
*For additional information, visit www.dallascityhall.com, www.dallascounty.org, www.dallasisd.org, and www.dallaslibrary2.org.

A p p e n d i x B : C o m m u n i t i e s A t - A - G l a n c e | p. B-6
6. Durham County
Published financial information on Durham County was obtained from the county’s government website. The following budget reports were referenced for this report: Adopted Budget FY 2012, Adopted Budget FY 2011, Adopted Budget FY 2010, Adopted Budget FY 2009, and Adopted Budget FY 2008.
All of the county and library budget information was available within the Adopted Budget report for each year. The county reports the share of the library’s general fund as an expenditure. For these reports, the library’s general fund revenue was budgeted from the county’s general fund budget. If the library’s share of the general fund was not considered a revenue source for the library, its total revenues would be much less for each fiscal year.
Durham County Public Library*
The Durham Public Library opened in 1898. The system currently operates the main library, four regional libraries, three branches and two mobile units. All four regional libraries have opened in recent years, the first, East Regional, in 2006.
The library is a department of Durham County with the director reporting directly to the County Manager. Members of the library’s Board of Trustees are appointed by the County Commissioners.
Durham County School System*
The Durham City School System and the Durham County School System merged in 1992 to form the Durham Public Schools, which currently enrolls approximately 33,000 students. All Durham County funding is from general funds. The supplemental taxing districts were discontinued with the merger.
*For additional information, visit www.durhamcountylibrary.com, www.dpsnc.net and www.co.durham.nc.us.
7. Forsyth County
Published financial information on Forsyth County was obtained from the county’s government website, as well as the Library’s website. The following budget reports were referenced for this report: FY 2012 Adopted Budget, FY 2011 Adopted Budget, FY 2010 Adopted Budget, FY 2009 Adopted Budget, FY 2008 Adopted Budget and FY 2008-2009 Library Financial Summary.
All of the amounts used came from the county’s Adopted Annual Budget reports. The FY 2008-2009 Library Financial report was the only year available from the library website, so this was only used for reference purposes. The county reports the share of the library’s general fund as an expenditure. For these reports, the library’s general fund revenue was budgeted from the county’s general fund budget. Additional revenues were also listed, which included funds from the Library Services Technology Act, Chatham Grants, National Endowment of the Arts grants, and other sources.
Forsyth County Public Library*
The Forsyth County Public Library states that it was founded in 1906. Prior to coming under the county government in 1965, it was operated by the City of Winston-Salem. Currently, it carries out its county-wide mission through a central library located in downtown Winston-Salem and nine branches located throughout the county.

A p p e n d i x B : C o m m u n i t i e s A t - A - G l a n c e | p. B-7
The Forsyth County Library Board of Trustees was established in 1965 as an advisory board. Its primary purposes is advising the Forsyth County Board of Commissioners on library matters and assisting the Forsyth County Public Library. The seven members are appointed by the Board of County Commissioners.
The library is a department within the Culture and Recreational Service Area of the county government.
Forsyth County School System*
The Winston-Salem/Forsyth County Schools is a consolidated, county-wide system formed in 1963 with the merger of the Winston-Salem and Forsyth County systems. It currently enrolls about 52,000 students. Although there is an elected Board of Education, the Board of County Commissioners is responsible for enacting the annual budget of the school system.
*For additional information, visit www.co.forsyth.nc.us, www.wsfcs.k12.nc.us and www.forsythlibrary.org.
8. City of Greensboro
Published financial information on the city of Greensboro was obtained from the city’s government website. The following budget reports were referenced for this report: Adopted Budget 2012, Adopted Budget FY 2011, Adopted Budget FY 2010, and Adopted Budget FY 2009.
City and library adopted values were available from the Adopted Budgets for FY 2009 through 2012. The FY 2008 Adopted Budget was not available. The budgeted numbers from the 2009 report were used instead.
Greensboro Public Library*
Greensboro’s county, Guilford, does not have a county-wide library system. The two largest libraries in the county are Greensboro Public Library and High Point Public Library.
The Greensboro Public Library is a department of the City of Greensboro. In addition to a central library in downtown Greensboro, it operates six branches and the Greensboro Historical Museum. In 2011-2012, its approved budget was about $8.4 million with about $1.5 million provided by Guilford County in recognition of the usage of the city libraries by county residents who do not live in Greensboro.
The Greensboro Public Library Board of Trustees acts in an advisory capacity to the City Council. Nine of the eleven members are appointed by the City Council; one is appointed by the Guilford County Board of Commissioners and one position is held by the President of the Friends of the Library.
Greensboro School System*
Local funding of public education is the responsibility of the county. Guildford County is served by a consolidated, county-wide public school system that enrolls about 72,000 students.
*For additional information, visit www.greensboro-nc.gov, www.gcsnc.com and www.co.guilford.nc.us.

A p p e n d i x B : C o m m u n i t i e s A t - A - G l a n c e | p. B-8
9. City of Jacksonville
Published financial information on the city of Jacksonville was obtained from the city’s government website. The following budget reports were referenced for this report: FY 2012 Annual Budget, FY 2011 Annual Budget, FY 2010 Annual Budget, FY 2009 Annual Budget, FY 2008 Annual Budget, and the Budget Comparison Spreadsheet provided by Deputy Director of the Jacksonville Public Library, Barrett King.
Annual Budget reports are used for all city information, as well as for library expenditures for each fiscal year. Library revenues were not available for FY 2008 through 2011, but were provided in a Budget Comparison spreadsheet by the Deputy Director of the Jacksonville Public Library, Barrett King. This information was available in the FY 2012 Annual Budget.
Jacksonville Public Library*
In 1905 the “Jacksonville Free Public Library” opened in a new building made possible by a gift from Andrew Carnegie. Various branches were established in subsequent years.
A referendum to consolidate the county and the various city governments within Duval County was held in the fall of 1967. It was adopted by a two to one margin, but the municipalities of Atlantic Beach, Baldwin, Jacksonville Beach and Neptune Beach voted not to join. These municipalities provide about 6% of the total county population.
The formal consolidation took place in 1968, with the resulting entity referred to as the “City of Jacksonville.” Through this consolidation process, the Jacksonville Public Library became an entity within the consolidated city/county government.
The Jacksonville Public Library is referred to as a “department.” It serves the entire county, including the four municipalities that are not a formal part of the City of Jacksonville.
In addition to the new main library that opened to the public in 2005, the system operates twenty branches, ten of which are regional.
Jacksonville School System*
The Duval County School system, along with the Jacksonville Public Library, is an entity within the consolidated city/county government. Duval County Schools enrolls about 125,000 students.
*For additional information, visit www.coj.net, www.jpl.coj.net, and www.duvalschools.org

A p p e n d i x B : C o m m u n i t i e s A t - A - G l a n c e | p. B-9
10. City of Memphis
Published financial information on the city of Memphis was obtained from the city’s government website. The following budget reports were referenced for this report: FY 2012 Adopted Budget, FY 2011 Adopted Budget, FY 2010 Adopted Budget, FY 2009 Adopted Budget, FY 2008 Adopted Budget, FY 2009 Library Annual Report, and FY 2008 Library Annual Report.
All of the city’s General Fund amounts were reported from the Adopted Budget for each year. For the 2008 fiscal year, the actual numbers were used based on the 2010 Adopted Budget. For 2009, the operating budget numbers were used from the 2010 Adopted Budget. The library’s revenue and expenditure information came from the Memphis Public Library Annual Report for fiscal years 2008 and 2009. These reports were not available for 2010 through 2012, so the information was gathered from the Public Services and Neighborhoods section of the Adopted Budget for each year.
Memphis Public Library and Information Center*
The first public library in the City of Memphis began its existence in 1888 as the Cossitt-Goodwyn Institute. However, the current library gives 1893 as the year of its founding. The system became known as the Memphis-Shelby County Library and provided bookmobile services provided to the outlying towns in the county. Additional branches were also built in subsequent years.
In 2004 Shelby County Government took action to withdraw funding of suburban library operations. Currently, four towns operate their own libraries: Arlington, Collierville, Germantown, and Millington.
Through the Benjamin L. Hooks Central Library and seventeen branches, the Memphis Public Library and Information Center serves the City of Memphis and the City of Bartlett. The library is a city department within the Division of Public Services and Neighborhoods. Its principal financial support derives from the general fund revenues of the City of Memphis. The Mayor is responsible for appointing the members of the Memphis Public Library and Information Center Board.
Memphis City School System*
Memphis City Schools, with an enrollment of approximately 110,000 students, is overseen by a Board of Education that is legally separate from the City of Memphis’ primary government and its budget is approved separately by the Memphis City Council. Shelby County also operates a school system with an enrollment of approximately 48,000 students. These two school districts will consolidate beginning with the 2013-14 school year.
*For additional information, visit www.memphislibrary.org, www.cityofmemphis.org, www.mcsk12.net, www.scsk12.org and www.shelbycountytn.gov.

A p p e n d i x B : C o m m u n i t i e s A t - A - G l a n c e | p. B-10
11. City of Nashville
Published financial information on the city of Nashville was obtained from the city’s government website. The following budget reports were referenced for this report: FY 2012 Operating Budget, FY 2011 Operating Budget, FY 2010 Operating Budget, FY 2009 Operating Budget, and FY 2008 Operating Budget.
All of the values used came from the city’s Operating Budget reports. The city reports the share of the library’s general fund as an expenditure. For these reports, the library’s general fund revenue was budgeted from the city’s general fund budget. If the library’s share of the general fund were not considered a revenue source for the library, its total revenues would be significantly less for each fiscal year.
Public Library of Nashville and Davidson County*
The Nashville Public Library was opened to the public in 1904 in a new building made possible by a gift from Andrew Carnegie. Several branch libraries were established prior to the Nashville Public Library being formally turned over to the city in 1959.
The Nashville and Davidson County governments consolidated into a single entity under the Metropolitan Charter effective April 1, 1963. The Nashville Public Library was made a part of the General Service Area under the new Metropolitan Government. The county-wide system is referred to as the Public Library of Nashville and Davidson County.
There are currently twenty branch libraries in addition to a new main library completed in 2001 and located in downtown Nashville.
The Metropolitan Government is lead by a full-time Mayor. The director of the library reports to the Mayor.
Nashville-Davidson County School System*
Metropolitan Nashville Public Schools is a county-wide system formed in 1963 through the consolidation of Nashville and Davidson County schools. It is overseen by a nine-member elected Board of Education. However, funds for the system’s operations are approved and provided by the Metropolitan Council, as the Board of Education has no taxing authority. The current enrollment is approximately 79,000 students, Pre-School through High School.
*For additional information, visit www.library.nashville.org; www.mnps.org; and www.nashville.gov.

A p p e n d i x B : C o m m u n i t i e s A t - A - G l a n c e | p. B-11
12. Orange County
Published financial information on Orange County was obtained from the county’s government website. The following budget reports were referenced for this report: FY 2012 Adopted Budget, FY 2011 Adopted Budget, FY 2010 Adopted Budget, FY 2009 Adopted Budget, FY 2008 Adopted Budget, FY 2012 Library Operating Fund Budget, FY 2011 Library Operating Fund Budget, FY 2010 Library Operating Fund Budget, FY 2009 Library Operating Fund Budget, and FY 2008 Library Operating Fund Budget.
County fund information came from the Adopted Budget report for each fiscal year. All library financial information was gathered from the Library Operating Fund Budget for each fiscal year.
Orange County Library System*
Orlando’s first library, Albertson Public Library, was founded in 1920. This evolved into a county-wide system that currently consists of a main library and fourteen branches.
Via a special state legislative act and approval by referendum in the fall of 1980, the Orange County Library District was established as an independent special taxing district, to provide library services for Orange County, Florida (exclusive of the Cities of Winter Park and Maitland).
The District’s Governing Board is comprised of the Board of County Commissioners of Orange County and one member appointed by the City Council of the City of Orlando, Florida. The powers of the Governing Board are primarily limited to levying taxes, issuing long-term debt, appointing members of the Board of Trustees. The five-member Library Board of Trustees is responsible for managing, administering, and operating all library facilities and services of the District.
The principal funding for the library, the school system, and the remaining county services are derived from property taxes.
Orange County School System*
The county-wide school system also functions as an independent special taxing district. The system currently enrolls approximately 180,000 students.
*For additional information, visit www.ocls.info, www.ocps.net and www.orangecountyfl.net.

A p p e n d i x B : C o m m u n i t i e s A t - A - G l a n c e | p. B-12
13. Tampa-Hillsborough County
Published financial information on Tampa-Hillsborough County was obtained from the county’s government website. The following budget reports were referenced for this report: Adopted Budget FY 2012, Adopted Biennial Budget for FY 2012 and FY 2013, Adopted Biennial Budget for FY 2010 and FY 2011, Adopted Biennial Budget for FY 2008 and FY 2009, and the Library Fiscal Year Budgets for 2008-2012 from correspondence with David Wullschleger, Operation Manager for Hillsborough County Library Services.
County financial information for fiscal year 2009 through 2011 is from the Adopted Biennial Budget for FY 2010 and FY 2011. FY 2011 financial information has been updated using the Adopted Biennial Budget for FY 2012 and FY 2013. For fiscal year 2008, the Adopted Biennial Budget for FY 2008 and FY 2009 was used since this report provided adopted numbers for this fiscal year. Information for library revenues and expenditures are from the Library Fiscal Year Budgets for 2008-2012 provided by David Wullschleger, Operation Manager for Hillsborough County Library Services.
Tampa-Hillsborough County Public Library System*
In 1912, West Tampa accepted funds from Andrew Carnegie to operate a public library. The West Tampa Library began operations in 1915. The City of Tampa also received a grant and opened the Tampa Public Library in 1917. In 1925, the West Tampa Library merged with the Tampa Public Library System.
Additional branches were opened in subsequent years. In 1961, the City of Tampa and Hillsborough County, through a contractual agreement, consolidated libraries into one system. In 1984 the state legislature passed an act that created the Tampa-Hillsborough County Public Library System, which would be a department of the county. The purpose is to provide a unified system of free library services for all citizens within the library District of Hillsborough County. The act further stated that the Public Library System shall be funded by the County. Most of that funding is derived via a Special Library Taxing District.
In addition to the main library, the system operates eight regional libraries, seventeen branch libraries, multiple electronic libraries, and two mobile units. Electronic libraries are referred to as eLibraries and appear to be principally located in recreation centers.
The system is overseen by a Public Library Board, with its twelve members appointed by the Board of County Commissioners. Its role is to recommend and advise.
Hillsborough County School System*
The Hillsborough County School System currently enrolls approximately 192,500 pre-K through grade 12 students. It and is overseen by an elected, seven-member School Board.
*For additional information, visit www.hillsboroughcounty.org, www.thpl.org, www.hcplc.org, and www.sdhc.k12.fl.us.

A p p e n d i x B : C o m m u n i t i e s A t - A - G l a n c e | p. B-13
14. Wake County
Published financial information on Wake County was obtained from the county’s government website. The following budget reports were referenced for this report: FY 2012 Adopted Budget, FY 2011 Adopted Budget, FY 2010 Adopted Budget, FY 2009 Adopted Budget, and FY 2008 Adopted Budget.
All of the county and library budget information was available within the Adopted Budget report for each year. The county reports the share of the library’s general fund as an expenditure given to “Community Services,” the county department that the library falls under. For these reports, the library’s revenue was calculated by adding the “Community Services” department expenditures for the library to the revenues from other sources.
Wake County Public Libraries*
The first public library in Wake County began operations in downtown Raleigh in 1901. Additional, but independent, libraries were subsequently established. However, by 1985 all public libraries had been consolidated into a county-wide system, with full fiscal responsibility assumed by Wake County.
The concept subsequently adopted was to close the system’s outdated main library and to implement a regional library structure whereby large, full-service libraries were developed in major geographic quadrants and/or population centers of the county. Currently, there are twenty sites, with six of those serving as regional libraries.
The Wake County Public Libraries is one of four departments within the Division of Community Services of Wake County Government.
Wake County School System*
The Wake County Public School system is governed by a nine-member, elected Board of Education. The Board of Education has budget review authority, but it is not a taxing body and must submit its annual budget requests to the Wake County Board of Commissioners. The Board of Commissioners control allocation of funds to the schools. Wake county Public School system currently enrolls about 143,000 students.
*For additional information, visit www.wakegov.com, www.wakegov.com/libraries and www.wcpss.net.
A p p e n d i x C : C o m m u n i t y B u d g e t H i g h l i g h t s | p. C-1
APPENDIX C: COMMUNITY BUDGET HIGHLIGHTS
Budget highlights found in the published budget reports of the fourteen communities of interest for this project are presented here to help explain some of the factors that influenced the budget process that is reflected in the figures contained the report.
1. Mecklenburg County: In adopting the FY 2010 budget, the Board of County Commissioners approved reductions of $75.6 million in spending. Additional cuts were made by the county through mid-year reductions totaling just over $20 million, which resulted in additional layoffs in code enforcement and libraries. The FY 2011 Adopted Budget had even deeper budget cuts. In fact, the FY 2011 Adopted Budget is $146.7 million less than the adopted FY 2009 budget.1 For FY 2012, funding levels have been reinstated to those consistent with FY 2009. To bring the funding level back to those of FY 2009, the FY 2012 Adopted Budget represents a $35.5 million increase over the FY 2011 Adopted Budget.2
2. Atlanta-Fulton County: For FY 2012, the County adopted a new 2012-2014 Strategic Plan. This initiative has allowed the county to address declining or stagnant revenue from property tax differently. To ensure that the recurring expenditures are balanced with recurring revenues, the county has recommended reductions in some programs and county positions. Atlanta-Fulton is expecting a 2% decline in property tax revenue for FY 2012. The property tax rate has remained unchanged since FY 2007.3 Compared to FY 2010, expenditures for the FY 2011 General Fund remained relatively flat.4 In anticipation of decreased FY 2010 revenues, the county reduced its budget by $130.1 million compared to its previous year budget.5
3. Austin City: For its FY 2009 General Fund budget, an increase in new property on the tax rolls resulted in at least $20.5 million of additional revenue from property taxes compared to 2008 revenue.6 The city also experienced an increase of 1.8% in its property value between 2009 and 2010, which includes $1.7 billion in new construction. Once again the FY 2012 budget recommends increasing revenue through a 3.7% increase in the overall property tax rate. Even with this potential increase in revenue, the FY 2012 budget includes $6.9 million in spending cuts and new revenue.7
4. Baltimore County: For FY 2012 the budget remains relatively unchanged, with only a .13% decrease in General Fund spending and a .04% increase in expenses. The balancing of FY 2012 budget did not require new taxes nor an increase in property or income tax rates. Unfortunately, due to revenues from taxes remaining flat, the county has had to shift back to a reliance on bonds, rather than Pay-As-You-Go (PAYGO) funding.8 The FY 2011 budget reflected successful steps taken to secure two-year contracts with labor unions that reduce retirement and health care costs in exchange for a pledge to fund step and longevity increases, as well as no furloughs or layoffs during FY 2011 and FY 2012. These significant cost-containment actions follow other efforts taken in FY 2010 to address a major
1 Source: http://charmeck.org/mecklenburg/county/CountyManagersOffice/OMB/Budget/PriorBudgets/Documents/FY11RecBudRevisionsFinalDoc51710.pdf 2 Source: http://charmeck.org/mecklenburg/county/CountyManagersOffice/OMB/BudgetBooks/FY2012BudgetBook.pdf 3 Source: http://www.co.fulton.ga.us/images/stories/FY2012_Proposed_Budget.pdf 4 Source: http://www.co.fulton.ga.us/images/stories/2011_Final_Budget_Book.pdf 5 Source: http://www.fultoncountyga.gov/images/stories/Fulton_County_2010_Proposed_Budget.pdf 6 Source: http://www.ci.austin.tx.us/budget/08-09/downloads/Executive_FINAL_reduced.pdf 7 Source: http://www.ci.austin.tx.us/budget/11-12/downloads/fy12_approved_volume1.pdf 8 Source: http://resources.baltimorecountymd.gov/Documents/Budget/12budget/fy12adoptedoperatingcapitalbudget.pdf

A p p e n d i x C : C o m m u n i t y B u d g e t H i g h l i g h t s | p. C-2
revenue shortfall. Along with a midyear reduction in State aid, the County learned that a major over-distribution of Income Tax revenues had been made during FY 2009. Baltimore County needed to return the overpayment and address the obvious gap in the income base assumed in the FY 2010 revenue estimates. Baltimore County met the challenge of this revenue shortfall by releasing operating dollars previously committed to the capital budget and by releasing excess funding in a health care reserve account. In addition, it should be noted that during the real estate boom of 2003–2006, rather than using excess tax revenues to expand on-going budget costs, Baltimore County funneled excess receipts into PAYGO funding of the Capital Budget. This decision provided Baltimore County with the flexibility in FY 2010 to replace $118 million in PAYGO cash with bonds and allow the PAYGO cash to fall into the General Fund Balance, thus mitigating the Income Tax loss.9
5. Dallas City: Property values decreased 4.4% from $87.3 billion in 2009 to $83.4 billion in 2010. However, the city’s budget process for FY 2011 includes a $0.0491 property tax rate increase to enhance revenues and lessen service reductions.10 For FY 2012 the decrease in property values has slowed, showing a 1.72% drop from FY 2011. This has allowed the city to not place any additional tax burdens on their citizens.11
6. Durham County: Unlike the year prior, for FY 2012 the budget did not include a tax rate increase. A budget shortfall for the year was addressed through the cutting of expenditures.12 For FY 2011, some of the budget highlights include a tax rate increased from 70.81 cents/$100 valuation to 74.59 cents/$100 valuation (0.71 cents for debt service and 3.07 cents for increased Durham Public Schools current expense funding); property tax revenue collection percentage stayed flat at 97.5%, the same as budgeted in FY 2010; and sales taxes, including the Interlocal Agreement with the City of Durham, are estimated to decrease 4.13% in FY 2011 due to the continued downturn in the economy as well as Medicaid Swap legislation changes with the State of North Carolina.13
7. Forsyth County: FY 2012 marks the 7th consecutive year in which the county did not place any additional tax burdens on its citizens. Without a way to increase revenue, the FY 2012 budget required the reduction of expenditures, some of which will come through the net reduction of 18 full-time and 27 part-time positions.14 The county’s two main revenue sources, property tax revenues and sales tax revenues declined in FY 2011. The reduction in property taxes reflects the reduced collection rate in the previous fiscal year and a lower valuation of motor vehicles.15 In FY 2010, the Board of Commissioners balanced the budget without a tax increase by reducing operating expenses by more than $8 million and eliminating almost 50 positions.16
9 Excerpt from http://resources.baltimorecountymd.gov/Documents/Budget/11budget/FY2011AdoptedOperatingCapitalBudget.pdf 10 Source: http://dallascityhall.com/Budget/adopted1011/FY11_adoptedBudget.pdf 11 Source: http://dallascityhall.com/Budget/adopted_1112/Adopted%20FY12_BudgetBook.pdf 12Source:http://www.co.durham.nc.us/departments/bdmg/Budgets/FY11-12/Adopted/PDF/01-Front%20of%20Document%20Section.pdf 13 Source: http://www.co.durham.nc.us/departments/bdmg/Budgets/FY10-11/Adopted/PDF/01-Front%20of%20Document%20Section%20%28Partial%29.pdf. 14 Source: http://www.co.forsyth.nc.us/budget/budget1112/manager_message.pdf 15 Source: http://www.co.forsyth.nc.us/Budget/budget1011/manager_message.pdf. 16 Source: http://www.co.forsyth.nc.us/Budget/budget0910/mngrmessage10.pdf.
A p p e n d i x C : C o m m u n i t y B u d g e t H i g h l i g h t s | p. C-3
8. Greensboro City: FY 2012 saw a reorganization of the budget. Through these changes the city was able to identify budget solutions totaling $18 million, $5 million of which came from the General Fund.17 The City of Greensboro relies on property taxes to raise about one-third of the net revenues needed to support municipal operations in all funds. Both the FY 2011 and FY 2012 budget is balanced with a property tax rate of 63.25 cents, which is one-quarter cent below the adopted rate for FY 2010.
9. Jacksonville City: Continuing with the budget cutting measures in FY 2011, 2012 saw $58 million in expenses cut from the General Fund. Some of savings came from salary reduction and the elimination of positions, including the Mayor who took a 20% pay cut.18 The FY 2011 budget included deep cuts to operating expenses. In addition to employee wage reductions and other concessions on other benefits costs, the city also eliminated $22 million in operating expenses from government for FY 2011. These cuts were in addition to the tens of millions the city eliminated over the past several years. Furthermore, a total of $46 million in expenses were cut from the general fund during the budget process in FY 2011. The savings include $20 million from reductions in salary and benefit costs (including $5.6 million from eliminated positions) and $26 million in departmental and non-departmental operating cost savings from a variety of sources. In total, all but two departments within the city’s general fund experienced a reduction in their total budget from fiscal year 2010 to fiscal year 2011. With these reductions and a strong tax base revenue, (the city’s tax revenues were in an upward trend from FY 2008 to FY 2012), Jacksonville fared better than most communities did. 19
10. Memphis City: Both FY 2011 & FY 2012 budgets reflect conservative to moderate revenue growth, including stronger property and sale tax revenues. The FY 2011 budget also includes a transfer of $41 million from the Debt Service Fund. This additional funding provided revenue to support school funding commitments. In addition, FY 2011 Operating Expense Budget includes $60 million of new expenses for schools.20 In FY 2009 a special school tax rate was removed, creating an expense for the city without a revenue source. For FY 2012 a onetime $0.18 cents property tax increase is included as a revenue source to offset the cost of funding Memphis City Schools.21
11. Nashville City: For the fourth year in a row the Nashville metropolitan government was able to avoid a property tax increase. While budgetary reductions were necessary for FY 2012, Nashville was able to limit departmental budget cuts to only 3%. Even with the budgetary cuts, both the Metro School and Public Library received additional funding for in 2012.22 The FY 2011 budget included a projected increase of $36.3 million revenue from property taxes compared to FY 2010. It should also be mentioned that in FY 2011 Metro Schools received a $25 million increase over the general fund dollars allocated in FY 2010.23
17 Source: http://www.greensboro-nc.gov/modules/showdocument.aspx?documentid=10075 18 Source: http://www.coj.net/getattachment/Departments/Finance/Budget/Adopted-Annual-Budget-FY-11---FY-12-with-page-numbers.pdf.aspx 19 Source: http://www3.coj.net/Departments/Finance/Docs/Budget/FY11-Department-Budgets/FY11-Budget-Book-FINAL.aspx 20 Source: http://memphistn.gov/pdf_forms/FY2011_AD_OP/BudgetOverview.pdf. 21 Source: http://www.memphistn.gov/pdf_forms/fy2012_adopted_op/MemphisOpbudget2012Adopted.pdf 22 Source: http://www.nashville.gov/citizens_budget/docs/budgetbook/fy2012/fy12_final_budget.pdf 23 Source: http://www.nashville.gov/citizens_budget/docs/budgetbook/fy2011/fy11_final_budget.pdf.

A p p e n d i x C : C o m m u n i t y B u d g e t H i g h l i g h t s | p. C-4
12. Orange County: For FY 2012 property values have continued to drop, abet at a lower rate of just 2.4%. In total, property tax revenues have dropped by 24% since FY 2008 with the expected collection amount from the tax matching those of FY 2006.24 Property values were estimated to fall by 12.0% for the FY 2011 tax year, which translated into a $77 million revenue reduction. One of the ways the County prepared for this shortfall was to ask departments to submit a 7.0% reduction to their operating budget for FY 2011.25
13. (Tampa) Hillsborough County: FY 2008 through FY 2011 saw operating budgets supported by the County’s two major tax funds (property tax and half-cent sales tax) tightened due to Legislative actions, the approved passage by the voters of Amendment One, and worsening economic conditions.26 This trend is continuing for FY 2012 and FY 2013. The adopted budget for FY 2012 is $612 million less than FY 2011, primarily resulting from a decrease in debt service, transfers, and the Capital Improvement Program. As with many other county governments, shortfalls in revenue have been met through the reduction or elimination of positions and operating costs.27
14. Wake County: In contrast to expected weakening in property tax revenue, for FY 2011 property tax revenues grew. The growth was at a much slower rate than before. 28 For FY 2012 the county once again expects a slight growth in revenue. The continued growth in property tax revenue has been accomplished without an increase in the property tax rate. Another indicator of growth for FY 2012 is a 1.8% increase in projected sales tax revenue. While the budget for FY 2012 remained relatively unchanged from FY 2011, departments were asked to budget their expenditures to mirror actual expenditures in FY 2010. They were also asked to identify ways to further reduce their budget by 3%.29
24 Source: http://www.orangecountyfl.net/Portals/0/Resources/Internet/DEPARTMENTS/County_Admin/OMB/docs/FY%202012%20Adopted%20Budget%20Book%20Sect%201%20and%202.pdf 25 Source: http://www.orangecountyfl.net/Portals/0/Resources/Internet/govern/Budget/docs/2011Budget/Section%2001%20-%20BIB.pdf. 26 Source: http://www.hillsboroughcounty.org/managementbudget/budgets/adopted/fy11/publications/adpfy11exsummary.pdf. 27 Source: http://www.hillsboroughcounty.org/managementbudget/budgets/adopted/fy12/publications/adpfy12fy13budget.pdf 28 Source: http://www.wakegov.com/NR/rdonlyres/F8746C7A-AE8D-4FBC-977C-71C32E3A4A31/0/wake_fy2011_adopted_budget.pdf. 29 Source: http://www.wakegov.com/NR/rdonlyres/07B77A88-985E-41BD-88D4 AFC481C291AE/0/fy2012budget_message.pdf
A p p e n d i x D : B i b l i o g r a p h y | p. D-1
APPENDIX D: BIBLIOGRAPHY
Atlanta-Fulton County FY 2012 Tentative Budget http://www.co.fulton.ga.us/images/stories/Tentative_Budget_document_-_12_19_11.pdf)
Atlanta-Fulton County FY 2012 Proposed Budget (http://www.co.fulton.ga.us/images/stories/FY2012_Proposed_Budget.pdf)
Atlanta-Fulton County FY 2011 Final Proposed Budget (http://www.fultoncountyga.gov/images/stories/Finance/FY2011_Proposed_Budget_Book_11_17_10.pdf)
Atlanta-Fulton County FY 2011 Final Adopted Budget (http://www.fultoncountyga.gov/images/stories/communications/FY2011_Final_Adopted_Budget_for_Website.pdf)
Atlanta-Fulton County FY 2010 Final Adopted Budget (http://www.fultoncountyga.gov/images/stories/FY10_final_adopted_budget1-20.pdf)
Atlanta-Fulton County FY 2009 Final Budget (http://www.fultoncountyga.gov/images/stories/Finance/2009%20Final%20Adopted%20Budget.pdf)
Atlanta-Fulton County 2008 Fiscal Year Final Budget (http://www.fultoncountyga.gov/images/stories/Finance/FY2008%20Final%20Budget2.pdf)
Austin FY 2012 Approved Budget Vol. I (https://assets.austintexas.gov/budget/11-12/downloads/fy12_approved_volume1.pdf)
Austin FY 2011 Approved Budget Vol. I (http://www.ci.austin.tx.us/budget/10-11/downloads/fy11approved_budget_vol1.pdf)
Austin FY 2010 Approved Budget (http://www.ci.austin.tx.us/budget/09-10/downloads/Exe%20Final%20Draft.pdf)
Austin Approved Budget FY 2009 (http://www.ci.austin.tx.us/budget/08-09/downloads/Executive_FINAL_reduced.pdf)
Austin Approved Budget FY 2008 (http://www.ci.austin.tx.us/budget/07-08/downloads/ab0708execsum.pdf)
Baltimore County 2012 Fiscal Year Annual Operation and Capital Budgets (http://resources.baltimorecountymd.gov/Documents/Budget/12budget/fy12adoptedoperatingcapitalbudget.pdf)
Baltimore County FY 2012 Adopted Operating Budget Supporting Detail (http://resources.baltimorecountymd.gov/Documents/Budget/12budget/fy12opersupportdetail.pdf)
Baltimore County 2011 Fiscal Year Annual Operation and Capital Budgets (http://resources.baltimorecountymd.gov/Documents/Budget/11budget/FY2011AdoptedOperatingCapitalBudget.pdf)
Baltimore County FY 2011 Adopted Operating Budget Supporting Detail (http://resources.baltimorecountymd.gov/Documents/Budget/11budget/fy11opersupportdetail.pdf)

A p p e n d i x D : B i b l i o g r a p h y | p. D-2
Baltimore County 2010 Fiscal Year Annual Operation and Capital Budgets (http://resources.baltimorecountymd.gov/Documents/Budget/fy2010adoptedbook.pdf)
Baltimore County FY 2010 Adopted Operating Budget Supporting Detail (http://resources.baltimorecountymd.gov/Documents/Budget/080910budgets/fy10adoptedob.pdf)
Baltimore County 2009 Fiscal Year Annual Operation and Capital Budgets (http://resources.baltimorecountymd.gov/Documents/Budget/080910budgets/fy09adoptmsg.pdf)
Charlotte-Mecklenburg County FY 2012 Adopted Budget (http://charmeck.org/mecklenburg/county/CountyManagersOffice/OMB/BudgetBooks/FY2012BudgetBook.pdf)
Charlotte-Mecklenburg County FY 2011 Adopted Budget (http://charmeck.org/mecklenburg/county/CountyManagersOffice/OMB/Budget/PriorBudgets/Documents/FY11RecBudRevisionsFinalDoc51710.pdf)
Charlotte-Mecklenburg Public Library FY 2011 Revised Budget, (Email communication with Library Consultant Sean Hogue, 11/29/2010, and Library Task Force Chair Dr. James Woodward, 12/30/2010)
Charlotte-Mecklenburg County FY 2010 Adopted Budget (http://charmeck.org/mecklenburg/county/CountyManagersOffice/OMB/Budget/PriorBudgets/FY10Budget/Documents/FY2010BudgetBook-adopted.pdf)
Charlotte-Mecklenburg County FY 2009 Adopted Budget (http://charmeck.org/mecklenburg/county/CountyManagersOffice/OMB/Budget/PriorBudgets/FY09Budget/Documents/Final_FY_2009_Document_With_Tabs.pdf)
Charlotte Mecklenburg Library Annual Audit 2010-2011 (http://us.vocuspr.com/Newsroom/ViewAttachment.aspx?SiteName=cmlibrary&Entity=PRAsset&AttachmentType=F&EntityID=74901&AttachmentID=dec870f5-e53b-4bf0-b82a-3564f34993c3)
Charlotte Mecklenburg Library Annual Audit 2009-2010 (http://www.cmlibrary.org/about_us/Audit_2010.pdf)
Charlotte Mecklenburg Library Annual Audit 2008-2009 (http://www.plcmc.lib.nc.us/about_us/Audit_2009.pdf)
Charlotte Mecklenburg Library Annual Audit 2007-2008 (http://www.plcmc.lib.nc.us/about_us/Audit_2008.pdf)
Dallas City Adopted Budget FY 2012 http://dallascityhall.com/Budget/adopted_1112/Adopted%20FY12_BudgetBook.pdf)
Dallas City FY 2011-12 Adopted Budget Line Item Details, Central Library (http://www2.dallascityhall.com/FY1112AdoptedBudget/FormAPrintView.aspx?id=158) Dallas City FY 2011-12 Adopted Budget Line Item Details, Neighborhood Libraries (http://www2.dallascityhall.com/FY1112AdoptedBudget/FormAPrintView.aspx?id=159)
Dallas City Adopted Budget FY 2011 (http://dallascityhall.com/Budget/adopted1011/FY11_adoptedBudget.pdf)
Dallas City FY 2010-11 Adopted Budget Line Item Details, Central Library

A p p e n d i x D : B i b l i o g r a p h y | p. D-3
(http://www2.dallascityhall.com/FY1011AdoptedBudget/FormAPrintView.aspx?id=266) Dallas City FY 2010-11 Adopted Budget Line Item Details, Neighborhood Libraries (http://www2.dallascityhall.com/FY1011AdoptedBudget/FormAPrintView.aspx?id=267)
Dallas City Adopted Budget FY 2010 (http://dallascityhall.com/Budget/adopted0910/FY10_AdoptedBudget.pdf)
Dallas City FY 2009-10 Adopted Budget Line Item Details, Central Library (http://www2.dallascityhall.com/FY0910AdoptedBudget/FormAPrintView.aspx?id=433) Dallas City FY 2009-10 Adopted Budget Line Item Details, Neighborhood Libraries (http://www2.dallascityhall.com/FY0910AdoptedBudget/FormAPrintView.aspx?id=444) Dallas City FY 2009-10 Adopted Budget Line Item Details, Multicultural Services (http://www2.dallascityhall.com/FY0910AdoptedBudget/FormAPrintView.aspx?id=182)
Dallas City Adopted Budget FY 2009 (http://www.dallascityhall.com/Budget/adopted0809/FinancialSummaries.pdf)
Dallas City Adopted Budget FY 2008 (http://www.dallascityhall.com/Budget/adopted0708/0708_FinancialSummaries.pdf)
Dallas City FY 2008-09 Adopted Budget Line Item Details, Central Library (http://www2.dallascityhall.com/FY0809AdoptedBudget/FormAPrintView.aspx?id=597)
Dallas City FY 2008-09 Adopted Budget Line Item Details, Neighborhood Libraries (http://www2.dallascityhall.com/FY0809AdoptedBudget/FormAPrintView.aspx?id=395)
Dallas City FY 2008-09 Adopted Budget Line Item Details, Multicultural Services (http://www2.dallascityhall.com/FY0809AdoptedBudget/FormAPrintView.aspx?id=554)
Dallas City FY 2008 Adopted Budget, Culture, Arts, and Recreation (http://www.dallascityhall.com/Budget/adopted0708/0708_CultureArts.pdf)
Dallas City FY 2008 Adopted Budget, Education Enhancements (http://www.dallascityhall.com/Budget/adopted0708/0708_Education.pdf)
Durham County Adopted Budget FY 2012 (http://www.durhamcountync.gov/departments/bdmg/Budgets/FY11-12/Adopted/PDF/Full%20Document%20for%20Web.pdf)
Durham County Adopted Budget FY 2011 (http://www.co.durham.nc.us/departments/bdmg/Budgets/FY10-11/Adopted/index.html) Durham County Adopted Budget FY 2010 (http://www.co.durham.nc.us/departments/bdmg/Budgets/FY09-10/Adopted/index.html)
Durham County Adopted Budget FY 2009 (http://www.co.durham.nc.us/departments/bdmg/Budgets/FY08-09/Adopted/index.html)
Durham County Adopted Budget FY 2009 (http://www.co.durham.nc.us/departments/bdmg/_ARCHIVE/Budgets/FY07-08/Adopted/index.html)
A p p e n d i x D : B i b l i o g r a p h y | p. D-4
Forsyth County Adopted Annual Budget FY 2012(http://www.co.forsyth.nc.us/Budget/budget11_12.aspx) Forsyth County Adopted Annual Budget FY 2011(http://www.co.forsyth.nc.us/Budget/budget10_11.aspx) Forsyth County Adopted Annual Budget FY 2010 (http://www.co.forsyth.nc.us/Budget/budget09_10.aspx) Forsyth County Adopted Annual Budget FY 2009 (http://www.co.forsyth.nc.us/Budget/budget08_09.aspx)
Forsyth County Adopted Annual Budget FY 2008 (http://www.co.forsyth.nc.us/Budget/budget07_08.aspx)
Forsyth County Adopted Budget FY 2008 Culture and Recreation (http://www.co.forsyth.nc.us/Budget/budget0708/CultureRec08.pdf)
Forsyth County Fiscal Year 2008- 2009 Library Financial Summary (http://www.forsyth.cc/library/financial_statement.aspx)
Greensboro Adopted Budget FY 2012 (http://www.greensboro-nc.gov/modules/showdocument.aspx?documentid=10002)
Greensboro Adopted Budget FY 2011 (http://www.greensboro-nc.gov/modules/showdocument.aspx?documentid=1493)
Greensboro Adopted Annual Budget FY 2010 (http://www.greensboro-nc.gov/NR/rdonlyres/17687CDF-A5D2-44EA-9849-BA68DDE90D13/0/200910finaladoptedbudgetallsections.pdf) –inactive as of 3/12/12
Greensboro Adopted Annual Budget FY 2009 (http://www.greensboro-nc.gov/NR/rdonlyres/ABE176D3-EA08-4984-8BD6-BBF53EF35190/0/200809finaladoptedbudgetallsections.pdf) –inactive as of 3/12/12
Jacksonville Budget Comparisons spreadsheet from Barrett King, Deputy Director of the Jacksonville Public Library
Jacksonville 2012 Fiscal Year Annual Budget (http://www.coj.net/getattachment/Departments/Finance/Budget/Annual-Budgets/Adopted-Annual-Budget-FY-11---FY-12-with-page-numbers.pdf.aspx)
Jacksonville 2011 Fiscal Year Annual Budget (http://www.coj.net/departments/finance/docs/budget/fy11-department-budgets/fy11-budget-book-final.aspx)
Jacksonville 2010 Fiscal Year Adopted Budget (http://www.coj.net/departments/finance/docs/budget/budget-book-fy-09-10_optimized.aspx)
Jacksonville 2009 Fiscal Year Adopted Budget (http://www3.coj.net/Departments/Finance/Docs/Budget/budget120808a.aspx)
Jacksonville 2008 Fiscal Year Adopted Budget (http://www3.coj.net/Departments/Finance/Docs/Budget/2007-2008-annual-budget-121007.aspx)
Memphis 2012 Fiscal Year Adopted Budget, Summary, City-Wide Adopted Budget (http://www.cityofmemphis.org/pdf_forms/fy2012_adopted_op/MemphisOpbudget2012Adopted.pdf)
Memphis FY 2012 Adopted Operating Budget, General Fund Expenditures, Public Services & Neighborhoods (http://www.cityofmemphis.org/pdf_forms/fy2012_adopted_op/PUBLIC_SERVICES_NEIGHBORHOODS.pdf

A p p e n d i x D : B i b l i o g r a p h y | p. D-5
Memphis 2011 Fiscal Year Adopted Budget, Summary, City-Wide Adopted Budget (http://memphistn.gov/pdf_forms/FY2011_AD_OP/CityWide_AdoptedBudgetSummary.pdf)
Memphis FY 2011 Adopted Operating Budget, General Fund Expenditures, Public Services & Neighborhoods (http://www.memphistn.gov/pdf_forms/FY2011_AD_OP/PUBLIC_SERVICES_NEIGHBORHOODS.pdf)
Memphis 2010 Fiscal Year Adopted Operating Budget, Summary, City-Wide Adopted Budget (http://www.memphistn.gov/pdf_forms/FY2010_OpBudget/CityWide_TaxPolicy.pdf)
Memphis FY 2010 Adopted Operating Budget, General Fund Expenditures, Public Services & Neighborhoods (http://www.memphistn.gov/pdf_forms/FY2010_OpBudget/PUBLIC_SERVICES_NEIGHBORHOODS.pdf)
Memphis 2009 Fiscal Year Adopted Budget, General Fund Summary (http://www.memphistn.gov/pdf_forms/CIPAdoptedOpBudget/5-GeneralFundSummary.pdf)
Memphis Public Library 2009 Annual Report, Memphis Public Library & Information Center (http://www.memphislibrary.org/about/support/2009-annual-report.pdf)
Memphis 2008 Fiscal Year Adopted Budget, Summary (http://www.memphistn.gov/pdf_forms/FY2008AdoptedOpBudget/Summary.pdf)
Memphis Public Library 2008 Annual Report, Memphis Public Library & Information Center (http://www.memphislibrary.org/about/support/2008-Annual-Report.pdf)
Memphis FY 2008 Adopted Operating Budget, General Fund Expenditures, Public Services & Neighborhoods (http://www.memphistn.gov/pdf_forms/FY2011_AD_OP/PUBLIC_SERVICES_NEIGHBORHOODS.pdf)
Nashville-Davidson County Fiscal Year 2011-2012 Operating Budget (http://www.nashville.gov/citizens_budget/docs/budgetbook/fy2012/fy12_final_budget.pdf)
Nashville-Davidson County Fiscal Year 2010-2011 Operating Budget (http://www.nashville.gov/citizens_budget/docs/budgetbook/fy2011/fy11_final_budget.pdf)
Nashville-Davidson County Fiscal Year 2009-2010 Operating Budget (http://www.nashville.gov/citizens_budget/docs/budgetbook/fy2010/fy10_final_budget.pdf)
Nashville-Davidson County Fiscal Year 2008-2009 Operating Budget (http://www.nashville.gov/citizens_budget/docs/budgetbook/fy2009/fy09_final_budget.pdf)
Nashville-Davidson County Fiscal Year 2007-2008 Operating Budget (http://www.nashville.gov/citizens_budget/docs/budgetbook/fy2008/fy08_final_budget.pdf)
Orange County 2012 Fiscal Year Adopted Budget (1 of 2) (http://www.orangecountyfl.net/Portals/0/Resources/Internet/DEPARTMENTS/County_Admin/OMB/docs/FY%202012%20Adopted%20Budget%20Book%20Sect%201%20and%202.pdf)
Orange County 2012 Fiscal Year Adopted Budget (2 of 2) (http://www.orangecountyfl.net/Portals/0/Resources/Internet/DEPARTMENTS/County_Admin/OMB/docs/FY%202012%20Adopted%20Budget%20Book%20Sect%202%20to%2017.pdf)
Orange County Library 2012 Fiscal Year Library Operating Fund Budget (http://www.ocls.info/About/BOT/PDFs/FinancialInfo/BudgetsFinal/BudgetFY2012FinalToPost.pdf)
A p p e n d i x D : B i b l i o g r a p h y | p. D-6
Orange County 2011 Fiscal Year Adopted Budget, Budget in Brief (http://www.orangecountyfl.net/Portals/0/Resources/Internet/DEPARTMENTS/County_Admin/OMB/docs/Orange%20County%20FY%202011%20Budget%20Book%20Compressed.pdf)
Orange County Library 2011 Fiscal Year Library Operating Fund Budget (http://www.ocls.info/About/BOT/PDFs/FinancialInfo/BudgetsFinal/BudgetFY2011Final.pdf)
Orange County 2010 Fiscal Year Adopted Budget, Budget in Brief (http://www.orangecountyfl.net/Portals/0/Resources/Internet/DEPARTMENTS/County_Admin/OMB/docs/FY%202010%20Budget%20Book.pdf)
Orange County Library 2010 Fiscal Year Library Operating Fund Budget (http://www.ocls.info/About/BOT/PDFs/FinancialInfo/BudgetsFinal/BudgetFY2010Final.pdf)
Orange County 2009 Fiscal Year Adopted Budget, Budget in Brief (http://www.orangecountyfl.net/Portals/0/Resources/Internet/DEPARTMENTS/County_Admin/OMB/docs/2009%20Adopted%20Budget.pdf)
Orange County Library 2009 Fiscal Year Library Operating Fund Budget (http://www.ocls.info/About/BOT/PDFs/FinancialInfo/BudgetsFinal/BudgetFY2009Final.pdf)
Orange County 2008 Fiscal Year Adopted Budget, Budget in Brief (http://www.orangecountyfl.net/Portals/0/Resources/Internet/DEPARTMENTS/County_Admin/OMB/docs/2008%20Adopted%20Budget.pdf)
Orange County Library 2008 Fiscal Year Library Operating Fund Budget (http://www.ocls.info/About/BOT/PDFs/FinancialInfo/BudgetsFinal/BudgetFY2008Up2.pdf)
Tampa- Hillsborough County Adopted Biennial Budget for FY 2012 and FY 2013 (http://www.hillsboroughcounty.org/managementbudget/budgets/adopted/fy12/publications/adpfy12fy13budget.pdf)
Tampa- Hillsborough County Adopted Budget for FY 2011 (http://www.hillsboroughcounty.org/managementbudget/budgets/adopted/fy11/publications/adpfy11budget.pdf)
Tampa- Hillsborough County Adopted Biennial Budget for FY 2010 and FY 2011 (http://www.hillsboroughcounty.org/managementbudget/budgets/adopted/fy1011/publications/adoptedfy10fy11budget.pdf)
Tampa-Hillsborough County Public Library Operating Revenue Summary. Email communication with David Wullschleger, Operations Manager for Hillsborough County Library Services.
Tampa-Hillsborough County Library Fiscal Year Budgets for 2008-2011. Email communication with David Wullschleger, Operations Manager for Hillsborough County Library Services.
Tampa-Hillsborough County Adopted Biennial Budget for FY 2008 and FY 2009 (http://www.hillsboroughcounty.org/managementbudget/budgets/adopted/fy0809/publications/adopted0809budget.pdf)
Wake County 2012 Fiscal Year Adopted Budget (http://www.wakegov.com/NR/rdonlyres/069BAC30-23C4-49BF-A9F3-796EA651861B/0/FY2012AdoptedBudget.pdf)

A p p e n d i x D : B i b l i o g r a p h y | p. D-7
Wake County 2011 Fiscal Year Adopted Budget (http://www.wakegov.com/NR/rdonlyres/F8746C7A-AE8D-4FBC-977C-71C32E3A4A31/0/wake_fy2011_adopted_budget.pdf)
Wake County 2010 Fiscal Year Adopted Budget (http://www.wakegov.com/NR/rdonlyres/C2F6D61A-B4E9-4816-9E97-14199D3DBDDC/0/fy2010.pdf)
Wake County 2009 Fiscal Year Adopted Budget (http://www.wakegov.com/NR/rdonlyres/1022A405-FDE4-4603-B32B-64A8D5C405BC/0/fy2009.pdf)
Wake County 2008 Fiscal Year Adopted Budget (http://www.wakegov.com/budget/pastbudgets/fy08/fy2008budgetdocument.htm)

A p p e n d i x E : L i s t o f S o u r c e D a t a T a b l e s | p. E-1
APPENDIX E: List of Source Data Tables
The complete dataset compiled for this study is available electronically, and includes these tables:
1) Mecklenburg County Government Total Revenues by Source, FY 2008 Adopted Budget
2) Mecklenburg County Government Total Expenditures by Use, FY 2008 Adopted Budget
3) Mecklenburg County Government General Fund Revenue by Source, FY 2008 Adopted Budget
4) Mecklenburg County Government General Fund Expenditures by Use, FY 2008 Adopted Budget
5) Charlotte Mecklenburg Library Total Revenues by Source, FY 2008 Annual Audit
6) Charlotte Mecklenburg Library Total Revenue Expenditures, FY 2008 Annual Audit
7) Charlotte Mecklenburg Library General Fund Revenues, FY 2008 Annual Audit
8) Charlotte Mecklenburg Library Expenditures using General Fund, FY 2008 Annual Audit
9) Mecklenburg County Government Total Revenues by Source, FY 2009 Adopted Budget
10) Mecklenburg County Government Total Expenditures by Use, FY 2009 Adopted Budget
11) Mecklenburg County Government General Fund Revenue by Source, FY 2009 Adopted Budget
12) Mecklenburg County Government General Fund Expenditures by Use, FY 2009 Adopted Budget
13) Charlotte Mecklenburg Library Total Revenues by Source, FY 2009 Annual Audit
14) Charlotte Mecklenburg Library Total Revenue Expenditures, FY 2009 Annual Audit
15) Charlotte Mecklenburg Library General Fund Revenues, FY 2009 Annual Audit
16) Charlotte Mecklenburg Library General Fund Expenditures, FY 2009 Annual Audit
17) Mecklenburg County Government Total Revenues by Source, FY 2010 Adopted Budget
18) Mecklenburg County Government Total Expenditures by Use, FY 2010 Adopted Budget
19) Mecklenburg County Government General Fund Revenue by Source, FY 2010 Adopted Budget
20) Mecklenburg County Government General Fund Expenditures by Use, FY 2010 Adopted Budget
21) Charlotte Mecklenburg Library Total Revenues by Source, FY 2010 Annual Audit
22) Charlotte Mecklenburg Library Total Revenue Expenditures, FY 2010 Annual Audit
23) Charlotte Mecklenburg Library General Fund Revenues, FY 2010 Annual Audit
24) Charlotte Mecklenburg Library General Fund Expenditures, FY 2010 Annual Audit
25) Mecklenburg County Government Total Revenues by Source, FY 2011 Adopted Budget
26) Mecklenburg County Government Total Expenditures by Use, FY 2011 Adopted Budget
27) Mecklenburg County Government General Fund Revenue by Source, FY 2011 Adopted Budget
28) Mecklenburg County Government General Fund Expenditures by Use, FY 2011 Adopted Budget
29) Charlotte Mecklenburg Library Total Revenues by Source, FY 2011 Revised Budget
30) Charlotte Mecklenburg Library Total Expenditures, FY 2011 Revised Budget
31) Mecklenburg County Government Total Revenues by Source, FY 2012 Adopted Budget
32) Mecklenburg County Government Total Expenditures by Use, FY 2012 Adopted Budget
33) Mecklenburg County Government General Fund Revenue by Source, FY 2012 Adopted Budget
34) Mecklenburg County Government General Fund Expenditures by Use, FY 2012 Adopted Budget
35) Charlotte Mecklenburg Library Total Revenues by Source, FY 2012 Approved Budget
36) Charlotte Mecklenburg Library Total Expenditures, FY 2012 Approved Budget
37) Atlanta-Fulton County Government Total Revenues by Source, FY 2008 Final Budget
38) Atlanta-Fulton County Government Expenditures by Use, FY 2008 Final Budget
39) Atlanta-Fulton County Government General Fund Revenues by Source, FY 2008 Final Budget
40) Atlanta-Fulton County Government General Fund Expenditures, FY 2008 Final Budget
41) Atlanta-Fulton County Public Libraries Revenues by Source, FY 2008 Final Budget
42) Atlanta-Fulton County Public Libraries Expenditures, FY 2008 Final Budget
43) Atlanta-Fulton County Government Total Revenues by Source, FY 2009 Final Budget
44) Atlanta-Fulton County Government Expenditures by Use, FY 2009 Final Budget
A p p e n d i x E : L i s t o f S o u r c e D a t a T a b l e s | p. E-2
45) Atlanta-Fulton County Government General Fund Revenues by Source, FY 2009 Final Budget
46) Atlanta-Fulton County Government General Fund Expenditures, FY 2009 Final Budget
47) Atlanta-Fulton County Public Libraries Revenue by Source, FY 2009 Revenues
48) Atlanta-Fulton County Public Libraries Expenditures, FY 2009 Actual Budget
49) Atlanta-Fulton County Government Total Revenues by Source, FY 2010 Final Adopted Budget
50) Atlanta-Fulton County Government Expenditures by Use, FY 2010 Final Adopted Budget
51) Atlanta-Fulton County Government General Fund Revenues by Source, FY 2010 Final Adopted Budget
52) Atlanta-Fulton County Government General Fund Expenditures, FY 2010 Final Adopted Budget
53) Atlanta-Fulton County Public Libraries Revenues by Source, FY 2010 Adopted Budget
54) Atlanta-Fulton County Public Libraries Expenditures, FY 2010 Adopted Budget
55) Atlanta-Fulton County Government Total Revenues by Source, FY 2011 Final Adopted Budget
56) Atlanta-Fulton County Government Expenditures by Use, FY 2011 Final Adopted Budget
57) Atlanta-Fulton County Government General Fund Revenue by Source, FY 2011 Final Adopted Budget
58) Atlanta-Fulton County Government General Fund Expenditures, FY 2011 Final Adopted Budget
59) Atlanta-Fulton County Public Libraries Revenue by Source, FY 2011 Proposed Budget
60) Atlanta-Fulton County Public Libraries Expenditures, FY 2011 Proposed Budget
61) Atlanta-Fulton County Government Total Revenues by Source, FY 2012 Tentative Budget
62) Atlanta-Fulton County Government Expenditures by Use, FY 2012 Tentative Budget
63) Atlanta-Fulton County Government General Fund Revenue by Source, FY 2012 Tentative Budget
64) Atlanta-Fulton County Government General Fund Expenditures, FY 2012 Tentative Budget
65) Atlanta-Fulton County Public Libraries Revenue by Source, FY 2012 Tentative Budget
66) Atlanta-Fulton County Public Libraries Expenditures, FY 2012 Proposed Budget
67) Austin City Government Total Revenues by Source, FY 2008 Approved Budget
68) Austin City Government Expenditures by Use, FY 2008 Approved Budget
69) Austin City Government General Fund Revenues by Source, FY 2008 Approved Budget
70) Austin City Government General Fund Expenditures, FY 2008 Approved Budget
71) Austin City Public Libraries Revenues by Source, FY 2008 Approved Budget
72) Austin City Public Libraries Expenditures, FY 2008 Approved Budget
73) Austin City Government Total Revenues by Source, FY 2009 Approved Budget
74) Austin City Government Expenditures by Use, FY 2009 Approved Budget
75) Austin City Government General Fund Revenues by Source, FY 2009 Approved Budget
76) Austin City Government General Fund Expenditures, FY 2009 Approved Budget
77) Austin City Public Libraries Revenues by Source, FY 2009 Approved Budget
78) Austin City Public Libraries Expenditures, FY 2009 Approved Budget
79) Austin City Government Total Revenues by Source, FY 2010 Approved Budget
80) Austin City Government Expenditures by Use, FY 2010 Approved Budget
81) Austin City Government General Fund Revenues by Source, FY 2010 Approved Budget
82) Austin City Government General Fund Expenditures, FY 2010 Approved Budget
83) Austin City Public Libraries Revenues by Source, FY 2010 Approved Budget
84) Austin City Public Libraries Expenditures, FY 2010 Approved Budget
85) Austin City Government Total Revenues by Source, FY 2011 Approved Budget
86) Austin City Government Expenditures by Use, FY 2011 Approved Budget
87) Austin City Government General Fund Revenues by Source, FY 2011 Approved Budget
88) Austin City Government General Fund Expenditures, FY 2011 Approved Budget
89) Austin City Public Libraries Revenues by Source, FY 2011 Approved Budget
90) Austin City Public Libraries Expenditures, FY 2011 Approved Budget
91) Austin City Government Total Revenues by Source, FY 2012 Approved Budget
A p p e n d i x E : L i s t o f S o u r c e D a t a T a b l e s | p. E-3
92) Austin City Government Expenditures by Use, FY 2012 Approved Budget
93) Austin City Government General Fund Revenues by Source, FY 2012 Approved Budget
94) Austin City Government General Fund Expenditures, FY 2012 Approved Budget
95) Austin City Public Libraries Revenues by Source, FY 2012 Approved Budget
96) Austin City Public Libraries Expenditures, FY 2012 Approved Budget
97) Baltimore County Government Total Revenues by Source, FY 2008 Actual Budget
98) Baltimore County Government Expenditures by Use, FY 2008 Actual Budget
99) Baltimore County Government General Fund Revenue by Source, FY 2008 Estimated Budget
100) Baltimore County Government General Fund Expenditures, FY 2008 Estimated Budget
101) Baltimore County Public Libraries Revenue by Source, FY 2008 Actual Budget
102) Baltimore County Public Libraries Expenditures, FY 2008 Actual Budget
103) Baltimore County Government Total Revenues by Source, FY 2009 Adopted Budget
104) Baltimore County Government Expenditures by Use, FY 2009 Adopted Budget
105) Baltimore County Government General Fund Revenue by Source, FY 2009 Adopted Budget
106) Baltimore County Government General Fund Expenditures, FY 2009 Adopted Budget
107) Baltimore County Public Libraries Revenue by Source, FY 2009 Actual Budget
108) Baltimore County Public Libraries Expenditures, FY 2009 Actual Budget
109) Baltimore County Government Total Revenues by Source, FY 2010 Adopted Budget
110) Baltimore County Government Expenditures by Use, FY 2010 Adopted Budget
111) Baltimore County Government General Fund Revenue by Source, FY 2010 Adopted Budget
112) Baltimore County Government General Fund Expenditures, FY 2010 Adopted Budget
113) Baltimore County Public Libraries Revenue by Source, FY 2010 Adopted Budget
114) Baltimore County Public Libraries Expenditures, FY 2010 Adopted Budget
115) Baltimore County Government Total Revenues by Source, FY 2011 Adopted Budget
116) Baltimore County Government Expenditures by Use, FY 2011 Adopted Budget
117) Baltimore County Government General Fund Revenue by Source, FY 2011 Adopted Budget
118) Baltimore County Government General Fund Expenditures, FY 2011 Adopted Budget
119) Baltimore County Public Libraries Revenue by Source, FY 2011 Adopted Budget
120) Baltimore County Public Libraries Expenditures, FY 2011 Adopted Budget
121) Baltimore County Government Total Revenues by Source, FY 2012 Adopted Budget
122) Baltimore County Government Expenditures by Use, FY 2012 Adopted Budget
123) Baltimore County Government General Fund Revenue by Source, FY 2012 Adopted Budget
124) Baltimore County Government General Fund Expenditures, FY 2012 Adopted Budget
125) Baltimore County Public Libraries Revenue by Source, FY 2012 Adopted Budget
126) Baltimore County Public Libraries Expenditures, FY 2012 Adopted Budget
127) Dallas City Government Total Revenues by Fund Type, FY 2008 Adopted Budget
128) Dallas City Government Expenditures by Fund Type, FY 2008 Adopted Budget
129) Dallas City Government General Fund Revenue by Source, FY 2008 Adopted Budget
130) Dallas City Government General Fund Expenditures, FY 2008 Adopted Budget
131) Dallas City Library Revenue by Source, FY 2008 Adopted Budget
132) Dallas City Library Expenditures FY 2008 Estimated Budget
133) Dallas City Government Total Revenues by Fund Type, FY 2009 Adopted Budget
134) Dallas City Government Expenditures by Fund Type, FY 2009 Adopted Budget
135) Dallas City Government General Fund Revenue by Source, FY 2009 Adopted Budget
136) Dallas City Government General Fund Expenditures, FY 2009 Adopted Budget
137) Dallas City Library Revenue by Source, FY 2009 Adopted Budget
138) Dallas City Library Expenditures FY 2009 Adopted Budget

A p p e n d i x E : L i s t o f S o u r c e D a t a T a b l e s | p. E-4
139) Dallas City Government Total Revenues by Fund Type, FY 2010 Adopted Budget
140) Dallas City Government Expenditures by Fund Type, FY 2010 Adopted Budget
141) Dallas City Government General Fund Revenue by Source, FY 2010 Adopted Budget
142) Dallas City Government General Fund Expenditures, FY 2010 Adopted Budget
143) Dallas City Library Revenue by Source, FY 2010 Adopted Budget
144) Dallas City Library Expenditures FY 2010 Adopted Budget
145) Dallas City Government Total Revenues by Fund Type, FY 2011 Adopted Budget
146) Dallas City Government Expenditures by Fund Type, FY 2011 Adopted Budget
147) Dallas City Government General Fund Revenue by Source, FY 2011 Adopted Budget
148) Dallas City Government General Fund Expenditures, FY 2011 Adopted Budget
149) Dallas City Library Revenue by Source, FY 2011 Adopted Budget
150) Dallas City Library Expenditures FY 2011 Adopted Budget
151) Dallas City Government Total Revenues by Fund Type, FY 2012 Adopted Budget
152) Dallas City Government Expenditures by Fund Type, FY 2012 Adopted Budget
153) Dallas City Government General Fund Revenue by Source, FY 2012 Adopted Budget
154) Dallas City Government General Fund Expenditures, FY 2012 Adopted Budget
155) Dallas City Library Revenue by Source, FY 2012 Adopted Budget
156) Dallas City Library Expenditures FY 2012 Adopted Budget
157) Durham County Total Revenues by Fund Group FY 2008 Adopted Budget
158) Durham County Total Expenditures by Fund Group FY 2008 Adopted Budget
159) Durham County General Funds Revenue by Source FY 2008 Adopted Budget
160) Durham County General Funds Expenditures FY 2008 Adopted Budget
161) Durham County Public Libraries Revenue by Source FY 2008 Adopted Budget
162) Durham County Public Libraries Expenditures FY 2008 Adopted Budget
163) Durham County Total Revenues by Fund Group FY 2009 Adopted Budget
164) Durham County Total Expenditures by Fund Group FY 2009 Adopted Budget
165) Durham County General Funds Revenue by Source FY 2009 Adopted Budget
166) Durham County General Funds Expenditures FY 2009 Adopted Budget
167) Durham County Public Libraries Revenue by Source FY 2009 Adopted Budget
168) Durham County Public Libraries Expenditures FY 2009 Adopted Budget
169) Durham County Total Revenues by Fund Group FY 2010 Adopted Budget
170) Durham County Total Expenditures by Fund Group FY 2010 Adopted Budget
171) Durham County General Funds Revenue by Source FY 2010 Adopted Budget
172) Durham County General Funds Expenditures FY 2010 Adopted Budget
173) Durham County Public Libraries Revenue by Source FY 2010 Adopted Budget
174) Durham County Public Libraries Expenditures FY 2010 Adopted Budget
175) Durham County Total Revenues by Fund Group FY 2011 Adopted Budget
176) Durham County Total Expenditures by Fund Group FY 2011 Adopted Budget
177) Durham County General Funds Revenue by Source FY 2011 Adopted Budget
178) Durham County General Funds Expenditures FY 2011 Adopted Budget
179) Durham County Public Libraries Revenue by Source FY 2011 Adopted Budget
180) Durham County Public Libraries Expenditures FY 2011 Adopted Budget
181) Durham County Total Revenues by Fund Group FY 2012 Adopted Budget
182) Durham County Total Expenditures by Fund Group FY 2012 Adopted Budget
183) Durham County General Funds Revenue by Source FY 2012 Adopted Budget
184) Durham County General Funds Expenditures FY 2012 Adopted Budget
185) Durham County Public Libraries Revenue by Source FY 2012 Adopted Budget
A p p e n d i x E : L i s t o f S o u r c e D a t a T a b l e s | p. E-5
186) Durham County Public Libraries Expenditures FY 2012 Adopted Budget
187) Forsyth County Government Total Revenues by Source, FY 2008 Adopted Budget
188) Forsyth County Government Total Revenues by Source, FY 2008 Adopted Budget
189) Forsyth County Government General Fund Revenue by Source, FY 2008 Adopted Budget
190) Forsyth County Government General Fund Expenditures, FY 2008 Adopted Budget
191) Forsyth County Public Libraries Revenue by Source, FY 2008 Adopted Budget
192) Forsyth County Public Libraries General Fund Expenditures, FY 2008 Adopted Budget
193) Forsyth County Government Total Revenues by Source, FY 2009 Adopted Budget
194) Forsyth County Government Total Revenues by Source, FY 2009 Adopted Budget
195) Forsyth County Government General Fund Revenue by Source, FY 2009 Adopted Budget
196) Forsyth County Government General Fund Expenditures, FY 2009 Adopted Budget
197) Forsyth County Public Libraries Revenue by Source, FY 2009 Adopted Budget
198) Forsyth County Public Libraries General Fund Expenditures, FY 2009 Adopted Budget
199) Forsyth County Government Total Revenues by Source, FY 2010 Adopted Budget
200) Forsyth County Government Total Revenues by Source, FY 2010 Adopted Budget
201) Forsyth County Government General Fund Revenue by Source, FY 2010 Adopted Budget
202) Forsyth County Government General Fund Expenditures, FY 2010 Adopted Budget
203) Forsyth County Public Libraries Revenue by Source, FY 2010 Adopted Budget
204) Forsyth County Public Libraries General Fund Expenditures, FY 2010 Adopted Budget
205) Forsyth County Government Total Revenues by Source, FY 2011 Adopted Budget
206) Forsyth County Government Total Revenues by Source, FY 2011 Adopted Budget
207) Forsyth County Government General Fund Revenue by Source, FY 2011 Adopted Budget
208) Forsyth County Government General Fund Expenditures, FY 2011 Adopted Budget
209) Forsyth County Public Libraries Revenue by Source, FY 2011 Adopted Budget
210) Forsyth County Public Libraries General Fund Expenditures, FY 2011 Adopted Budget
211) Forsyth County Government Total Revenues by Source, FY 2012 Adopted Budget
212) Forsyth County Government Total Revenues by Source, FY 2012 Adopted Budget
213) Forsyth County Government General Fund Revenue by Source, FY 2012 Adopted Budget
214) Forsyth County Government General Fund Expenditures, FY 2012 Adopted Budget
215) Forsyth County Public Libraries Revenue by Source, FY 2012 Adopted Budget
216) Forsyth County Public Libraries General Fund Expenditures, FY 2012 Adopted Budget
217) Greensboro Total Revenues by Source, FY 2008 Budget
218) Greensboro Expenditures by Use, FY 2008 Budget
219) Greensboro General Fund Revenue by Source, FY 2008 Budget
220) Greensboro General Fund Expenditures, FY 2008 Budget
221) Greensboro Public Libraries Revenue by Source, FY 2008 Budget
222) Greensboro Public Libraries Expenditures, FY 2008 Budget
223) Greensboro Total Revenues by Source, FY 2009 Adopted Budget
224) Greensboro Expenditures by Use, FY 2009 Adopted Budget
225) Greensboro General Fund Revenue by Source, FY 2009 Adopted Budget
226) Greensboro General Fund Expenditures, FY 2009 Adopted Budget
227) Greensboro Public Libraries Revenue by Source, FY 2009 Adopted Budget
228) Greensboro Public Libraries Expenditures, FY 2009 Adopted Budget
229) Greensboro Total Revenues by Source, FY 2010 Adopted Budget
230) Greensboro Expenditures by Use, FY 2010 Adopted Budget
231) Greensboro General Fund Revenue by Source, FY 2010 Adopted Budget
232) Greensboro General Fund Expenditures, FY 2010 Adopted Budget

A p p e n d i x E : L i s t o f S o u r c e D a t a T a b l e s | p. E-6
233) Greensboro Public Libraries Revenue by Source, FY 2010 Adopted Budget
234) Greensboro Public Libraries Expenditures, FY 2010 Adopted Budget
235) Greensboro Total Revenues by Source, FY 2011 Adopted Budget
236) Greensboro Expenditures by Use, FY 2011 Adopted Budget
237) Greensboro General Fund Revenue by Source, FY 2011 Adopted Budget
238) Greensboro General Fund Expenditures, FY 2011 Adopted Budget
239) Greensboro Public Libraries Revenue by Source, FY 2011 Adopted Budget
240) Greensboro Public Libraries Expenditures, FY 2011 Adopted Budget
241) Greensboro Total Revenues by Source, FY 2012 Adopted Budget
242) Greensboro Expenditures by Use, FY 2012 Adopted Budget
243) Greensboro General Fund Revenue by Source, FY 2012 Adopted Budget
244) Greensboro General Fund Expenditures, FY 2012 Adopted Budget
245) Greensboro Public Libraries Revenue by Source, FY 2012 Adopted Budget
246) Greensboro Public Libraries Expenditures, FY 2012 Adopted Budget
247) City of Jacksonville Total Revenues by Source, FY 2008 Adopted Budget
248) City of Jacksonville Total Expenditures by Use, FY 2008 Adopted Budget
249) City of Jacksonville General Fund Revenues by Source, FY 2008 Adopted Budget
250) City of Jacksonville General Fund Expenditures by Use, FY 2008 Adopted Budget
251) City of Jacksonville Public Libraries Revenues by Source, FY 2008 Adopted Budget
252) City of Jacksonville Public Libraries Expenditures by Use, FY 2008 Adopted Budget
253) City of Jacksonville Total Revenues by Source, FY 2009 Adopted Budget
254) City of Jacksonville Total Expenditures by Use, FY 2009 Adopted Budget
255) City of Jacksonville General Fund Revenues by Source, FY 2009 Adopted Budget
256) City of Jacksonville General Fund Expenditures by Use, FY 2009 Adopted Budget
257) City of Jacksonville Public Libraries Revenues by Source, FY 2009 Adopted Budget
258) City of Jacksonville Public Libraries Expenditures by Use, FY 2009 Adopted Budget
259) City of Jacksonville Total Revenues by Source, FY 2010 Adopted Budget
260) City of Jacksonville Total Expenditures by Use, FY 2010 Adopted Budget
261) City of Jacksonville General Fund Revenues by Source, FY 2010 Adopted Budget
262) City of Jacksonville General Fund Expenditures by Use, FY 2010 Adopted Budget
263) City of Jacksonville Public Libraries Revenues by Source, FY 2010 Adopted Budget
264) City of Jacksonville Public Libraries Expenditures by Use, FY 2010 Adopted Budget
265) City of Jacksonville Total Revenues by Source, FY 2011 Adopted Budget
266) City of Jacksonville Total Expenditures by Use, FY 2011 Adopted Budget
267) City of Jacksonville General Fund Revenues by Source, FY 2011 Adopted Budget
268) City of Jacksonville General Fund Expenditures by Use, FY 2011 Adopted Budget
269) City of Jacksonville Public Libraries Revenues by Source, FY 2011 Adopted Budget
270) City of Jacksonville Public Libraries Expenditures by Use, FY 2011 Adopted Budget
271) City of Jacksonville Total Revenues by Source, FY 2012 Adopted Budget
272) City of Jacksonville Total Expenditures by Use, FY 2012 Adopted Budget
273) City of Jacksonville General Fund Revenues by Source, FY 2012 Adopted Budget
274) City of Jacksonville General Fund Expenditures by Use, FY 2012 Adopted Budget
275) City of Jacksonville Public Libraries Revenues by Source, FY 2012 Adopted Budget
276) City of Jacksonville Public Libraries Expenditures by Use, FY 2012 Adopted Budget
277) City of Memphis Total Revenues by Source, FY 2008 Actual Budget
278) City of Memphis Total Expenditures by Use, FY 2008 Actual Budget
279) City of Memphis General Fund Revenues by Source, FY 2008 Adopted Budget

A p p e n d i x E : L i s t o f S o u r c e D a t a T a b l e s | p. E-7
280) City of Memphis General Fund Expenditures by Use, FY 2008 Adopted Budget
281) Memphis Public Library Revenues by Source, Library Year 2008
282) Memphis Public Library Expenses by Use, Library Year 2008
283) City of Memphis Total Revenues by Source, FY 2009 Operating Budget
284) City of Memphis Total Expenditures by Use, FY 2009 Operating Budget
285) City of Memphis General Fund Revenues by Source, FY 2009 Adopted Budget
286) City of Memphis General Fund Expenditures by Use, FY 2009 Adopted Budget
287) Memphis Public Library Revenues by Source, Library Year 2009
288) Memphis Public Library Expenses by Use, Library Year 2009
289) City of Memphis Total Revenues by Source, FY 2010 Adopted Operating Budget
290) City of Memphis Total Expenditures by Use, FY 2010 Adopted Operating Budget
291) City of Memphis General Fund Revenues by Source, FY 2010 Adopted Operating Budget
292) City of Memphis General Fund Expenditures by Use, FY 2010 Adopted Operating Budget
293) Memphis Public Library Services Revenues by Source, FY 2010 Adopted Operating Budget
294) Memphis Public Library Expenditures by Use, FY 2010 Adopted Operating Budget
295) City of Memphis Total Revenues by Source, FY 2011 Adopted Operating Budget
296) City of Memphis Total Expenditures by Use, FY 2011 Adopted Operating Budget
297) City of Memphis General Fund Revenues by Source, FY 2011 Adopted Operating Budget
298) City of Memphis General Fund Expenditures by Use, FY 2011 Adopted Operating Budget
299) Memphis Public Library Services Revenues by Source, FY 2011 Adopted Operating Budget
300) Memphis Public Library Expenditures by Use, FY 2011 Adopted Operating Budget
301) City of Memphis Total Revenues by Source, FY 2012 Adopted Operating Budget
302) City of Memphis Total Expenditures by Use, FY 2012 Adopted Operating Budget
303) City of Memphis General Fund Revenues by Source, FY 2012 Adopted Operating Budget
304) City of Memphis General Fund Expenditures by Use, FY 2012 Adopted Operating Budget
305) Memphis Public Library Services Revenues by Source, FY 2012 Adopted Operating Budget
306) Memphis Public Library Expenditures by Use, FY 2012 Adopted Operating Budget
307) Metropolitan Nashville, Davidson County Total Revenues by Source, FY 2008 Operating Budget
308) Metropolitan Nashville, Davidson County Total Expenditures by Use, FY 2008 Operating Budget
309) Metropolitan Nashville, Davidson County General Fund Revenues by Source, FY 2008 Operating
Budget
310) Metropolitan Nashville, Davidson County General Fund Expenditures by Use, FY 2008 Operating
Budget
311) Metropolitan Nashville, Davidson County Public Libraries Revenues by Source, FY 2008 Operating
Budget
312) Metropolitan Nashville, Davidson County Public Libraries Expenditures, FY 2008 Operating Budget
313) Metropolitan Nashville, Davidson County Total Revenues by Source, FY 2009 Operating Budget
314) Metropolitan Nashville, Davidson County Total Expenditures by Use, FY 2009 Operating Budget
315) Metropolitan Nashville, Davidson County General Fund Revenues by Source, FY 2009 Operating
Budget
316) Metropolitan Nashville, Davidson County General Fund Expenditures by Use, FY 2009 Operating
Budget
317) Metropolitan Nashville, Davidson County Public Libraries Revenues by Source, FY 2009 Operating
Budget
318) Metropolitan Nashville, Davidson County Public Libraries Expenditures, FY 2009 Operating Budget
319) Metropolitan Nashville, Davidson County Total Revenues by Source, FY 2010 Operating Budget
320) Metropolitan Nashville, Davidson County Total Expenditures by Use, FY 2010 Operating Budget

A p p e n d i x E : L i s t o f S o u r c e D a t a T a b l e s | p. E-8
321) Metropolitan Nashville, Davidson County General Fund Revenues by Source, FY 2010 Operating
Budget
322) Metropolitan Nashville, Davidson County General Fund Expenditures by Use, FY 2010 Operating
Budget
323) Metropolitan Nashville, Davidson County Public Libraries Revenues by Source, FY 2010 Operating
Budget
324) Metropolitan Nashville, Davidson County Public Libraries Expenditures, FY 2010 Operating Budget
325) Metropolitan Nashville, Davidson County Total Revenues by Source, FY 2011 Operating Budget
326) Metropolitan Nashville, Davidson County Total Expenditures by Use, FY 2011 Operating Budget
327) Metropolitan Nashville, Davidson County General Fund Revenues by Source, FY 2011 Operating
Budget
328) Metropolitan Nashville, Davidson County General Fund Expenditures by Use, FY 2011 Budgeted
329) Metropolitan Nashville, Davidson County Public Libraries Revenues by Source, FY 2011 Operating
Budget
330) Metropolitan Nashville, Davidson County Public Libraries Expenditures, FY 2011 Operating Budget
331) Metropolitan Nashville, Davidson County Total Revenues by Source, FY 2012 Operating Budget
332) Metropolitan Nashville, Davidson County Total Expenditures by Use, FY 2012 Operating Budget
333) Metropolitan Nashville, Davidson County General Fund Revenues by Source, FY 2012 Operating
Budget
334) Metropolitan Nashville, Davidson County General Fund Expenditures by Use, FY 2012 Budgeted
335) Metropolitan Nashville, Davidson County Public Libraries Revenues by Source, FY 2012 Operating
Budget
336) Metropolitan Nashville, Davidson County Public Libraries Expenditures, FY 2012 Operating Budget
337) Orange County (Orlando, FL) Total Revenues by Source, FY 2008 Adopted Budget
338) Orange County (Orlando, FL) Total Expenditures by Use, FY 2008 Adopted Budget
339) Orange County (Orlando, FL) General Fund Revenues by Source, FY 2008 Adopted Budget
340) Orange County (Orlando, FL) General Fund Expenditures by Use, FY 2008 Adopted Budget
341) Orange County (Orlando, FL) Library Revenues by Source, FY 2008 Adopted Budget
342) Orange County (Orlando, FL) Library Expenditures by Use, FY 2008 Adopted Budget
343) Orange County (Orlando, FL) Total Revenues by Source, FY 2009 Adopted Budget
344) Orange County (Orlando, FL) Total Expenditures by Use, FY 2009 Adopted Budget
345) Orange County (Orlando, FL) General Fund Revenues by Source, FY 2009 Adopted Budget
346) Orange County (Orlando, FL) General Fund Expenditures by Use, FY 2009 Adopted Budget
347) Orange County (Orlando, FL) Library Revenues by Source, FY 2009 Adopted Budget
348) Orange County (Orlando, FL) Library Expenditures by Use, FY 2009 Adopted Budget
349) Orange County (Orlando, FL) Total Revenues by Source, FY 2010 Adopted Budget
350) Orange County (Orlando, FL) Total Expenditures by Use, FY 2010 Adopted Budget
351) Orange County (Orlando, FL) General Fund Revenues by Source, FY 2010 Adopted Budget
352) Orange County (Orlando, FL) General Fund Expenditures by Use, FY 2010 Adopted Budget
353) Orange County (Orlando, FL) Library Revenues by Source, FY 2010 Adopted Budget
354) Orange County (Orlando, FL) Library Expenditures by Use, FY 2010 Adopted Budget
355) Orange County (Orlando, FL) Total Revenues by Source, FY 2011 Adopted Budget
356) Orange County (Orlando, FL) Total Expenditures by Use, FY 2011 Adopted Budget
357) Orange County (Orlando, FL) General Fund Revenues by Source, FY 2011 Adopted Budget
358) Orange County (Orlando, FL) General Fund Expenditures by Use, FY 2011 Adopted Budget
359) Orange County (Orlando, FL) Library Revenues by Source, FY 2011 Adopted Budget
360) Orange County (Orlando, FL) Library Expenditures by Use, FY 2011 Adopted Budget

A p p e n d i x E : L i s t o f S o u r c e D a t a T a b l e s | p. E-9
361) Orange County (Orlando, FL) Total Revenues by Source, FY 2012 Adopted Budget
362) Orange County (Orlando, FL) Total Expenditures by Use, FY 2012 Adopted Budget
363) Orange County (Orlando, FL) General Fund Revenues by Source, FY 2012 Adopted Budget
364) Orange County (Orlando, FL) General Fund Expenditures by Use, FY 2012 Adopted Budget
365) Orange County (Orlando, FL) Library Revenues by Source, FY 2012 Adopted Budget
366) Orange County (Orlando, FL) Library Expenditures by Use, FY 2012 Adopted Budget
367) Tampa-Hillsborough County Total Revenues by Source, FY 2008 Adopted Budget
368) Tampa-Hillsborough County Total Expenditures by Use, FY 2008 Adopted Budget
369) Tampa-Hillsborough County General Fund Revenues by Source, FY 2008 Adopted Budget
370) Tampa-Hillsborough County General Fund Expenditures by Use, FY 2008 Adopted Budget
371) Tampa-Hillsborough County Library Revenues by Source, FY 2008 Adopted Budget
372) Tampa-Hillsborough County Library Expenditures by Use, FY 2008 Adopted Budget
373) Tampa-Hillsborough County Total Revenues by Source, FY 2009 Adopted Budget
374) Tampa-Hillsborough County Total Expenditures by Use, FY 2009 Adopted Budget
375) Tampa-Hillsborough County General Fund Revenues by Source, FY 2009 Adopted Budget
376) Tampa-Hillsborough County General Fund Expenditures by Use, FY 2009 Adopted Budget
377) Tampa-Hillsborough County Library Revenues by Source, FY 2009 Adopted Budget
378) Tampa-Hillsborough County Library Expenditures by Use, FY 2009 Adopted Budget
379) Tampa-Hillsborough County Total Revenues by Source, FY 2010 Adopted Budget
380) Tampa-Hillsborough County Total Expenditures by Use, FY 2010 Adopted Budget
381) Tampa-Hillsborough County General Fund Revenues by Source, FY 2010 Adopted Budget
382) Tampa-Hillsborough County General Fund Expenditures by Use, FY 2010 Adopted Budget
383) Tampa-Hillsborough County Library Revenues by Source, FY 2010 Adopted Budget
384) Tampa-Hillsborough County Library Expenditures by Use, FY 2010 Adopted Budget
385) Tampa-Hillsborough County Total Revenues by Source, FY 2011 Adopted Budget
386) Tampa-Hillsborough County Total Expenditures by Use, FY 2011 Adopted Budget
387) Tampa-Hillsborough County General Fund Revenues by Source, FY 2011 Adopted Budget
388) Tampa - Hillsborough County General Fund Expenditures by Use, FY 2011 Adopted Budget
389) Tampa-Hillsborough County Library Revenues by Source, FY 2011 Adopted Budget
390) Tampa-Hillsborough County Library Expenditures by Use, FY 2011 Adopted Budget
391) Tampa-Hillsborough County Total Revenues by Source, FY 2012 Adopted Budget
392) Tampa-Hillsborough County Total Expenditures by Use, FY 2012 Adopted Budget
393) Tampa-Hillsborough County General Fund Revenues by Source, FY 2012 Adopted Budget
394) Tampa - Hillsborough County General Fund Expenditures by Use, FY 2012 Adopted Budget
395) Tampa-Hillsborough County Library Revenues by Source, FY 2012 Adopted Budget
396) Tampa-Hillsborough County Library Expenditures by Use, FY 2012 Adopted Budget
397) Wake County Government Total Revenues by Source, FY 2008 Adopted Budget
398) Wake County Government Expenditures by Use, FY 2008 Adopted Budget
399) Wake County Government General Fund Revenue by Source, FY 2008 Adopted Budget
400) Wake County Government General Fund Expenditures, FY 2008 Adopted Budget
401) Wake County Public Libraries Revenue by Source, FY 2008 Adopted Budget
402) Wake County Public Libraries Expenditures, FY 2008 Adopted Budget
403) Wake County Government Total Revenues by Source, FY 2009 Adopted Budget
404) Wake County Government Expenditures by Use, FY 2009 Adopted Budget
405) Wake County Government General Fund Revenue by Source, FY 2009 Adopted Budget
406) Wake County Government General Fund Expenditures, FY 2009 Adopted Budget
407) Wake County Public Libraries Revenue by Source, FY 2009 Adopted Budget
A p p e n d i x E : L i s t o f S o u r c e D a t a T a b l e s | p. E-10
408) Wake County Public Libraries Expenditures, FY 2009 Adopted Budget
409) Wake County Government Total Revenues by Source, FY 2010 Adopted Budget
410) Wake County Government Expenditures by Use, FY 2010 Adopted Budget
411) Wake County Government General Fund Revenue by Source, FY 2010 Adopted Budget
412) Wake County Government General Fund Expenditures, FY 2010 Adopted Budget
413) Wake County Public Libraries Revenue by Source, FY 2010 Adopted Budget
414) Wake County Public Libraries Expenditures, FY 2010 Adopted Budget
415) Wake County Government Total Revenues by Source, FY 2011 Adopted Budget
416) Wake County Government Expenditures by Use, FY 2011 Adopted Budget
417) Wake County Government General Fund Revenue by Source, FY 2011 Adopted Budget
418) Wake County Government General Fund Expenditures, FY 2011 Adopted Budget
419) Wake County Public Libraries Revenue by Source, FY 2011 Adopted Budget
420) Wake County Public Libraries Expenditures, FY 2011 Adopted Budget
421) Wake County Government Total Revenues by Source, FY 2012 Adopted Budget
422) Wake County Government Expenditures by Use, FY 2012 Adopted Budget
423) Wake County Government General Fund Revenue by Source, FY 2012 Adopted Budget
424) Wake County Government General Fund Expenditures, FY 2012 Adopted Budget
425) Wake County Public Libraries Revenue by Source, FY 2012 Adopted Budget
426) Wake County Public Libraries Expenditures, FY 2012 Adopted Budget
Public Library Funding:
Comparing Charlotte Mecklenburg Library and
Selected Library Systems (FY2008 - FY2012)
Appendix F – Detailed Source Tables
March 2012
By the University of North Carolina at Charlotte Urban Institute
Appendix F- Detailed Source Tables Page F-1

Administrative Charges 4,102,864$ Area Mental Health 88,890,847$
Intergovernmental 172,900,693$ City-County Departments 2,065,428$
Fees and Charges For Services 85,068,986$ Community Support Services 3,543,679$
Fund Balance & Retained Earnings 65,126,750$ County Commissioners 402,668$
Other Revenue 70,446,544$ Education Services 530,807,531$
Licenses & Permits 25,318,489$ Elections 4,260,223$
Property Taxes 784,991,618$ Emergency Medical Services 15,306,328$
Sales Taxes 242,223,621$ Finance 3,170,781$
Transfer From Other Funds 102,322$ General Debt 114,083,395$
Total Revenues 1,450,281,887$ General Services 10,103,012$
Geospatial Information Services 3,830,036$
Historic Landmarks Commission 160,415$
Hospitals 20,724,525$
Human Resources 4,517,058$
Information Services & Technology 18,434,380$
Internal Audit 556,468$
Land Use & Environmental Services 77,261,920$
Law Enforcement Service District 12,548,543$
Manager's Office 7,358,930$
Medical Examiner 1,179,009$
Non-Departmental Appropriations 69,210,303$
Outside Agencies 8,604,181$
Park & Recreation 41,664,935$
Public Health 32,218,682$
Public Library 34,100,189$
Public Services & Information 2,045,043$
Real Estate Services 11,502,868$
Register of Deeds 3,598,708$
Sheriff's Office 104,014,585$
Social Services 174,899,732$
State Justice Services 3,349,448$
Tax Collector 6,193,037$
Transits Sales Tax 39,200,000$
WTVI (Equipment & Maintenance) 475,000$
Total Expenditures 1,450,281,887$
Administrative Charges 4,102,864$ Area Mental Health 88,890,847$
Intergovernmental 171,539,566$ City-County Departments 2,065,428$
Fees and Charges For Services 56,705,817$ Community Support Services 3,543,679$
Fund Balance & Retained Earnings 65,126,750$ County Commissioners 402,668$
Other Revenue 67,474,105$ Education Services 525,607,531$
Licenses & Permits 25,318,489$ Elections 4,260,223$
Property Taxes 772,840,218$ Emergency Medical Services 15,306,328$
Sales Taxes 203,023,621$ Finance 3,170,781$
Transfer From Other Funds -$ General Debt 114,083,395$
Total General Fund Revenues 1,366,131,430$ General Services 10,103,012$
Geospatial Information Services 3,830,036$
Historic Landmarks Commission 160,415$
Hospitals 20,724,525$
Human Resources 4,517,058$
Information Services & Technology 18,434,380$
Internal Audit 556,468$
Land Use & Environmental Services -$
Law Enforcement Service District -$
Manager's Office 7,358,930$
Medical Examiner 1,179,009$
Non-Departmental Appropriations 62,857,845$
Outside Agencies 8,604,181$
Park & Recreation 41,664,935$
Public Health 32,218,682$
Public Library 34,100,189$
Public Services & Information 2,045,043$
Real Estate Services 10,311,627$
Register of Deeds 3,598,708$
Sheriff's Office 104,014,585$
Social Services 174,899,732$
State Justice Services 3,349,448$
Tax Collector 6,193,037$
Transits Sales Tax -$
WTVI (Equipment & Maintenance) 475,000$
Total Expenditures 1,308,527,725$
Mecklenburg County Government Total Revenues by Source,
FY 2008 Adopted Budget
Mecklenburg County Government Total Expenditures by Use,
FY 2008 Adopted Budget
Source: FY 2009 Adopted Budget, page 84 (page 96 in PDF view)
(http://charmeck.org/mecklenburg/county/CountyManagersOffice/Busines
sManagement/PriorBudgets/FY09Budget/Documents/Final_FY_2009_Docu
ment_With_Tabs.pdf)
Mecklenburg County Government General Fund Revenue by Source,
FY 2008 Adopted Budget
Mecklenburg County Government General Fund Expenditures by Use,
FY 2008 Adopted Budget
Source: FY 2009 Adopted Budget, page 84 (page 96 in PDF view)
(http://charmeck.org/mecklenburg/county/CountyManagersOffice/Busines
sManagement/PriorBudgets/FY09Budget/Documents/Final_FY_2009_Docu
ment_With_Tabs.pdf)
*Note: FY 2008 Adopted Budget does not contain "Total Revenue and
Expenditure Comparison by Governmental Category" table. Thus, FY 2008
Adopted Budget figures were based on figures reported in the FY 2009
Adopted Budget Report.
*Note: FY 2008 Adopted Budget does not contain a table entitled "Total
Revenue and Expenditure Comparison by Governmental Category." Thus,
FY 2008 Adopted Budget were based on figures reported in the FY 2009
Adopted Budget Report.
Source: FY 2009 Adopted Budget, page 84 (page 96 in PDF view)
(http://charmeck.org/mecklenburg/county/CountyManagersOffice/Busines
sManagement/PriorBudgets/FY09Budget/Documents/Final_FY_2009_Docu
ment_With_Tabs.pdf)
Source: FY 2009 Adopted Budget, page 84 (page 96 in PDF view)
(http://charmeck.org/mecklenburg/county/CountyManagersOffice/Busines
sManagement/PriorBudgets/FY09Budget/Documents/Final_FY_2009_Docu
ment_With_Tabs.pdf)
Appendix F- Detailed Source Tables Page F-2

Mecklenburg County Appropriations 33,011,799$ Personnel 26,467,117$
Capital reserve -$ Library Materials 3,942,272$
Amounts paid on behalf by Mecklenburg 1,525,548$ Facility maintenance 2,490,332$
ABC Board 262,239$ Fixed Charges 1,100,811$
City of Charlotte 2,500$ Other 3,157,203$
North Carolina 599,417$ Capital Outlay 2,285,806$
Federal 19,733$ Debt Service-Principal 209,451$
Fines, fees and collections 1,310,959$ Debt Service-Interest 94,627$
Collections for photocopies 186,148$ Total Expenditures 39,747,619$
Interest 130,733$
Contributions 789,430$
Book rentals 101,969$
Book sales 135,160$
Special events 137,021$
Miscellaneous 1,199,040$
Total Revenues 39,411,696$
Mecklenburg County Appropriations 33,011,799$ Personnel 26,420,704$
Capital reserve -$ Library Materials 3,335,501$
Amounts paid on behalf by Mecklenburg 966,464$ Facility maintenance 2,483,874$
ABC Board 262,239$ Fixed Charges 1,100,811$
City of Charlotte 2,500$ Other 2,832,495$
North Carolina -$ Capital Outlay 1,602,538$
Federal -$ Debt Service-Interest 209,451$
Fines, fees and collections 1,310,959$ Debt Service-Interest 94,627$
Collections for photocopies 186,148$ Total General Fund Expenditures 38,080,001$
Interest 130,733$
Contributions 133,072$
Book rentals 101,969$
Book sales 135,160$
Special events 137,021$
Miscellaneous 951,219$
Total General Fund Revenues 37,329,283$
Source: CML Annual Audit 2007-2008, pg. 11 (page 13 in PDF view)
(http://www.plcmc.lib.nc.us/about_us/Audit_2008.pdf)
Source: CML Annual Audit 2007-2008, pg. 11 (page 13 in PDF view)
(http://www.plcmc.lib.nc.us/about_us/Audit_2008.pdf)
Source: CML Annual Audit 2007-2008, pg. 11 (page 13 in PDF view)
(http://www.plcmc.lib.nc.us/about_us/Audit_2008.pdf)
Source: CML Annual Audit 2007-2008, pg. 11 (page 13 in PDF view)
(http://www.plcmc.lib.nc.us/about_us/Audit_2008.pdf)
Charlotte Mecklenburg Library Expenditures using General Fund,
FY 2008 Annual Audit
Charlotte Mecklenburg Library General Fund Revenues,
FY 2008 Annual Audit
Charlotte Mecklenburg Library Total Revenues by Source,
FY 2008 Annual Audit
Charlotte Mecklenburg Library Total Revenue Expenditures,
FY 2008 Annual Audit
Appendix F- Detailed Source Tables Page F-3

Administrative Charges 4,186,330$ Area Mental Health 92,425,441$
Intergovernmental 177,311,294$ City-County Departments 2,687,592$
Fees and Charges For Services 81,896,750$ Community Support Services 5,269,881$
Fund Balance & Retained Earnings 76,614,640$ County Commissioners 424,950$
Other Revenue 67,452,537$ Education Services 561,254,352$
Licenses & Permits 22,255,653$ Elections 3,567,200$
Property Taxes 822,839,631$ Emergency Medical Services 15,806,328$
Sales Taxes 243,391,420$ Finance 3,412,772$
Transfer From Other Funds 131,690$ General Debt 119,814,218$
Total Revenues 1,496,079,945$ General Services -$
Geospatial Information Services 4,033,786$
Historic Landmarks Commission 168,215$
Hospitals 20,724,525$
Human Resources 4,744,647$
Information Services & Technology 19,687,060$
Internal Audit 573,674$
Land Use & Environmental Services 78,388,844$
Law Enforcement Service District 13,426,941$
Manager's Office 8,414,994$
Medical Examiner 1,273,059$
Non-Departmental Appropriations 47,344,774$
Outside Agencies 6,634,034$
Park & Recreation 44,149,728$
Public Health 34,147,474$
Public Library 35,766,544$
Public Services & Information 2,765,327$
Real Estate Services 15,867,007$
Register of Deeds 3,491,954$
Sheriff's Office 116,339,673$
Social Services 180,149,782$
State Justice Services 4,708,739$
Tax Collector 6,350,010$
Transits Sales Tax 41,191,420$
WTVI (Equipment & Maintenance) 1,075,000$
Total Expenditures 1,496,079,945$
Administrative Charges 4,186,330$ Area Mental Health 92,425,441$
Intergovernmental 175,632,780$ City-County Departments 2,687,592$
Fees and Charges For Services 53,008,344$ Community Support Services 5,269,881$
Fund Balance & Retained Earnings 76,614,640$ County Commissioners 424,950$
Other Revenue 64,366,599$ Education Services 556,054,352$
Licenses & Permits 22,255,653$ Elections 3,567,200$
Property Taxes 809,809,833$ Emergency Medical Services 15,806,328$
Sales Taxes 202,200,000$ Finance 3,412,772$
Transfer From Other Funds -$ General Debt 119,814,218$
Total General Fund Revenues 1,408,074,179$ General Services -$
Geospatial Information Services 4,033,786$
Historic Landmarks Commission 168,215$
Hospitals 20,724,525$
Human Resources 4,744,647$
Information Services & Technology 19,687,060$
Internal Audit 573,674$
Land Use & Environmental Services -$
Law Enforcement Service District -$
Manager's Office 8,414,994$
Medical Examiner 1,273,059$
Non-Departmental Appropriations 42,844,774$
Outside Agencies 6,634,034$
Park & Recreation 44,149,728$
Public Health 34,147,474$
Public Library 35,766,544$
Public Services & Information 2,765,327$
Real Estate Services 14,637,881$
Register of Deeds 3,491,954$
Sheriff's Office 116,339,673$
Social Services 180,149,782$
State Justice Services 4,708,739$
Tax Collector 6,350,010$
Transits Sales Tax -$
WTVI (Equipment & Maintenance) 1,075,000$
Total Expenditures 1,352,143,614$
Mecklenburg County Government Total Revenues by Source,
FY 2009 Adopted Budget
Mecklenburg County Government Total Expenditures by Use,
FY 2009 Adopted Budget
Source: FY 2009 Adopted Budget, page 84 (page 96 in PDF view)
(http://charmeck.org/mecklenburg/county/CountyManagersOffice/Busines
sManagement/PriorBudgets/FY09Budget/Documents/Final_FY_2009_Docu
ment_With_Tabs.pdf)
Source: FY 2009 Adopted Budget, page 84 (page 96 in PDF view)
(http://charmeck.org/mecklenburg/county/CountyManagersOffice/Busines
sManagement/PriorBudgets/FY09Budget/Documents/Final_FY_2009_Docu
ment_With_Tabs.pdf)
Source: FY 2009 Adopted Budget, page 84 (page 96 in PDF view)
(http://charmeck.org/mecklenburg/county/CountyManagersOffice/Busines
sManagement/PriorBudgets/FY09Budget/Documents/Final_FY_2009_Docu
ment_With_Tabs.pdf)
Source: FY 2009 Adopted Budget, page 84 (page 96 in PDF view)
(http://charmeck.org/mecklenburg/county/CountyManagersOffice/Busines
sManagement/PriorBudgets/FY09Budget/Documents/Final_FY_2009_Docu
ment_With_Tabs.pdf)
Mecklenburg County Government General Fund Revenue
by Source,
FY 2009 Adopted Budget
Mecklenburg County Government General Fund Expenditures
by Use,
FY 2009 Adopted Budget
Appendix F- Detailed Source Tables Page F-4
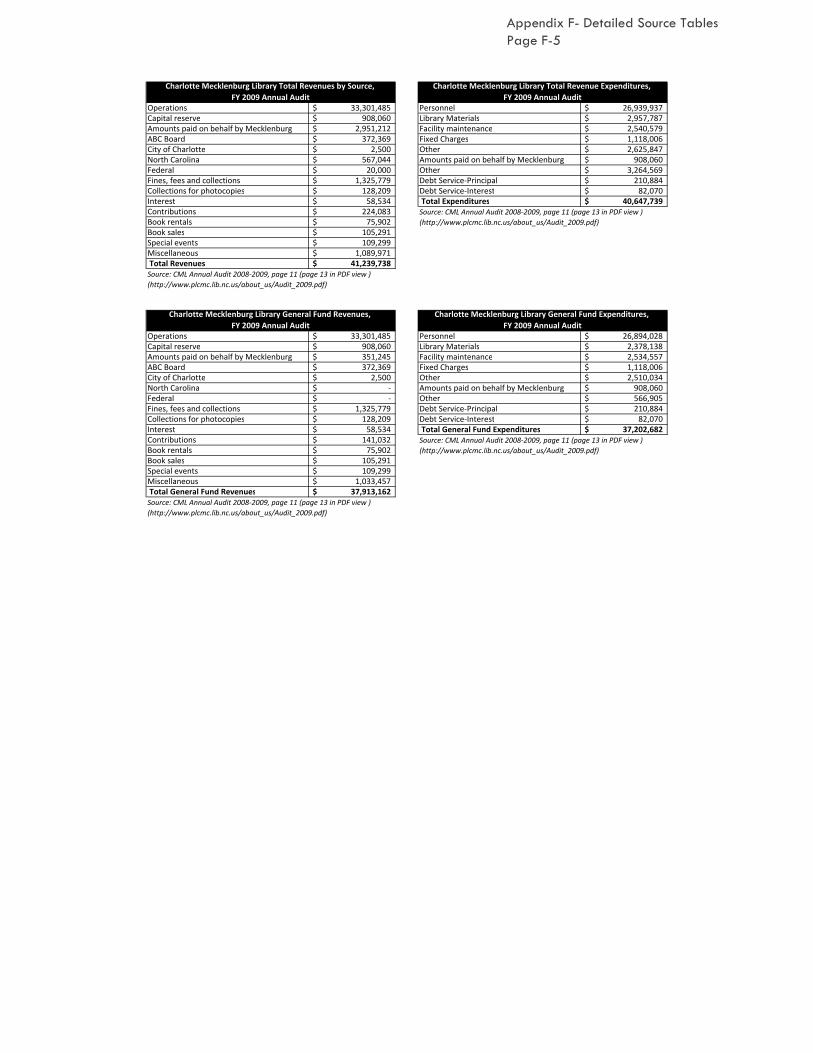
Operations 33,301,485$ Personnel 26,939,937$
Capital reserve 908,060$ Library Materials 2,957,787$
Amounts paid on behalf by Mecklenburg 2,951,212$ Facility maintenance 2,540,579$
ABC Board 372,369$ Fixed Charges 1,118,006$
City of Charlotte 2,500$ Other 2,625,847$
North Carolina 567,044$ Amounts paid on behalf by Mecklenburg 908,060$
Federal 20,000$ Other 3,264,569$
Fines, fees and collections 1,325,779$ Debt Service-Principal 210,884$
Collections for photocopies 128,209$ Debt Service-Interest 82,070$
Interest 58,534$ Total Expenditures 40,647,739$
Contributions 224,083$
Book rentals 75,902$
Book sales 105,291$
Special events 109,299$
Miscellaneous 1,089,971$
Total Revenues 41,239,738$
Operations 33,301,485$ Personnel 26,894,028$
Capital reserve 908,060$ Library Materials 2,378,138$
Amounts paid on behalf by Mecklenburg 351,245$ Facility maintenance 2,534,557$
ABC Board 372,369$ Fixed Charges 1,118,006$
City of Charlotte 2,500$ Other 2,510,034$
North Carolina -$ Amounts paid on behalf by Mecklenburg 908,060$
Federal -$ Other 566,905$
Fines, fees and collections 1,325,779$ Debt Service-Principal 210,884$
Collections for photocopies 128,209$ Debt Service-Interest 82,070$
Interest 58,534$ Total General Fund Expenditures 37,202,682$
Contributions 141,032$
Book rentals 75,902$
Book sales 105,291$
Special events 109,299$
Miscellaneous 1,033,457$
Total General Fund Revenues 37,913,162$
Charlotte Mecklenburg Library General Fund Revenues,
FY 2009 Annual Audit
Charlotte Mecklenburg Library General Fund Expenditures,
FY 2009 Annual Audit
Charlotte Mecklenburg Library Total Revenues by Source,
FY 2009 Annual Audit
Charlotte Mecklenburg Library Total Revenue Expenditures,
FY 2009 Annual Audit
Source: CML Annual Audit 2008-2009, page 11 (page 13 in PDF view )
(http://www.plcmc.lib.nc.us/about_us/Audit_2009.pdf)
Source: CML Annual Audit 2008-2009, page 11 (page 13 in PDF view )
(http://www.plcmc.lib.nc.us/about_us/Audit_2009.pdf)
Source: CML Annual Audit 2008-2009, page 11 (page 13 in PDF view )
(http://www.plcmc.lib.nc.us/about_us/Audit_2009.pdf)
Source: CML Annual Audit 2008-2009, page 11 (page 13 in PDF view )
(http://www.plcmc.lib.nc.us/about_us/Audit_2009.pdf)
Appendix F- Detailed Source Tables Page F-5

Administrative Charges 2,744,287$ Area Mental Health 90,036,558$
Intergovernmental 171,880,734$ City-County Departments 2,684,653$
Fees and Charges For Services 75,665,184$ Community Support Services 5,372,329$
Fund Balance & Retained Earnings 46,552,785$ County Commissioners 399,624$
Other Revenue 59,627,817$ Education Services 527,849,181$
Licenses & Permits 16,312,575$ Elections 3,542,551$
Property Taxes 844,287,803$ Emergency Medical Services 16,806,328$
Sales Taxes 202,100,000$ Finance 3,204,415$
Transfer From Other Funds 1,279,690$ General Debt 143,674,562$
Total Revenues 1,420,450,875$ General Services -$
Geospatial Information Services 3,763,942$
Historic Landmarks Commission 168,215$
Hospitals 17,850,000$
Human Resources 4,679,310$
Information Services & Technology 19,159,554$
Internal Audit 506,700$
Land Use & Environmental Services 65,219,201$
Law Enforcement Service District 12,202,623$
Manager's Office 7,207,926$
Medical Examiner 1,409,468$
Non-Departmental Appropriations 27,842,250$
Outside Agencies 6,167,812$
Park & Recreation 40,882,843$
Public Health 33,893,160$
Public Library 32,424,879$
Public Services & Information 2,378,348$
Real Estate Services 14,887,235$
Register of Deeds 2,868,093$
Sheriff's Office 107,928,578$
Social Services 176,678,576$
State Justice Services 7,310,388$
Tax Collector 6,561,573$
Transits Sales Tax 34,100,000$
WTVI (Equipment & Maintenance) 790,000$
Total Expenditures 1,420,450,875$
Administrative Charges 2,744,287$ Area Mental Health 90,036,558$
Intergovernmental 170,396,646$ City-County Departments 2,684,653$
Fees and Charges For Services 49,998,501$ Community Support Services 5,372,329$
Fund Balance & Retained Earnings 45,695,000$ County Commissioners 399,624$
Other Revenue 58,297,724$ Education Services 527,849,181$
Licenses & Permits 16,312,575$ Elections 3,542,551$
Property Taxes 833,542,965$ Emergency Medical Services 16,806,328$
Sales Taxes 168,000,000$ Finance 3,204,415$
Transfer From Other Funds -$ General Debt 143,674,562$
Total General Fund Revenues 1,344,987,698$ General Services -$
Geospatial Information Services 3,763,942$
Historic Landmarks Commission 168,215$
Hospitals 17,850,000$
Human Resources 4,679,310$
Information Services & Technology 19,159,554$
Internal Audit 506,700$
Land Use & Environmental Services 36,058,647$
Law Enforcement Service District -$
Manager's Office 7,207,926$
Medical Examiner 1,409,468$
Non-Departmental Appropriations 27,842,250$
Outside Agencies 6,167,812$
Park & Recreation 40,882,843$
Public Health 33,893,160$
Public Library 32,424,879$
Public Services & Information 2,378,348$
Real Estate Services 14,887,235$
Register of Deeds 2,868,093$
Sheriff's Office 107,928,578$
Social Services 176,678,576$
State Justice Services 7,310,388$
Tax Collector 6,561,573$
Transits Sales Tax -$
WTVI (Equipment & Maintenance) 790,000$
Total Expenditures 1,344,987,698$
Mecklenburg County Government Total Revenues by Source,
FY 2010 Adopted Budget
Mecklenburg County Government Total Expenditures by Use,
FY 2010 Adopted Budget
Source: FY 2010 Adopted Budget, page 85 (page 97 in PDF view)
(http://charmeck.org/mecklenburg/county/CountyManagersOffice/Busines
sManagement/PriorBudgets/FY10Budget/Documents/FY2010BudgetBook-
adopted.pdf)
Source: FY 2010 Adopted Budget, page 85 (page 97 in PDF view)
(http://charmeck.org/mecklenburg/county/CountyManagersOffice/Busines
sManagement/PriorBudgets/FY10Budget/Documents/FY2010BudgetBook-
adopted.pdf)
Mecklenburg County Government General Fund Revenue
by Source,
FY 2010 Adopted Budget
Mecklenburg County Government General Fund Expenditures
by Use,
FY 2010 Adopted Budget
Source: FY 2010 Adopted Budget, page 85 (page 97 in PDF view)
(http://charmeck.org/mecklenburg/county/CountyManagersOffice/Busines
sManagement/PriorBudgets/FY10Budget/Documents/FY2010BudgetBook-
adopted.pdf)
Source: FY 2010 Adopted Budget, page 85 (page 97 in PDF view)
(http://charmeck.org/mecklenburg/county/CountyManagersOffice/Busines
sManagement/PriorBudgets/FY10Budget/Documents/FY2010BudgetBook-
adopted.pdf)
Appendix F- Detailed Source Tables Page F-6

Operations 29,573,048$ Personnel 24,220,642$
Capital reserve 406,224$ Library Materials 2,476,333$
Amounts paid on behalf by Mecklenburg 6,669,722$ Facility maintenance 2,067,557$
ABC Board 277,000$ Fixed Charges 1,097,988$
City of Charlotte 2,500$ Other 2,099,890$
North Carolina 533,362$ Amounts paid on behalf by Mecklenburg 6,296,339$
Federal 7,632$ Other 1,090,448$
Fines, fees and collections 1,173,123$ Debt Service-Principal 215,987$
Collections for photocopies 41,191$ Debt Service-Interest 69,904$
Interest 37,343$ Total Expenditures 39,635,088$
Contributions 455,339$
Book rentals 67,702$
Book sales 111,530$
Special events 46,904$
Miscellaneous 2,326,276$
Total Revenues 41,728,896$
Operations 29,573,048$ Personnel 24,220,642$
Capital reserve 406,224$ Library Materials 1,933,465$
Amounts paid on behalf by Mecklenburg 373,383$ Facility maintenance 2,067,219$
ABC Board 277,000$ Fixed Charges 1,097,988$
City of Charlotte 2,500$ Other 1,991,643$
North Carolina -$ Amounts paid on behalf by Mecklenburg -$
Federal -$ Other 1,043,020$
Fines, fees and collections 1,173,123$ Debt Service-Principal 215,987$
Collections for photocopies 41,191$ Debt Service-Interest 69,904$
Interest 37,343$ Total General Fund Expenditures 32,639,868$
Contributions 314,725$
Book rentals 67,702$
Book sales 111,530$
Special events 46,904$
Miscellaneous 2,178,205$
Total General Fund Revenues 34,602,878$
Charlotte Mecklenburg Library Total Revenues by Source,
FY 2010 Annual Audit
Charlotte Mecklenburg Library Total Revenue Expenditures,
FY 2010 Annual Audit
Source: CML Annual Audit 2009-2010, page 14 (page 16 in PDF view)
(http://www.cmlibrary.org/about_us/Audit_2010.pdf)
Source: CML Annual Audit 2009-2010, page 14 (page 16 in PDF view)
(http://www.cmlibrary.org/about_us/Audit_2010.pdf)
Source: CML Annual Audit 2009-2010, page 14 (page 16 in PDF view)
(http://www.cmlibrary.org/about_us/Audit_2010.pdf)
Source: CML Annual Audit 2009-2010, page 14 (page 16 in PDF view)
(http://www.cmlibrary.org/about_us/Audit_2010.pdf)
Charlotte Mecklenburg Library General Fund Revenues,
FY 2010 Annual Audit
Charlotte Mecklenburg Library General Fund Expenditures,
FY 2010 Annual Audit
Appendix F- Detailed Source Tables Page F-7

Administrative Charges 2,444,287$ Area Mental Health 88,317,161$ Intergovernmental 180,179,717$ City‐County Departments 2,593,221$ Fees and Charges For Services 69,702,683$ Child Support Enforcement 7,001,831$ Fund Balance & Retained Earnings 22,700,000$ Community Support Services 5,611,515$ Other Revenue 41,754,300$ County Commissioners 372,629$ Licenses & Permits 13,403,764$ Economic Development 6,908,857$ Property Taxes 847,290,289$ Education Services 514,784,705$ Sales Taxes 170,040,000$ Elections 3,262,660$ Transfer From Other Funds 1,975,974$ Emergency Medical Services 15,106,328$ Total Revenues 1,349,491,014$ Finance 3,444,562$
General Debt 117,254,073$ Geospatial Information Services 3,433,881$ Historic Landmarks Commission 216,215$ Hospitals 16,850,000$ Human Resources 3,705,924$ Information Services & Technology 16,574,447$ Internal Audit 739,121$ Land Use & Environmental Services 60,931,318$ Law Enforcement Service District 12,495,927$ Manager's Office 6,931,978$ Medical Examiner 1,427,901$ Non‐Departmental Appropriations 36,892,144$ Outside Agencies 3,570,361$ Park & Recreation 26,600,014$ Public Health 37,625,458$ Public Library 17,591,815$ Public Services & Information 1,435,905$ Real Estate Services 15,276,376$ Register of Deeds 2,514,075$ Sheriff's Office 106,604,285$ Social Services 169,228,311$ State Justice Services 6,328,502$ Tax Collector 6,859,514$ Transits Sales Tax 31,000,000$ Total Expenditures 1,349,491,014$
Administrative Charges 2,444,287$ Area Mental Health 88,317,161$
Intergovernmental 178,738,136$ City‐County Departments 2,593,221$ Fees and Charges For Services 43,420,378$ Child Support Enforcement 7,001,831$ Fund Balance & Retained Earnings 22,700,000$ Community Support Services 5,611,515$ Other Revenue 39,165,587$ County Commissioners 372,629$ Licenses & Permits 13,403,764$ Economic Development 6,908,857$ Property Taxes 834,794,362$ Education Services 514,784,705$ Sales Taxes 139,040,000$ Elections 3,262,660$ Transfer From Other Funds 1,746,284$ Emergency Medical Services 15,106,328$ Total General Fund Revenues 1,275,452,798$ Finance 3,444,562$
General Debt 117,254,073$ Geospatial Information Services 3,433,881$ Historic Landmarks Commission 216,215$ Hospitals 16,850,000$ Human Resources 3,705,924$ Information Services & Technology 16,574,447$ Internal Audit 739,121$ Land Use & Environmental Services 30,389,029$ Law Enforcement Service District ‐$ Manager's Office 6,931,978$ Medical Examiner 1,427,901$ Non‐Departmental Appropriations 36,892,144$ Outside Agencies 3,570,361$ Park & Recreation 26,600,014$ Public Health 37,625,458$ Public Library 17,591,815$ Public Services & Information 1,435,905$ Real Estate Services 15,276,376$ Register of Deeds 2,514,075$ Sheriff's Office 106,604,285$ Social Services 169,228,311$ State Justice Services 6,328,502$ Tax Collector 6,859,514$ Transits Sales Tax ‐$ Total Expenditures 1,275,452,798$
Mecklenburg County Government Total Expenditures by Use,
FY 2011 Adopted Budget
Source: FY 2011 Adopted Budget, page 61 (page 73 in PDF view)
(http://charmeck.org/mecklenburg/county/CountyManagersOffice/Busines
sManagement/Documents/FY%2011%20Budget%20Approved/FY2011%20
Budget%20Book.pdf)
Mecklenburg County Government Total Revenues by Source,
FY 2011 Adopted Budget
Source: FY 2011 Adopted Budget, page 61 (page 73 in PDF view)
(http://charmeck.org/mecklenburg/county/CountyManagersOffice/Busines
sManagement/Documents/FY%2011%20Budget%20Approved/FY2011%20
Budget%20Book.pdf)
Source: FY 2011 Adopted Budget, page 61 (page 73 in PDF view)
(http://charmeck.org/mecklenburg/county/CountyManagersOffice/Busines
sManagement/Documents/FY%2011%20Budget%20Approved/FY2011%20
Budget%20Book.pdf)
Source: FY 2011 Adopted Budget, page 61 (page 73 in PDF view)
(http://charmeck.org/mecklenburg/county/CountyManagersOffice/Busines
sManagement/Documents/FY%2011%20Budget%20Approved/FY2011%20
Budget%20Book.pdf)
Mecklenburg County Government General Fund Revenue
by Source,
FY 2011 Adopted Budget
Mecklenburg County Government General Fund Expenditures
by Use,
FY 2011 Adopted Budget
Appendix F- Detailed Source Tables Page F-8

Mecklenburg County 21,051,899$ Personnel 17,780,645$ Paid on behalf by Mecklenburg County 4,216,288$ Library Materials 1,765,961$ ABC Board 290,850$ Facility maintenance 2,726,133$ City of Charlotte* 1,938,358$ Fixed Charges 840,624$ North Carolina 391,145$ Other 2,520,975$ Federal 15,272$ Paid on behalf by Mecklenburg County 2,374,958$ Fines, fees, and collections 957,884$ Other 484,644$ Photocopies 27,722$ Debt Service‐Principal 33,519$ Interest 59,083$ Debt Service‐Interest 5,854$ Contributions 287,724$ Total General Fund Expenditures 28,533,313$ Book rentals 43,185$ Book sales 196,250$ Special events 168,029$ Miscellaneous 1,295,901$ Total Revenues 30,939,590$
Operations 21,051,899$ Personnel 17,780,645$ Paid on behalf by Mecklenburg County 1,841,330$ Library Materials 1,374,816$ ABC Board 290,850$ Facility maintenance 2,725,249$ City of Charlotte* 1,938,358$ Fixed Charges 840,624$ North Carolina ‐$ Other 2,451,555$ Federal ‐$ Paid on behalf by Mecklenburg County ‐$ Fines, fees, and collections 957,884$ Other 444,907$ Photocopies 27,722$ Debt Service‐Principal 33,519$ Interest 59,083$ Debt Service‐Interest 5,854$ Contributions 235,561$ Total General Fund Expenditures 25,657,169$ Book rentals 43,185$ Book sales 196,250$ Special events 168,029$ Miscellaneous 1,095,117$ Total Revenues 27,905,268$
*This includes one‐time emergency funding support for CML from the city of
Charlotte and towns in Mecklenburg County.
Source: CML 2010‐2011 Library Annual Audit, (Email communication with
Charles J. Mallas 3/22/12)
Charlotte Mecklenburg Library General Fund Revenues,
FY 2011 Annual Audit
Charlotte Mecklenburg Library General Fund Expenditures,
FY 2011 Annual Audit
Source: CML 2010‐2011 Library Annual Audit, (Email communication with
Charles J. Mallas 3/22/12)
Charlotte Mecklenburg Library Total Revenues by Source,
FY 2011 Annual Audit
Charlotte Mecklenburg Library Total Expenditures,
FY 2011 Annual Audit
Source: CML 2010‐2011 Library Annual Audit, (Email communication with
Charles J. Mallas 3/22/12)
Source: CML 2010‐2011 Library Annual Audit, (Email communication with
Charles J. Mallas 3/22/12)
*This includes one‐time emergency funding support for CML from the city of
Charlotte and towns in Mecklenburg County.
Appendix F- Detailed Source Tables Page F-9

Administrative Charges 2,525,637$ Area Mental Health 83,180,259$ Intergovernmental 166,183,077$ City‐County Departments 2,765,323$ Fees and Charges For Services 65,803,361$ Child Support Enforcement 6,352,152$ Fund Balance & Retained Earnings ‐$ Community Support Grants 3,102,500$ Other Revenue 46,157,980$ Community Support Services 6,193,606$ Licenses & Permits 13,661,873$ County Commissioners 374,915$ Property Taxes 906,704,657$ Court Justice Services 9,025,756$ Sales Taxes 183,715,000$ Economic Development 7,755,898$ Transfer From Other Funds 254,297$ Education Services 542,099,101$ Total Revenues 1,385,005,882$ Elections 4,093,665$
Emergency Medical Services 15,080,000$ Finance 3,550,140$ General Debt 122,847,642$ Geospatial Information Services 3,476,398$ Historic Landmarks Commission 186,234$ Hospitals 225,000$ Human Resources 3,929,530$ Information Services & Technology 17,874,620$ Internal Audit 992,174$ Land Use & Environmental Services 63,226,483$ Law Enforcement Service District 11,467,170$ Manager's Office 4,940,396$ Medical Examiner 1,500,528$ Non‐Departmental Appropriations 49,318,049$ Park & Recreation 29,783,380$ Public Health 38,416,469$ Public Library 24,257,052$ Public Services & Information 1,720,003$ Real Estate Services 16,216,364$ Register of Deeds 2,753,610$ Sheriff's Office 108,198,846$ Social Services 160,917,709$ Tax Collector 6,984,910$ Transits Sales Tax 32,200,000$ Total Expenditures 1,385,005,882$
Administrative Charges 2,525,637$ Area Mental Health 83,180,259$ Intergovernmental 163,731,200$ City‐County Departments 2,765,323$ Fees and Charges For Services 38,695,354$ Child Support Enforcement 6,352,152$ Fund Balance & Retained Earnings ‐$ Community Support Grants 3,102,500$ Other Revenue 42,648,437$ Community Support Services 6,193,606$ Licenses & Permits 13,661,873$ County Commissioners 374,915$ Property Taxes 895,237,487$ Court Justice Services 9,025,756$ Sales Taxes 151,515,000$ Economic Development 7,755,898$ Transfer From Other Funds 116,234$ Education Services 542,099,101$ Total General Fund Revenues 1,308,131,222$ Elections 4,093,665$
Emergency Medical Services 15,080,000$ Finance 3,550,140$ General Debt 122,847,642$ Geospatial Information Services 3,476,398$ Historic Landmarks Commission 186,234$ Hospitals 225,000$ Human Resources 3,929,530$ Information Services & Technology 17,874,620$ Internal Audit 992,174$ Land Use & Environmental Services 30,018,993$ Law Enforcement Service District ‐$ Manager's Office 4,940,396$ Medical Examiner 1,500,528$ Non‐Departmental Appropriations 49,318,049$ Park & Recreation 29,783,380$ Public Health 38,416,469$ Public Library 24,257,052$ Public Services & Information 1,720,003$ Real Estate Services 16,216,364$ Register of Deeds 2,753,610$ Sheriff's Office 108,198,846$ Social Services 160,917,709$ Tax Collector 6,984,910$ Transits Sales Tax ‐$ Total Expenditures 1,308,131,222$
Mecklenburg County Government Total Revenues by Source,
FY 2012 Adopted Budget
Mecklenburg County Government Total Expenditures by Use,
FY 2012 Adopted Budget
Source: FY 2012 Adopted Budget, page 51 (page 63 in PDF view)
(http://charmeck.org/mecklenburg/county/CountyManagersOffice/OMB/B
udgetBooks/FY2012BudgetBook.pdf)
Source: FY 2012 Adopted Budget, page 51 (page 63 in PDF view)
(http://charmeck.org/mecklenburg/county/CountyManagersOffice/OMB/B
udgetBooks/FY2012BudgetBook.pdf)
Mecklenburg County Government General Fund Revenue
by Source,
FY 2012 Adopted Budget
Mecklenburg County Government General Fund Expenditures
by Use,
FY 2012 Adopted Budget
Source: FY 2012 Adopted Budget, page 51 (page 63 in PDF view)
(http://charmeck.org/mecklenburg/county/CountyManagersOffice/OMB/B
udgetBooks/FY2012BudgetBook.pdf)
Source: FY 2012 Adopted Budget, page 51 (page 63 in PDF view)
(http://charmeck.org/mecklenburg/county/CountyManagersOffice/OMB/B
udgetBooks/FY2012BudgetBook.pdf)
Appendix F- Detailed Source Tables Page F-10

Mecklenburg County 24,257,052$ CTC Reimbursement 230,000$ Salaries 13,589,884$ ABC Distribution 290,850$ Fringes 4,882,048$ Other 60,000$ Utilities 832,921$ Fines and Fees 870,000$ Auto 20,050$ Print Management 85,000$ Postage 27,000$ Proctoring 15,000$ Telephones 143,370$ Book/Digital Rental 40,000$ Rental Equipment‐Computers 424,970$ Copiers 25,000$ Real Estate 801,170$ Book Sales 90,000$ Insurance‐Other 202,707$ Contributions 200,000$ Professional Services 40,000$ E‐Rate 314,000$ Programs 206,048$ City of Charlotte 2,500$ Communications 285,284$ State of North Carolina 330,000$ Supplies 139,088$ Total Revenues 26,809,402$ Books 624,427$
Vehicle Maintenance 59,945$ ImaginOn 1,978,140$ Sum of County Funded 24,257,052$
Professional Services 391,000$ Books 1,486,850$ Training/Travel 65,000$ Copiers/Printers 157,000$ Outside Printing 180,000$ Repairs and Maintenance 100,000$ Public Relations 5,000$ Advertising 5,000$ Recruitment 15,000$ Memberships 25,000$ Development and Fundraising 40,000$ Volunteers 15,000$ Board Expense 10,000$ Parking 25,000$ DuPuy Scholarships 7,500$ Contingency 25,000$ Sum of Non‐County Funded 2,552,350$ Total Expenditures 26,809,402$ Source: FY 2012 Approved Budget
(http://us.vocuspr.com/Newsroom/ViewAttachment.aspx?SiteName=cmlib
rary&Entity=PRAsset&AttachmentType=F&EntityID=72937&AttachmentID=
4c4aa2a8‐bc70‐4a90‐bde5‐2b6222c540b4)
Charlotte Mecklenburg Library Total Revenues by Source,
FY 2012 Approved Budget
Charlotte Mecklenburg Library Total Expenditures,
FY 2012 Approved BudgetCounty Funded
Source: FY 2012 Approved Budget
(http://us.vocuspr.com/Newsroom/ViewAttachment.aspx?SiteName=cmlib
rary&Entity=PRAsset&AttachmentType=F&EntityID=72937&AttachmentID=
4c4aa2a8‐bc70‐4a90‐bde5‐2b6222c540b4) Non‐County Funded
Note: There was a budget reduction of $972,758 from the County to
account for the transfer of IT and HR employees from the library to the
County.
Appendix F- Detailed Source Tables Page F-11

General Fund 627,704,466$ General Fund 671,469,078$
Special Services District Fund -$ Special Services District Fund 17,393,594$
South Fulton Tax District Fund 36,000,000$ South Fulton Tax District Fund 48,676,598$
Northwest Fund -$ Northwest Fund 5,414,928$
Northeast Fund -$ Northeast Fund 2,754,770$
Emergency Communications (911) Fund 7,300,000$ Emergency Communications (911) Fund 9,697,262$
Water Sewer Revenue Fund 77,802,340$ Water Sewer Revenue Fund 98,436,898$
Water Sewer Renewal & Extension Fund 17,500,000$ Water Sewer Renewal & Extension Fund 14,713,499$
Stormwater Management Fund -$ Stormwater Management Fund 5,500,000$
Solid Waste Enterprise Fund 1,257,000$ Solid Waste Enterprise Fund 1,500,000$
Bond Fund -$ Bond Fund 5,480,420$
Risk Management Insurance Fund* 14,563,492$ Risk Management Insurance Fund 19,286,245$
Health & Wellness Department Fund 41,376,542$ Health & Wellness Department Fund 43,113,029$
Airport Fund 850,000$ Airport Fund 1,288,067$
Special Appropriation Funds^ 19,356,444$ Special Appropriation Funds^ 19,356,444$
Total Revenues by Source ** 824,353,840$ Total Operating Expenses* 964,080,832$
*Note: Most revenues are interfund transfers.
Property Taxes 468,373,145$ Arts Council 5,765,962$
Local Option Sales Tax 38,000,000$ Board of Commissioners 3,380,026$
All Other 107,580,127$ Clerk to the Commission 1,181,335$
Increase due to Commercial Reval. 13,751,194$ Cooperative Extension 526,081$
Total General Fund Revenue 627,704,466$ County Attorney 4,162,226$
County Manager 9,388,727$
County Marshal 5,784,059$
District Attorney 21,876,247$
Emergency - 911 3,375,673$
Environ. & Comm. Develop. Services 3,746,785$
Family & Children Svcs. 13,625,613$
Finance 7,709,848$
General Services 37,033,816$
Grady Hospital Transfer 80,000,000$
Health Fund Transfer 18,540,867$
Housing & Comm. Develop. 2,160,207$
Atlanta-Fulton County Government Total Revenues by Source,
FY 2008 Final Budget
Atlanta-Fulton County Government Expenditures by Use,
FY 2008 Final Budget
Source: 2008 Fiscal Year Final Budget, pages 2-17 of PDF
(http://www.fultoncountyga.gov/images/stories/Finance/FY2008%20Final%20Bu
dget2.pdf)
Source: 2008 Fiscal Year Final Budget, pages 2-17 of PDF
(http://www.fultoncountyga.gov/images/stories/Finance/FY2008%20Final%20Bu
dget2.pdf)
Source: 2008 Fiscal Year Final Budget, page 2 of PDF
(http://www.fultoncountyga.gov/images/stories/Finance/FY2008%20Final%20Bu
dget2.pdf)
^Note: Various funds that are legally restricted to expenditures for specific
purposes. Revenues are mostly from fund balances.
*Note: Total Expenditures determined by adding individual funds.
Atlanta-Fulton County Government General Fund Revenues
by Source,
FY 2008 Final Budget
Atlanta-Fulton County Government General Fund Expenditures,
FY 2008 Final Budget
**Note: Total Revenues determined by adding individual funds and does not
include fund balances (except for Special Appropriation Funds) and interfund
transfers (except for Risk Management Insurance Fund). General Fund has a
beginning fund balance of $100,095,541 for FY 2007-08 Final Adopted Budget.
^Note: Includes Fund 430 (Library Trust Fund) which are donated funds for the
purchase of books, journals, magazines and other publications (unknown amount
from Fund 430).
*Note: Does not include a beginning fund balance of $100,095,541 for FY 2007-08
Final Adopted Budget.
Housing & Comm. Develop. 2,160,207$
Human Services 30,847,623$
Information Technology 26,490,093$
Juvenile Court 15,020,135$
Library 35,031,128$
Medical Examiner 3,732,535$
Mental Health/DD/AD 16,397,473$
Non Agency 89,163,997$
Personnel 4,708,700$
Police 4,198,316$
Probate Court 2,870,736$
Public Defender 11,584,169$
Public Works 7,579,092$
Purchasing 3,951,402$
Registration & Elections 10,979,084$
Sheriff 98,000,000$
State Court - General 13,823,297$
State Court - Judges 4,136,659$
State Court - Solicitor General 6,324,108$
Superior Court - Clerk 15,300,255$
Superior Court - General 19,921,077$
Superior Court - Judges 5,109,572$
Tax Assessor 13,662,191$
Tax Commissioner 14,379,964$
Total Operating Expenses 671,469,078$
General Fund 35,031,128$ General Fund - Personnel Services N/A
- -$ General Fund - Operating Expenses N/A
Revenue 35,031,128$ Grant Fund - Personnel Services N/A
Grant Fund - Operating Expenses N/A
Total Expenditures N/A
Atlanta-Fulton County Public Libraries Revenues by Source,
FY 2008 Final Budget
Source: 2008 Fiscal Year Final Budget, page 2 of PDF
(http://www.fultoncountyga.gov/images/stories/Finance/FY2008%20Final%20Bu
dget2.pdf) *Note: Published Fulton County Budget Report for fiscal years 2008 through 2011
were searched and the library expenditure data for 2008 is not present. No
information was provided by the Atlanta-Fulton Public Library System after several
attempts to request financial information from the Central Library's Branch Group
Manager, Anne Haimes.
Source: 2008 Fiscal Year Final Budget, page 2 of PDF
(http://www.fultoncountyga.gov/images/stories/Finance/FY2008%20Final%20Bu
dget2.pdf)
Atlanta-Fulton County Public Libraries Expenditures,
FY 2008 Final* Budget
Appendix F- Detailed Source Tables Page F-12
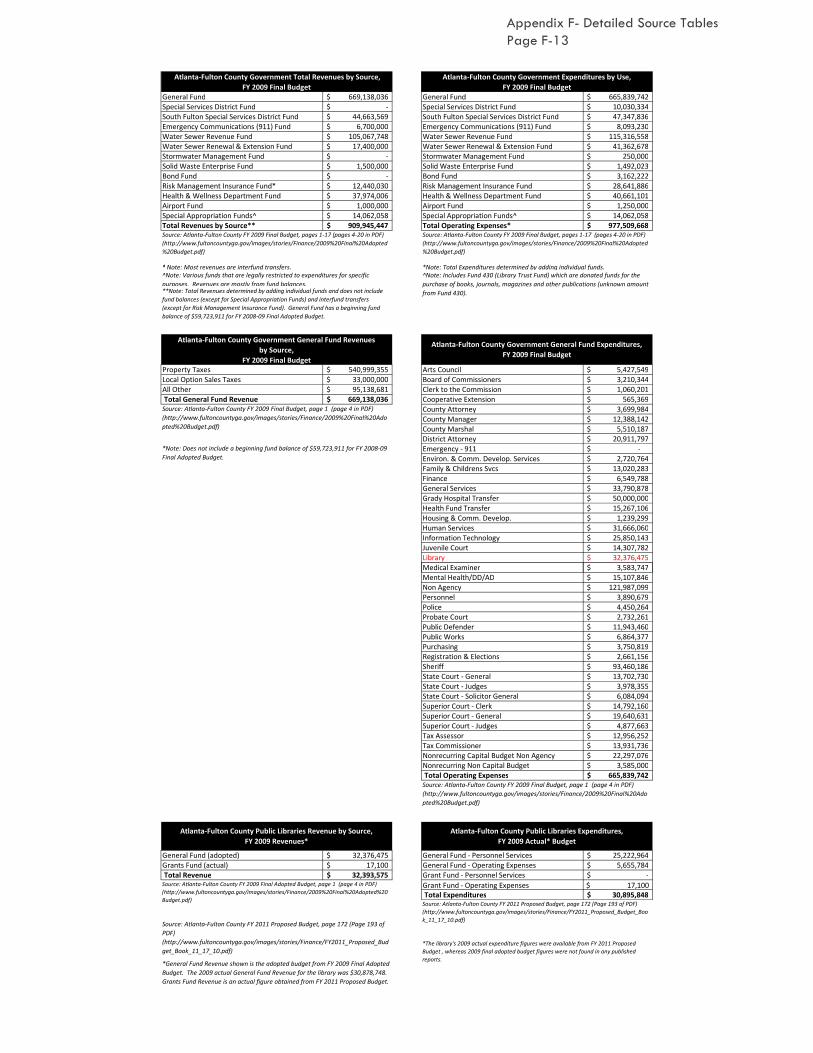
General Fund 669,138,036$ General Fund 665,839,742$
Special Services District Fund -$ Special Services District Fund 10,030,334$
South Fulton Special Services District Fund 44,663,569$ South Fulton Special Services District Fund 47,347,836$
Emergency Communications (911) Fund 6,700,000$ Emergency Communications (911) Fund 8,093,230$
Water Sewer Revenue Fund 105,067,748$ Water Sewer Revenue Fund 115,316,558$
Water Sewer Renewal & Extension Fund 17,400,000$ Water Sewer Renewal & Extension Fund 41,362,678$
Stormwater Management Fund -$ Stormwater Management Fund 250,000$
Solid Waste Enterprise Fund 1,500,000$ Solid Waste Enterprise Fund 1,492,023$
Bond Fund -$ Bond Fund 3,162,222$
Risk Management Insurance Fund* 12,440,030$ Risk Management Insurance Fund 28,641,886$
Health & Wellness Department Fund 37,974,006$ Health & Wellness Department Fund 40,661,101$
Airport Fund 1,000,000$ Airport Fund 1,250,000$
Special Appropriation Funds^ 14,062,058$ Special Appropriation Funds^ 14,062,058$
Total Revenues by Source** 909,945,447$ Total Operating Expenses* 977,509,668$
*Note: Most revenues are interfund transfers.
Property Taxes 540,999,355$ Arts Council 5,427,549$
Local Option Sales Taxes 33,000,000$ Board of Commissioners 3,210,344$
All Other 95,138,681$ Clerk to the Commission 1,060,201$
Total General Fund Revenue 669,138,036$ Cooperative Extension 565,369$
County Attorney 3,699,984$
County Manager 12,388,142$
County Marshal 5,510,187$
District Attorney 20,911,797$
Emergency - 911 -$
Environ. & Comm. Develop. Services 2,720,764$
Family & Childrens Svcs 13,020,283$
Finance 6,549,788$
General Services 33,790,878$
Grady Hospital Transfer 50,000,000$
Health Fund Transfer 15,267,106$
Housing & Comm. Develop. 1,239,299$
Human Services 31,666,060$
Information Technology 25,850,143$
Juvenile Court 14,307,782$
Library 32,376,475$
Medical Examiner 3,583,747$
Source: Atlanta-Fulton County FY 2009 Final Budget, page 1 (page 4 in PDF)
(http://www.fultoncountyga.gov/images/stories/Finance/2009%20Final%20Ado
pted%20Budget.pdf)
Source: Atlanta-Fulton County FY 2009 Final Budget, pages 1-17 (pages 4-20 in PDF)
(http://www.fultoncountyga.gov/images/stories/Finance/2009%20Final%20Adopted
%20Budget.pdf)
Source: Atlanta-Fulton County FY 2009 Final Budget, pages 1-17 (pages 4-20 in PDF)
(http://www.fultoncountyga.gov/images/stories/Finance/2009%20Final%20Adopted
%20Budget.pdf)
*Note: Does not include a beginning fund balance of $59,723,911 for FY 2008-09
Final Adopted Budget.
Atlanta-Fulton County Government Total Revenues by Source,
FY 2009 Final Budget
Atlanta-Fulton County Government Expenditures by Use,
FY 2009 Final Budget
^Note: Various funds that are legally restricted to expenditures for specific
purposes. Revenues are mostly from fund balances.
*Note: Total Expenditures determined by adding individual funds.
Atlanta-Fulton County Government General Fund Expenditures,
FY 2009 Final Budget
Atlanta-Fulton County Government General Fund Revenues
by Source,
FY 2009 Final Budget
**Note: Total Revenues determined by adding individual funds and does not include
fund balances (except for Special Appropriation Funds) and interfund transfers
(except for Risk Management Insurance Fund). General Fund has a beginning fund
balance of $59,723,911 for FY 2008-09 Final Adopted Budget.
^Note: Includes Fund 430 (Library Trust Fund) which are donated funds for the
purchase of books, journals, magazines and other publications (unknown amount
from Fund 430).
Medical Examiner 3,583,747$
Mental Health/DD/AD 15,107,846$
Non Agency 121,987,099$
Personnel 3,890,679$
Police 4,450,264$
Probate Court 2,732,261$
Public Defender 11,943,460$
Public Works 6,864,377$
Purchasing 3,750,819$
Registration & Elections 2,661,156$
Sheriff 93,460,186$
State Court - General 13,702,730$
State Court - Judges 3,978,355$
State Court - Solicitor General 6,084,094$
Superior Court - Clerk 14,792,160$
Superior Court - General 19,640,631$
Superior Court - Judges 4,877,663$
Tax Assessor 12,956,252$
Tax Commissioner 13,931,736$
Nonrecurring Capital Budget Non Agency 22,297,076$
Nonrecurring Non Capital Budget 3,585,000$
Total Operating Expenses 665,839,742$
General Fund (adopted) 32,376,475$ General Fund - Personnel Services 25,222,964$
Grants Fund (actual) 17,100$ General Fund - Operating Expenses 5,655,784$
Total Revenue 32,393,575$ Grant Fund - Personnel Services -$
Grant Fund - Operating Expenses $ 17,100
Total Expenditures 30,895,848$
Atlanta-Fulton County Public Libraries Revenue by Source,
FY 2009 Revenues*
Atlanta-Fulton County Public Libraries Expenditures,
FY 2009 Actual* Budget
Source: Atlanta-Fulton County FY 2009 Final Budget, page 1 (page 4 in PDF)
(http://www.fultoncountyga.gov/images/stories/Finance/2009%20Final%20Ado
pted%20Budget.pdf)
Source: Atlanta-Fulton County FY 2009 Final Adopted Budget, page 1 (page 4 in PDF)
(http://www.fultoncountyga.gov/images/stories/Finance/2009%20Final%20Adopted%20
Budget.pdf)
Source: Atlanta-Fulton County FY 2011 Proposed Budget, page 172 (Page 193 of
PDF)
(http://www.fultoncountyga.gov/images/stories/Finance/FY2011_Proposed_Bud
get_Book_11_17_10.pdf)
*General Fund Revenue shown is the adopted budget from FY 2009 Final Adopted
Budget. The 2009 actual General Fund Revenue for the library was $30,878,748.
Grants Fund Revenue is an actual figure obtained from FY 2011 Proposed Budget.
Source: Atlanta-Fulton County FY 2011 Proposed Budget, page 172 (Page 193 of PDF)
(http://www.fultoncountyga.gov/images/stories/Finance/FY2011_Proposed_Budget_Boo
k_11_17_10.pdf)
*The library's 2009 actual expenditure figures were available from FY 2011 Proposed
Budget , whereas 2009 final adopted budget figures were not found in any published
reports.
Appendix F- Detailed Source Tables Page F-13

General Fund 561,444,533$ General Fund $ 588,501,410
Special Services District Fund -$ Special Services District Fund 10,340,334$
South Fulton Special Services District Fund 40,809,602$ South Fulton Special Services District Fund 41,938,315$
Emergency Communications (911) Fund 3,060,000$ Emergency Communications (911) Fund 7,159,919$
Water Sewer Revenue Fund 112,100,000$ Water Sewer Revenue Fund 134,963,955$
Water Sewer Renewal & Extension Fund 29,200,000$ Water Sewer Renewal & Extension Fund 37,298,695$
Stormwater Management Fund -$ Stormwater Management Fund 250,000$
Solid Waste Enterprise Fund 2,100,000$ Solid Waste Enterprise Fund 1,502,480$
Bond Fund -$ Bond Fund -$
Risk Management Insurance Fund* 12,122,000$ Risk Management Insurance Fund 26,550,872$
Health & Wellness Department Fund 34,755,660$ Health & Wellness Department Fund 38,085,133$
Airport Fund 1,100,000$ Airport Fund 1,175,645$
Special Appropriation Funds^ 18,299,648$ Special Appropriation Funds^ 17,822,226$
Total Revenues by Source** 814,991,443$ Total Operating Expenses* 887,766,758$
* Note: Most revenues are interfund transfers.
Property Taxes 441,847,588$ Arts Council 4,517,801$
Local Option Sales Tax 32,000,000$ Behavioral Health 14,778,408$
All Other 75,957,264$ Board of Commissioners 3,165,699$
Non recurring reallocation of Prior Year Grants 2,500,000$ Clerk to the Commission 1,048,885$
Non recurring transfer of GO Bond & Capital 9,139,681$ Cooperative Extension 570,623$
Total General Fund Revenue 561,444,533$ County Attorney 3,705,424$
County Manager 10,806,989$
County Marshal 5,464,134$
District Attorney 21,266,871$
Environ. & Comm. Develop. Services 1,243,360$
Family & Children Svcs 7,853,205$
Finance 5,895,861$
General Services 31,162,811$
Grady Hospital Transfer 55,000,000$
Health Fund Transfer 13,932,269$
Housing & Comm. Develop. 1,017,477$
Human Services 29,015,974$
Health & Human Services 7,117,849$
Atlanta-Fulton County Government Total Revenues by Source,
FY2010 Final Adopted Budget
Atlanta-Fulton County Government Expenditures by Use,
FY2010 Final Adopted Budget
Atlanta-Fulton County Government General Fund Expenditures,
FY 2010 Final Adopted Budget
Atlanta-Fulton County Government General Fund Revenues
by Source,
FY 2010 Final Adopted Budget
**Note: Total Revenues determined by adding individual funds and does not
include fund balances (except for Special Appropriation Funds) and interfund
transfers (except for Risk Management Insurance Fund). General Fund has a
beginning fund balance of $68,873,580 for FY 2009-10 Final Adopted Budget.
^Note: Various funds that are legally restricted to expenditures for specific
purposes. Revenues are mostly from fund balances.
*Note: Total Expenditures determined by adding individual funds.
*Note: Does not include a beginning fund balance of $68,873,580 for FY 2009-10
Final Adopted Budget.
Source: Atlanta-Fulton County FY 2010 Final Adopted Budget, pages 1-12 of PDF
(http://www.fultoncountyga.gov/images/stories/FY10_final_adopted_budget1-
20.pdf)
^Note: Includes Fund 430 (Library Trust Fund) which are donated funds for the
purchase of books, journals, magazines and other publications (unknown amount
from Fund 430).
Source: Atlanta-Fulton County FY 2010 Final Adopted Budget, pages 1-12 of PDF
(http://www.fultoncountyga.gov/images/stories/FY10_final_adopted_budget1-
20.pdf)
Source: Atlanta-Fulton County FY 2010 Final Adopted Budget, page 1 of PDF
(http://www.fultoncountyga.gov/images/stories/FY10_final_adopted_budget1-
20.pdf)
Health & Human Services 7,117,849$
Information Technology 23,492,678$
Juvenile Court 14,461,673$
Library 31,478,876$
Medical Examiner 3,457,457$
Non Agency 70,433,463$
Personnel 3,664,259$
Police 4,156,757$
Probate Court 2,618,425$
Public Defender 11,781,338$
Public Works 6,277,441$
Purchasing 3,643,507$
Registration & Elections 10,711,887$
Sheriff 95,018,176$
State Court - General 14,293,140$
State Court - Judges 4,182,867$
State Court - Solicitor General 6,010,063$
Superior Court - Clerk 14,816,769$
Superior Court - General 19,219,858$
Superior Court - Judges 5,124,095$
Tax Assessor 11,931,997$
Tax Commissioner 14,163,045$
Total Operating Expenses* 588,501,411$
General Fund 31,478,876$ General Fund - Personnel Services 26,709,140$
Grants Fund 25,000$ General Fund - Operating Expenses 4,769,736$
Total Revenue 31,503,876$ Grant Fund - Personnel Services -$
Grant Fund - Operating Expenses $ 25,000
Total Expenditures 31,503,876$
*Note: This does not match the amount listed as General Fund expenditures in
above table. Operating Expense total was reached using Excel formula but is
$1.00 off document's total (and $1.00 error cannot be located).
Source: Atlanta-Fulton County FY 2011 Proposed Budget, page 172 (page 193 of
PDF)
(http://www.fultoncountyga.gov/images/stories/Finance/FY2011_Proposed_Bud
get_Book_11_17_10.pdf)Source: Atlanta-Fulton County FY 2011 Proposed Budget, page 172 (page 193 of
PDF)
(http://www.fultoncountyga.gov/images/stories/Finance/FY2011_Proposed_Bud
get_Book_11_17_10.pdf)
Atlanta-Fulton County Public Libraries Expenditures,
FY 2010 Adopted Budget
Atlanta-Fulton County Public Libraries Revenues by Source,
FY 2010 Adopted Budget
Source: Atlanta-Fulton County FY 2010 Final Adopted Budget, page 1 of PDF
(http://www.fultoncountyga.gov/images/stories/FY10_final_adopted_budget1-
20.pdf)
Appendix F- Detailed Source Tables Page F-14

General Fund 493,764,298$ General Fund 594,968,519$
Special Services District Fund -$ Special Services District Fund 4,968,484$
South Fulton Special Services District Fund 35,908,467$ South Fulton Special Services District Fund 44,189,676$
Emergency Communications (911) Fund 4,750,000$ Emergency Communications (911) Fund 6,973,727$
Water Sewer Revenue Fund 117,461,500$ Water Sewer Revenue Fund 123,704,158$
Water Sewer Renewal & Extension Fund 12,700,000$ Water Sewer Renewal & Extension Fund 31,267,475$
Stormwater Management Fund -$ Stormwater Management Fund 250,000$
Solid Waste Enterprise Fund 1,050,000$ Solid Waste Enterprise Fund 1,504,132$
Bond Fund 13,100,000$ Bond Fund 13,064,924$
Risk Management Insurance Fund* 11,186,152$ Risk Management Insurance Fund 24,456,167$
Health & Wellness Dept. Fund 39,805,392$ Health & Wellness Dept. Fund 39,805,392$
Airport Fund 1,100,000$ Airport Fund 1,246,151$
Special Appropriation Funds^ 11,961,820$ Special Appropriation Funds^ 5,878,449$
Total Revenues by Source** 742,787,629$ Total Operating Expenses* 892,277,254$
*Note: Most revenues are interfund transfers.
Property Taxes 385,007,772$ Arts Council 4,587,774$
Local Options Sales Taxes 34,833,378$ Behavioral Health 15,061,335$
All Other 73,923,148$ Board of Commissioners 3,229,806$
Total General Fund Revenue* 493,764,298$ Clerk to the Commission 1,032,038$
Cooperative Extension 574,509$
County Attorney 3,707,583$
County Manager 11,242,843$
County Marshal 5,728,544$
District Attorney 21,206,014$
Environ. & Comm. Develop. Services 2,749,435$
Family & Children Services 6,784,707$
Finance 5,820,137$
General Services 31,361,150$
Grady Hospital Transfer 57,900,000$
Health Fund Transfer 14,026,377$
Housing & Comm. Develop. 1,010,987$
Human Services 29,495,295$
Health & Human Services 6,606,854$
Information Technology 24,059,723$
Juvenile Court 14,009,511$
Library 31,515,774$
Medical Examiner 3,678,604$
Non Agency 73,067,039$
Personnel 3,633,348$
Police 4,198,993$
Probate Court 2,584,050$
Public Defender 12,674,455$
Public Works 6,289,502$
Purchasing 3,622,001$
Registration & Elections 2,711,031$
Sheriff 97,556,314$
State Court- General 13,806,241$
State Court- Judges 4,203,271$
State Court- Solicitor General 5,863,244$
Superior Court- Clerk 15,930,363$
Superior Court- General 20,083,127$
Superior Court- Judges 5,124,299$
Tax Assessor 13,630,612$
Tax Commissioner 14,601,630$
Total Operating Expenses 594,968,520$
General Fund 31,515,784$ General Fund - Personnel Services 26,986,621$
Grants Fund -$ General Fund - Operating Expenses 4,529,163$
Total Revenue* 31,515,784$ Grant Fund - Personnel Services -$
Grant Fund - Operating Expenses -$
Total Expenditures 31,515,784$
Source: Atlanta-Fulton County FY2011 Final Adopted Budget, pages 4-21 of PDF
(http://www.fultoncountyga.gov/images/stories/communications/FY2011_Final_Ad
opted_Budget_for_Website.pdf)
*Note: Does not include a beginning fund balance of $156,831,462 for FY 2011 Final
Adopted Budget.
Atlanta-Fulton County Government Total Revenues by Source,
FY 2011 Final Adopted Budget
Atlanta-Fulton County Government Expenditures by Use,
FY 2011 Final Adopted Budget
*Note: Total Expenditures determined by adding individual funds.
^Note: Various funds that are legally restricted to expenditures for specific purposes.
Revenues are mostly from fund balances.
Atlanta-Fulton County Government General Fund Revenue
by Source,
FY 2011 Final Adopted Budget
Atlanta-Fulton County Government General Fund Expenditures,
FY 2011 Final Adopted Budget
Source: Atlanta-Fulton County FY2011 Final Adopted Budget, pages 4-21 of PDF
(http://www.fultoncountyga.gov/images/stories/communications/FY2011_Final_Ad
opted_Budget_for_Website.pdf)
**Note: Total Revenues determined by adding individual funds and does not include
fund balances (except for Special Appropriation Funds) and interfund transfers
(except for Risk Management Insurance Fund). General Fund has a beginning fund
balance of $156,831,462 for FY 2011 Final Adopted Budget.
Source: Atlanta-Fulton County FY2011 Final Adopted Budget, pages 4-21 of PDF
(http://www.fultoncountyga.gov/images/stories/communications/FY2011_Final_Ad
opted_Budget_for_Website.pdf)
^Note: Includes Fund 430 (Library Trust Fund) which are donated funds for the
purchase of books, journals, magazines and other publications (unknown amount
from Fund 430). For FY 2011 Adopted Budget, the fund's use of fund balance was
$513,161 and anticipated expenditures was $513,161.
*Note: This amount is $10 more than the figure reported on page 3 of the Fulton
County's FY 2011 Final Adopted Budget.
Source: Atlanta-Fulton County FY2011 Final Adopted Budget, pages 4-21 of PDF
(http://www.fultoncountyga.gov/images/stories/communications/FY2011_Final_Ad
opted_Budget_for_Website.pdf)
Atlanta-Fulton County Public Libraries Revenue by Source,
FY 2011 Proposed Budget
Atlanta-Fulton County Public Libraries Expenditures,
FY 2011 Proposed Budget
Source: Atlanta-Fulton County FY2011 Proposed Budget, page 172 (page 193 of PDF)
(http://www.fultoncountyga.gov/images/stories/Finance/FY2011_Proposed_Budget
_Book_11_17_10.pdf) Source: Atlanta-Fulton County FY2011 Proposed Budget, page 172 (page 193 of PDF)
(http://www.fultoncountyga.gov/images/stories/Finance/FY2011_Proposed_Budget
_Book_11_17_10.pdf)
Appendix F- Detailed Source Tables Page F-15

General Fund 520,426,146$ General Fund 598,154,051$ Special Services District Fund ‐$ Special Services District Fund 4,968,705$ South Fulton Special Services District Fund 38,716,242$ South Fulton Special Services District Fund 43,382,837$ Emergency Communications (911) Fund 4,048,696$ Emergency Communications (911) Fund 4,475,198$ Water Sewer Revenue Fund 118,760,000$ Water Sewer Revenue Fund 138,481,683$ Water Sewer Renewal & Extension Fund 39,320,000$ Water Sewer Renewal & Extension Fund 26,188,164$ Stormwater Management Fund ‐$ Stormwater Management Fund 250,000$ Bond Fund 11,211,161$ Bond Fund 11,211,161$ Risk Management Insurance Fund* 9,069,605$ Risk Management Insurance Fund 21,701,138$ Health & Wellness Dept. Fund 39,018,067$ Health & Wellness Dept. Fund 39,018,067$ Airport Fund 1,150,000$ Airport Fund 1,279,235$ Special Appropriation Funds^ 5,617,582$ Special Appropriation Funds^ 5,549,143$ Total Revenues by Source** 787,337,499$ Total Operating Expenses* 894,659,382$
*Note: Most revenues are interfund transfers.
Property Taxes 408,183,497$ Arts Council 4,862,023$ Local Options Sales Taxes 34,833,378$ Behavioral Health 14,042,958$ All Other 77,409,271$ Board of Commissioners 3,353,098$ Total General Fund Revenue* 520,426,146$ Clerk to the Commission 960,495$
Cooperative Extension 536,045$ County Attorney 3,550,441$ County Manager 11,502,648$ County Marshal 5,975,910$ District Attorney 22,020,651$ Emergency‐911 1,933,799$ Environ. & Comm. Develop. Services ‐$ Family & Children Services 5,548,962$ Finance 5,658,485$ General Services 35,845,939$ Grady Hospital Transfer 68,559,532$ Health Fund Transfer 15,109,679$ Housing & Comm. Develop. 1,014,874$ Human Services 27,524,055$ Health & Human Services 1,945,080$ Information Technology 23,285,711$ Juvenile Court 13,982,508$ Library 30,008,898$ Medical Examiner 3,784,793$ Non Agency 66,386,196$ Personnel 3,828,371$ Planning & Community Services 2,238,913$ Police 3,894,719$ Probate Court 2,812,237$ Public Defender 13,067,023$ Public Works ‐$ Purchasing 3,489,699$ Registration & Elections 8,971,667$ Sheriff 97,095,638$ State Court‐ General 13,851,941$ State Court‐ Judges 4,438,058$ State Court‐ Solicitor General 6,314,762$ Superior Court‐ Clerk 16,582,852$ Superior Court‐ General 20,517,297$ Superior Court‐ Judges 5,320,092$ Tax Assessor 13,516,286$ Tax Commissioner 14,821,716$ Total Operating Expenses 598,154,051$
General Fund 30,008,898$ General Fund ‐ Personnel Services 25,677,200$ Grants Fund ‐$ General Fund ‐ Operating Expenses 4,294,499$ Total Revenue* 30,008,898$ Grant Fund ‐ Personnel Services ‐$
Grant Fund ‐ Operating Expenses ‐$ Total Expenditures 29,971,699$
Source: Atlanta‐Fulton County FY 2012 Tentative Budget, page 9 of PDF
(http://www.co.fulton.ga.us/images/stories/Tentative_Budget_document_‐
_12_19_11.pdf)
Atlanta‐Fulton County Government General Fund Revenue
by Source,
FY 2012 Tentative Budget
Atlanta‐Fulton County Government General Fund Expenditures,
FY 2012 Tentative Budget
Source: Atlanta‐Fulton County FY 2012 Tentative Budget, page 9 of PDF
(http://www.co.fulton.ga.us/images/stories/Tentative_Budget_document_‐
_12_19_11.pdf)
*Note: Does not include a beginning fund balance of $119,695,678 for FY 2012
Tentative Budget.
Atlanta‐Fulton County Public Libraries Revenue by Source,
FY 2012 Tentative Budget
Atlanta‐Fulton County Public Libraries Expenditures,
FY 2012 Proposed Budget
Source: Atlanta‐Fulton County FY 2012 Proposed Budget, page 200‐204 (page 218‐
222 of PDF)
(http://www.co.fulton.ga.us/images/stories/FY2012_Proposed_Budget.pdf)
*Note: Total expenditures do not match Total Revenue due to a $37,199 General
Fund increase between the Proposed and Tentative Budgets.
^Note: Various funds that are legally restricted to expenditures for specific purposes.
Revenues are mostly from fund balances.
^Note: Includes Fund 430 (Library Trust Fund) which are donated funds for the
purchase of books, journals, magazines and other publications (unknown amount
from Fund 430). For FY 2011 Adopted Budget, the fund's use of fund balance was
$1,320 and anticipated expenditures was $1,320.**Note: Total Revenues determined by adding individual funds and does not include
fund balances (except for Special Appropriation Funds) and interfund transfers
(except for Risk Management Insurance Fund). General Fund has a beginning fund
balance of $119,695,678 for FY 2012 Tentative Budget.
Source: Atlanta‐Fulton County FY 2012 Tentative Budget, page 9 of PDF
(http://www.co.fulton.ga.us/images/stories/Tentative_Budget_document_‐
_12_19_11.pdf)
Atlanta‐Fulton County Government Total Revenues by Source,
FY 2012 Tentative Budget
Atlanta‐Fulton County Government Expenditures by Use,
FY 2012 Tentative Budget
Source: Atlanta‐Fulton County FY 2012 Tentative Budget, page 9 ‐22 of PDF
(http://www.co.fulton.ga.us/images/stories/Tentative_Budget_document_‐
_12_19_11.pdf)
Source: Atlanta‐Fulton County FY 2012 Tentative Budget, page 9 ‐22 of PDF
(http://www.co.fulton.ga.us/images/stories/Tentative_Budget_document_‐
_12_19_11.pdf)
*Note: Total Expenditures determined by adding individual funds.
Appendix F- Detailed Source Tables Page F-16
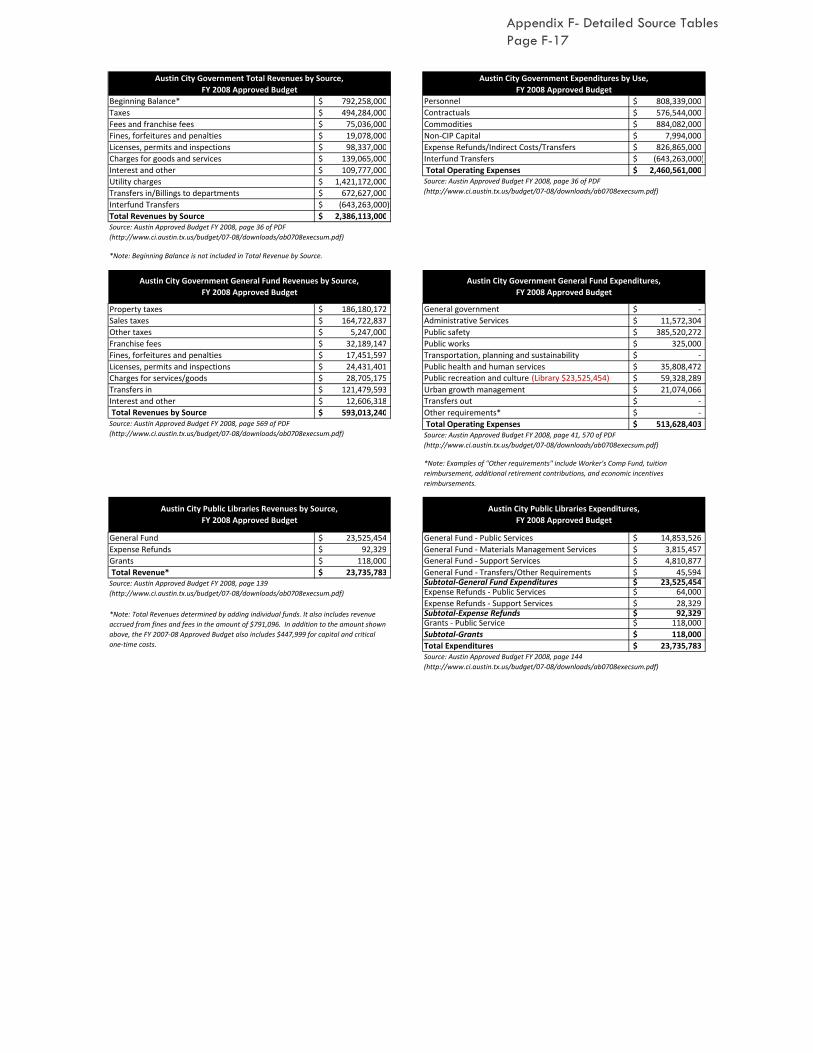
Beginning Balance* 792,258,000$ Personnel 808,339,000$
Taxes 494,284,000$ Contractuals 576,544,000$
Fees and franchise fees 75,036,000$ Commodities 884,082,000$
Fines, forfeitures and penalties 19,078,000$ Non-CIP Capital 7,994,000$
Licenses, permits and inspections 98,337,000$ Expense Refunds/Indirect Costs/Transfers 826,865,000$
Charges for goods and services 139,065,000$ Interfund Transfers (643,263,000)$
Interest and other 109,777,000$ Total Operating Expenses 2,460,561,000$
Utility charges 1,421,172,000$
Transfers in/Billings to departments 672,627,000$
Interfund Transfers (643,263,000)$
Total Revenues by Source 2,386,113,000$
Property taxes 186,180,172$ General government -$
Sales taxes 164,722,837$ Administrative Services 11,572,304$
Other taxes 5,247,000$ Public safety 385,520,272$
Franchise fees 32,189,147$ Public works 325,000$
Fines, forfeitures and penalties 17,451,597$ Transportation, planning and sustainability -$
Licenses, permits and inspections 24,431,401$ Public health and human services 35,808,472$
Charges for services/goods 28,705,175$ Public recreation and culture (Library $23,525,454) 59,328,289$
Transfers in 121,479,593$ Urban growth management 21,074,066$
Interest and other 12,606,318$ Transfers out -$
Total Revenues by Source 593,013,240$ Other requirements* -$
Total Operating Expenses 513,628,403$
General Fund 23,525,454$ General Fund - Public Services 14,853,526$
Expense Refunds 92,329$ General Fund - Materials Management Services 3,815,457$
Grants 118,000$ General Fund - Support Services 4,810,877$
Total Revenue* 23,735,783$ General Fund - Transfers/Other Requirements 45,594$ Subtotal-General Fund Expenditures 23,525,454$ Expense Refunds - Public Services 64,000$
Expense Refunds - Support Services 28,329$ Subtotal-Expense Refunds 92,329$ Grants - Public Service 118,000$
Subtotal-Grants 118,000$
Total Expenditures 23,735,783$
Austin City Public Libraries Revenues by Source,
FY 2008 Approved Budget
Austin City Public Libraries Expenditures,
FY 2008 Approved Budget
Source: Austin Approved Budget FY 2008, page 139
(http://www.ci.austin.tx.us/budget/07-08/downloads/ab0708execsum.pdf)
*Note: Total Revenues determined by adding individual funds. It also includes revenue
accrued from fines and fees in the amount of $791,096. In addition to the amount shown
above, the FY 2007-08 Approved Budget also includes $447,999 for capital and critical
one-time costs.
Source: Austin Approved Budget FY 2008, page 144
(http://www.ci.austin.tx.us/budget/07-08/downloads/ab0708execsum.pdf)
Austin City Government Total Revenues by Source,
FY 2008 Approved Budget
Austin City Government Expenditures by Use,
FY 2008 Approved Budget
Source: Austin Approved Budget FY 2008, page 36 of PDF
(http://www.ci.austin.tx.us/budget/07-08/downloads/ab0708execsum.pdf)
Source: Austin Approved Budget FY 2008, page 569 of PDF
(http://www.ci.austin.tx.us/budget/07-08/downloads/ab0708execsum.pdf)
*Note: Beginning Balance is not included in Total Revenue by Source.
Austin City Government General Fund Revenues by Source,
FY 2008 Approved Budget
Austin City Government General Fund Expenditures,
FY 2008 Approved Budget
*Note: Examples of "Other requirements" include Worker's Comp Fund, tuition
reimbursement, additional retirement contributions, and economic incentives
reimbursements.
Source: Austin Approved Budget FY 2008, page 36 of PDF
(http://www.ci.austin.tx.us/budget/07-08/downloads/ab0708execsum.pdf)
Source: Austin Approved Budget FY 2008, page 41, 570 of PDF
(http://www.ci.austin.tx.us/budget/07-08/downloads/ab0708execsum.pdf)
Appendix F- Detailed Source Tables Page F-17

Beginning Balance* 870,261,000$ Personnel 854,526,000$
Taxes 526,697,000$ Contractuals 627,378,000$
Fees and franchise fees 82,042,000$ Commodities 1,082,831,000$
Fines, forfeitures and penalties 23,149,000$ Non-CIP Capital 10,283,000$
Licenses, permits and inspections 105,710,000$ Expense Refunds/Indirect Costs/Transfers 879,919,000$
Charges for goods and services 154,017,000$ Interfund Transfers (685,823,000)$
Interest and other 122,385,000$ Total Operating Expenses 2,769,114,000$
Utility charges 1,593,734,000$
Transfers in/Billings to departments 710,162,000$
Interfund Transfers (685,823,000)$
Total Revenues by Source 2,632,073,000$
Property taxes 209,362,065$ General government -$
Sales taxes 160,847,722$ Administrative Services 11,865,182$
Other taxes 6,085,000$ Public safety 405,279,865$
Franchise fees 33,833,691$ Public works 325,000$
Fines, forfeitures and penalties 18,900,992$ Transportation, planning and sustainability -$
Licenses, permits and inspections 24,471,251$ Public health and human services 39,823,218$
Charges for services/goods 33,287,029$ Public recreation and culture (Library $24,907,897) 60,712,505$
Transfers in 122,704,690$ Urban growth management 21,502,303$
Interest and other 11,539,290$ Transfers out -$
Total Revenues by Source 621,031,730$ Other requirements* -$
Total Operating Expenses 539,508,073$
General Fund 24,907,897$ General Fund - Public Services 14,925,702$
Expense Refunds 92,329$ General Fund - Materials Management Services 4,277,566$
Grants 303,000$ General Fund - Support Services 5,682,156$
Total Revenue* 25,303,226$ General Fund - Transfers/Other Requirements 22,473$
Subtotal-General Fund Expenditures 24,907,897$
Expense Refunds - Public Services 64,000$
Expense Refunds - Support Services 28,329$
Subtotal-Expense Refunds 92,329$
Grants - Public Service 303,000$
Subtotal-Grants 303,000$
Total Expenditures 25,303,226$
Austin City Government Total Revenues by Source,
FY 2009 Approved Budget
Austin City Government Expenditures by Use,
FY 2009 Approved Budget
Source: Austin Approved Budget FY 2009, p. 28 (page 76 of PDF)
(http://www.ci.austin.tx.us/budget/08-09/downloads/Executive_FINAL_reduced.pdf)
Austin City Government General Fund Revenues by Source,
FY 2009 Approved Budget
Austin City Government General Fund Expenditures,
FY 2009 Approved Budget
*Note: Beginning Balance is not included in Total Revenue by Source.
Source: Austin Approved Budget FY 2009, p. 28 (page 76 of PDF)
(http://www.ci.austin.tx.us/budget/08-09/downloads/Executive_FINAL_reduced.pdf)
Source: Austin Approved Budget FY 2009, p. 32 (page 82 of PDF)
(http://www.ci.austin.tx.us/budget/08-09/downloads/Executive_FINAL_reduced.pdf)
Austin City Public Libraries Revenues by Source,
FY 2009 Approved Budget
Austin City Public Libraries Expenditures,
FY 2009 Approved Budget
Source: Austin Approved Budget FY 2009, p. 134 (page 200 of PDF)
(http://www.ci.austin.tx.us/budget/08-09/downloads/Executive_FINAL_reduced.pdf)
Source: Austin Approved Budget FY 2009, p. 31 (page 81 of PDF)
(http://www.ci.austin.tx.us/budget/08-09/downloads/Executive_FINAL_reduced.pdf)
Source: Austin Approved Budget FY 2009, p. 123 (page 189 of PDF)
(http://www.ci.austin.tx.us/budget/08-09/downloads/Executive_FINAL_reduced.pdf)
*Note: Examples of "Other requirements" include Worker's Comp Fund, tuition
reimbursement, additional retirement contributions, and economic incentives
reimbursements.
*Note: Total Revenues determined by adding individual funds. It also includes revenue
accrued from fines and fees in the amount of $729,238. In addition to the amount shown
above, the FY 2008-09 Approved Budget also includes $3,180 for capital and critical one-
time costs.
Appendix F- Detailed Source Tables Page F-18

Beginning Balance* 702,011,000$ Personnel 857,767,000$
Taxes 521,694,000$ Contractuals 651,291,000$
Fees & Franchise Fees 93,381,000$ Commodities 1,083,695,000$
Fines, forfeitures and penalties 23,062,000$ Non-CIP Capital 7,245,000$
Licenses, permits and inspections 106,334,000$ Expense Refunds/Indirect Costs/Transfers 787,161,000$
Charges for services/goods 152,401,000$ Interfund Transfers (640,054,000)$
Interest and other 87,009,000$ Total Expenditures by Use 2,747,105,000$
Utility Charges 1,611,024,000$
Transfers in/Billings to Departments 686,246,000$
Interfund Transfers (640,054,000)$
Total Revenues by Source 2,641,097,000$
Property taxes 233,116,385$ General government -$
Sales taxes 132,050,582$ Administrative Services 11,921,460$
Other taxes 5,971,000$ Public safety 404,384,374$
Franchise fees 34,082,500$ Public works 350,000$
Fines, forfeitures and penalties 18,998,753$ Transportation, planning and sustainability -$
Licenses, permits and inspections 18,028,050$ Public health and human services 38,901,266$
Charges for services/goods 36,590,390$ Public recreation and culture (Library $24,394,878) 61,045,726$
Transfers in 131,167,464$ Urban growth management 19,601,404$
Interest and other 4,909,709$ Transfers out (Interfund Transfers) -$
Total Revenues by Source 614,914,833$ Other requirements* -$
Total Operating Expenses 536,204,230$
General Fund 24,394,878$ General Fund - Public Services 14,467,098$
Expense Refunds 92,329$ General Fund - Materials Management Services 4,365,102$
Grants 557,000$ General Fund - Support Services 5,539,900$
Total Revenue* 25,044,207$ General Fund - Transfers/Other Requirements 22,778$
Subtotal-General Fund Expenditures 24,394,878$
Expense Refunds - Public Services 64,000$
Expense Refunds - Support Services 28,329$
Subtotal-Expense Refunds 92,329$
Grants - Public Service 557,000$
Subtotal-Grants 557,000$
Total Expenditures 25,044,207$
Source: Austin FY 2010 Approved Budget , page 125 (page 193 of PDF)
(http://www.ci.austin.tx.us/budget/09-10/downloads/Exe%20Final%20Draft.pdf)
Austin City Public Libraries Revenues by Source,
FY 2010 Approved Budget
Source: Austin FY 2010 Approved Budget , page 32 (page 86 of PDF)
(http://www.ci.austin.tx.us/budget/09-10/downloads/Exe%20Final%20Draft.pdf)
Source: Austin FY 2010 Approved Budget , page 118 (page 186 of PDF)
(http://www.ci.austin.tx.us/budget/09-10/downloads/Exe%20Final%20Draft.pdf)
Austin City Public Libraries Expenditures,
FY 2010 Approved Budget
Source: Austin FY 2010 Approved Budget , page 33 (page 87 of PDF)
(http://www.ci.austin.tx.us/budget/09-10/downloads/Exe%20Final%20Draft.pdf)
*Note: Examples of "Other requirements" include Worker's Comp Fund, tuition
reimbursement, additional retirement contributions, and economic incentives
reimbursements.
*Note: Total Revenues determined by adding individual funds. It also includes revenue
accrued from fines and fees in the amount of $574,700. In addition to the amount
shown above, the FY 2009-10 Approved Budget also includes $148,000 for capital and
critical one-time costs.
Austin City Government Total Revenues by Source,
FY 2010 Approved Budget
Austin City Government Expenditures by Use,
FY 2010 Approved Budget
Austin City Government General Fund Revenues by Source,
FY 2010 Approved Budget
Austin City Government General Fund Expenditures,
FY 2010 Approved Budget
*Note: Beginning Balance is not included in Total Revenue by Source.
Source: Austin FY 2010 Approved Budget , page 28 (page 80 of PDF)
(http://www.ci.austin.tx.us/budget/09-10/downloads/Exe%20Final%20Draft.pdf)
Source: Austin FY 2010 Approved Budget , page 28 (page 80 of PDF)
(http://www.ci.austin.tx.us/budget/09-10/downloads/Exe%20Final%20Draft.pdf)
Appendix F- Detailed Source Tables Page F-19
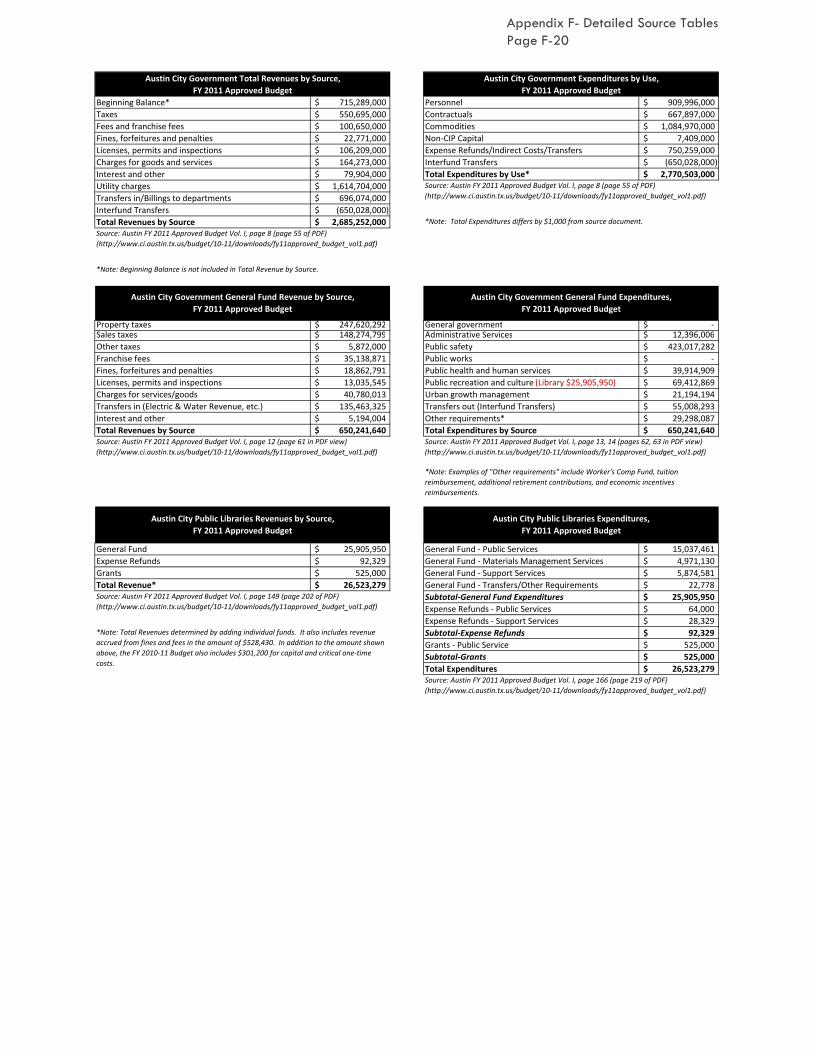
Beginning Balance* 715,289,000$ Personnel 909,996,000$
Taxes 550,695,000$ Contractuals 667,897,000$
Fees and franchise fees 100,650,000$ Commodities 1,084,970,000$
Fines, forfeitures and penalties 22,771,000$ Non-CIP Capital 7,409,000$
Licenses, permits and inspections 106,209,000$ Expense Refunds/Indirect Costs/Transfers 750,259,000$
Charges for goods and services 164,273,000$ Interfund Transfers (650,028,000)$
Interest and other 79,904,000$ Total Expenditures by Use* 2,770,503,000$
Utility charges 1,614,704,000$
Transfers in/Billings to departments 696,074,000$
Interfund Transfers (650,028,000)$
Total Revenues by Source 2,685,252,000$
Property taxes 247,620,292$ General government -$ Sales taxes 148,274,799$ Administrative Services 12,396,006$
Other taxes 5,872,000$ Public safety 423,017,282$
Franchise fees 35,138,871$ Public works -$
Fines, forfeitures and penalties 18,862,791$ Public health and human services 39,914,909$
Licenses, permits and inspections 13,035,545$ Public recreation and culture (Library $25,905,950) 69,412,869$
Charges for services/goods 40,780,013$ Urban growth management 21,194,194$
Transfers in (Electric & Water Revenue, etc.) 135,463,325$ Transfers out (Interfund Transfers) 55,008,293$
Interest and other 5,194,004$ Other requirements* 29,298,087$
Total Revenues by Source 650,241,640$ Total Expenditures by Source 650,241,640$
General Fund 25,905,950$ General Fund - Public Services 15,037,461$
Expense Refunds 92,329$ General Fund - Materials Management Services 4,971,130$
Grants 525,000$ General Fund - Support Services 5,874,581$
Total Revenue* 26,523,279$ General Fund - Transfers/Other Requirements 22,778$
Subtotal-General Fund Expenditures 25,905,950$
Expense Refunds - Public Services 64,000$
Expense Refunds - Support Services 28,329$
Subtotal-Expense Refunds 92,329$
Grants - Public Service 525,000$
Subtotal-Grants 525,000$
Total Expenditures 26,523,279$
Austin City Government General Fund Revenue by Source,
FY 2011 Approved Budget
Austin City Government General Fund Expenditures,
FY 2011 Approved Budget
Source: Austin FY 2011 Approved Budget Vol. I, page 149 (page 202 of PDF)
(http://www.ci.austin.tx.us/budget/10-11/downloads/fy11approved_budget_vol1.pdf)
Austin City Government Total Revenues by Source,
FY 2011 Approved Budget
Austin City Government Expenditures by Use,
FY 2011 Approved Budget
*Note: Total Expenditures differs by $1,000 from source document.
*Note: Beginning Balance is not included in Total Revenue by Source.
Source: Austin FY 2011 Approved Budget Vol. I, page 8 (page 55 of PDF)
(http://www.ci.austin.tx.us/budget/10-11/downloads/fy11approved_budget_vol1.pdf)
Source: Austin FY 2011 Approved Budget Vol. I, page 8 (page 55 of PDF)
(http://www.ci.austin.tx.us/budget/10-11/downloads/fy11approved_budget_vol1.pdf)
Source: Austin FY 2011 Approved Budget Vol. I, page 13, 14 (pages 62, 63 in PDF view)
(http://www.ci.austin.tx.us/budget/10-11/downloads/fy11approved_budget_vol1.pdf)
Source: Austin FY 2011 Approved Budget Vol. I, page 166 (page 219 of PDF)
(http://www.ci.austin.tx.us/budget/10-11/downloads/fy11approved_budget_vol1.pdf)
Source: Austin FY 2011 Approved Budget Vol. I, page 12 (page 61 in PDF view)
(http://www.ci.austin.tx.us/budget/10-11/downloads/fy11approved_budget_vol1.pdf)
Austin City Public Libraries Revenues by Source,
FY 2011 Approved Budget
Austin City Public Libraries Expenditures,
FY 2011 Approved Budget
*Note: Examples of "Other requirements" include Worker's Comp Fund, tuition
reimbursement, additional retirement contributions, and economic incentives
reimbursements.
*Note: Total Revenues determined by adding individual funds. It also includes revenue
accrued from fines and fees in the amount of $528,430. In addition to the amount shown
above, the FY 2010-11 Budget also includes $301,200 for capital and critical one-time
costs.
Appendix F- Detailed Source Tables Page F-20

Beginning Balance* 665,270,000$ Personnel 960,521,000$
Taxes 591,939,000$ Contractuals 693,353,000$
Fees and franchise fees 166,747,000$ Commodities 1,019,841,000$
Fines, forfeitures and penalties 23,085,000$ Non‐CIP Capital 5,609,000$
Licenses, permits and inspections 19,638,000$ Expense Refunds/Indirect Costs/Transfers 801,293,000$
Charges for goods and services 140,261,000$ Interfund Transfers (686,978,000)$
Interest and other 146,731,000$ Total Expenditures by Use 2,793,639,000$
Utility charges 1,546,729,000$
Transfers in/Billings to departments 734,238,000$
Interfund Transfers (686,978,000)$
Total Revenues by Source 2,682,389,000$
Property taxes 279,378,345$ General government ‐$ Sales taxes 152,723,043$ Administrative Services 12,772,929$
Other taxes 5,160,000$ Public safety 447,424,894$
Franchise fees 33,826,919$ Public works ‐$
Fines, forfeitures and penalties 20,078,581$ Public health and human services 41,493,403$
Licenses, permits and inspections 15,299,692$ Public recreation and culture (Library $26,527,680) 71,493,479$
Charges for services/goods 43,539,888$ Urban growth management 21,180,575$
Transfers in (Electric & Water Revenue, etc.) 138,119,531$ Transfers out (Interfund Transfers) 60,607,846$
Interest and other 3,632,775$ Other requirements* 36,785,648$
Total Revenues by Source 691,758,774$ Total Expenditures by Source 691,758,774$
General Fund 26,527,680$ General Fund ‐ Public Services 15,132,662$
Expense Refunds 92,329$ General Fund ‐ Materials Management Services 5,050,124$
Grants 67,500$ General Fund ‐ Support Services 6,322,116$
Total Revenue* 26,687,509$ General Fund ‐ Transfers/Other Requirements 22,778$
Subtotal‐General Fund Expenditures 26,527,680$
Expense Refunds ‐ Public Services 64,000$
Expense Refunds ‐ Support Services 28,329$
Subtotal‐Expense Refunds 92,329$
Grants ‐ Public Service 60,000$
Grants ‐ Support Service* $7,500
Subtotal‐Grants 67,500$
Total Expenditures 26,687,509$
*Note: Support Service grant new for FY 2011‐12
*Note: Beginning Balance is not included in Total Revenue by Source.
Austin City Government Total Revenues by Source,
FY 2012 Approved Budget
Austin City Government Expenditures by Use,
FY 2012 Approved Budget
Source: Austin FY 2012 Approved Budget Vol. I, page 8 (page 66of PDF)
(hhttp://www.ci.austin.tx.us/budget/11‐12/downloads/fy12_approved_volume1.pdf)
Source: Austin FY 2012 Approved Budget Vol. I, page 8 (page 66 of PDF)
(http://www.ci.austin.tx.us/budget/11‐12/downloads/fy12_approved_volume1.pdf)
Source: Austin FY 2012 Approved Budget Vol. I, page 139 (page 203 of PDF)
(http://www.ci.austin.tx.us/budget/11‐12/downloads/fy12_approved_volume1.pdf)
*Note: Total Revenues determined by adding individual funds. It also includes revenue
accrued from fines and fees in the amount of $606,555 In addition to the amount shown
above, the FY 2011‐12 Budget also includes $65,000 for capital and critical one‐time costs.
Source: Austin FY 2012 Approved Budget Vol. I, page 156‐158 (page 220‐222 of PDF)
(http://www.ci.austin.tx.us/budget/11‐12/downloads/fy12_approved_volume1.pdf)
Austin City Government General Fund Revenue by Source,
FY 2012 Approved Budget
Austin City Government General Fund Expenditures,
FY 2012 Approved Budget
Source: Austin FY 2012 Approved Budget Vol. I, page 11 (page 71 in PDF view)
(hhttp://www.ci.austin.tx.us/budget/11‐12/downloads/fy12_approved_volume1.pdf)
Source: Austin FY 2012 Approved Budget Vol. I, page 13, 14 (pages 73‐74 in PDF view)
(hhttp://www.ci.austin.tx.us/budget/11‐12/downloads/fy12_approved_volume1.pdf)
*Note: Examples of "Other requirements" include Worker's Comp Fund, tuition
reimbursement, additional retirement contributions, and economic incentives
reimbursements.
Austin City Public Libraries Revenues by Source,
FY 2012 Approved Budget
Austin City Public Libraries Expenditures,
FY 2012 Approved Budget
Appendix F- Detailed Source Tables Page F-21

Property Tax 713,116,131$ Department of Education 1,351,229,463$
Income Tax 640,984,540$ Department of Public Works 260,286,831$
Service Taxes 144,940,086$ Police Department 180,005,484$
State Aid 643,557,118$ Capital Projects- PAYGO 55,514,000$
Federal Aid 132,185,777$ Community College 163,890,622$
Fees & Other Revenue 392,175,014$ Debt Service 65,548,625$
Appropriation drawn from (or surplus added to) Fund -$ Fire Department 88,028,280$
Total Revenues by Source 2,666,958,666$ Insurance 110,060,114$
General Government 53,238,102$
Housing Office 42,493,972$
Department of Health 45,808,089$
Department of Libraries 41,271,213$
Retirement and Social Security 56,528,483$
Department of Corrections 31,050,465$
State Mandated Agencies 25,509,958$
Department of Aging 14,538,509$
Recreation and Parks 17,203,456$
Department of Social Services 11,029,561$
Emergency Communications Center 11,156,006$
Community Development Grants 9,902,241$
Office of Workforce Development 2,281,852$
Environmental Protection and Resource Management 7,465,105$
All Other Agencies 22,918,235$
Total Operating Expenses 2,666,958,666$
Property Taxes 711,879,418$ General Government 52,372,800$
Income Tax 631,772,154$ Public Safety 304,676,729$
Sales and Service Taxes 138,770,071$ Public Works 113,109,144$
Licenses and Permits 3,717,167$ Health and Human Services 36,563,648$
Intergovernmental 78,972,287$ Culture and Leisure Services 22,928,706$
Charges for Services 10,276,412$ Economic Development 1,894,084$
Fines and Forfeitures 2,546,709$ Pension Plan Contributions 40,672,328$
Interest on Investments 11,889,607$ Insurance 109,758,630$
Miscellaneous 72,782,254$ Public Schools 709,383,410$
Total General Fund Revenue 1,662,606,079$ Community College 38,532,055$
Libraries 31,339,415$
Debt Service 96,122,293$
Miscellaneous 105,252,837$
Total Operating Expenses 1,662,606,079$
Original General Fund Appropriation 31,339,415$ Personnel Services 19,529,520$
General Fund Appropriation Transfer/Supplement -$ Mileage and Travel 191,137$
Adjusted General Fund Appropriation 31,339,415$ Contractual Services 6,129,075$
Special Fund Authorization- Fund 099^ 7,997,967$ Rents and Utilities 3,074,935$
Total Expenditure Authorization 39,337,382$ Supplies and Materials 1,258,578$
Less: Unexpended Balance 1,933,831$ Grants, Subsidies, Contributions 2,964,000$
Total Revenue 41,271,213$ Other Charges 7,493,797$
Land, Building, Other Improvements 630,171$
Total Expenditures 41,271,213$
*Note: FY 2008 Adopted Operating Budget Supporting Detail was not available so we used the
2008 Actual numbers from the 2010 Fiscal Year Adopted Operating Budget Supporting Detail.
Source: 2010 Fiscal Year Adopted Operating Budget Supporting Detail page 527
(http://resources.baltimorecountymd.gov/Documents/Budget/080910budgets/fy10adoptedo
b.pdf)
Baltimore County Government Total Revenues by Source,
FY 2008 Actual Budget*
Baltimore County Government Expenditures by Use,
FY 2008 Actual Budget
Baltimore County Government General Fund Revenue
by Source,
FY 2008 Estimated Budget
Baltimore County Government General Fund Expenditures,
FY 2008 Estimated Budget
Source: 2010 Fiscal Year Annual Operation and Capital Budgets page 42 (page 44 in PDF view)
(http://resources.baltimorecountymd.gov/Documents/Budget/fy2010adoptedbook.pdf)
*Note: The FY 2008 Annual Operation and Capital Budgets Report was not available; therefore
the 2008 Actual numbers for All Funds reported in the FY 2010 Annual Operation and Capital
Budget was used. For this reason, some of the categories are different in the Expenditures
table.
Baltimore County Public Libraries Revenue by Source,
FY 2008 Actual Budget*
Baltimore County Public Libraries Expenditures,
FY 2008 Actual Budget
Source: 2009 Fiscal Year Annual Operation and Capital Budgets page 64
(http://resources.baltimorecountymd.gov/Documents/Budget/080910budgets/fy09adoptmsg
.pdf)
^Note: This funding does not pass through the County's coffers, but the County must approve
the spending levels.
Source: 2010 Fiscal Year Annual Operation and Capital Budgets page 42 (page 44 in PDF view)
(http://resources.baltimorecountymd.gov/Documents/Budget/fy2010adoptedbook.pdf)
Source: 2009 Fiscal Year Annual Operation and Capital Budgets page 64
(http://resources.baltimorecountymd.gov/Documents/Budget/080910budgets/fy09adoptmsg
.pdf)
*Note: The 2008 Fiscal Year Annual Operation and Capital Budgets report was not available so
we used the 2008 Estimates for the General Fund from the 2009 Fiscal Year Annual Operation
and Capital Budget. For this reason, some of the categories are different in both of the tables.
Source: 2010 Fiscal Year Adopted Operating Budget Supporting Detail page 527
(http://resources.baltimorecountymd.gov/Documents/Budget/080910budgets/fy10adoptedo
b.pdf)
Appendix F- Detailed Source Tables Page F-22

Property Tax 756,983,678$ Department of Education 1,394,869,488$
Income Tax 647,238,897$ Community College 168,765,928$
Service Taxes 136,710,857$ Department of Libraries 40,309,828$
State Aid 674,509,789$ Department of Social Services 13,191,475$
Federal Aid 149,630,669$ Recreation & Parks 19,334,643$
Fees & Other Revenue 381,744,914$ Housing Office 41,817,897$
Appropriation drawn from (or surplus added to) Fund 53,620,359$ Department of Health 54,289,180$
Total Revenues by Source 2,800,439,163$ Department of Aging 17,937,050$
Community Devel. Block Grants 10,129,126$
Local Management Board 4,130,573$
Liquor License Commission 721,778$
Economic Development 6,625,254$
Workforce Development 4,442,119$
Department of Public Works 283,730,916$
Permits and Development Management 11,328,669$
Police Department 188,388,074$
Reserve for Contingencies 4,991,215$
All Other Agencies 535,435,950$
Total Operating Expenses 2,800,439,163$
Property Taxes 756,983,678$ Department of Education 748,956,464$
Income Tax 647,238,897$ Community College 42,277,644$
Service Taxes 136,710,857$ Department of Libraries 32,464,870$
State Aid 76,209,881$ Department of Social Services 6,091,833$
Federal Aid 2,212,727$ Recreation & Parks 16,187,930$
Fees & Other Revenue 52,701,506$ Housing Office -$
Revenue Transfers -$ Department of Health 18,077,652$
Appropriation from Fund Balance 47,470,664$ Department of Aging 5,625,925$
Total General Fund Revenue 1,719,528,210$ Community Devel. Block Grants -$
Local Management Board -$
Liquor License Commission -$
Economic Development 2,070,254$
Workforce Development -$
Department of Public Works 119,662,576$
Permits and Development Management 9,637,059$
Police Department 182,709,778$
Reserve for Contingencies 4,991,215$
All Other Agencies 530,795,010$
Total Operating Expenses 1,719,548,210$
Original General Fund Appropriation 32,464,870$ Personnel Services 19,533,887$
General Fund Appropriation Transfer/Supplement -$ Mileage and Travel 158,422$
Adjusted General Fund Appropriation 32,464,870$ Contractual Services 7,628,376$
Special Fund Authorization- Fund 099* 7,844,958$ Rents and Utilities 2,957,879$
Total Expenditure Authorization 40,309,828$ Supplies and Materials 8,561,294$
Less: Unexpended Balance 1,845,448$ Grants, Subsidies, Contributions 2,710,278$
Total Revenue^ 42,154,791$ Other Charges 138,862$
Land, Building, Other Improvements 465,793$
Total Expenditures 42,154,791$
^Note: FY 2009 Adopted Operating Budget Supporting Detail was not available, therefore the
2009 actual figures reported in the FY 2011 Adopted Operating Budget Supporting Detail was
used.
Baltimore County Government Total Revenues by Source,
FY 2009 Adopted Budget
Baltimore County Government Expenditures by Use,
FY 2009 Adopted Budget
Baltimore County Government General Fund Revenue
by Source,
FY 2009 Adopted Budget
Baltimore County Government General Fund Expenditures,
FY 2009 Adopted Budget
Baltimore County Public Libraries Revenue by Source,
FY 2009 Actual Budget
Baltimore County Public Libraries Expenditures,
FY 2009 Actual Budget
*Note: This funding does not pass through the County's coffers, but the County must approve
the spending levels.
Source: 2009 Fiscal Year Annual Operation and Capital Budgets page 141
(http://resources.baltimorecountymd.gov/Documents/Budget/080910budgets/fy09adoptmsg
.pdf)
Source: 2009 Fiscal Year Annual Operation and Capital Budgets page 141
(http://resources.baltimorecountymd.gov/Documents/Budget/080910budgets/fy09adoptmsg
.pdf)
Source: 2009 Fiscal Year Annual Operation and Capital Budgets page 141
(http://resources.baltimorecountymd.gov/Documents/Budget/080910budgets/fy09adoptmsg
.pdf)
Source: 2009 Fiscal Year Annual Operation and Capital Budgets page 141
(http://resources.baltimorecountymd.gov/Documents/Budget/080910budgets/fy09adoptmsg
.pdf)
Source: FY 2011 Adopted Operating Budget Supporting Detail page 529 (page 530 in PDF view)
(http://resources.baltimorecountymd.gov/Documents/Budget/11budget/fy11opersupportdet
ail.pdf) Source: FY 2011 Adopted Operating Budget Supporting Detail page 529 (page 530 in PDF view)
(http://resources.baltimorecountymd.gov/Documents/Budget/11budget/fy11opersupportdet
ail.pdf)
Appendix F- Detailed Source Tables Page F-23

Property Tax 821,810,442$ Department of Education 1,350,445,682$
Income Tax 597,630,678$ Community College 178,892,503$
Service Taxes 108,079,808$ Department of Libraries 41,349,398$
State Aid 638,537,291$ Department of Social Services 14,060,123$
Federal Aid 166,975,933$ Recreation & Parks 20,119,247$
Fees & Other Revenue 379,098,390$ Housing Office 50,894,298$
Appropriation drawn from (or surplus added to) Fund 79,439,446$ Department of Health 55,417,657$
Total Revenues by Source 2,791,571,988$ Department of Aging 17,814,216$
Community Devel. Block Grants 9,002,372$
Local Management Board 4,824,169$
Liquor License Commission 750,521$
Economic Development 6,732,395$
Workforce Development 6,503,137$
Department of Public Works 302,390,257$
Permits and Development Management 11,534,176$
Police Department 200,350,770$
Reserve for Contingencies 1,000,000$
All Other Agencies 519,491,067$
Total Expenditures 2,791,571,988$
Property Taxes 821,810,442$ Department of Education 703,796,054$
Income Tax 597,630,678$ Community College 42,763,563$
Service Taxes 108,079,808$ Department of Libraries 34,285,098$
State Aid 48,321,570$ Department of Social Services 6,684,626$
Federal Aid 2,092,945$ Recreation & Parks 16,994,856$
Fees & Other Revenue 43,859,404$ Housing Office -$
Revenue Transfers -$ Department of Health 18,398,906$
Appropriation from Fund Balance 52,081,620$ Department of Aging 5,795,279$
Total General Fund Revenue 1,673,876,467$ Community Devel. Block Grants -$
Local Management Board -$
Liquor License Commission -$
Economic Development 2,177,395$
Workforce Development -$
Department of Public Works 125,213,869$
Permits and Development Management 9,811,260$
Police Department 190,892,196$
Reserve for Contingencies 1,000,000$
All Other Agencies 516,063,365$
Total Expenditures 1,673,876,467$
Original General Fund Appropriation 34,285,098$ Personnel Services 20,968,406$
General Fund Appropriation Transfer/Supplement -$ Mileage and Travel 144,700$
Adjusted General Fund Appropriation 34,285,098$ Contractual Services 6,182,257$
Special Fund Authorization- Fund 099* 7,064,300$ Rents and Utilities 2,996,738$
Total Expenditure Authorization 41,349,398$ Supplies and Materials 8,789,511$
Total Revenue 41,349,398$ Grants, Subsidies, Contributions 2,046,986$
Other Charges 110,000$
Land, Building, Other Improvements 110,800$
Total Expenditures 41,349,398$
Source: 2010 Fiscal Year Annual Operation and Capital Budgets page 141 (page 143 in PDF
view) (http://resources.baltimorecountymd.gov/Documents/Budget/fy2010adoptedbook.pdf)
Source: FY 2010 Adopted Operating Budget Supporting Detail page 527
(http://resources.baltimorecountymd.gov/Documents/Budget/080910budgets/fy10adoptedo
b.pdf)
Source: FY 2010 Adopted Operating Budget Supporting Detail page 527
(http://resources.baltimorecountymd.gov/Documents/Budget/080910budgets/fy10adoptedo
b.pdf)
*Note: This funding does not pass through the County's coffers, but the County must approve
the spending levels.
Baltimore County Government Total Revenues by Source,
FY 2010 Adopted Budget
Baltimore County Government Expenditures by Use,
FY 2010 Adopted Budget
Baltimore County Government General Fund Revenue
by Source,
FY 2010 Adopted Budget
Baltimore County Government General Fund Expenditures,
FY 2010 Adopted Budget
Baltimore County Public Libraries Revenue by Source,
FY 2010 Adopted Budget
Baltimore County Public Libraries Expenditures,
FY 2010 Adopted Budget
Source: 2010 Fiscal Year Annual Operation and Capital Budgets page 141 (page 143 in PDF
view) (http://resources.baltimorecountymd.gov/Documents/Budget/fy2010adoptedbook.pdf)
Source: 2010 Fiscal Year Annual Operation and Capital Budgets page 141 (page 143 in PDF
view) (http://resources.baltimorecountymd.gov/Documents/Budget/fy2010adoptedbook.pdf)
Source: 2010 Fiscal Year Annual Operation and Capital Budgets page 141 (page 143 in PDF
view) (http://resources.baltimorecountymd.gov/Documents/Budget/fy2010adoptedbook.pdf)
Appendix F- Detailed Source Tables Page F-24

Property Tax 841,405,415$ Department of Education 1,374,959,598$
Income Tax 559,993,621$ Community College 228,579,049$
Service Taxes 107,417,526$ Department of Libraries 41,130,917$
State Aid 613,382,683$ Department of Social Services 14,024,511$
Federal Aid 192,446,564$ Recreation & Parks 20,316,908$
Fees & Other Revenue 467,535,678$ Housing Office 54,187,500$
Appropriation drawn from (or surplus added to) Fund 27,518,707$ Department of Health 53,089,287$
Total Revenues by Source 2,809,700,194$ Department of Aging 17,660,598$
Community Devel. Block Grants 13,429,837$
Local Management Board 1,717,492$
Liquor License Commission 628,666$
Economic Development 6,182,346$
Workforce Development 5,748,974$
Department of Public Works 306,472,182$
Permits and Development Management 9,454,976$
Police Department 203,998,170$
Reserve for Contingencies 1,000,000$
All Other Agencies 457,119,183$
Total Operating Expenses 2,809,700,194$
Property Taxes 841,405,415$ Department of Education 695,504,390$
Income Tax 559,993,621$ Community College 43,831,345$
Service Taxes 107,417,526$ Department of Libraries 33,615,882$
State Aid 26,248,572$ Department of Social Services 6,587,613$
Federal Aid 7,435,318$ Recreation & Parks 16,800,715$
Fees & Other Revenue 48,249,285$ Housing Office -$
Revenue Transfers -$ Department of Health 18,378,014$
Appropriation from Fund Balance 9,399,771$ Department of Aging 5,860,038$
Total General Fund Revenue 1,600,149,508$ Community Devel. Block Grants -$
Local Management Board -$
Liquor License Commission -$
Economic Development 2,152,346$
Workforce Development -$
Department of Public Works 125,204,124$
Permits and Development Management 8,223,149$
Police Department 193,506,167$
Reserve for Contingencies 1,000,000$
All Other Agencies 449,485,725$
Total Expenditures 1,600,149,508$
Original General Fund Appropriation 33,615,882$ Personnel Services 21,527,972$
General Fund Appropriation Transfer/Supplement -$ Mileage and Travel 127,000$
Adjusted General Fund Appropriation 33,615,882$ Contractual Services 6,309,542$
Special Fund Authorization- Fund 099* 7,515,035$ Rents and Utilities 2,566,378$
Total Expenditure Authorization 41,130,917$ Supplies and Materials 8,427,590$
Total Revenue 41,130,917$ Grants, Subsidies, Contributions 2,000,035$
Other Charges 102,400$
Land, Building, Other Improvements 70,000$
Total Expenditures 41,130,917$
Source: 2011 Fiscal Year Annual Operation and Capital Budgets page 146
(http://resources.baltimorecountymd.gov/Documents/Budget/11budget/FY2011AdoptedOper
atingCapitalBudget.pdf)
Baltimore County Government Total Revenues by Source,
FY 2011 Adopted Budget
Baltimore County Government Expenditures by Use,
FY 2011 Adopted Budget
Baltimore County Government General Fund Expenditures,
FY 2011 Adopted Budget
Baltimore County Government General Fund Revenue
by Source,
FY 2011 Adopted Budget
Source: 2011 Fiscal Year Annual Operation and Capital Budgets page 146 (page 150 in PDF
view)
(http://resources.baltimorecountymd.gov/Documents/Budget/11budget/FY2011AdoptedOper
atingCapitalBudget.pdf)
Source: 2011 Fiscal Year Annual Operating and Capital Budgets page 146 (page 150 in PDF
view)
(http://resources.baltimorecountymd.gov/Documents/Budget/11budget/FY2011AdoptedOper
atingCapitalBudget.pdf)
Baltimore County Public Libraries Expenditures,
FY 2011 Adopted Budget
Baltimore County Public Libraries Revenue by Source,
FY 2011 Adopted Budget
Source: 2011 Fiscal Year Annual Operation and Capital Budgets page 146
(http://resources.baltimorecountymd.gov/Documents/Budget/11budget/FY2011AdoptedOper
atingCapitalBudget.pdf)
*Note: This funding does not pass through the County's coffers, but the County must approve
the spending levels.
Source: FY 2011 Adopted Operating Budget Supporting Detail page 529 (page 530 in PDF view)
(http://resources.baltimorecountymd.gov/Documents/Budget/11budget/fy11opersupportdet
ail.pdf)
Source: FY 2011 Adopted Operating Budget Supporting Detail page 529(page 530 in PDF view)
(http://resources.baltimorecountymd.gov/Documents/Budget/11budget/fy11opersupportdet
ail.pdf)
Appendix F- Detailed Source Tables Page F-25

Property Tax 847,853,310$ Department of Education 1,386,752,574$
Income Tax 508,547,194$ Community College 260,499,454$
Service Taxes 106,995,400$ Department of Libraries 41,449,927$
State Aid 621,439,146$ Department of Social Services 15,602,214$
Federal Aid 186,812,799$ Recreation & Parks 21,514,760$
Fees & Other Revenue 511,361,992$ Housing Office 54,381,370$
Appropriation drawn from (or surplus added to) Fund 85,181,382$ Department of Health 56,240,532$
Total Revenues by Source 2,868,191,223$ Department of Aging 18,089,558$
Community Devel. Block Grants 9,520,946$
Local Management Board 2,958,681$
Liquor License Commission 685,781$
Economic Development 19,300,419$
Workforce Development 5,510,490$
Department of Public Works 304,135,190$
Permits and Development Management 10,617,492$
Police Department 205,542,616$
Reserve for Contingencies 1,000,000$
All Other Agencies 454,389,219$
Total Operating Expenses 2,868,191,223$
Property Taxes 847,853,310$ Department of Education 702,982,279$
Income Tax 508,547,194$ Community College 44,257,668$
Service Taxes 106,995,400$ Department of Libraries 34,070,272$
State Aid 24,268,611$ Department of Social Services 6,521,721$
Federal Aid 7,353,775$ Recreation & Parks 17,757,983$
Fees & Other Revenue 48,198,397$ Housing Office ‐$
Revenue Transfers ‐$ Department of Health 20,130,295$
Appropriation from Fund Balance 60,568,097$ Department of Aging 5,618,585$
Total General Fund Revenue 1,603,784,784$ Community Devel. Block Grants ‐$
Local Management Board ‐$
Liquor License Commission ‐$
Economic Development 1,641,919$
Workforce Development ‐$
Department of Public Works 119,750,288$
Permits and Development Management 8,982,086$
Police Department 193,214,666$
Reserve for Contingencies 1,000,000$
All Other Agencies* 447,857,022$
Total Expenditures 1,603,784,784$
Original General Fund Appropriation 34,070,272$ Personnel Services 21,412,763$
General Fund Appropriation Transfer/Supplement ‐$ Mileage and Travel 127,000$
Adjusted General Fund Appropriation 34,070,272$ Contractual Services 6,726,018$
Special Fund Authorization‐ Fund 099* 7,379,655$ Rents and Utilities 2,602,460$
Total Expenditure Authorization 41,449,927$ Supplies and Materials 8,408,680$
Total Revenue 41,449,927$ Grants, Subsidies, Contributions 2,031,844$
Other Charges 107,400$
Land, Building, Other Improvements 33,762$
Total Expenditures 41,449,927$
Source: 2012 Fiscal Year Annual Operation and Capital Budgets page 151
(http://resources.baltimorecountymd.gov/Documents/Budget/12budget/fy12adoptedoperati
ngcapitalbudget.pdf)
Source: 2012 Fiscal Year Annual Operation and Capital Budgets page 146
(http://resources.baltimorecountymd.gov/Documents/Budget/12budget/fy12adoptedoperati
ngcapitalbudget.pdf)
Baltimore County Public Libraries Revenue by Source,
FY 2012 Adopted Budget
Baltimore County Public Libraries Expenditures,
FY 2012 Adopted Budget
Source: FY 2012 Adopted Operating Budget Supporting Detail page 525 (page 530 in PDF view)
(http://resources.baltimorecountymd.gov/Documents/Budget/12budget/fy12opersupportdet
ail.pdf
Source: FY 2012 Adopted Operating Budget Supporting Detail page 529(page 530 in PDF view)
(http://resources.baltimorecountymd.gov/Documents/Budget/12budget/fy12opersupportdet
ail.pdf *Note: This funding does not pass through the County's coffers, but the County must approve
the spending levels.
*Includes: Fire Department, Retirement, Debt Services, and Dept. of Corrections
Baltimore County Government Total Revenues by Source,
FY 2012 Adopted Budget
Baltimore County Government Expenditures by Use,
FY 2012 Adopted Budget
Source: 2012 Fiscal Year Annual Operating and Capital Budgets page 151 (page 156 in PDF
view)
(http://resources.baltimorecountymd.gov/Documents/Budget/12budget/fy12adoptedoperati
ngcapitalbudget.pdf)
Source: 2012 Fiscal Year Annual Operating and Capital Budgets page 151 (page 156 in PDF
view)
(http://resources.baltimorecountymd.gov/Documents/Budget/12budget/fy12adoptedoperati
ngcapitalbudget.pdf)
Baltimore County Government General Fund Revenue
by Source, FY 2012 Adopted Budget
Baltimore County Government General Fund Expenditures,
FY 2012 Adopted Budget
Appendix F- Detailed Source Tables Page F-26

General Fund 1,043,103,414$ General Fund Expenditures 1,043,103,414$
Aviation 41,886,461$ Aviation 38,634,084$
Convention and Event Services 63,702,050$ Convention and Event Services 65,977,811$
Municipal Radio 3,810,000$ Municipal Radio 3,675,646$
Storm Drainage Management 29,427,765$ Storm Drainage Management 29,427,765$
Sustainable Development and Construction 23,134,337$ Sustainable Development and Construction 26,086,747$
Water Utilities 489,185,295$ Water Utilities 489,185,295$
Sub-Total Enterprise Funds 651,145,908$ Sub-Total Enterprise Funds Expenditures 652,987,348$
Information Technology 34,123,591$ Information Technology 34,468,558$
Radio Services 4,602,529$ Radio Services 4,206,339$
Equipment Services 46,979,078$ Equipment Services 45,599,988$
Express Business Center 4,504,008$ Express Business Center 4,409,586$
Sub-Total Internal Service Funds 90,209,206$ Sub-Total Internal Service Funds Expenditures 88,684,471$
9-1-1 Systems Operations 13,507,020$ 9-1-1 Systems Operations 14,364,609$
Employee Benefits 94,040,000$ Employee Benefits 94,040,000$
Risk Management 21,909,933$ Risk Management 21,509,933$
Debt Service 223,384,638$ Debt Service 225,448,782$
Sub-Total Other Revenue Funds 352,841,591$ Sub-Total Other Revenue Funds Expenditures 355,363,324$
Total Revenues* 2,137,300,119$ Total Expenditures 2,140,138,557$
Ad Valorem Taxes 434,957,547$ General Government and Support Services 77,397,255$
Sales Tax 237,195,975$ Public Safety 613,188,000$
Franchise Fees 125,815,664$ Street, Sanitation and Code Compliance 134,988,101$
Licenses and Permits 7,634,172$ Public Works and Transportation 63,395,121$
Interest Earnings 8,440,110$ Culture, Library and Recreation (Library $32,157,806) 120,564,867$
Intergovernmental 4,708,298$ Env. Health, Community and Urban Development 27,627,110$
Fines and Forfeitures 52,016,190$ Reserves and Transfers 5,942,960$
Service Fees 118,549,576$ Total Operating Expenses 1,043,103,414$
Interfund Revenue 42,014,109$
Miscellaneous 11,771,773$
Total General Fund Revenue* 1,043,103,414$
Source: Dallas City Adopted Budget FY 2008, Financial Summaries, page 405 (page
1 in PDF view)
(http://www.dallascityhall.com/Budget/adopted0708/0708_FinancialSummaries.
pdf)
Source: Dallas City Adopted Budget FY 2008, Financial Summaries, page 405 (page
1 in PDF view)
(http://www.dallascityhall.com/Budget/adopted0708/0708_FinancialSummaries.
pdf)
Source: Dallas City Adopted Budget FY 2008, Financial Summaries, p. 406 (page 2
in PDF view)
(http://dallascityhall.com/Budget/adopted0910/FY10_AdoptedBudget.pdf)
Source: Dallas City Adopted Budget FY 2008, Financial Summaries, p. 406 (page 2
in PDF view)
(http://dallascityhall.com/Budget/adopted0910/FY10_AdoptedBudget.pdf)
Dallas City Government General Fund Revenue by Source,
FY 2008 Adopted Budget
Dallas City Government General Fund Expenditures,
FY 2008 Adopted Budget
*Note: Does not include a beginning fund balance of $118,533,588.
Dallas City Government Total Revenues by Fund Type,
FY 2008 Adopted Budget
Dallas City Government Expenditures by Fund Type,
FY 2008 Adopted Budget
Enterprise Funds Enterprise Funds Expenditures
Internal Service Funds Internal Service Funds Expenditures
Other Revenue Funds Other Revenue Funds Expenditures
*Note: Does not include a beginning fund balance of $34,223,634.
Appendix F- Detailed Source Tables Page F-27
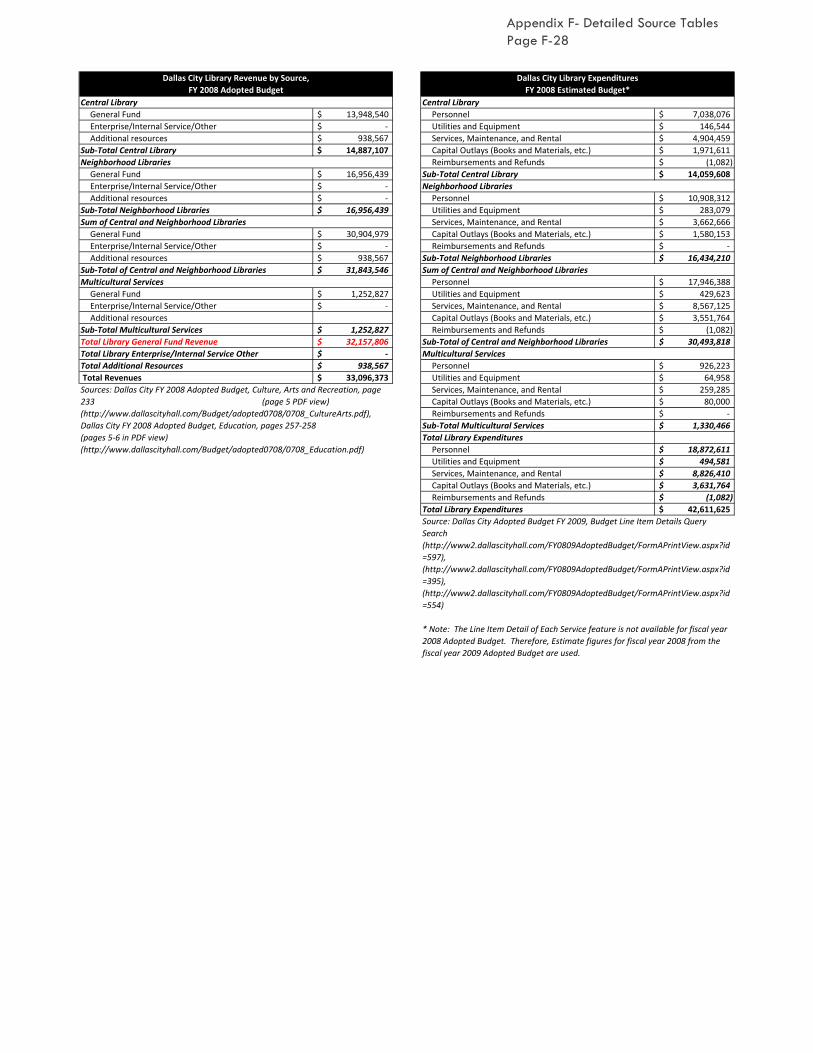
General Fund 13,948,540$ Personnel 7,038,076$
Enterprise/Internal Service/Other -$ Utilities and Equipment 146,544$
Additional resources 938,567$ Services, Maintenance, and Rental 4,904,459$
Sub-Total Central Library 14,887,107$ Capital Outlays (Books and Materials, etc.) 1,971,611$
Reimbursements and Refunds (1,082)$
General Fund 16,956,439$ Sub-Total Central Library 14,059,608$
Enterprise/Internal Service/Other -$
Additional resources -$ Personnel 10,908,312$
Sub-Total Neighborhood Libraries 16,956,439$ Utilities and Equipment 283,079$
Services, Maintenance, and Rental 3,662,666$
General Fund 30,904,979$ Capital Outlays (Books and Materials, etc.) 1,580,153$
Enterprise/Internal Service/Other -$ Reimbursements and Refunds -$
Additional resources 938,567$ Sub-Total Neighborhood Libraries 16,434,210$
Sub-Total of Central and Neighborhood Libraries 31,843,546$
Personnel 17,946,388$
General Fund 1,252,827$ Utilities and Equipment 429,623$
Enterprise/Internal Service/Other -$ Services, Maintenance, and Rental 8,567,125$
Additional resources Capital Outlays (Books and Materials, etc.) 3,551,764$
Sub-Total Multicultural Services 1,252,827$ Reimbursements and Refunds (1,082)$
Total Library General Fund Revenue 32,157,806$ Sub-Total of Central and Neighborhood Libraries 30,493,818$
Total Library Enterprise/Internal Service Other -$
Total Additional Resources 938,567$ Personnel 926,223$
Total Revenues 33,096,373$ Utilities and Equipment 64,958$
Services, Maintenance, and Rental 259,285$
Capital Outlays (Books and Materials, etc.) 80,000$
Reimbursements and Refunds -$
Sub-Total Multicultural Services 1,330,466$
Total Library Expenditures
Personnel 18,872,611$
Utilities and Equipment 494,581$
Services, Maintenance, and Rental 8,826,410$
Capital Outlays (Books and Materials, etc.) 3,631,764$
Reimbursements and Refunds (1,082)$
Total Library Expenditures 42,611,625$
Source: Dallas City Adopted Budget FY 2009, Budget Line Item Details Query
Search
(http://www2.dallascityhall.com/FY0809AdoptedBudget/FormAPrintView.aspx?id
=597),
(http://www2.dallascityhall.com/FY0809AdoptedBudget/FormAPrintView.aspx?id
=395),
(http://www2.dallascityhall.com/FY0809AdoptedBudget/FormAPrintView.aspx?id
=554)
* Note: The Line Item Detail of Each Service feature is not available for fiscal year
2008 Adopted Budget. Therefore, Estimate figures for fiscal year 2008 from the
fiscal year 2009 Adopted Budget are used.
Neighborhood Libraries
Sum of Central and Neighborhood Libraries
Sum of Central and Neighborhood Libraries
Multicultural Services
Multicultural Services
Sources: Dallas City FY 2008 Adopted Budget, Culture, Arts and Recreation, page
233 (page 5 PDF view)
(http://www.dallascityhall.com/Budget/adopted0708/0708_CultureArts.pdf),
Dallas City FY 2008 Adopted Budget, Education, pages 257-258
(pages 5-6 in PDF view)
(http://www.dallascityhall.com/Budget/adopted0708/0708_Education.pdf)
Neighborhood Libraries
Dallas City Library Revenue by Source,
FY 2008 Adopted Budget
Dallas City Library Expenditures
FY 2008 Estimated Budget*
Central Library Central Library
Appendix F- Detailed Source Tables Page F-28
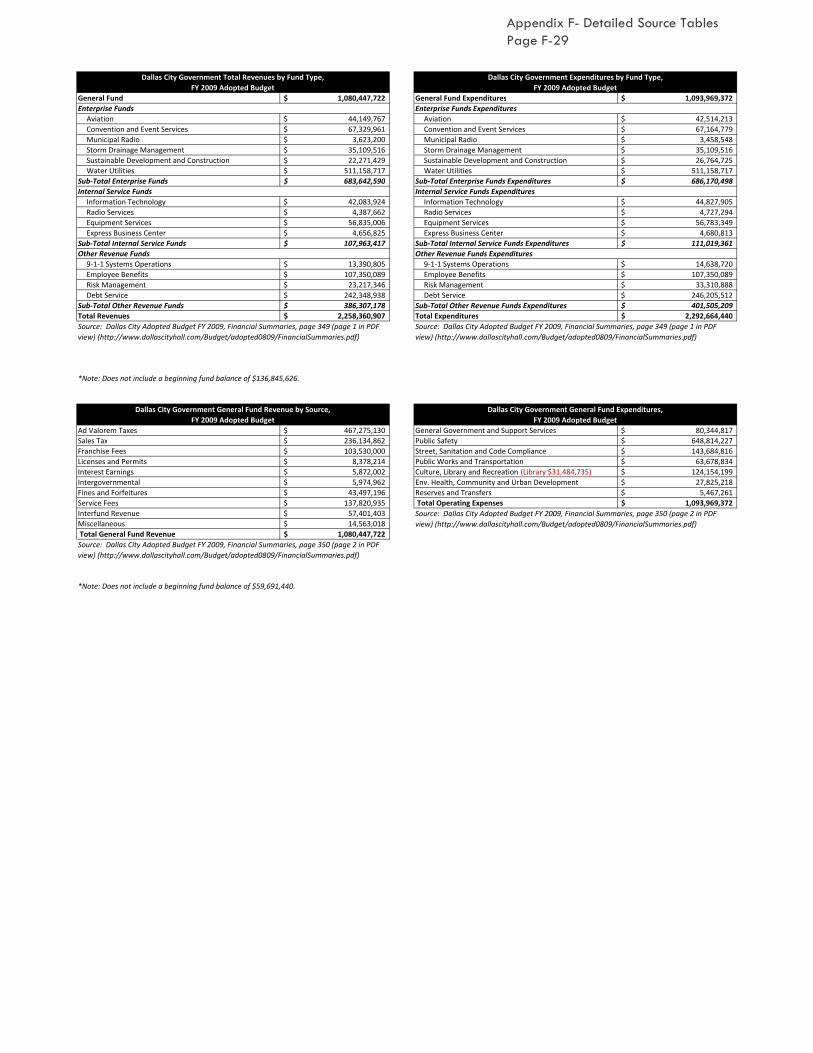
General Fund 1,080,447,722$ General Fund Expenditures 1,093,969,372$
Aviation 44,149,767$ Aviation 42,514,213$
Convention and Event Services 67,329,961$ Convention and Event Services 67,164,779$
Municipal Radio 3,623,200$ Municipal Radio 3,458,548$
Storm Drainage Management 35,109,516$ Storm Drainage Management 35,109,516$
Sustainable Development and Construction 22,271,429$ Sustainable Development and Construction 26,764,725$
Water Utilities 511,158,717$ Water Utilities 511,158,717$
Sub-Total Enterprise Funds 683,642,590$ Sub-Total Enterprise Funds Expenditures 686,170,498$
Information Technology 42,083,924$ Information Technology 44,827,905$
Radio Services 4,387,662$ Radio Services 4,727,294$
Equipment Services 56,835,006$ Equipment Services 56,783,349$
Express Business Center 4,656,825$ Express Business Center 4,680,813$
Sub-Total Internal Service Funds 107,963,417$ Sub-Total Internal Service Funds Expenditures 111,019,361$
9-1-1 Systems Operations 13,390,805$ 9-1-1 Systems Operations 14,638,720$
Employee Benefits 107,350,089$ Employee Benefits 107,350,089$
Risk Management 23,217,346$ Risk Management 33,310,888$
Debt Service 242,348,938$ Debt Service 246,205,512$
Sub-Total Other Revenue Funds 386,307,178$ Sub-Total Other Revenue Funds Expenditures 401,505,209$
Total Revenues 2,258,360,907$ Total Expenditures 2,292,664,440$
Ad Valorem Taxes 467,275,130$ General Government and Support Services 80,344,817$
Sales Tax 236,134,862$ Public Safety 648,814,227$
Franchise Fees 103,530,000$ Street, Sanitation and Code Compliance 143,684,816$
Licenses and Permits 8,378,214$ Public Works and Transportation 63,678,834$
Interest Earnings 5,872,002$ Culture, Library and Recreation (Library $31,484,735) 124,154,199$
Intergovernmental 5,974,962$ Env. Health, Community and Urban Development 27,825,218$
Fines and Forfeitures 43,497,196$ Reserves and Transfers 5,467,261$
Service Fees 137,820,935$ Total Operating Expenses 1,093,969,372$
Interfund Revenue 57,401,403$
Miscellaneous 14,563,018$
Total General Fund Revenue 1,080,447,722$
Dallas City Government General Fund Revenue by Source,
FY 2009 Adopted Budget
Dallas City Government General Fund Expenditures,
FY 2009 Adopted Budget
Source: Dallas City Adopted Budget FY 2009, Financial Summaries, page 350 (page 2 in PDF
view) (http://www.dallascityhall.com/Budget/adopted0809/FinancialSummaries.pdf)
Source: Dallas City Adopted Budget FY 2009, Financial Summaries, page 350 (page 2 in PDF
view) (http://www.dallascityhall.com/Budget/adopted0809/FinancialSummaries.pdf)
Source: Dallas City Adopted Budget FY 2009, Financial Summaries, page 349 (page 1 in PDF
view) (http://www.dallascityhall.com/Budget/adopted0809/FinancialSummaries.pdf)
Dallas City Government Total Revenues by Fund Type,
FY 2009 Adopted Budget
Dallas City Government Expenditures by Fund Type,
FY 2009 Adopted Budget
Enterprise Funds Enterprise Funds Expenditures
Internal Service Funds Internal Service Funds Expenditures
Other Revenue Funds Other Revenue Funds Expenditures
Source: Dallas City Adopted Budget FY 2009, Financial Summaries, page 349 (page 1 in PDF
view) (http://www.dallascityhall.com/Budget/adopted0809/FinancialSummaries.pdf)
*Note: Does not include a beginning fund balance of $136,845,626.
*Note: Does not include a beginning fund balance of $59,691,440.
Appendix F- Detailed Source Tables Page F-29
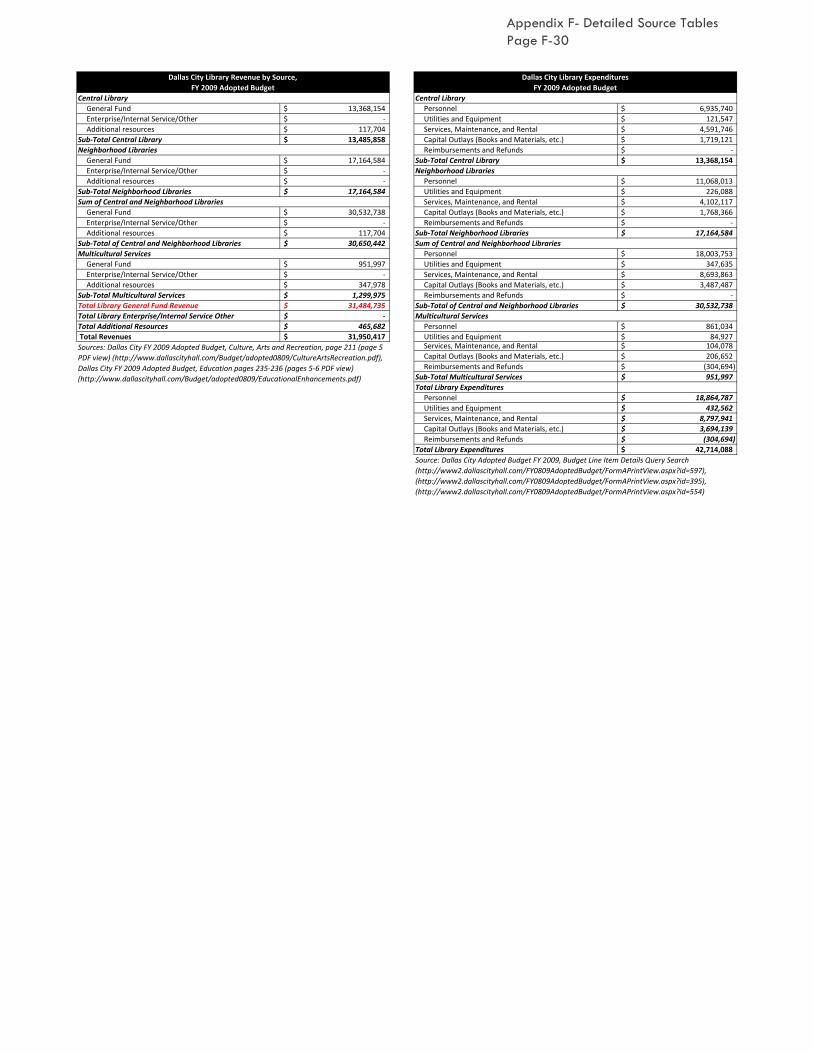
General Fund 13,368,154$ Personnel 6,935,740$
Enterprise/Internal Service/Other -$ Utilities and Equipment 121,547$
Additional resources 117,704$ Services, Maintenance, and Rental 4,591,746$
Sub-Total Central Library 13,485,858$ Capital Outlays (Books and Materials, etc.) 1,719,121$
Reimbursements and Refunds -$
General Fund 17,164,584$ Sub-Total Central Library 13,368,154$
Enterprise/Internal Service/Other -$
Additional resources -$ Personnel 11,068,013$
Sub-Total Neighborhood Libraries 17,164,584$ Utilities and Equipment 226,088$
Services, Maintenance, and Rental 4,102,117$
General Fund 30,532,738$ Capital Outlays (Books and Materials, etc.) 1,768,366$
Enterprise/Internal Service/Other -$ Reimbursements and Refunds -$
Additional resources 117,704$ Sub-Total Neighborhood Libraries 17,164,584$
Sub-Total of Central and Neighborhood Libraries 30,650,442$
Personnel 18,003,753$
General Fund 951,997$ Utilities and Equipment 347,635$
Enterprise/Internal Service/Other -$ Services, Maintenance, and Rental 8,693,863$
Additional resources 347,978$ Capital Outlays (Books and Materials, etc.) 3,487,487$
Sub-Total Multicultural Services 1,299,975$ Reimbursements and Refunds -$
Total Library General Fund Revenue 31,484,735$ Sub-Total of Central and Neighborhood Libraries 30,532,738$
Total Library Enterprise/Internal Service Other -$
Total Additional Resources 465,682$ Personnel 861,034$
Total Revenues 31,950,417$ Utilities and Equipment 84,927$ Services, Maintenance, and Rental 104,078$
Capital Outlays (Books and Materials, etc.) 206,652$
Reimbursements and Refunds (304,694)$
Sub-Total Multicultural Services 951,997$
Total Library Expenditures
Personnel 18,864,787$
Utilities and Equipment 432,562$
Services, Maintenance, and Rental 8,797,941$
Capital Outlays (Books and Materials, etc.) 3,694,139$
Reimbursements and Refunds (304,694)$
Total Library Expenditures 42,714,088$
Sources: Dallas City FY 2009 Adopted Budget, Culture, Arts and Recreation, page 211 (page 5
PDF view) (http://www.dallascityhall.com/Budget/adopted0809/CultureArtsRecreation.pdf),
Dallas City FY 2009 Adopted Budget, Education pages 235-236 (pages 5-6 PDF view)
(http://www.dallascityhall.com/Budget/adopted0809/EducationalEnhancements.pdf)
Source: Dallas City Adopted Budget FY 2009, Budget Line Item Details Query Search
(http://www2.dallascityhall.com/FY0809AdoptedBudget/FormAPrintView.aspx?id=597),
(http://www2.dallascityhall.com/FY0809AdoptedBudget/FormAPrintView.aspx?id=395),
(http://www2.dallascityhall.com/FY0809AdoptedBudget/FormAPrintView.aspx?id=554)
Sum of Central and Neighborhood Libraries
Multicultural Services
Multicultural Services
Neighborhood Libraries
Sum of Central and Neighborhood Libraries
Neighborhood Libraries
Central Library Central Library
Dallas City Library Revenue by Source,
FY 2009 Adopted Budget
Dallas City Library Expenditures
FY 2009 Adopted Budget
Appendix F- Detailed Source Tables Page F-30
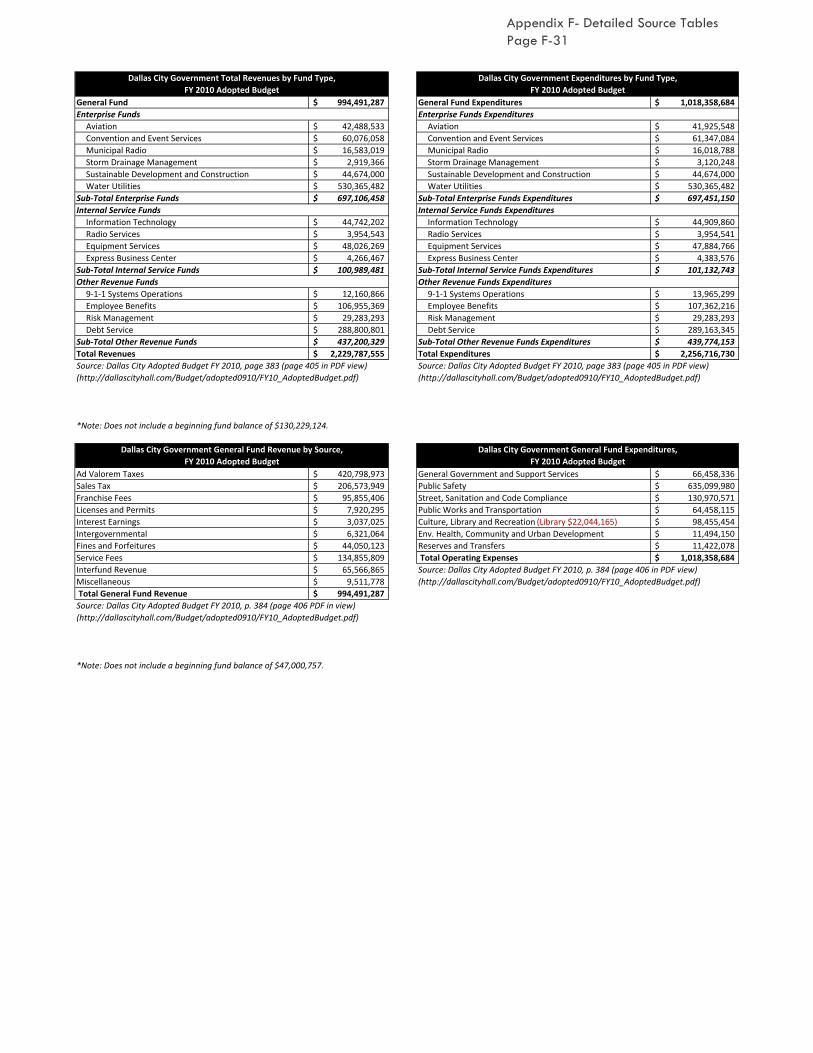
General Fund 994,491,287$ General Fund Expenditures 1,018,358,684$
Aviation 42,488,533$ Aviation 41,925,548$
Convention and Event Services 60,076,058$ Convention and Event Services 61,347,084$
Municipal Radio 16,583,019$ Municipal Radio 16,018,788$
Storm Drainage Management 2,919,366$ Storm Drainage Management 3,120,248$
Sustainable Development and Construction 44,674,000$ Sustainable Development and Construction 44,674,000$
Water Utilities 530,365,482$ Water Utilities 530,365,482$
Sub-Total Enterprise Funds 697,106,458$ Sub-Total Enterprise Funds Expenditures 697,451,150$
Information Technology 44,742,202$ Information Technology 44,909,860$
Radio Services 3,954,543$ Radio Services 3,954,541$
Equipment Services 48,026,269$ Equipment Services 47,884,766$
Express Business Center 4,266,467$ Express Business Center 4,383,576$
Sub-Total Internal Service Funds 100,989,481$ Sub-Total Internal Service Funds Expenditures 101,132,743$
9-1-1 Systems Operations 12,160,866$ 9-1-1 Systems Operations 13,965,299$
Employee Benefits 106,955,369$ Employee Benefits 107,362,216$
Risk Management 29,283,293$ Risk Management 29,283,293$
Debt Service 288,800,801$ Debt Service 289,163,345$
Sub-Total Other Revenue Funds 437,200,329$ Sub-Total Other Revenue Funds Expenditures 439,774,153$
Total Revenues 2,229,787,555$ Total Expenditures 2,256,716,730$
Ad Valorem Taxes 420,798,973$ General Government and Support Services 66,458,336$
Sales Tax 206,573,949$ Public Safety 635,099,980$
Franchise Fees 95,855,406$ Street, Sanitation and Code Compliance 130,970,571$
Licenses and Permits 7,920,295$ Public Works and Transportation 64,458,115$
Interest Earnings 3,037,025$ Culture, Library and Recreation (Library $22,044,165) 98,455,454$
Intergovernmental 6,321,064$ Env. Health, Community and Urban Development 11,494,150$
Fines and Forfeitures 44,050,123$ Reserves and Transfers 11,422,078$
Service Fees 134,855,809$ Total Operating Expenses 1,018,358,684$
Interfund Revenue 65,566,865$
Miscellaneous 9,511,778$
Total General Fund Revenue 994,491,287$
Other Revenue Funds Other Revenue Funds Expenditures
Dallas City Government General Fund Revenue by Source,
FY 2010 Adopted Budget
Dallas City Government General Fund Expenditures,
FY 2010 Adopted Budget
Source: Dallas City Adopted Budget FY 2010, page 383 (page 405 in PDF view)
(http://dallascityhall.com/Budget/adopted0910/FY10_AdoptedBudget.pdf)
Source: Dallas City Adopted Budget FY 2010, page 383 (page 405 in PDF view)
(http://dallascityhall.com/Budget/adopted0910/FY10_AdoptedBudget.pdf)
Source: Dallas City Adopted Budget FY 2010, p. 384 (page 406 PDF in view)
(http://dallascityhall.com/Budget/adopted0910/FY10_AdoptedBudget.pdf)
Source: Dallas City Adopted Budget FY 2010, p. 384 (page 406 in PDF view)
(http://dallascityhall.com/Budget/adopted0910/FY10_AdoptedBudget.pdf)
*Note: Does not include a beginning fund balance of $130,229,124.
*Note: Does not include a beginning fund balance of $47,000,757.
Dallas City Government Total Revenues by Fund Type,
FY 2010 Adopted Budget
Dallas City Government Expenditures by Fund Type,
FY 2010 Adopted Budget
Enterprise Funds Enterprise Funds Expenditures
Internal Service Funds Internal Service Funds Expenditures
Appendix F- Detailed Source Tables Page F-31

General Fund 8,014,643$ Personnel 5,186,315$
Enterprise/Internal Service/Other -$ Utilities and Equipment 574,734$
Additional resources 824,037$ Services, Maintenance, and Rental 1,649,943$
Sub-Total Central Library 8,838,680$ Capital Outlays (Books and Materials, etc.) 603,651$
Reimbursements and Refunds -$
General Fund 13,619,340$ Sub-Total Central Library 8,014,643$
Enterprise/Internal Service/Other -$
Additional resources 3,500$ Personnel 10,034,138$
Sub-Total Neighborhood Libraries 13,622,840$ Utilities and Equipment 960,947$
Services, Maintenance, and Rental 1,551,097$
General Fund 21,633,983$ Capital Outlays (Books and Materials, etc.) 1,073,158$
Enterprise/Internal Service/Other -$ Reimbursements and Refunds -$
Additional resources 827,537$ Sub-Total Neighborhood Libraries 13,619,340$
Sub-Total of Central and Neighborhood Libraries 22,461,520$
Personnel 15,220,453$
General Fund 410,182$ Utilities and Equipment 1,535,681$
Enterprise/Internal Service/Other -$ Services, Maintenance, and Rental 3,201,040$
Additional resources 104,384$ Capital Outlays (Books and Materials, etc.) 1,676,809$
Sub-Total Multicultural Services 514,566$ Reimbursements and Refunds -$
Total Library General Fund Revenue 22,044,165$ Sub-Total of Central and Neighborhood Libraries 21,633,983$
Total Library Enterprise/Internal Service Other -$ Multicultural Services
Total Additional Resources 931,921$ Personnel 347,196$
Total Revenues 22,976,086$ Utilities and Equipment 9,833$
Services, Maintenance, and Rental 53,153$
Capital Outlays (Books and Materials, etc.) -$
Reimbursements and Refunds -$
Sub-Total Multicultural Services 410,182$
Total Library Expenditures
Personnel 15,567,649$
Utilities and Equipment 1,545,514$
Services, Maintenance, and Rental 3,254,193$
Capital Outlays (Books and Materials, etc.) 1,676,809$
Reimbursements and Refunds -$
Total Library Expenditures 26,511,832$
Multicultural Services
Sum of Central and Neighborhood Libraries
Source: Dallas City Adopted Budget FY 2010, pages 246, 261, 265 (pages 268,
283, 287 in PDF view)
(http://dallascityhall.com/Budget/adopted0910/FY10_AdoptedBudget.pdf)
Source: Dallas City Adopted Budget FY 2010, Budget Line Item Details Query Search
(http://www2.dallascityhall.com/FY0910AdoptedBudget/FormAPrintView.aspx?id=4
33),
(http://www2.dallascityhall.com/FY0910AdoptedBudget/FormAPrintView.aspx?id=4
44),
(http://www2.dallascityhall.com/FY0910AdoptedBudget/FormAPrintView.aspx?id=1
82)
Neighborhood Libraries
Sum of Central and Neighborhood Libraries
Neighborhood Libraries
Dallas City Library Revenue by Source,
FY 2010 Adopted Budget
Dallas City Library Expenditures
FY 2010 Adopted Budget
Central Library Central Library
Appendix F- Detailed Source Tables Page F-32

General Fund 998,491,965$ General Fund Expenditures 1,006,046,874$
Aviation 47,006,853$ Aviation 47,006,853$
Convention and Event Services 58,635,607$ Convention and Event Services 58,635,607$
Municipal Radio 2,765,000$ Municipal Radio 2,717,088$
Storm Drainage Management 47,800,000$ Storm Drainage Management 50,118,965$
Sustainable Development and Construction 17,297,735$ Sustainable Development and Construction 16,791,073$
Water Utilities 531,240,295$ Water Utilities 531,240,295$
Sub-Total Enterprise Funds 704,745,490$ Sub-Total Enterprise Funds Expenditures 706,509,881$
Information Technology 44,400,799$ Information Technology 44,536,491$
Radio Services 3,618,348$ Radio Services 3,618,348$
Equipment Services 44,933,150$ Equipment Services 44,933,151$
Express Business Center 3,901,200$ Express Business Center 4,049,464$
Sub-Total Internal Service Funds 96,853,497$ Sub-Total Internal Service Funds Expenditures 97,137,454$
9-1-1 Systems Operations 13,457,487$ 9-1-1 Systems Operations 13,911,597$
Employee Benefits 109,601,072$ Employee Benefits 109,357,535$
Risk Management 30,785,460$ Risk Management 30,635,460$
Debt Service 259,659,516$ Debt Service 260,685,026$
Sub-Total Other Revenue Funds 413,503,535$ Sub-Total Other Revenue Funds Expenditures 414,589,618$
Total Revenues 2,213,594,487$ Total Expenditures 2,224,283,827$
Ad Valorem Taxes 435,784,656$ General Government and Support Services 68,675,539$
Sales Tax 204,810,104$ Public Safety 620,130,859$
Franchise Fees 97,150,282$ Street, Sanitation and Code Compliance 148,505,241$
Licenses and Permits 9,877,194$ Public Works and Transportation 50,155,427$
Interest Earnings 2,412,695$ Culture, Library and Recreation (Library $19,590,705) 95,820,574$
Intergovernmental 6,311,913$ Env. Health, Community and Urban Development 8,844,691$
Fines and Forfeitures 41,938,418$ Reserves and Transfers 13,914,543$
Service Fees 134,598,888$ Total Operating Expenses 1,006,046,874$
Interfund Revenue 52,661,965$
Miscellaneous 12,945,850$
Total General Fund Revenue 998,491,965$
*Note: Does not include a beginning fund balance of $97,629,095.
Other Revenue Funds Expenditures
*Note: Does not include a beginning fund balance of $39,992,767.
Source: Dallas City Adopted Budget FY 2011, p. 306 (page 306 PDF view)
(http://dallascityhall.com/Budget/adopted1011/FY11_adoptedBudget.pdf)
Source: Dallas City Adopted Budget FY 2011, p. 306 (page 306 in PDF view)
(http://dallascityhall.com/Budget/adopted1011/FY11_adoptedBudget.pdf)
Dallas City Government Total Revenues by Fund Type,
FY 2011 Adopted Budget
Dallas City Government Expenditures by Fund Type,
FY 2011 Adopted Budget
Dallas City Government General Fund Revenue by Source,
FY 2011 Adopted Budget
Dallas City Government General Fund Expenditures,
FY 2011 Adopted Budget
Enterprise Funds
Internal Service Funds
Other Revenue Funds
Enterprise Funds Expenditures
Internal Service Funds Expenditures
Source: Dallas City Adopted Budget FY 2011, p. 305 (page 305 in PDF view)
(http://dallascityhall.com/Budget/adopted1011/FY11_adoptedBudget.pdf)
Source: Dallas City Adopted Budget FY 2011, p. 305 (page 305 in PDF view)
(http://dallascityhall.com/Budget/adopted1011/FY11_adoptedBudget.pdf)
Appendix F- Detailed Source Tables Page F-33
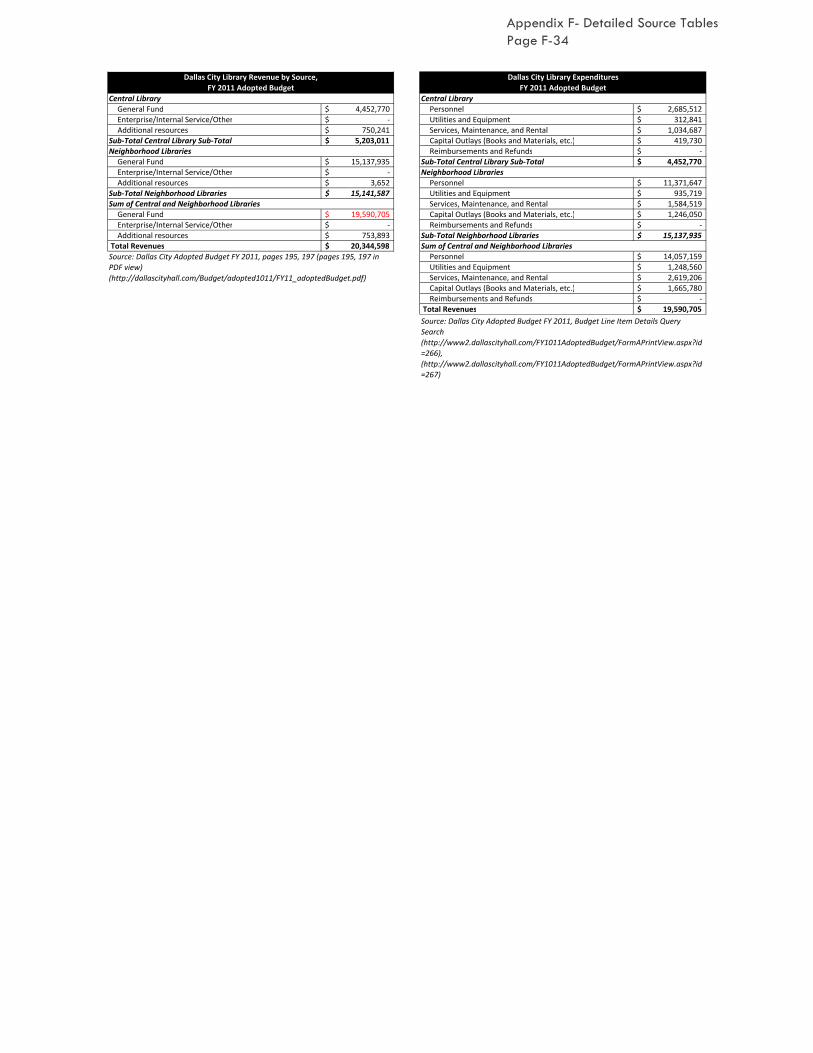
General Fund 4,452,770$ Personnel 2,685,512$
Enterprise/Internal Service/Other -$ Utilities and Equipment 312,841$
Additional resources 750,241$ Services, Maintenance, and Rental 1,034,687$
Sub-Total Central Library Sub-Total 5,203,011$ Capital Outlays (Books and Materials, etc.) 419,730$
Reimbursements and Refunds -$
General Fund 15,137,935$ Sub-Total Central Library Sub-Total 4,452,770$
Enterprise/Internal Service/Other -$
Additional resources 3,652$ Personnel 11,371,647$
Sub-Total Neighborhood Libraries 15,141,587$ Utilities and Equipment 935,719$
Services, Maintenance, and Rental 1,584,519$
General Fund 19,590,705$ Capital Outlays (Books and Materials, etc.) 1,246,050$
Enterprise/Internal Service/Other -$ Reimbursements and Refunds -$
Additional resources 753,893$ Sub-Total Neighborhood Libraries 15,137,935$
Total Revenues 20,344,598$
Personnel 14,057,159$
Utilities and Equipment 1,248,560$
Services, Maintenance, and Rental 2,619,206$
Capital Outlays (Books and Materials, etc.) 1,665,780$
Reimbursements and Refunds -$
Total Revenues 19,590,705$
Source: Dallas City Adopted Budget FY 2011, pages 195, 197 (pages 195, 197 in
PDF view)
(http://dallascityhall.com/Budget/adopted1011/FY11_adoptedBudget.pdf)
Source: Dallas City Adopted Budget FY 2011, Budget Line Item Details Query
Search
(http://www2.dallascityhall.com/FY1011AdoptedBudget/FormAPrintView.aspx?id
=266),
(http://www2.dallascityhall.com/FY1011AdoptedBudget/FormAPrintView.aspx?id
=267)
Sum of Central and Neighborhood Libraries
Neighborhood Libraries
Sum of Central and Neighborhood Libraries
Neighborhood Libraries
Dallas City Library Expenditures
FY 2011 Adopted Budget
Central Library
Dallas City Library Revenue by Source,
FY 2011 Adopted Budget
Central Library
Appendix F- Detailed Source Tables Page F-34

General Fund 1,011,365,209$ General Fund Expenditures 1,011,365,209$
Aviation 47,682,030$ Aviation 47,682,030$ Convention and Event Services 59,771,697$ Convention and Event Services 59,404,269$ Municipal Radio 2,841,500$ Municipal Radio 2,798,232$ Storm Drainage Management 49,198,588$ Storm Drainage Management 51,563,357$ Sustainable Development and Construction 17,932,127$ Sustainable Development and Construction 17,900,104$ Water Utilities 551,600,305$ Water Utilities 551,825,789$
Sub‐Total Enterprise Funds 729,026,247$ Sub‐Total Enterprise Funds Expenditures 731,173,781$
Information Technology 42,719,550$ Information Technology 44,620,206$ Radio Services 3,422,932$ Radio Services 3,435,654$ Equipment Services 47,743,439$ Equipment Services 47,812,372$ Express Business Center 3,924,281$ Express Business Center 3,868,049$
Sub‐Total Internal Service Funds 97,810,202$ Sub‐Total Internal Service Funds Expenditures 99,736,281$
9‐1‐1 Systems Operations 13,075,049$ 9‐1‐1 Systems Operations 13,906,328$ Employee Benefits 117,041,421$ Employee Benefits 116,440,244$ Risk Management 22,359,493$ Risk Management 24,385,716$ Debt Service 248,494,257$ Debt Service 248,845,430$
Sub‐Total Other Revenue Funds 400,970,220$ Sub‐Total Other Revenue Funds Expenditures 403,577,718$ Total Revenues 2,239,171,878$ Total Expenditures 2,245,852,989$
Ad Valorem Taxes 433,217,886$ General Government and Support Services 70,403,954$ Sales Tax 215,508,103$ Public Safety 626,836,171$ Franchise Fees 102,468,537$ Street, Sanitation and Code Compliance 173,575,245$ Licenses and Permits 9,747,273$ Public Works and Transportation 23,102,648$ Interest Earnings 914,115$ Culture, Library and Recreation (Library $18,422,241) 96,960,533$ Intergovernmental 5,430,176$ Env. Health, Community and Urban Development 9,835,346$ Fines and Forfeitures 39,368,346$ Reserves and Transfers 10,651,312$ Service Fees 131,610,139$ Total Operating Expenses 1,011,365,209$ Interfund Revenue 60,584,402$ Miscellaneous 12,516,232$ Total General Fund Revenue 1,011,365,209$
Source: Dallas City Adopted Budget FY 2012, p. 292 (page 292 in PDF view)
(http://dallascityhall.com/Budget/adopted_1112/Adopted%20FY12_BudgetBook.
pdf)Source: Dallas City Adopted Budget FY 2012, p. 292 (page 292 PDF view)
(http://dallascityhall.com/Budget/adopted_1112/Adopted%20FY12_BudgetBook.
pdf)
*Note: Does not include a beginning fund balance of $42,472,515.
Dallas City Government General Fund Revenue by Source,
FY 2012 Adopted Budget
Dallas City Government General Fund Expenditures,
FY 2012 Adopted Budget
Dallas City Government Total Revenues by Fund Type,
FY 2012 Adopted Budget
Dallas City Government Expenditures by Fund Type,
FY 2012 Adopted Budget
Enterprise Funds Enterprise Funds Expenditures
Internal Service Funds Internal Service Funds Expenditures
Other Revenue Funds Other Revenue Funds Expenditures
Source: Dallas City Adopted Budget FY 2012, p. 291 (page 291 in PDF view)
(http://dallascityhall.com/Budget/adopted_1112/Adopted%20FY12_BudgetBook.
pdf)
Source: Dallas City Adopted Budget FY 2012, p. 291 (page 291 in PDF view)
(http://dallascityhall.com/Budget/adopted_1112/Adopted%20FY12_BudgetBook.
pdf)
*Note: Does not include a beginning fund balance of $97,629,095.
Appendix F- Detailed Source Tables Page F-35
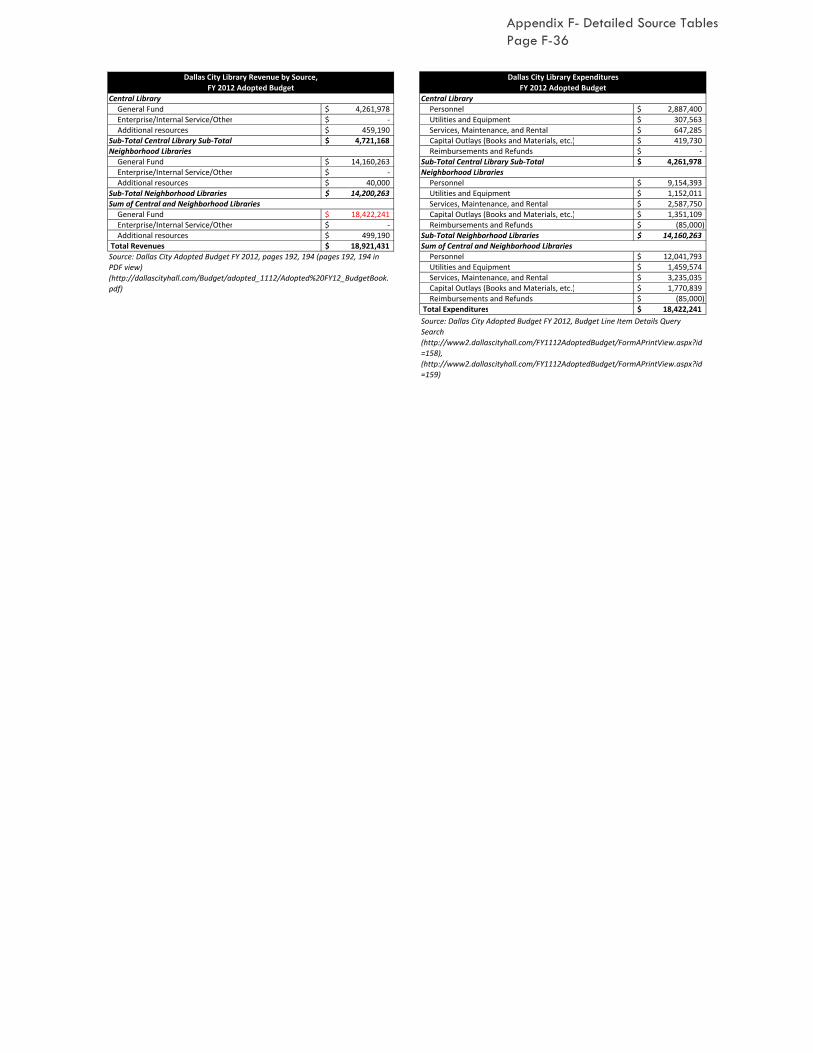
General Fund 4,261,978$ Personnel 2,887,400$ Enterprise/Internal Service/Other ‐$ Utilities and Equipment 307,563$ Additional resources 459,190$ Services, Maintenance, and Rental 647,285$
Sub‐Total Central Library Sub‐Total 4,721,168$ Capital Outlays (Books and Materials, etc.) 419,730$ Reimbursements and Refunds ‐$
General Fund 14,160,263$ Sub‐Total Central Library Sub‐Total 4,261,978$ Enterprise/Internal Service/Other ‐$ Additional resources 40,000$ Personnel 9,154,393$
Sub‐Total Neighborhood Libraries 14,200,263$ Utilities and Equipment 1,152,011$ Services, Maintenance, and Rental 2,587,750$
General Fund 18,422,241$ Capital Outlays (Books and Materials, etc.) 1,351,109$ Enterprise/Internal Service/Other ‐$ Reimbursements and Refunds (85,000)$ Additional resources 499,190$ Sub‐Total Neighborhood Libraries 14,160,263$
Total Revenues 18,921,431$ Personnel 12,041,793$ Utilities and Equipment 1,459,574$ Services, Maintenance, and Rental 3,235,035$ Capital Outlays (Books and Materials, etc.) 1,770,839$ Reimbursements and Refunds (85,000)$
Total Expenditures 18,422,241$
Source: Dallas City Adopted Budget FY 2012, Budget Line Item Details Query
Search
(http://www2.dallascityhall.com/FY1112AdoptedBudget/FormAPrintView.aspx?id
=158),
(http://www2.dallascityhall.com/FY1112AdoptedBudget/FormAPrintView.aspx?id
=159)
Dallas City Library Revenue by Source,
FY 2012 Adopted Budget
Dallas City Library Expenditures
FY 2012 Adopted Budget
Central Library Central Library
Neighborhood Libraries
Neighborhood Libraries
Sum of Central and Neighborhood Libraries
Sum of Central and Neighborhood Libraries
Source: Dallas City Adopted Budget FY 2012, pages 192, 194 (pages 192, 194 in
PDF view)
(http://dallascityhall.com/Budget/adopted_1112/Adopted%20FY12_BudgetBook.
pdf)
Appendix F- Detailed Source Tables Page F-36

General Fund* $ 641,243,022 General Fund $ 641,243,022
Risk Management Fund $ 2,296,170 Risk Management Fund $ 2,296,170
Swap Agreement Fund $ 517,443 Swap Agreement Fund $ 517,443
Capital Improvement Plan Fund $ 37,140,036 Capital Improvement Plan Fund $ 37,140,036
Cafeteria Plan $ 13,750,000 Cafeteria Plan $ 13,750,000
Special Revenue Funds $ 6,686,995 Special Revenue Funds $ 6,686,995
Debt Service Fund $ 40,122,121 Debt Service Fund $ 40,122,121
Enterprise Funds $ 9,379,754 Enterprise Funds $ 9,379,754
Trust Funds $ 7,942,532 Trust Funds $ 7,942,532
Total Revenues 759,078,073$ Total Expenditures 759,078,073$
Taxes 234,903,747$ General government 30,988,093$
Licenses and permits 832,000$ Public safety 46,101,830$
Intergovernmental revenues 361,782,723$ Transportation 12,500$
Contributions and donations 909,829$ Environmental protection 3,413,785$
Investment income 2,000,000$ Economic and physical development 4,380,168$
Rental income 1,552,373$ Human services 414,917,246$
Charges for services 14,894,298$ Education 102,687,849$
Sewer connection fees 656,000$ Cultural and recreational (Library $9,419,649) 11,258,150$
Other revenues 743,900$ Other 27,483,401$
Other Financing Sources 22,968,152$ Total Operating Expenses 641,243,022$
Total General Fund Revenue 641,243,022$
General Fund (budgeted)* $ 9,419,649 Personnel 6,443,640$
Intergovernmental 268,000$ Operating 2,976,009$
Contrib. and donations 2,000$ Capital -$
Service charges 313,000$ Total Expenditures 9,419,649$
Other revenue 300$
Total Revenue 10,002,949$
Durham County Total Revenues by Fund Group
FY 2008 Adopted Budget
Durham County Total Expenditures by Fund Group
FY 2008 Adopted Budget
Source: Durham County Adopted Budget FY 2008, Summary Information pages 4, 12
(pages 4, 12 in pdf view)
(http://www.co.durham.nc.us/departments/bdmg/_ARCHIVE/Budgets/FY07-
08/Adopted/PDF/02_Summary.pdf)
Source: Durham County Adopted Budget FY 2008, Summary Information p. 13 (page
13 in pdf view)
(http://www.co.durham.nc.us/departments/bdmg/_ARCHIVE/Budgets/FY07-
08/Adopted/PDF/02_Summary.pdf)
Durham County General Funds Revenue by Source
FY 2008 Adopted Budget
Durham County General Funds Expenditures
FY 2008 Adopted Budget
*Note: Revenue includes DSS Pass Through Funds of $288,458,174.
*Note: The county reports the share of the library's general fund as an expenditure.
Thus, for the purpose of this report, the library's general fund revenue was budgeted
from the county's general fund budget above. If the library's share of the general fund
is not considered a revenue source for the library, its total revenues would only be
$583,300 ($268,000 from Intergovernmental + $2,000 from Contributions and
Donations + $313,000 for Service charges + $300 for Other revenue) for the 2008
fiscal year (p. 225 or page 5 in PDF view)
Source: Durham County Adopted Budget FY 2008, Summary Information pages 2-4
(pages 2-4 in pdf view)
(http://www.co.durham.nc.us/departments/bdmg/_ARCHIVE/Budgets/FY07-
08/Adopted/PDF/02_Summary.pdf)
Source: Durham County Adopted Budget FY 2008, Summary Information pages 10-11
(pages 10-11 in pdf view)
(http://www.co.durham.nc.us/departments/bdmg/_ARCHIVE/Budgets/FY07-
08/Adopted/PDF/02_Summary.pdf)
Durham County Public Libraries Revenue by Source
FY 2008 Adopted Budget
Durham County Public Libraries Expenditures
FY 2008 Adopted Budget
Source: Durham County Adopted Budget FY 2008, p. 225 (page 5 in pdf view)
(http://www.co.durham.nc.us/departments/bdmg/_ARCHIVE/Budgets/FY07-
08/Adopted/PDF/10_Culture_Recreation_N.pdf)Source: Durham County Adopted Budget FY 2008, p. 225 (page 5 in pdf view)
(http://www.co.durham.nc.us/departments/bdmg/_ARCHIVE/Budgets/FY07-
08/Adopted/PDF/10_Culture_Recreation_N.pdf)
*Note: Revenue includes DSS Pass Through Funds of $288,458,174.
Appendix F- Detailed Source Tables Page F-37
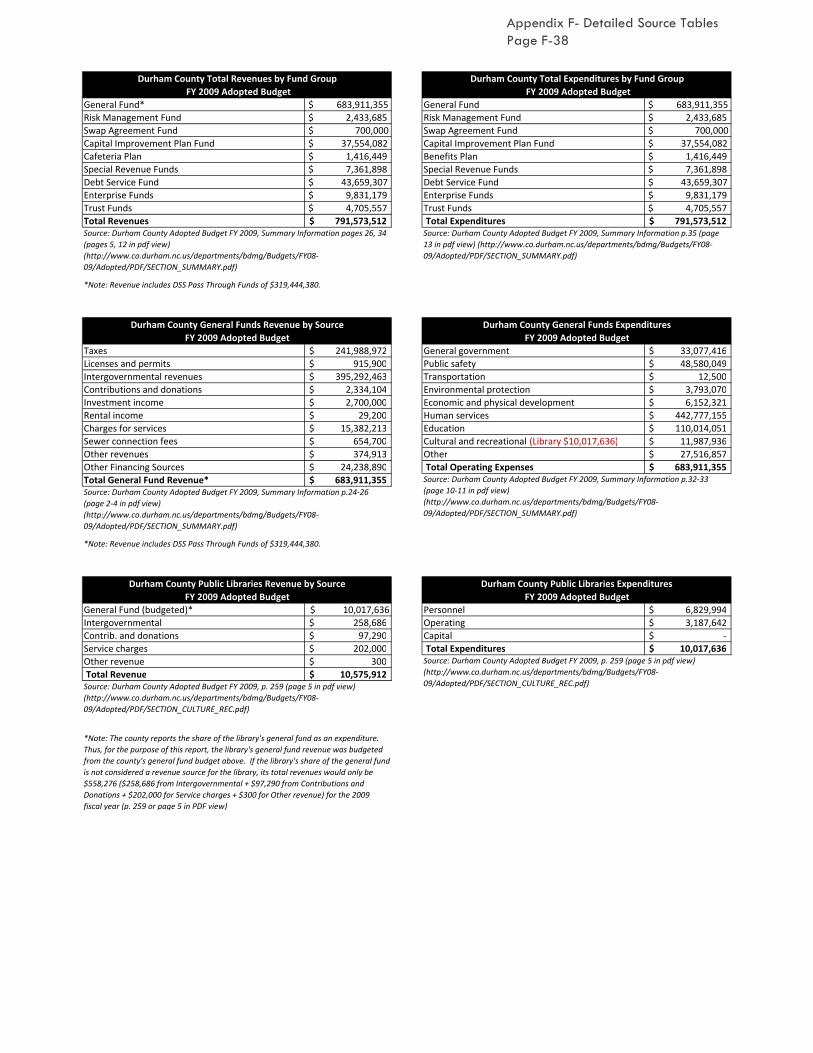
General Fund* $ 683,911,355 General Fund $ 683,911,355
Risk Management Fund $ 2,433,685 Risk Management Fund $ 2,433,685
Swap Agreement Fund $ 700,000 Swap Agreement Fund $ 700,000
Capital Improvement Plan Fund $ 37,554,082 Capital Improvement Plan Fund $ 37,554,082
Cafeteria Plan $ 1,416,449 Benefits Plan $ 1,416,449
Special Revenue Funds $ 7,361,898 Special Revenue Funds $ 7,361,898
Debt Service Fund $ 43,659,307 Debt Service Fund $ 43,659,307
Enterprise Funds $ 9,831,179 Enterprise Funds $ 9,831,179
Trust Funds $ 4,705,557 Trust Funds $ 4,705,557
Total Revenues 791,573,512$ Total Expenditures 791,573,512$
Taxes 241,988,972$ General government 33,077,416$
Licenses and permits 915,900$ Public safety 48,580,049$
Intergovernmental revenues 395,292,463$ Transportation 12,500$
Contributions and donations 2,334,104$ Environmental protection 3,793,070$
Investment income 2,700,000$ Economic and physical development 6,152,321$
Rental income 29,200$ Human services 442,777,155$
Charges for services 15,382,213$ Education 110,014,051$
Sewer connection fees 654,700$ Cultural and recreational (Library $10,017,636) 11,987,936$
Other revenues 374,913$ Other 27,516,857$
Other Financing Sources 24,238,890$ Total Operating Expenses 683,911,355$
Total General Fund Revenue* 683,911,355$
General Fund (budgeted)* $ 10,017,636 Personnel 6,829,994$
Intergovernmental 258,686$ Operating 3,187,642$
Contrib. and donations 97,290$ Capital -$
Service charges 202,000$ Total Expenditures 10,017,636$
Other revenue 300$
Total Revenue 10,575,912$
*Note: The county reports the share of the library's general fund as an expenditure.
Thus, for the purpose of this report, the library's general fund revenue was budgeted
from the county's general fund budget above. If the library's share of the general fund
is not considered a revenue source for the library, its total revenues would only be
$558,276 ($258,686 from Intergovernmental + $97,290 from Contributions and
Donations + $202,000 for Service charges + $300 for Other revenue) for the 2009
fiscal year (p. 259 or page 5 in PDF view)
Durham County Total Revenues by Fund Group
FY 2009 Adopted Budget
Durham County Total Expenditures by Fund Group
FY 2009 Adopted Budget
Source: Durham County Adopted Budget FY 2009, p. 259 (page 5 in pdf view)
(http://www.co.durham.nc.us/departments/bdmg/Budgets/FY08-
09/Adopted/PDF/SECTION_CULTURE_REC.pdf)
Source: Durham County Adopted Budget FY 2009, Summary Information pages 26, 34
(pages 5, 12 in pdf view)
(http://www.co.durham.nc.us/departments/bdmg/Budgets/FY08-
09/Adopted/PDF/SECTION_SUMMARY.pdf)
Source: Durham County Adopted Budget FY 2009, Summary Information p.35 (page
13 in pdf view) (http://www.co.durham.nc.us/departments/bdmg/Budgets/FY08-
09/Adopted/PDF/SECTION_SUMMARY.pdf)
Durham County General Funds Revenue by Source
FY 2009 Adopted Budget
Durham County General Funds Expenditures
FY 2009 Adopted Budget
Source: Durham County Adopted Budget FY 2009, Summary Information p.32-33
(page 10-11 in pdf view)
(http://www.co.durham.nc.us/departments/bdmg/Budgets/FY08-
09/Adopted/PDF/SECTION_SUMMARY.pdf)
Durham County Public Libraries Revenue by Source
FY 2009 Adopted Budget
Durham County Public Libraries Expenditures
FY 2009 Adopted Budget
Source: Durham County Adopted Budget FY 2009, p. 259 (page 5 in pdf view)
(http://www.co.durham.nc.us/departments/bdmg/Budgets/FY08-
09/Adopted/PDF/SECTION_CULTURE_REC.pdf)
Source: Durham County Adopted Budget FY 2009, Summary Information p.24-26
(page 2-4 in pdf view)
(http://www.co.durham.nc.us/departments/bdmg/Budgets/FY08-
09/Adopted/PDF/SECTION_SUMMARY.pdf)
*Note: Revenue includes DSS Pass Through Funds of $319,444,380.
*Note: Revenue includes DSS Pass Through Funds of $319,444,380.
Appendix F- Detailed Source Tables Page F-38

General Fund* $ 705,376,451 General Funds $ 759,679,789
Risk Management Fund $ 2,430,287 Risk Management Fund
Swap Agreement Fund $ 550,000 Swap Agreement Fund
Capital Improvement Plan Fund $ 38,385,437 Capital Improvement Plan Fund
Benefits Plan $ 12,937,614 Benefits Plan
Special Revenue Funds $ 6,167,042 Special Revenue Funds $ 6,167,042
Debt Service Fund $ 47,456,677 Debt Service Fund $ 47,456,677
Enterprise Funds $ 8,944,803 Enterprise Funds $ 8,944,803
Trust Funds $ 8,725,279 Trust Funds $ 8,725,279
Total Revenues 830,973,590$ Total Expenditures 830,973,590$
Taxes 237,381,950$ General government 29,398,309$
Licenses and permits 713,391$ Public safety 43,382,053$
Intergovernmental revenues 438,552,103$ Transportation 12,500$
Contributions and donations 1,137,257$ Environmental protection 3,464,315$
Investment income 1,165,000$ Economic and physical development 5,178,116$
Rental income 63,595$ Human services 474,464,053$
Charges for services 13,418,983$ Education 106,950,853$
Sewer connection fees 656,000$ Cultural and recreational (Library $8,765,538) 10,576,863$
Other revenues 235,907$ Other 31,949,389$
Other financing Sources 12,052,265$ Total Operating Expenses 705,376,451$
Total General Fund Revenue* 705,376,451$
General Fund (budgeted)* $ 8,765,538 Personnel 6,080,565$
Intergovernmental 250,000$ Operating 2,684,973$
Contrib. and donations 76,710$ Total Expenditures 8,765,538$
Service charges 207,200$
Other revenue 300$
Total Revenue 9,299,748$
Durham County Total Revenues by Fund Group
FY 2010 Adopted Budget
Durham County Total Expenditures by Fund Group
FY 2010 Adopted Budget
Source: Durham County Adopted Budget FY 2010, Summary Information pages 28, 36
(pages 4, 12 in pdf view)
(http://www.co.durham.nc.us/departments/bdmg/Budgets/FY09-
10/Adopted/PDF/SummarySection.pdf)
Source: Durham County Adopted Budget FY 2010, Summary Information p. 37 (page
13 in pdf view) (http://www.co.durham.nc.us/departments/bdmg/Budgets/FY09-
10/Adopted/PDF/SummarySection.pdf)
Durham County General Funds Revenue by Source
FY 2010 Adopted Budget
Durham County General Funds Expenditures
FY 2010 Adopted Budget
*Note: The county reports the share of the library's general fund as an expenditure.
Thus, for the purpose of this report, the library's general fund revenue was budgeted
from the county's general fund budget above. If the library's share of the general fund
is not considered a revenue source for the library, its total revenues would only be
$534,210 ($250,000 from Intergovernmental + $76,710 from Contributions and
Donations + $207,200 for Service charges + $300 for Other revenue) for the 2010
fiscal year (p. 263 or page 5 in PDF view)
*Note: Revenue includes DSS Pass Through Funds of $368,393,153.
*Note: Revenue includes DSS Pass Through Funds of $368,393,153.
Source: Durham County Adopted Budget FY 2010, p. 263 (page 5 in pdf view)
(http://www.co.durham.nc.us/departments/bdmg/Budgets/FY09-
10/Adopted/PDF/CultureRecreationSection.pdf)
Source: Durham County Adopted Budget FY 2010, p. 34-35 (page 10-11 in pdf view)
(http://www.co.durham.nc.us/departments/bdmg/Budgets/FY09-
10/Adopted/PDF/AppendixSection.pdf)
Durham County Public Libraries Revenue by Source
FY 2010 Adopted Budget
Durham County Public Libraries Expenditures
FY 2010 Adopted Budget
Source: Durham County Adopted Budget FY 2010, Summary Information p. 26-28
(page 2-4 in pdf view)
(http://www.co.durham.nc.us/departments/bdmg/Budgets/FY09-
10/Adopted/PDF/SummarySection.pdf)
Source: Durham County Adopted Budget FY 2010, p. 263 (page 5 in pdf view)
(http://www.co.durham.nc.us/departments/bdmg/Budgets/FY09-
10/Adopted/PDF/CultureRecreationSection.pdf)
Appendix F- Detailed Source Tables Page F-39

General Fund $ 343,550,235 General Fund $ 343,550,235
Risk Management Fund $ 2,463,115 Risk Management Fund $ 2,463,115
Swap Agreement Fund $ 750,000 Swap Agreement Fund $ 750,000
Capital Improvement Plan Fund $ 35,621,302 Capital Improvement Plan Fund $ 35,621,302
Benefits Plan $ 15,261,793 Benefits Plan $ 15,261,793
Special Revenue Funds $ 6,479,925 Special Revenue Funds $ 6,479,925
Debt Service $ 43,687,782 Debt Service $ 43,687,782
Enterprise Funds $ 8,912,355 Enterprise Funds $ 8,912,355
Trust Funds $ 4,454,984 Trust Funds $ 4,454,984
Total Revenues 461,181,491$ Total Expenditures 461,181,491$
Taxes 243,732,809$ General government 64,670,271$
Licenses and permits 608,270$ Public safety 43,087,925$
Intergovernmental revenues 71,489,095$ Transportation 12,500$
Contributions and donations 1,100,742$ Environmental protection 3,448,772$
Investment income 452,543$ Economic and physical development 5,224,466$
Rental income 95,376$ Human services 103,138,107$
Charges for services 12,736,404$ Education 113,025,293$
Sewer connection fees 655,641$ Cultural and recreational (Library $9,142,882) 10,942,901$
Other revenues 185,911$ Total Operating Expenses 343,550,235$
Other financing sources 12,493,444$
Total General Fund Revenue 343,550,235$
General Fund (budgeted)* $ 9,142,882 Personnel 6,591,948$
Intergovernmental 240,000$ Operating 2,519,006$
Contrib. and donations 26,650$ Capital 31,928$
Service charges 199,000$ Total Expenditures 9,142,882$
Other revenue 300$
Total Revenues 9,608,832$
*Note: The county reports the share of the library's general fund as an expenditure.
Thus, for the purpose of this report, the library's general fund revenue was budgeted
from the county's general fund budget above. If the library's share of the general fund
is not considered a revenue source for the library, its total revenues would only be
$465,950 ($240,000 from Intergovernmental + $26,650 from Contributions and
Donations + $199,000 for Service charges + $300 for Other revenue) for the 2011
fiscal year (p. 275 or page 5 in PDF view
Durham County Total Revenues by Fund Group,
FY 2011 Adopted Budget
Durham County Total Expenditures by Fund Group,
FY 2011 Adopted Budget
Source: Durham County Adopted Budget FY 2011, Summary Information page 39
(page 13 in PDF view)
(http://www.co.durham.nc.us/departments/bdmg/Budgets/FY10-
11/Adopted/PDF/03-Summary%20Section.pdf)
Source: Durham County Adopted Budget FY 2011, Summary Information pages 30, 38
(pages 4, 12 in PDF view)
(http://www.co.durham.nc.us/departments/bdmg/Budgets/FY10-
11/Adopted/PDF/03-Summary%20Section.pdf)
Source: Durham County Adopted Budget FY 2011, Summary Information pages 27-30
(pages 1-4 in PDF view)
(http://www.co.durham.nc.us/departments/bdmg/Budgets/FY10-
11/Adopted/PDF/03-Summary%20Section.pdf)
Durham County Public Libraries Expenditures
FY 2011 Adopted Budget
Durham County Public Libraries Revenue by Source
FY 2011 Adopted Budget
Durham County General Funds Revenue by Source,
FY 2011 Adopted Budget
Durham County General Funds Expenditures
FY 2011 Adopted Budget
Source: Durham County Adopted Budget FY 2011, p. 275 (page 3 in PDF view)
(http://www.co.durham.nc.us/departments/bdmg/Budgets/FY10-
11/Adopted/PDF/12-Culture_Recreation%20Section.pdf)
Source: Durham County Adopted Budget FY 2011, Summary Information pages 35-37
(pages 9-11 in PDF view)
(http://www.co.durham.nc.us/departments/bdmg/Budgets/FY10-
11/Adopted/PDF/03-Summary%20Section.pdf)
Source: Durham County Adopted Budget FY 2011, p. 275 (page 3 in PDF view)
(http://www.co.durham.nc.us/departments/bdmg/Budgets/FY10-
11/Adopted/PDF/12-Culture_Recreation%20Section.pdf)
Appendix F- Detailed Source Tables Page F-40
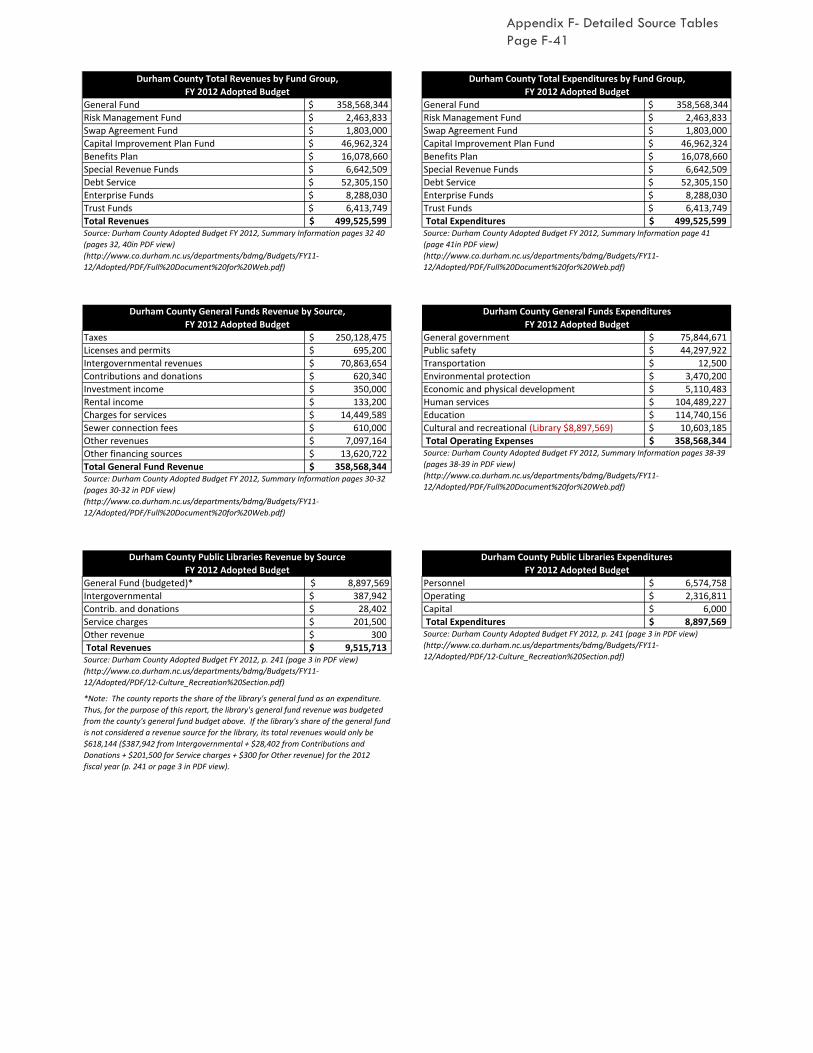
General Fund $ 358,568,344 General Fund $ 358,568,344
Risk Management Fund $ 2,463,833 Risk Management Fund $ 2,463,833
Swap Agreement Fund $ 1,803,000 Swap Agreement Fund $ 1,803,000
Capital Improvement Plan Fund $ 46,962,324 Capital Improvement Plan Fund $ 46,962,324
Benefits Plan $ 16,078,660 Benefits Plan $ 16,078,660
Special Revenue Funds $ 6,642,509 Special Revenue Funds $ 6,642,509
Debt Service $ 52,305,150 Debt Service $ 52,305,150
Enterprise Funds $ 8,288,030 Enterprise Funds $ 8,288,030
Trust Funds $ 6,413,749 Trust Funds $ 6,413,749
Total Revenues 499,525,599$ Total Expenditures 499,525,599$
Taxes 250,128,475$ General government 75,844,671$
Licenses and permits 695,200$ Public safety 44,297,922$
Intergovernmental revenues 70,863,654$ Transportation 12,500$
Contributions and donations 620,340$ Environmental protection 3,470,200$
Investment income 350,000$ Economic and physical development 5,110,483$
Rental income 133,200$ Human services 104,489,227$
Charges for services 14,449,589$ Education 114,740,156$
Sewer connection fees 610,000$ Cultural and recreational (Library $8,897,569) 10,603,185$
Other revenues 7,097,164$ Total Operating Expenses 358,568,344$
Other financing sources 13,620,722$
Total General Fund Revenue 358,568,344$
General Fund (budgeted)* $ 8,897,569 Personnel 6,574,758$
Intergovernmental 387,942$ Operating 2,316,811$
Contrib. and donations 28,402$ Capital 6,000$
Service charges 201,500$ Total Expenditures 8,897,569$
Other revenue 300$
Total Revenues 9,515,713$
Durham County Total Revenues by Fund Group,
FY 2012 Adopted Budget
Durham County Total Expenditures by Fund Group,
FY 2012 Adopted Budget
Source: Durham County Adopted Budget FY 2012, Summary Information pages 32 40
(pages 32, 40in PDF view)
(http://www.co.durham.nc.us/departments/bdmg/Budgets/FY11‐
12/Adopted/PDF/Full%20Document%20for%20Web.pdf)
Source: Durham County Adopted Budget FY 2012, Summary Information page 41
(page 41in PDF view)
(http://www.co.durham.nc.us/departments/bdmg/Budgets/FY11‐
12/Adopted/PDF/Full%20Document%20for%20Web.pdf)
Durham County General Funds Revenue by Source,
FY 2012 Adopted Budget
Durham County General Funds Expenditures
FY 2012 Adopted Budget
*Note: The county reports the share of the library's general fund as an expenditure.
Thus, for the purpose of this report, the library's general fund revenue was budgeted
from the county's general fund budget above. If the library's share of the general fund
is not considered a revenue source for the library, its total revenues would only be
$618,144 ($387,942 from Intergovernmental + $28,402 from Contributions and
Donations + $201,500 for Service charges + $300 for Other revenue) for the 2012
fiscal year (p. 241 or page 3 in PDF view).
Source: Durham County Adopted Budget FY 2012, Summary Information pages 38‐39
(pages 38‐39 in PDF view)
(http://www.co.durham.nc.us/departments/bdmg/Budgets/FY11‐
12/Adopted/PDF/Full%20Document%20for%20Web.pdf)Source: Durham County Adopted Budget FY 2012, Summary Information pages 30‐32
(pages 30‐32 in PDF view)
(http://www.co.durham.nc.us/departments/bdmg/Budgets/FY11‐
12/Adopted/PDF/Full%20Document%20for%20Web.pdf)
Durham County Public Libraries Revenue by Source
FY 2012 Adopted Budget
Durham County Public Libraries Expenditures
FY 2012 Adopted Budget
Source: Durham County Adopted Budget FY 2012, p. 241 (page 3 in PDF view)
(http://www.co.durham.nc.us/departments/bdmg/Budgets/FY11‐
12/Adopted/PDF/12‐Culture_Recreation%20Section.pdf)Source: Durham County Adopted Budget FY 2012, p. 241 (page 3 in PDF view)
(http://www.co.durham.nc.us/departments/bdmg/Budgets/FY11‐
12/Adopted/PDF/12‐Culture_Recreation%20Section.pdf)
Appendix F- Detailed Source Tables Page F-41
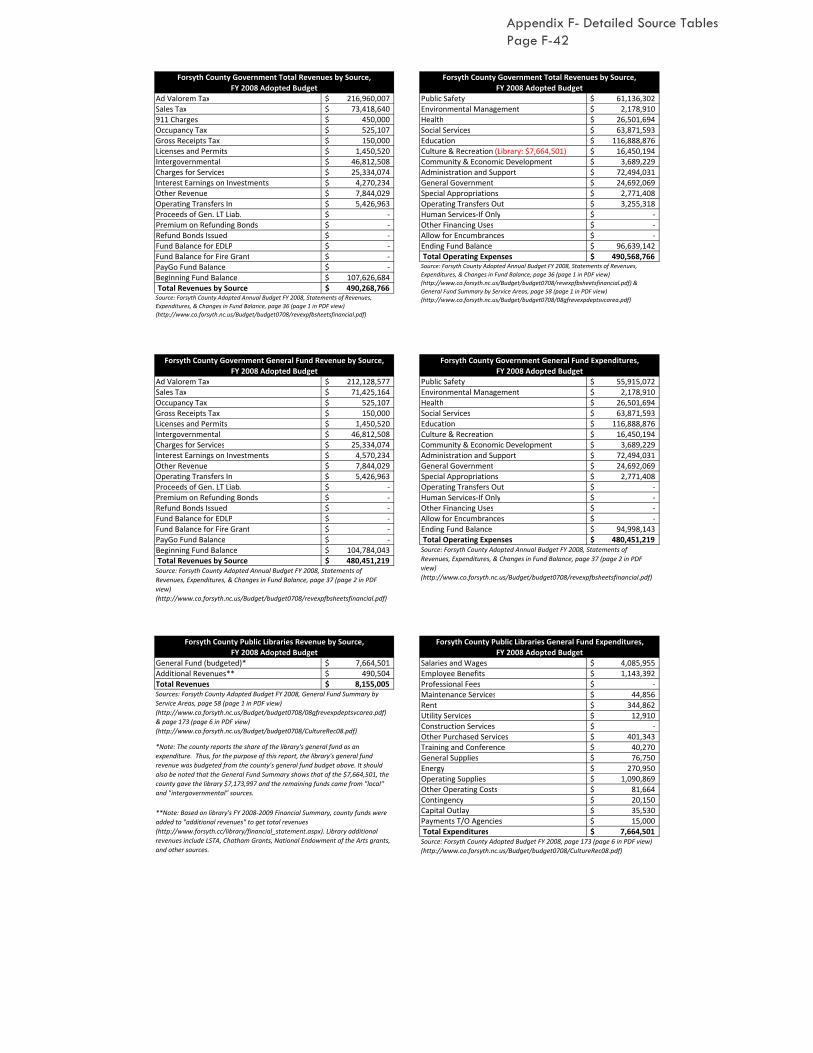
Forsyth Co
Ad Valorem Tax 216,960,007$ Public Safety 61,136,302$
Sales Tax 73,418,640$ Environmental Management 2,178,910$
911 Charges 450,000$ Health 26,501,694$
Occupancy Tax 525,107$ Social Services 63,871,593$
Gross Receipts Tax 150,000$ Education 116,888,876$
Licenses and Permits 1,450,520$ Culture & Recreation (Library: $7,664,501) 16,450,194$
Intergovernmental 46,812,508$ Community & Economic Development 3,689,229$
Charges for Services 25,334,074$ Administration and Support 72,494,031$
Interest Earnings on Investments 4,270,234$ General Government 24,692,069$
Other Revenue 7,844,029$ Special Appropriations 2,771,408$
Operating Transfers In 5,426,963$ Operating Transfers Out 3,255,318$
Proceeds of Gen. LT Liab. -$ Human Services-If Only -$
Premium on Refunding Bonds -$ Other Financing Uses -$
Refund Bonds Issued -$ Allow for Encumbrances -$
Fund Balance for EDLP -$ Ending Fund Balance 96,639,142$
Fund Balance for Fire Grant -$ Total Operating Expenses 490,568,766$
PayGo Fund Balance -$
Beginning Fund Balance 107,626,684$
Total Revenues by Source 490,268,766$
Ad Valorem Tax 212,128,577$ Public Safety 55,915,072$
Sales Tax 71,425,164$ Environmental Management 2,178,910$
Occupancy Tax 525,107$ Health 26,501,694$
Gross Receipts Tax 150,000$ Social Services 63,871,593$
Licenses and Permits 1,450,520$ Education 116,888,876$
Intergovernmental 46,812,508$ Culture & Recreation 16,450,194$
Charges for Services 25,334,074$ Community & Economic Development 3,689,229$
Interest Earnings on Investments 4,570,234$ Administration and Support 72,494,031$
Other Revenue 7,844,029$ General Government 24,692,069$
Operating Transfers In 5,426,963$ Special Appropriations 2,771,408$
Proceeds of Gen. LT Liab. -$ Operating Transfers Out -$
Premium on Refunding Bonds -$ Human Services-If Only -$
Refund Bonds Issued -$ Other Financing Uses -$
Fund Balance for EDLP -$ Allow for Encumbrances -$
Fund Balance for Fire Grant -$ Ending Fund Balance 94,998,143$
PayGo Fund Balance -$ Total Operating Expenses 480,451,219$
Beginning Fund Balance 104,784,043$
Total Revenues by Source 480,451,219$
General Fund (budgeted)* 7,664,501$ Salaries and Wages 4,085,955$
Additional Revenues** 490,504$ Employee Benefits 1,143,392$
Total Revenues 8,155,005$ Professional Fees -$
Maintenance Services 44,856$
Rent 344,862$
Utility Services 12,910$
Construction Services -$
Other Purchased Services 401,343$
Training and Conference 40,270$
General Supplies 76,750$
Energy 270,950$
Operating Supplies 1,090,869$
Other Operating Costs 81,664$
Contingency 20,150$
Capital Outlay 35,530$
Payments T/O Agencies 15,000$
Total Expenditures 7,664,501$
Source: Forsyth County Adopted Annual Budget FY 2008, Statements of
Revenues, Expenditures, & Changes in Fund Balance, page 37 (page 2 in PDF
view)
(http://www.co.forsyth.nc.us/Budget/budget0708/revexpfbsheetsfinancial.pdf)
Source: Forsyth County Adopted Annual Budget FY 2008, Statements of
Revenues, Expenditures, & Changes in Fund Balance, page 37 (page 2 in PDF
view)
(http://www.co.forsyth.nc.us/Budget/budget0708/revexpfbsheetsfinancial.pdf)
Forsyth County Government Total Revenues by Source,
FY 2008 Adopted Budget
Forsyth County Government Total Revenues by Source,
FY 2008 Adopted Budget
Forsyth County Government General Fund Revenue by Source,
FY 2008 Adopted Budget
Forsyth County Government General Fund Expenditures,
FY 2008 Adopted Budget
Source: Forsyth County Adopted Annual Budget FY 2008, Statements of Revenues,
Expenditures, & Changes in Fund Balance, page 36 (page 1 in PDF view)
(http://www.co.forsyth.nc.us/Budget/budget0708/revexpfbsheetsfinancial.pdf)
Source: Forsyth County Adopted Annual Budget FY 2008, Statements of Revenues,
Expenditures, & Changes in Fund Balance, page 36 (page 1 in PDF view)
(http://www.co.forsyth.nc.us/Budget/budget0708/revexpfbsheetsfinancial.pdf) &
General Fund Summary by Service Areas, page 58 (page 1 in PDF view)
(http://www.co.forsyth.nc.us/Budget/budget0708/08gfrevexpdeptsvcarea.pdf)
Forsyth County Public Libraries Revenue by Source,
FY 2008 Adopted Budget
Forsyth County Public Libraries General Fund Expenditures,
FY 2008 Adopted Budget
Sources: Forsyth County Adopted Budget FY 2008, General Fund Summary by
Service Areas, page 58 (page 1 in PDF view)
(http://www.co.forsyth.nc.us/Budget/budget0708/08gfrevexpdeptsvcarea.pdf)
& page 173 (page 6 in PDF view)
(http://www.co.forsyth.nc.us/Budget/budget0708/CultureRec08.pdf)
**Note: Based on library's FY 2008-2009 Financial Summary, county funds were
added to "additional revenues" to get total revenues
(http://www.forsyth.cc/library/financial_statement.aspx). Library additional
revenues include LSTA, Chatham Grants, National Endowment of the Arts grants,
and other sources.
Source: Forsyth County Adopted Budget FY 2008, page 173 (page 6 in PDF view)
(http://www.co.forsyth.nc.us/Budget/budget0708/CultureRec08.pdf)
*Note: The county reports the share of the library's general fund as an
expenditure. Thus, for the purpose of this report, the library's general fund
revenue was budgeted from the county's general fund budget above. It should
also be noted that the General Fund Summary shows that of the $7,664,501, the
county gave the library $7,173,997 and the remaining funds came from "local"
and "intergovernmental" sources.
Appendix F- Detailed Source Tables Page F-42

Forsyth C
Ad Valorem Tax 221,806,584$ Public Safety 65,207,000$
Sales Tax 67,342,918$ Environmental Management 2,071,078$
911 Charges* 857,446$ Health 27,573,242$
Occupancy Tax 525,000$ Social Services 59,103,033$
Gross Receipts Tax 150,000$ Education 119,947,641$
Licenses and Permits 934,290$ Culture & Recreation (Library: $7,538,380) 16,232,365$
Intergovernmental 51,221,397$ Community & Economic Development 4,289,902$
Charges for Services 27,310,853$ Administration and Support 75,294,161$
Interest Earnings on Investments 3,616,235$ General Government 24,750,998$
Other Revenue 7,832,452$ Special Appropriations 2,793,193$
Operating Transfers In 6,945,249$ Operating Transfers Out 3,165,459$
Proceeds of Gen. LT Liab. -$ Human Services-If Only 20,000$
Premium on Refunding Bonds -$ Other Financing Uses -$
Refund Bonds Issued -$ Allow for Encumbrances -$
Fund Balance for EDLP -$ Ending Fund Balance 97,350,563$
Fund Balance for Fire Grant -$ Total Operating Expenses 497,798,635$
PayGo Fund Balance -$
Beginning Fund Balance 109,256,211$
Total Revenues by Source 497,798,635$
Ad Valorem Tax 216,648,384$ Public Safety 59,671,500$
Sales Tax 65,657,653$ Environmental Management 2,071,078$
Occupancy Tax 525,000$ Health 27,573,242$
Gross Receipts Tax 150,000$ Social Services 59,103,033$
Licenses and Permits 934,290$ Education 119,947,641$
Intergovernmental 51,221,397$ Culture & Recreation 16,232,365$
Charges for Services 27,310,853$ Community & Economic Development 4,289,902$
Interest Earnings on Investments 3,615,435$ Administration and Support 75,294,161$
Other Revenue 7,832,452$ General Government 24,750,998$
Operating Transfers In 6,945,249$ Special Appropriations 2,793,193$
Proceeds of Gen. LT Liab. -$ Operating Transfers Out -$
Premium on Refunding Bonds -$ Human Services-If Only -$
Refund Bonds Issued -$ Other Financing Uses -$
Fund Balance for EDLP -$ Allow for Encumbrances -$
Fund Balance for Fire Grant -$ Ending Fund Balance 96,224,860$
PayGo Fund Balance -$ Total Operating Expenses 487,951,973$
Beginning Fund Balance 107,111,260$
Total Revenues by Source 487,951,973$
General Fund (budgeted)* 7,538,380$ Salaries and Wages 4,165,242$
Additional Revenues** 482,605$ Employee Benefits 1,201,132$
Total Revenues 8,020,985$ Professional Fees -$
Maintenance Services 44,490$
Rent 237,537$
Utility Services 14,070$
Construction Services -$
Other Purchased Services 406,440$
Training and Conference 39,480$
General Supplies 89,800$
Energy 280,240$
Operating Supplies 942,399$
Other Operating Costs 68,760$
Contingency 10,100$
Capital Outlay 23,690$
Payments T/O Agencies 15,000$
Total Expenditures 7,538,380$
Forsyth County Government Total Revenues by Source,
FY 2009 Adopted Budget
Forsyth County Government Total Revenues by Source,
FY 2009 Adopted Budget
*Note: This charge discontinues after this fiscal year report and is not present in
later years.
Source: Forsyth County Adopted Annual Budget FY 2009, Statements of
Revenues, Expenditures, & Changes in Fund Balance, page 40 (page 1 in PDF
view)
(http://www.co.forsyth.nc.us/Budget/budget0809/revexpfbsheetsfinancial.pdf)
& General Fund Summary by Service Areas, page 55 (page 1 in PDF view)
(http://www.co.forsyth.nc.us/Budget/budget0809/budgetsummarybysvcareas.p
df)
Forsyth County Government General Fund Revenue
by Source,
FY 2009 Adopted Budget
Forsyth County Government General Fund Expenditures,
FY 2009 Adopted Budget
Source: Forsyth County Adopted Annual Budget FY 2009, Statements of
Revenues, Expenditures, & Changes in Fund Balance, page 40 (page 1 in PDF
view)
(http://www.co.forsyth.nc.us/Budget/budget0809/revexpfbsheetsfinancial.pdf)
Source: Forsyth County Adopted Annual Budget FY 2009, Statements of
Revenues, Expenditures, & Changes in Fund Balance, page 41 (page 2 in PDF
view)
(http://www.co.forsyth.nc.us/Budget/budget0809/revexpfbsheetsfinancial.pdf)
Source: Forsyth County Adopted Annual Budget FY 2009, Statements of
Revenues, Expenditures, & Changes in Fund Balance, page 41 (page 2 in PDF
view)
(http://www.co.forsyth.nc.us/Budget/budget0809/revexpfbsheetsfinancial.pdf)
**Note: Based on library's FY 2008-2009 Financial Summary, county funds were
added to "additional revenues" to get total revenues
(http://www.forsyth.cc/library/financial_statement.aspx). Library additional
revenues include LSTA, Chatham Grants, National Endowment of the Arts grants,
and other sources.
Forsyth County Public Libraries Revenue by Source,
FY 2009 Adopted Budget
Forsyth County Public Libraries General Fund Expenditures,
FY 2009 Adopted Budget
Sources: Forsyth County Adopted Budget FY 2009, General Fund Summary by
Service Areas, page 55 (page 1 in PDF view)
(http://www.co.forsyth.nc.us/Budget/budget0809/budgetsummarybysvcareas.p
df) & page 173 (page 6 in PDF view)
(http://www.co.forsyth.nc.us/Budget/budget0809/CultureRecreation09.pdf)
*Note: The county reports the share of the library's general fund as an
expenditure. Thus, for the purpose of this report, the library's general fund
revenue was budgeted from the county's general fund budget above. It should
also be noted that the General Fund Summary shows that of the $7,538,380, the
county gave the library $7,055,775 and the remaining funds came from "local"
and "intergovernmental" sources.
Source: Forsyth County Adopted Budget FY 2009, page 173 (page 6 in PDF view)
(http://www.co.forsyth.nc.us/Budget/budget0809/CultureRecreation09.pdf)
Appendix F- Detailed Source Tables Page F-43

Forsyth County Government Total Revenues by Source, FY 2011 Adopted
Ad Valorem Tax 235,187,474$ Public Safety 67,561,828$
Sales Tax 51,035,802$ Environmental Management 2,257,939$
Occupancy Tax 450,000$ Health 28,422,505$
Gross Receipts Tax 150,000$ Social Services 50,893,482$
Licenses and Permits 962,796$ Education 122,286,508$
Intergovernmental 49,703,513$ Culture & Recreation (Library: $7,578,377) 15,660,906$
Charges for Services 26,296,310$ Community & Economic Development 4,327,872$
Interest Earnings on Investments 1,530,554$ Administration and Support 78,661,926$
Other Revenue 8,516,754$ General Government 26,668,054$
Operating Transfers In 14,779,621$ Special Appropriations 2,733,533$
Proceeds of Gen. LT Liab. -$ Operating Transfers Out 2,573,606$
Premium on Refunding Bonds -$ Human Services-If Only 10,000$
Refund Bonds Issued -$ Other Financing Uses -$
Fund Balance for EDLP -$ Allow for Encumbrances -$
Fund Balance for Fire Grant -$ Ending Fund Balance 107,185,099$
PayGo Fund Balance -$ Total Operating Expenses 509,243,258$
Beginning Fund Balance 120,630,434$
Total Revenues by Source 509,243,258$
Ad Valorem Tax 229,536,474$ Public Safety 61,530,528$
Sales Tax 49,829,483$ Environmental Management 2,257,939$
Occupancy Tax 450,000$ Health 28,422,505$
Gross Receipts Tax 150,000$ Social Services 50,893,482$
Licenses and Permits 962,796$ Education 122,286,508$
Intergovernmental 48,846,067$ Culture & Recreation 15,660,906$
Charges for Services 26,296,310$ Community & Economic Development 4,327,872$
Interest Earnings on Investments 1,525,554$ Administration and Support 78,661,926$
Other Revenue 8,516,754$ General Government 26,668,054$
Operating Transfers In 14,779,621$ Special Appropriations 2,733,533$
Proceeds of Gen. LT Liab. -$ Operating Transfers Out -$
Premium on Refunding Bonds -$ Human Services-If Only -$
Refund Bonds Issued -$ Other Financing Uses -$
Fund Balance for EDLP -$ Allow for Encumbrances -$
Fund Balance for Fire Grant -$ Ending Fund Balance 105,308,018$
PayGo Fund Balance -$ Total Operating Expenses 498,751,271$
Beginning Fund Balance 117,858,212$
Total Revenues by Source 498,751,271$
General Fund (budgeted)* 7,578,377$ Salaries and Wages 4,209,982$
Additional Revenues** 580,351$ Employee Benefits 1,248,765$
Total Revenues 8,158,728$ Professional Fees 20,355$
Maintenance Services 45,160$
Rent 236,919$
Utility Services 15,273$
Construction Services -$
Other Purchased Services 422,988$
Training and Conference 23,855$
General Supplies 66,660$
Energy 289,680$
Operating Supplies 797,280$
Other Operating Costs 60,610$
Contingency 10,100$
Capital Outlay 115,750$
Payments T/O Agencies 15,000$
Total Expenditures 7,578,377$
Forsyth County Government Total Revenues by Source,
FY 2010 Adopted Budget
Forsyth County Government Total Revenues by Source,
FY 2010 Adopted Budget
Source: Forsyth County Adopted Annual Budget FY 2010, Statements of
Revenues, Expenditures, & Changes in Fund Balance, page 30 (page 1 in PDF
view)
(http://www.co.forsyth.nc.us/Budget/budget0910/revexpfbsheetsfinancial.pdf)
Forsyth County Government General Fund Revenue
by Source,
FY 2010 Adopted Budget
Forsyth County Government General Fund Expenditures,
FY 2010 Adopted Budget
Sources: Forsyth County Adopted Annual Budget FY 2010, Statements of
Revenues, Expenditures, & Changes in Fund Balance, page 30 (page 1 in PDF
view)
(http://www.co.forsyth.nc.us/Budget/budget0910/revexpfbsheetsfinancial.pdf)
& General Fund Expenditures by Service Area, page 47 (page 1 in PDF view)
(http://www.co.forsyth.nc.us/Budget/budget0910/budgetsummarybysvcareas.p
df)
Source: Forsyth County Adopted Budget FY 2010, page 163 (page 6 in PDF view)
(http://www.co.forsyth.nc.us/Budget/budget0910/CultureRecreation10.pdf)
Forsyth County Public Libraries Revenue by Source,
FY 2010 Adopted Budget
Forsyth County Public Libraries General Fund Expenditures,
FY 2010 Adopted Budget
Source: Forsyth County Adopted Annual Budget FY 2010, Statements of
Revenues, Expenditures, & Changes in Fund Balance, page 31 (page 2 in PDF
view)
(http://www.co.forsyth.nc.us/Budget/budget0910/revexpfbsheetsfinancial.pdf)
Source: Forsyth County Adopted Annual Budget FY 2010, Statements of
Revenues, Expenditures, & Changes in Fund Balance, page 31 (page 2 in PDF
view)
(http://www.co.forsyth.nc.us/Budget/budget0910/revexpfbsheetsfinancial.pdf)
**Note: Library additional revenues include LSTA, Chatham Grants, National
Endowment of the Arts grants, and other sources.
Sources: Forsyth County Adopted Annual Budget FY 2010, General Fund
Expenditures by Service Area, page 47 (page 1 in PDF view)
(http://www.co.forsyth.nc.us/Budget/budget0910/budgetsummarybysvcareas.p
df) & page 163 (page 6 in PDF view)
(http://www.co.forsyth.nc.us/Budget/budget0910/CultureRecreation10.pdf)
*Note: The county reports the share of the library's general fund as an
expenditure. Thus, for the purpose of this report, the library's general fund
revenue was budgeted from the county's general fund budget above. (Based on
library's FY 2008-2009 Financial Summary, county funds were added to
"additional revenues" to get total revenues
(http://www.forsyth.cc/library/financial_statement.aspx).
Appendix F- Detailed Source Tables Page F-44
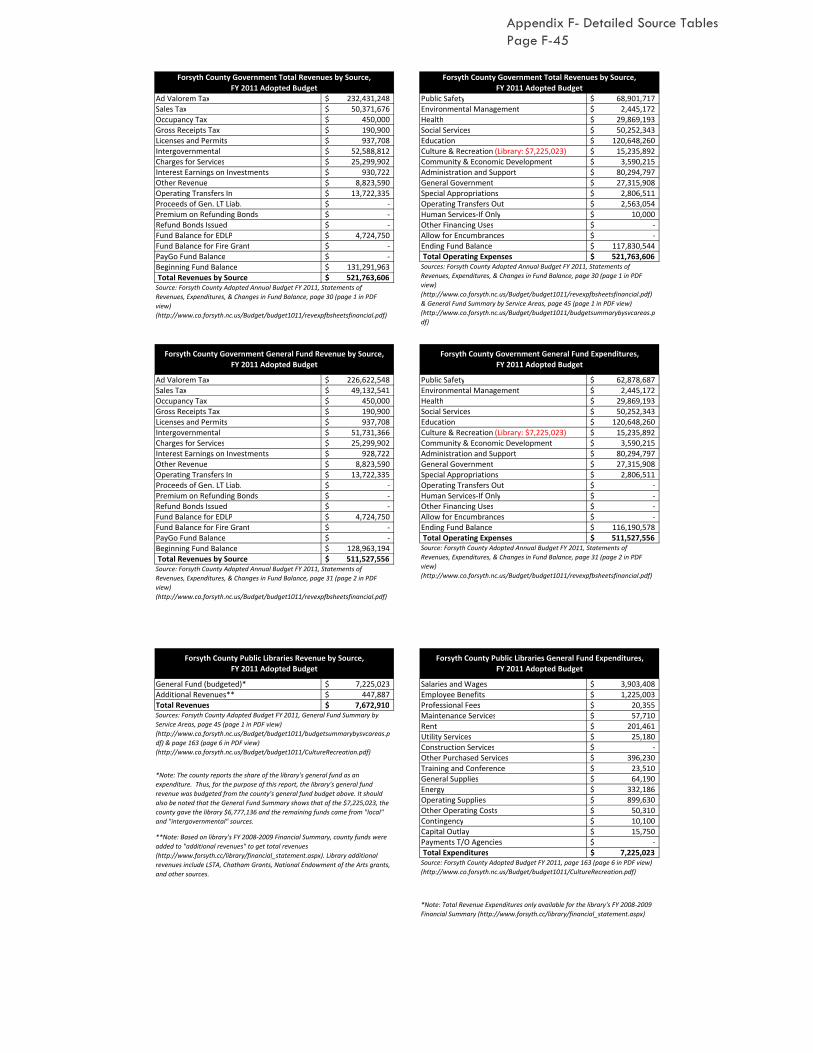
Forsyth County Government Total Revenues by Source, FY 2011 Adopted
Ad Valorem Tax 232,431,248$ Public Safety 68,901,717$
Sales Tax 50,371,676$ Environmental Management 2,445,172$
Occupancy Tax 450,000$ Health 29,869,193$
Gross Receipts Tax 190,900$ Social Services 50,252,343$
Licenses and Permits 937,708$ Education 120,648,260$
Intergovernmental 52,588,812$ Culture & Recreation (Library: $7,225,023) 15,235,892$
Charges for Services 25,299,902$ Community & Economic Development 3,590,215$
Interest Earnings on Investments 930,722$ Administration and Support 80,294,797$
Other Revenue 8,823,590$ General Government 27,315,908$
Operating Transfers In 13,722,335$ Special Appropriations 2,806,511$
Proceeds of Gen. LT Liab. -$ Operating Transfers Out 2,563,054$
Premium on Refunding Bonds -$ Human Services-If Only 10,000$
Refund Bonds Issued -$ Other Financing Uses -$
Fund Balance for EDLP 4,724,750$ Allow for Encumbrances -$
Fund Balance for Fire Grant -$ Ending Fund Balance 117,830,544$
PayGo Fund Balance -$ Total Operating Expenses 521,763,606$
Beginning Fund Balance 131,291,963$
Total Revenues by Source 521,763,606$
Ad Valorem Tax 226,622,548$ Public Safety 62,878,687$
Sales Tax 49,132,541$ Environmental Management 2,445,172$
Occupancy Tax 450,000$ Health 29,869,193$
Gross Receipts Tax 190,900$ Social Services 50,252,343$
Licenses and Permits 937,708$ Education 120,648,260$
Intergovernmental 51,731,366$ Culture & Recreation (Library: $7,225,023) 15,235,892$
Charges for Services 25,299,902$ Community & Economic Development 3,590,215$
Interest Earnings on Investments 928,722$ Administration and Support 80,294,797$
Other Revenue 8,823,590$ General Government 27,315,908$
Operating Transfers In 13,722,335$ Special Appropriations 2,806,511$
Proceeds of Gen. LT Liab. -$ Operating Transfers Out -$
Premium on Refunding Bonds -$ Human Services-If Only -$
Refund Bonds Issued -$ Other Financing Uses -$
Fund Balance for EDLP 4,724,750$ Allow for Encumbrances -$
Fund Balance for Fire Grant -$ Ending Fund Balance 116,190,578$
PayGo Fund Balance -$ Total Operating Expenses 511,527,556$
Beginning Fund Balance 128,963,194$
Total Revenues by Source 511,527,556$
General Fund (budgeted)* 7,225,023$ Salaries and Wages 3,903,408$
Additional Revenues** 447,887$ Employee Benefits 1,225,003$
Total Revenues 7,672,910$ Professional Fees 20,355$
Maintenance Services 57,710$
Rent 201,461$
Utility Services 25,180$
Construction Services -$
Other Purchased Services 396,230$
Training and Conference 23,510$
General Supplies 64,190$
Energy 332,186$
Operating Supplies 899,630$
Other Operating Costs 50,310$
Contingency 10,100$
Capital Outlay 15,750$
Payments T/O Agencies -$
Total Expenditures 7,225,023$
Forsyth County Government Total Revenues by Source,
FY 2011 Adopted Budget
Forsyth County Government Total Revenues by Source,
FY 2011 Adopted Budget
Forsyth County Government General Fund Revenue by Source,
FY 2011 Adopted Budget
Forsyth County Government General Fund Expenditures,
FY 2011 Adopted Budget
Source: Forsyth County Adopted Annual Budget FY 2011, Statements of
Revenues, Expenditures, & Changes in Fund Balance, page 30 (page 1 in PDF
view)
(http://www.co.forsyth.nc.us/Budget/budget1011/revexpfbsheetsfinancial.pdf)
Sources: Forsyth County Adopted Annual Budget FY 2011, Statements of
Revenues, Expenditures, & Changes in Fund Balance, page 30 (page 1 in PDF
view)
(http://www.co.forsyth.nc.us/Budget/budget1011/revexpfbsheetsfinancial.pdf)
& General Fund Summary by Service Areas, page 45 (page 1 in PDF view)
(http://www.co.forsyth.nc.us/Budget/budget1011/budgetsummarybysvcareas.p
df)
Forsyth County Public Libraries Revenue by Source,
FY 2011 Adopted Budget
Forsyth County Public Libraries General Fund Expenditures,
FY 2011 Adopted Budget
Source: Forsyth County Adopted Annual Budget FY 2011, Statements of
Revenues, Expenditures, & Changes in Fund Balance, page 31 (page 2 in PDF
view)
(http://www.co.forsyth.nc.us/Budget/budget1011/revexpfbsheetsfinancial.pdf)
Source: Forsyth County Adopted Annual Budget FY 2011, Statements of
Revenues, Expenditures, & Changes in Fund Balance, page 31 (page 2 in PDF
view)
(http://www.co.forsyth.nc.us/Budget/budget1011/revexpfbsheetsfinancial.pdf)
*Note: Total Revenue Expenditures only available for the library's FY 2008-2009
Financial Summary (http://www.forsyth.cc/library/financial_statement.aspx)
Source: Forsyth County Adopted Budget FY 2011, page 163 (page 6 in PDF view)
(http://www.co.forsyth.nc.us/Budget/budget1011/CultureRecreation.pdf)
Sources: Forsyth County Adopted Budget FY 2011, General Fund Summary by
Service Areas, page 45 (page 1 in PDF view)
(http://www.co.forsyth.nc.us/Budget/budget1011/budgetsummarybysvcareas.p
df) & page 163 (page 6 in PDF view)
(http://www.co.forsyth.nc.us/Budget/budget1011/CultureRecreation.pdf)
*Note: The county reports the share of the library's general fund as an
expenditure. Thus, for the purpose of this report, the library's general fund
revenue was budgeted from the county's general fund budget above. It should
also be noted that the General Fund Summary shows that of the $7,225,023, the
county gave the library $6,777,136 and the remaining funds came from "local"
and "intergovernmental" sources.
**Note: Based on library's FY 2008-2009 Financial Summary, county funds were
added to "additional revenues" to get total revenues
(http://www.forsyth.cc/library/financial_statement.aspx). Library additional
revenues include LSTA, Chatham Grants, National Endowment of the Arts grants,
and other sources.
Appendix F- Detailed Source Tables Page F-45

Forsyth C
Ad Valorem Tax 232,873,138$ Public Safety 69,305,040$ Sales Tax 50,529,230$ Environmental Management 2,177,489$ Occupancy Tax 450,000$ Health 29,978,137$ Gross Receipts Tax 260,575$ Social Services 50,600,147$ Licenses and Permits 804,518$ Education 120,468,130$ Intergovernmental 55,366,916$ Culture & Recreation (Library: $7,289,715) 15,084,635$ Charges for Services 24,460,267$ Community & Economic Development 3,782,702$ Interest Earnings on Investments 699,086$ Administration and Support 90,016,877$ Other Revenue 8,598,309$ General Government 12,688,547$ Operating Transfers In 6,614,275$ Special Appropriations 1,569,035$ Proceeds of Gen. LT Liab. ‐$ Operating Transfers Out 1,417,219$ Premium on Refunding Bonds ‐$ Human Services‐If Only 10,000$ Refund Bonds Issued ‐$ Other Financing Uses ‐$ Fund Balance for EDLP ‐$ Allow for Encumbrances ‐$ Fund Balance for Fire Grant ‐$ Ending Fund Balance 128,848,871$ PayGo Fund Balance ‐$ Total Operating Expenses 525,946,829$ Beginning Fund Balance 145,290,515$ Total Revenues by Source 525,946,829$
Ad Valorem Tax 226,593,067$ Public Safety 61,873,467$ Sales Tax 49,260,160$ Environmental Management 2,177,489$ Occupancy Tax 450,000$ Health 29,978,137$ Gross Receipts Tax 260,575$ Social Services 50,600,147$ Licenses and Permits 804,518$ Education 120,468,130$ Intergovernmental 54,509,470$ Culture & Recreation (Library: $7,289,715) 15,084,635$ Charges for Services 24,460,267$ Community & Economic Development 3,782,702$ Interest Earnings on Investments 692,086$ Administration and Support 90,016,877$ Other Revenue 8,598,309$ General Government 12,688,547$ Operating Transfers In 6,614,275$ Special Appropriations 1,569,035$ Proceeds of Gen. LT Liab. ‐$ Operating Transfers Out ‐$ Premium on Refunding Bonds ‐$ Human Services‐If Only ‐$ Refund Bonds Issued ‐$ Other Financing Uses ‐$ Fund Balance ‐$ Allow for Encumbrances ‐$ Fund Balance for EDLP ‐$ Ending Fund Balance 126,478,748$ Fund Balance for Fire Grant ‐$ Total Operating Expenses 514,717,914$ PayGo Fund Balance ‐$ Beginning Fund Balance 142,475,187$ Total Revenues by Source 514,717,914$
General Fund (budgeted)* 7,289,715$ Salaries and Wages 3,928,434$ Additional Revenues** 434,365$ Employee Benefits 1,298,654$ Total Revenues 7,724,080$ Professional Fees 20,965$
Maintenance Services 55,250$ Rent 210,739$ Utility Services 25,497$ Construction Services ‐$ Other Purchased Services 388,030$ Training and Conference 23,510$ General Supplies 47,700$ Energy 323,350$ Operating Supplies 899,940$ Other Operating Costs 41,896$ Contingency 10,000$ Capital Outlay 15,750$ Payments T/O Agencies ‐$ Total Expenditures 7,289,715$
Forsyth County Government Total Revenues by Source,
FY 2012 Adopted Budget
Forsyth County Government Total Revenues by Source,
FY 2012 Adopted Budget
Sources: Forsyth County Adopted Annual Budget FY 2012, Statements of
Revenues, Expenditures, & Changes in Fund Balance, page 32 (page 1 in PDF
view) (http://www.forsyth.cc/budget/budget1112/revexpfbsheetsfinancial.pdf)
& General Fund Summary by Service Areas, page 63 (page 1 in PDF view)
(http://www.forsyth.cc/budget/budget1112/gfrevexpdeptsvcarea.pdf)
Source: Forsyth County Adopted Annual Budget FY 2012, Statements of
Revenues, Expenditures, & Changes in Fund Balance, page 32 (page 1 in PDF
view) (http://www.forsyth.cc/budget/budget1112/revexpfbsheetsfinancial.pdf)
Forsyth County Government General Fund Revenue by Source,
FY 2012 Adopted Budget
Forsyth County Government General Fund Expenditures,
FY 2012 Adopted Budget
Source: Forsyth County Adopted Budget FY 2012, page 179 (page 6 in PDF view)
(http://www.forsyth.cc/budget/budget1112/CultureRecreation.pdf)
Source: Forsyth County Adopted Annual Budget FY 2012, Statements of
Revenues, Expenditures, & Changes in Fund Balance, page 33 (page 2 in PDF
view) (http://www.forsyth.cc/budget/budget1112/revexpfbsheetsfinancial.pdf)
Source: Forsyth County Adopted Annual Budget FY 2012, Statements of
Revenues, Expenditures, & Changes in Fund Balance, page 33 (page 2 in PDF
view) (http://www.forsyth.cc/budget/budget1112/revexpfbsheetsfinancial.pdf)
Forsyth County Public Libraries Revenue by Source,
FY 2012 Adopted Budget
Forsyth County Public Libraries General Fund Expenditures,
FY 2012 Adopted Budget
Sources: Forsyth County Adopted Budget FY 2012, General Fund Summary by
Service Areas, page 61 (page 1 in PDF view)
(http://www.co.forsyth.nc.us/Budget/budget1011/budgetsummarybysvcareas.p
df) & page 179 (page 6 in PDF view)
(http://www.forsyth.cc/budget/budget1112/CultureRecreation.pdf)
*Note: The county reports the share of the library's general fund as an
expenditure. Thus, for the purpose of this report, the library's general fund
revenue was budgeted from the county's general fund budget above. It should
also be noted that the General Fund Summary shows that of the $7,289,715 the
county gave the library $6,855,350 and the remaining funds came from "local"
and "intergovernmental" sources.
**Note: Library additional revenues include LSTA, Chatham Grants, National
Endowment of the Arts grants, and other sources.
Appendix F- Detailed Source Tables Page F-46

Property Tax 141,570,000$ Culture and Recreation 44,393,538$
Sales Tax 41,360,300$ Economic and Community Development 7,838,161$
Intergovernmental 39,094,980$ Environmental Protection 124,447,798$
User Fees/Charges/Licenses 147,791,829$ General Government 33,327,693$
All Other 89,942,668$ Public Safety 110,976,576$
Interfund Transfers 35,784,456$ Transportation 46,316,576$
Appropriated Fund Balance 10,471,247$ Debt Service 27,593,500$
Less Transfers & Internal Charges (111,121,638)$ Total Operating Expenses 394,893,842$
Total Revenues by Source 394,893,842$
Property Tax 133,321,000$ Public Safety 107,075,996$
Sales Tax 41,360,300$ Transportation 23,267,849$
State Collected Local Revenues 16,963,386$ Economic & Community Development 6,012,048$
Cable TV Access License 336,200$ Environmental Protection 22,620,559$
ABC Profit Distribution 3,126,100$ Culture & Recreation 30,691,182$
Building Permit Revenue 3,238,360$ (Libraries: $5,888,352)
All Other 33,143,202$ General Government 34,110,267$
Transfers from Other Funds 6,594,012$ Debt Service 18,298,500$
Appropriated Fund Balance 3,993,841$ Total Operating Expenses 242,076,401$
Total Revenues by Source $ 242,076,401
Intergovernmental 2,484,280$ Personnel costs 5,997,581$
User charges 201,315$ Maintenance and operations 2,581,891$
All other 5,525$ Capital outlay
General fund contribution 5,888,352$ Total Expenditures 8,579,472$
Total Revenue 8,579,472$
Greensboro General Fund Revenue by Source,
FY 2008 Budget
Greensboro General Fund Expenditures,
FY 2008 Budget
*Note: FY 2007-2008 Adopted Budget is not made available;
therefore, budgeted numbers found in the FY 2008-2009 Budget
are used.
Source: Greensboro Adopted Annual Budget FY 2009, page 23
(page 33 in PDF view) (http://www.greensboro-
nc.gov/NR/rdonlyres/ABE176D3-EA08-4984-8BD6-
BBF53EF35190/0/200809finaladoptedbudgetallsections.pdf)
Source: Greensboro Adopted Annual Budget FY 2009, page 27
(page 37 in PDF view) (http://www.greensboro-
nc.gov/NR/rdonlyres/ABE176D3-EA08-4984-8BD6-
BBF53EF35190/0/200809finaladoptedbudgetallsections.pdf)
Greensboro Public Libraries Revenue by Source,
FY 2008 Budget
Greensboro Public Libraries Expenditures,
FY 2008 Budget
*Note: FY 2007-2008 Adopted Budget is not made available;
therefore, budgeted numbers found in the FY 2008-2009 Budget
are used.
*Note: FY 2007-2008 Adopted Budget is not made available;
therefore, budgeted numbers found in the FY 2008-2009 Budget
are used.
Source: Greensboro Adopted Budget FY 2009, page 38
(page 50 PDF view)
(http://www.greensboro-nc.gov/NR/rdonlyres/ABE176D3-EA08-
4984-8BD6-
BBF53EF35190/0/200809finaladoptedbudgetallsections.pdf)
Source: Greensboro Adopted Budget FY 2009, page 38
(page 50 PDF view)
(http://www.greensboro-nc.gov/NR/rdonlyres/ABE176D3-EA08-
4984-8BD6-
BBF53EF35190/0/200809finaladoptedbudgetallsections.pdf)
*Note: FY 2007-2008 Adopted Budget is not made available;
therefore, budgeted numbers found in the FY 2008-2009 Budget
are used.
Greensboro Total Revenues by Source,
FY 2008 Budget
Greensboro Expenditures by Use,
FY 2008 Budget
*Note: FY 2007-2008 Adopted Budget is not made available;
therefore, budgeted numbers found in the FY 2008-2009 Budget
are used.
*Note: FY 2007-2008 Adopted Budget is not made available;
therefore, budgeted numbers found in the FY 2008-2009 Budget
are used.
Source: Greensboro Adopted Annual Budget FY 2009, pages 10-
11 (pages 18-19 PDF view)
(http://www.greensboro-nc.gov/NR/rdonlyres/ABE176D3-EA08-
4984-8BD6-
BBF53EF35190/0/200809finaladoptedbudgetallsections.pdf)
Source: Greensboro Adopted Annual Budget FY 2009, page 13
(page 21 PDF view) (http://www.greensboro-
nc.gov/NR/rdonlyres/ABE176D3-EA08-4984-8BD6-
BBF53EF35190/0/200809finaladoptedbudgetallsections.pdf)
Appendix F- Detailed Source Tables Page F-47

Property Tax 151,799,771$ Culture and Recreation 45,908,490$
Sales Tax 43,096,600$ Economic and Community Development 8,151,762$
Intergovernmental 43,418,332$ Environmental Protection 136,999,324$
User Fees/Charges/Licenses 157,920,240$ General Government 35,193,831$
All Other 93,252,518$ Public Safety 119,132,260$
Interfund Transfers 40,216,275$ Transportation 49,272,213$
Appropriated Fund Balance 17,978,066$ Debt Service 31,050,948$
Less Transfers & Internal Charges (121,972,974)$ Total Operating Expenses 425,708,828$
Total Revenues by Source 425,708,828$
Property Tax 143,017,083$ Public Safety 115,256,805$
Sales Tax 42,946,600$ Transportation 23,943,049$
State Collected Local Revenues 19,649,092$ Economic & Community Development 5,800,579$
Cable TV Access License 200,000$ Environmental Protection 28,639,976$
ABC Profit Distribution 3,065,100$ Culture & Recreation 31,157,799$
Building Permit Revenue 2,809,060$ (Libraries: $5,947,903)
All Other 33,716,544$ General Government 34,674,025$
Transfers from Other Funds 6,852,561$ Debt Service 16,691,700$
Appropriated Fund Balance 3,907,893$ Total Operating Expenses 256,163,933$
Total Revenues by Source $ 256,163,933
Intergovernmental 2,484,891$ Personnel costs 6,043,923$
User charges 216,675$ Maintenance and operations 2,612,246$
All other 6,700$ Capital outlay -$
General fund contribution 5,947,903$ Total Expenditures 8,656,169$
Total Revenue 8,656,169$ Source: Greensboro Adopted Annual Budget FY 2009, page 38
(pages 50 PDF view) (http://www.greensboro-
nc.gov/NR/rdonlyres/ABE176D3-EA08-4984-8BD6-
BBF53EF35190/0/200809finaladoptedbudgetallsections.pdf)
Source: Greensboro Adopted Annual Budget FY 2009, page 13
(page 21 PDF view) (http://www.greensboro-
nc.gov/NR/rdonlyres/ABE176D3-EA08-4984-8BD6-
BBF53EF35190/0/200809finaladoptedbudgetallsections.pdf)
Source: Greensboro Adopted Annual Budget FY 2009, pages 10-
11 (pages 18-19 PDF view) (http://www.greensboro-
nc.gov/NR/rdonlyres/ABE176D3-EA08-4984-8BD6-
BBF53EF35190/0/200809finaladoptedbudgetallsections.pdf)
Source: Greensboro Adopted Annual Budget FY 2009, page 23
(pages 33 PDF view)
(http://www.greensboro-nc.gov/NR/rdonlyres/ABE176D3-EA08-
4984-8BD6-
BBF53EF35190/0/200809finaladoptedbudgetallsections.pdf)
Greensboro Total Revenues by Source,
FY 2009 Adopted Budget
Greensboro Expenditures by Use,
FY 2009 Adopted Budget
Greensboro Public Libraries Revenue by Source,
FY 2009 Adopted Budget
Greensboro Public Libraries Expenditures,
FY 2009 Adopted Budget
Greensboro General Fund Revenue by Source,
FY 2009 Adopted Budget
Greensboro General Fund Expenditures,
FY 2009 Adopted Budget
Source: Greensboro Adopted Annual Budget FY 2009, page 38
(pages 50 PDF view) (http://www.greensboro-
nc.gov/NR/rdonlyres/ABE176D3-EA08-4984-8BD6-
BBF53EF35190/0/200809finaladoptedbudgetallsections.pdf)
Source: Greensboro Adopted Annual Budget FY 2009, page 27
(page 37 in PDF view) (http://www.greensboro-
nc.gov/NR/rdonlyres/ABE176D3-EA08-4984-8BD6-
BBF53EF35190/0/200809finaladoptedbudgetallsections.pdf)
Appendix F- Detailed Source Tables Page F-48

Property Tax 154,999,800$ Culture and Recreation 44,844,321$
Sales Tax 38,524,010$ Economic and Community Development 7,898,322$
Intergovernmental 42,642,878$ Environmental Protection 137,943,345$
User Fees/Charges/Licenses 156,952,483$ General Government 37,203,976$
All Other 89,550,836$ Public Safety 115,441,420$
Interfund Transfers 38,105,094$ Transportation 48,988,220$
Appropriated Fund Balance 20,909,736$ Debt Service 29,629,285$
Less Transfers & Internal Charges (119,735,948)$ Total Expenditures 421,948,889$
Total Revenues by Source 421,948,889$
Property Tax 146,049,800$ Public safety 111,592,999$
Sales Tax 38,374,010$ Transportation 24,204,287$
State Collected Local Revenues 19,956,251$ Economic and Community Development 6,202,318$
ABC Profit Distribution 2,909,800$ Environmental Protection 28,136,590$
Building Permit Revenue 2,074,060$ Culture and recreation 30,252,351$
All Other 33,875,744$ (Libraries: $5,963,265)
Transfers from Other Funds 8,213,410$ General Government 38,547,518$
Appropriated Fund Balance 4,174,688$ Debt Service 16,691,700$
Total Revenues by Source 255,627,763$ Total Operating Expenses 255,627,763$
Intergovernmental 2,080,603$ Personnel costs 5,724,064$
User charges 217,614$ Maintenance and operations 2,544,918$
All other 7,500$ Capital outlay -$
General fund contribution 5,963,265$ Total Expenditures 8,268,982$
Total Revenue 8,268,982$ Source: Greensboro Adopted Budget FY 2010, page 38
(page 50 in PDF view)
(http://www.greensboro-nc.gov/NR/rdonlyres/17687CDF-A5D2-
44EA-9849-
BA68DDE90D13/0/200910finaladoptedbudgetallsections.pdf)
Source: Greensboro Adopted Annual Budget FY 2010, pages 10-
11
(pages 18-19 in PDF view)
(http://www.greensboro-nc.gov/NR/rdonlyres/17687CDF-A5D2-
44EA-9849-
BA68DDE90D13/0/200910finaladoptedbudgetallsections.pdf)
Source: Greensboro Adopted Annual Budget FY 2010, page 27
(page 37 in PDF view) (http://www.greensboro-
nc.gov/NR/rdonlyres/17687CDF-A5D2-44EA-9849-
BA68DDE90D13/0/200910finaladoptedbudgetallsections.pdf)
Greensboro Public Libraries Revenue by Source,
FY 2010 Adopted Budget
Greensboro Public Libraries Expenditures,
FY 2010 Adopted Budget
Source: Greensboro Adopted Annual Budget FY 2010, page 24
(pages 34 in PDF view) (http://www.greensboro-
nc.gov/NR/rdonlyres/17687CDF-A5D2-44EA-9849-
BA68DDE90D13/0/200910finaladoptedbudgetallsections.pdf)
Source: Greensboro Adopted Budget FY 2010, page 38 (page
50 in PDF view) (http://www.greensboro-
nc.gov/NR/rdonlyres/17687CDF-A5D2-44EA-9849-
BA68DDE90D13/0/200910finaladoptedbudgetallsections.pdf)
Greensboro Total Revenues by Source,
FY 2010 Adopted Budget
Greensboro Expenditures by Use,
FY 2010 Adopted Budget
Greensboro General Fund Revenue by Source,
FY 2010 Adopted Budget
Greensboro General Fund Expenditures,
FY 2010 Adopted Budget
Source: Greensboro Adopted Annual Budget FY 2010, pages
13 (pages 21 in PDF view) (http://www.greensboro-
nc.gov/NR/rdonlyres/17687CDF-A5D2-44EA-9849-
BA68DDE90D13/0/200910finaladoptedbudgetallsections.pdf)
Appendix F- Detailed Source Tables Page F-49

Property tax 155,137,935$ Culture and recreation 45,436,972$
Sales tax 37,345,470$ Economic and community development 7,281,561$
Intergovernmental revenue 41,741,080$ Environmental protection 133,754,707$
User fees/charges/licenses 154,702,337$ General government 43,417,827$
All other 87,874,125$ Public safety 116,333,125$
Interfund transfers 37,942,529$ Transportation 48,910,840$
Appropriated fund balance 30,464,269$ Debt service 28,656,600$
Less Transfers & Internal Charges (121,416,113)$ Total Expenditures 423,791,632$
Total Revenues by Source 423,791,632$
Property tax 146,279,620$ Public safety 112,629,153$
Sales tax 37,195,470$ Transportation 25,261,145$
State collected local revenues 19,478,245$ Economic and community development 5,743,352$
ABC profit distribution 2,677,600$ Environmental protection 25,919,603$
Building permit revenue 1,677,846$
All other 32,917,162$
Transfers from other funds 9,370,639$ General government 38,327,650$
Appropriated fund balance 5,349,820$ Debt services 16,691,700$
Total Revenues by Source 254,946,402$ Total Operating Expenses 254,946,402$
Intergovernmental 1,617,713$ Personnel costs 5,830,212$
User charges 231,450$ Maintenance and operations 2,574,917$
All other 4,374$ Capital outlay -$
General fund contribution 6,551,592$ Total Expenditures 8,405,129$
Total Revenue 8,405,129$
Greensboro Public Libraries Revenue by Source,
FY 2011 Adopted Budget
Greensboro Public Libraries Expenditures,
FY 2011 Adopted Budget
Source: Greensboro Adopted Budget FY 2011, page 24
(page 32 in PDF view)
(http://www.greensboro-nc.gov/NR/rdonlyres/B7EF13BF-FF5F-
4983-A287-
B08333292652/0/201011finaladoptedbudgetallsections.pdf)
Source: Greensboro Adopted Budget FY 2011, page 38
(page in 48 PDF view)
(http://www.greensboro-nc.gov/NR/rdonlyres/B7EF13BF-FF5F-4983-
A287-B08333292652/0/201011finaladoptedbudgetallsections.pdf)
Source: Greensboro Adopted Budget FY 2011, page 38
(page 48 in PDF view)
(http://www.greensboro-nc.gov/NR/rdonlyres/B7EF13BF-FF5F-
4983-A287-
B08333292652/0/201011finaladoptedbudgetallsections.pdf)
Source: Greensboro Adopted Budget FY 2011, page 27
(page 35 in PDF view)
(http://www.greensboro-nc.gov/NR/rdonlyres/B7EF13BF-FF5F-4983-
A287-B08333292652/0/201011finaladoptedbudgetallsections.pdf)
Culture and recreation
(Libraries: $6,551,592)
30,373,799$
Greensboro Total Revenues by Source,
FY 2011 Adopted Budget
Greensboro Expenditures by Service Areas,
FY 2011 Adopted Budget
Greensboro General Fund Revenue by Source,
FY 2011 Adopted Budget
Greensboro General Fund Expenditures,
FY 2011 Adopted Budget
Source: Greensboro Adopted Budget FY 2011, page 13 (page 19 in
PDF view)
(http://www.greensboro-nc.gov/NR/rdonlyres/B7EF13BF-FF5F-4983-
A287-B08333292652/0/201011finaladoptedbudgetallsections.pdf)
Source: Greensboro Adopted Annual Budget FY 2011, pages 10-11
(pages 16-17 in PDF view)
(http://www.greensboro-nc.gov/NR/rdonlyres/B7EF13BF-FF5F-
4983-A287-
B08333292652/0/201011finaladoptedbudgetallsections.pdf)
Appendix F- Detailed Source Tables Page F-50
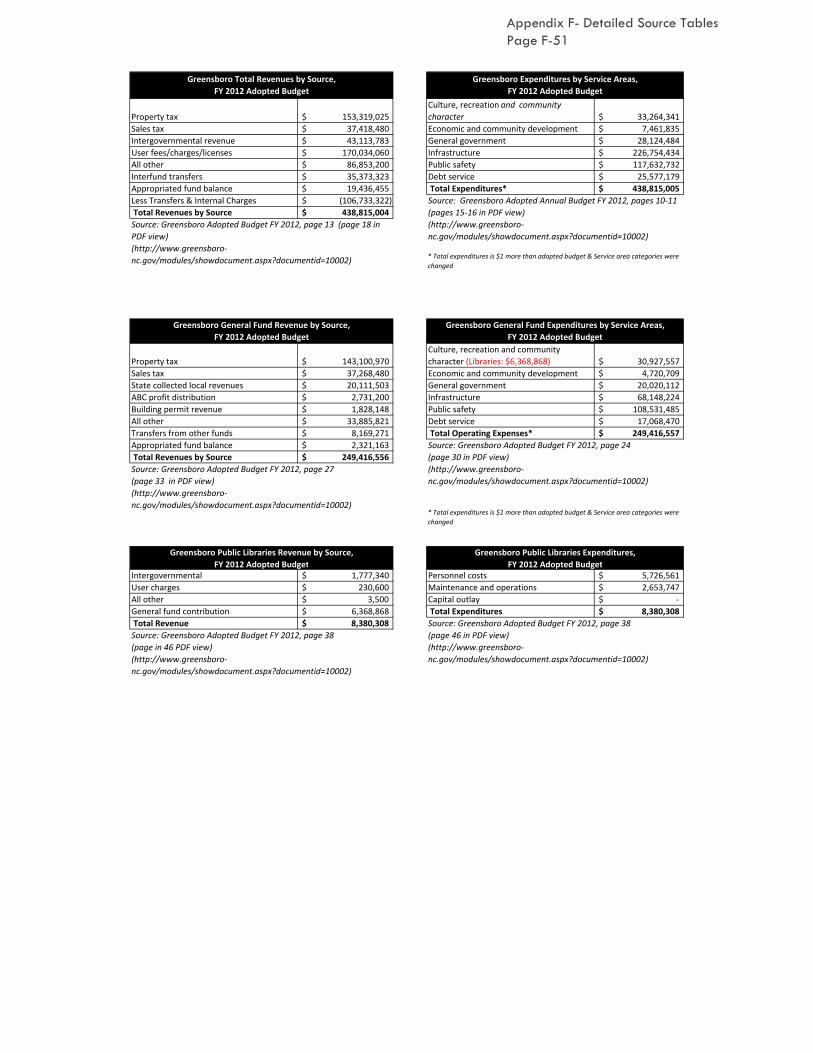
Property tax 153,319,025$
Culture, recreation and community
character 33,264,341$
Sales tax 37,418,480$ Economic and community development 7,461,835$
Intergovernmental revenue 43,113,783$ General government 28,124,484$
User fees/charges/licenses 170,034,060$ Infrastructure 226,754,434$
All other 86,853,200$ Public safety 117,632,732$
Interfund transfers 35,373,323$ Debt service 25,577,179$
Appropriated fund balance 19,436,455$ Total Expenditures* 438,815,005$
Less Transfers & Internal Charges (106,733,322)$
Total Revenues by Source 438,815,004$
Property tax 143,100,970$
Culture, recreation and community
character (Libraries: $6,368,868) 30,927,557$
Sales tax 37,268,480$ Economic and community development 4,720,709$
State collected local revenues 20,111,503$ General government 20,020,112$
ABC profit distribution 2,731,200$ Infrastructure 68,148,224$
Building permit revenue 1,828,148$ Public safety 108,531,485$
All other 33,885,821$ Debt service 17,068,470$
Transfers from other funds 8,169,271$ Total Operating Expenses* 249,416,557$
Appropriated fund balance 2,321,163$
Total Revenues by Source 249,416,556$
Intergovernmental 1,777,340$ Personnel costs 5,726,561$
User charges 230,600$ Maintenance and operations 2,653,747$
All other 3,500$ Capital outlay ‐$
General fund contribution 6,368,868$ Total Expenditures 8,380,308$
Total Revenue 8,380,308$
Greensboro Total Revenues by Source,
FY 2012 Adopted Budget
Greensboro Expenditures by Service Areas,
FY 2012 Adopted Budget
Source: Greensboro Adopted Budget FY 2012, page 13 (page 18 in
PDF view)
(http://www.greensboro‐
nc.gov/modules/showdocument.aspx?documentid=10002)
Greensboro General Fund Revenue by Source,
FY 2012 Adopted Budget
Source: Greensboro Adopted Annual Budget FY 2012, pages 10‐11
(pages 15‐16 in PDF view)
(http://www.greensboro‐
nc.gov/modules/showdocument.aspx?documentid=10002)
* Total expenditures is $1 more than adopted budget & Service area categories were
changed
Greensboro General Fund Expenditures by Service Areas,
FY 2012 Adopted Budget
Source: Greensboro Adopted Budget FY 2012, page 38
(page 46 in PDF view)
(http://www.greensboro‐
nc.gov/modules/showdocument.aspx?documentid=10002)
Source: Greensboro Adopted Budget FY 2012, page 27
(page 33 in PDF view)
(http://www.greensboro‐
nc.gov/modules/showdocument.aspx?documentid=10002)
Source: Greensboro Adopted Budget FY 2012, page 24
(page 30 in PDF view)
(http://www.greensboro‐
nc.gov/modules/showdocument.aspx?documentid=10002)
Greensboro Public Libraries Expenditures,
FY 2012 Adopted Budget
* Total expenditures is $1 more than adopted budget & Service area categories were
changed
Source: Greensboro Adopted Budget FY 2012, page 38
(page in 46 PDF view)
(http://www.greensboro‐
nc.gov/modules/showdocument.aspx?documentid=10002)
Greensboro Public Libraries Revenue by Source,
FY 2012 Adopted Budget
Appendix F- Detailed Source Tables Page F-51
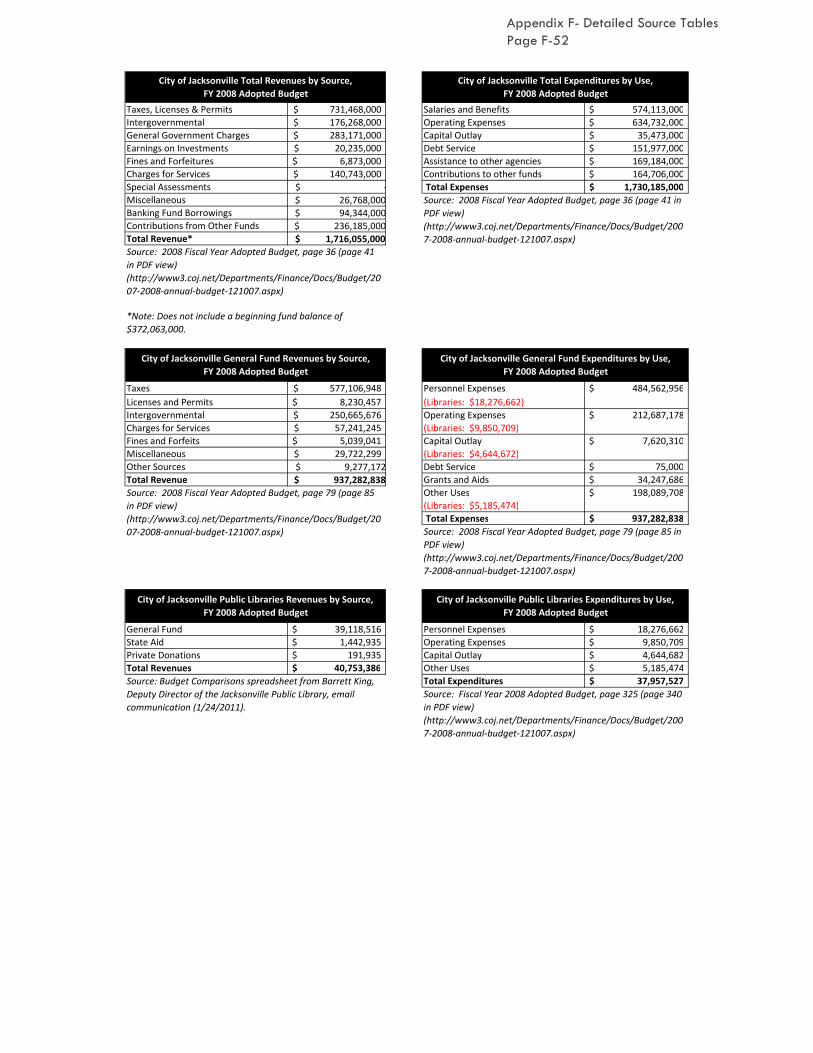
Taxes, Licenses & Permits 731,468,000$ Salaries and Benefits 574,113,000$
Intergovernmental 176,268,000$ Operating Expenses 634,732,000$
General Government Charges 283,171,000$ Capital Outlay 35,473,000$
Earnings on Investments 20,235,000$ Debt Service 151,977,000$
Fines and Forfeitures 6,873,000$ Assistance to other agencies 169,184,000$
Charges for Services 140,743,000$ Contributions to other funds 164,706,000$
Special Assessments $ - Total Expenses 1,730,185,000$
Miscellaneous $ 26,768,000
Banking Fund Borrowings $ 94,344,000
Contributions from Other Funds $ 236,185,000
Total Revenue* $ 1,716,055,000
Taxes 577,106,948$ Personnel Expenses 484,562,956$
Licenses and Permits 8,230,457$ (Libraries: $18,276,662)
Intergovernmental 250,665,676$ Operating Expenses 212,687,178$
Charges for Services 57,241,245$ (Libraries: $9,850,709)
Fines and Forfeits 5,039,041$ Capital Outlay 7,620,310$
Miscellaneous 29,722,299$ (Libraries: $4,644,672)
Other Sources $ 9,277,172 Debt Service 75,000$
Total Revenue $ 937,282,838 Grants and Aids 34,247,686$
Other Uses 198,089,708$
(Libraries: $5,185,474)
Total Expenses 937,282,838$
General Fund 39,118,516$ Personnel Expenses 18,276,662$
State Aid 1,442,935$ Operating Expenses 9,850,709$
Private Donations 191,935$ Capital Outlay 4,644,682$
Total Revenues 40,753,386$ Other Uses 5,185,474$
Total Expenditures 37,957,527$
Source: Fiscal Year 2008 Adopted Budget, page 325 (page 340
in PDF view)
(http://www3.coj.net/Departments/Finance/Docs/Budget/200
7-2008-annual-budget-121007.aspx)
Source: 2008 Fiscal Year Adopted Budget, page 79 (page 85
in PDF view)
(http://www3.coj.net/Departments/Finance/Docs/Budget/20
07-2008-annual-budget-121007.aspx) Source: 2008 Fiscal Year Adopted Budget, page 79 (page 85 in
PDF view)
(http://www3.coj.net/Departments/Finance/Docs/Budget/200
7-2008-annual-budget-121007.aspx)
City of Jacksonville Total Revenues by Source,
FY 2008 Adopted Budget
City of Jacksonville Total Expenditures by Use,
FY 2008 Adopted Budget
City of Jacksonville Public Libraries Revenues by Source,
FY 2008 Adopted Budget
City of Jacksonville Public Libraries Expenditures by Use,
FY 2008 Adopted Budget
City of Jacksonville General Fund Revenues by Source,
FY 2008 Adopted Budget
City of Jacksonville General Fund Expenditures by Use,
FY 2008 Adopted Budget
Source: 2008 Fiscal Year Adopted Budget, page 36 (page 41 in
PDF view)
(http://www3.coj.net/Departments/Finance/Docs/Budget/200
7-2008-annual-budget-121007.aspx)
Source: 2008 Fiscal Year Adopted Budget, page 36 (page 41
in PDF view)
(http://www3.coj.net/Departments/Finance/Docs/Budget/20
07-2008-annual-budget-121007.aspx)
*Note: Does not include a beginning fund balance of
$372,063,000.
Source: Budget Comparisons spreadsheet from Barrett King,
Deputy Director of the Jacksonville Public Library, email
communication (1/24/2011).
Appendix F- Detailed Source Tables Page F-52

Taxes, Licenses & Permits 771,929,000$ Salaries and Benefits 592,243,000$
Intergovernmental 151,934,000$ Operating Expenses 690,261,000$
General Government Charges 294,646,000$ Capital Outlay 49,626,000$
Earnings on Investments 20,005,000$ Debt Service 159,356,000$
Fines and Forfeitures 6,275,000$ Assistance to other agencies 178,373,000$
Charges for Services 166,258,000$ Contributions to other funds 136,473,000$
Special Assessments $ - Total Expenses 1,806,332,000$
Miscellaneous $ 30,331,000
Banking Fund Borrowings $ 133,295,000
Contributions from Other Funds $ 206,974,000
Total Revenue* $ 1,781,647,000
Taxes $ 619,920,236 Personnel Expenses 499,967,243$
Licenses and Permits 8,583,947$ (Libraries: $19,191,867)
Intergovernmental 241,262,312$ Operating Expenses 230,299,824$
Charges for Services 60,726,152$ (Libraries: $8,827,871)
Fines and Forfeits 4,696,846$ Capital Outlay 9,812,636$
Miscellaneous Revenue 27,425,503$ (Libraries: $3,794,673)
Other Sources 8,826,493$ Debt Service 1,101,322$
Total Revenue $ 971,441,489 Grants and Aids 34,597,216$
Other Uses 195,663,248$
(Libraries: $6,872,583)
Total Expenses 971,441,489$
General Fund 38,361,994$ Personnel Expenses 19,191,867$
State Aid 1,145,676$ Operating Expenses 8,827,871$
Private Donations 180,435$ Capital Outlay 3,794,673$
Total Revenues 39,688,105$ Other Uses 6,872,583$
Total Expenditures 38,686,994$
Source: 2009 Fiscal Year Adopted Budget, page 40 (page 44 in
PDF view)
(http://www3.coj.net/Departments/Finance/Docs/Budget/bu
dget120808a.aspx)
Source: Budget Comparisons spreadsheet from Barrett King,
Deputy Director of the Jacksonville Public Library, email
communication (1/24/2011).
City of Jacksonville Total Revenues by Source,
FY 2009 Adopted Budget
City of Jacksonville Total Expenditures by Use,
FY 2009 Adopted Budget
City of Jacksonville Public Libraries Revenues by Source,
FY 2009 Adopted Budget
City of Jacksonville Public Libraries Expenditures by Use,
FY 2009 Adopted Budget
City of Jacksonville General Fund Revenues by Source,
FY 2009 Adopted Budget
City of Jacksonville General Fund Expenditures by Use,
FY 2009 Adopted Budget
Source: 2009 Fiscal Year Adopted Budget, page 40 (page 44 in
PDF view)
(http://www3.coj.net/Departments/Finance/Docs/Budget/budget
120808a.aspx)
Source: 2009 Fiscal Year Adopted Budget, page 77 (page 82
PDF view)
(http://www3.coj.net/Departments/Finance/Docs/Budget/bu
dget120808a.aspx)
*Note: Does not include a beginning fund balance of
$304,581,000.
Source: 2009 Fiscal Year Adopted Budget, page 77 (page 82 PDF
view)
(http://www3.coj.net/Departments/Finance/Docs/Budget/budget
120808a.aspx)
Source: Fiscal Year 2009 Adopted Budget, page 383 (page 395
PDF view)
(http://www3.coj.net/Departments/Finance/Docs/Budget/budget
120808a.aspx)
Appendix F- Detailed Source Tables Page F-53
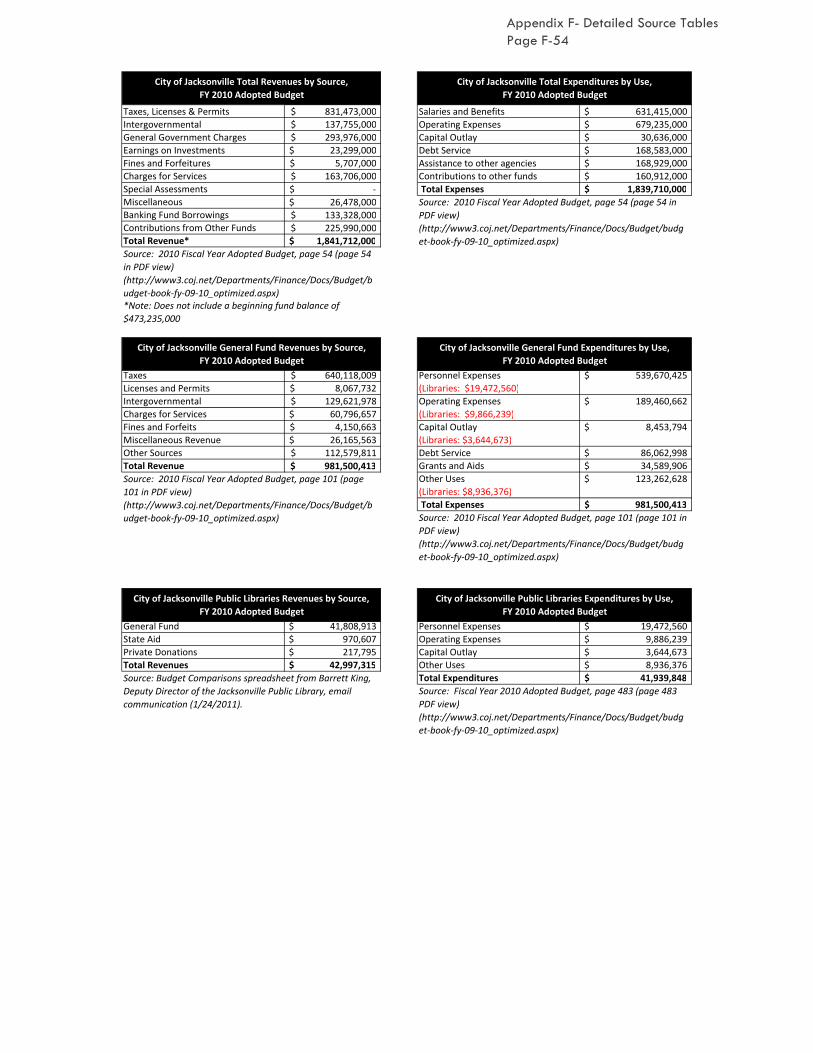
Taxes, Licenses & Permits 831,473,000$ Salaries and Benefits 631,415,000$
Intergovernmental 137,755,000$ Operating Expenses 679,235,000$
General Government Charges 293,976,000$ Capital Outlay 30,636,000$
Earnings on Investments 23,299,000$ Debt Service 168,583,000$
Fines and Forfeitures 5,707,000$ Assistance to other agencies 168,929,000$
Charges for Services 163,706,000$ Contributions to other funds 160,912,000$
Special Assessments -$ Total Expenses 1,839,710,000$
Miscellaneous 26,478,000$
Banking Fund Borrowings 133,328,000$
Contributions from Other Funds 225,990,000$
Total Revenue* 1,841,712,000$
Taxes 640,118,009$ Personnel Expenses 539,670,425$
Licenses and Permits 8,067,732$ (Libraries: $19,472,560)
Intergovernmental 129,621,978$ Operating Expenses 189,460,662$
Charges for Services 60,796,657$ (Libraries: $9,866,239)
Fines and Forfeits 4,150,663$ Capital Outlay 8,453,794$
Miscellaneous Revenue 26,165,563$ (Libraries: $3,644,673)
Other Sources 112,579,811$ Debt Service 86,062,998$
Total Revenue 981,500,413$ Grants and Aids 34,589,906$
Other Uses 123,262,628$
(Libraries: $8,936,376)
Total Expenses 981,500,413$
General Fund 41,808,913$ Personnel Expenses 19,472,560$
State Aid 970,607$ Operating Expenses 9,886,239$
Private Donations 217,795$ Capital Outlay 3,644,673$
Total Revenues 42,997,315$ Other Uses 8,936,376$
Total Expenditures 41,939,848$
Source: Fiscal Year 2010 Adopted Budget, page 483 (page 483
PDF view)
(http://www3.coj.net/Departments/Finance/Docs/Budget/budg
et-book-fy-09-10_optimized.aspx)
*Note: Does not include a beginning fund balance of
$473,235,000
Source: 2010 Fiscal Year Adopted Budget, page 101 (page 101 in
PDF view)
(http://www3.coj.net/Departments/Finance/Docs/Budget/budg
et-book-fy-09-10_optimized.aspx)
City of Jacksonville Total Revenues by Source,
FY 2010 Adopted Budget
City of Jacksonville Total Expenditures by Use,
FY 2010 Adopted Budget
City of Jacksonville General Fund Revenues by Source,
FY 2010 Adopted Budget
City of Jacksonville General Fund Expenditures by Use,
FY 2010 Adopted Budget
Source: 2010 Fiscal Year Adopted Budget, page 54 (page 54 in
PDF view)
(http://www3.coj.net/Departments/Finance/Docs/Budget/budg
et-book-fy-09-10_optimized.aspx)
City of Jacksonville Public Libraries Revenues by Source,
FY 2010 Adopted Budget
City of Jacksonville Public Libraries Expenditures by Use,
FY 2010 Adopted Budget
Source: 2010 Fiscal Year Adopted Budget, page 101 (page
101 in PDF view)
(http://www3.coj.net/Departments/Finance/Docs/Budget/b
udget-book-fy-09-10_optimized.aspx)
Source: Budget Comparisons spreadsheet from Barrett King,
Deputy Director of the Jacksonville Public Library, email
communication (1/24/2011).
Source: 2010 Fiscal Year Adopted Budget, page 54 (page 54
in PDF view)
(http://www3.coj.net/Departments/Finance/Docs/Budget/b
udget-book-fy-09-10_optimized.aspx)
Appendix F- Detailed Source Tables Page F-54

Taxes, Licenses & Permits 868,575,000$ Salaries and Benefits 630,030,000$
Intergovernmental 132,812,000$ Operating Expenses 648,129,000$
General Government Charges 294,413,000$ Capital Outlay 43,147,000$
Earnings on Investments 24,669,000$ Debt Service 221,955,000$
Fines and Forfeitures 4,712,000$ Assistance to other agencies 165,281,000$
Charges for Services 189,859,000$ Contributions to other funds 71,770,000$
Special Assessments $ - Total Expenses 1,780,312,000$
Miscellaneous $ 55,675,000
Banking Fund Borrowings $ 70,702,000
Contributions from Other Funds $ 159,479,000
Total Revenue* $ 1,800,896,000
Taxes $ 663,767,784 Personnel Expenses 531,922,100$
Licenses and Permits 7,775,760$ (Libraries: $18,449,921)
Intergovernmental 124,288,082$ Operating Expenses 209,172,576$
Charges for Services 59,241,942$ (Libraries: $9,972,109)
Fines and Forfeits 3,329,800$ Capital Outlay 7,233,859$
Miscellaneous Revenue 24,172,243$ (Libraries: $3,107,630)
Other Sources 107,790,227$ Debt Service 100,813,529$
Total Revenue $ 990,365,838 Grants and Aids 34,688,108$
Other Uses 106,535,666$
(Libraries: $8,213,899)
Total Expenses 990,365,838$
General Fund 39,602,759$ Personnel Expenses 18,449,921$
State Aid 819,841$ Operating Expenses 9,972,109$
Private Donations* N/A Capital Outlay 3,107,630$
Total Revenues 40,422,600$ Other Uses 8,213,899$
Total Expenditures 39,743,559$
Source: 2011 Fiscal Year Annual Budget, page 93 (page 93 in
PDF view)
(http://www3.coj.net/Departments/Finance/Docs/Budget/F
Y11-Department-Budgets/FY11-Budget-Book-FINAL.aspx) Source: 2011 Fiscal Year Annual Budget, page 93 (page 93 in PDF
view)
(http://www3.coj.net/Departments/Finance/Docs/Budget/FY11-
Department-Budgets/FY11-Budget-Book-FINAL.aspx)
Source: 2011 Fiscal Year Annual Budget, page 58 (page 58 in
PDF view)
(http://www3.coj.net/Departments/Finance/Docs/Budget/F
Y11-Department-Budgets/FY11-Budget-Book-FINAL.aspx)
*Note: Does not include a beginning fund balance of
$499,593,000. Total is $1,000 less from published source due
to rounding error.
City of Jacksonville Total Revenues by Source,
FY 2011 Adopted Budget
City of Jacksonville Total Expenditures by Use,
FY 2011 Adopted Budget
City of Jacksonville General Fund Revenues by Source,
FY 2011 Adopted Budget
City of Jacksonville General Fund Expenditures by Use,
FY 2011 Adopted Budget
Source: 2011 Fiscal Year Annual Budget, page 58 (page 58 in PDF
view)
(http://www3.coj.net/Departments/Finance/Docs/Budget/FY11-
Department-Budgets/FY11-Budget-Book-FINAL.aspx)
*Note: 2011 Fiscal Year Private Donations figures are not
yet available
City of Jacksonville Public Libraries Revenues by Source,
FY 2011 Adopted Budget
City of Jacksonville Public Libraries Expenditures by Use,
FY 2011 Adopted Budget
Source: Budget Comparisons spreadsheet from Barrett King,
Deputy Director of the Jacksonville Public Library, email
communication (1/24/2011).
Source: Fiscal Year 2011 Annual Budget, page 525 (page 525 in PDF
view)
(http://www3.coj.net/Departments/Finance/Docs/Budget/FY11-
Department-Budgets/FY11-Budget-Book-FINAL.aspx)
Appendix F- Detailed Source Tables Page F-55

Taxes, Licenses & Permits 838,247,000$ Salaries and Benefits 608,764,000$
Intergovernmental 136,580,000$ Operating Expenses 695,057,000$
General Government Charges 292,453,000$ Capital Outlay 46,290,000$
Earnings on Investments 17,471,000$ Debt Service 172,833,000$
Fines and Forfeitures 3,930,000$ Assistance to other agencies 170,660,000$
Charges for Services 185,671,000$ Contributions to other funds 61,139,000$
Special Assessments ‐$ Total Expenses 1,754,743,000$
Miscellaneous $ 30,884,000
Banking Fund Borrowings $ 76,032,000
Contributions from Other Funds $ 159,415,000
Total Revenue* $ 1,740,683,000
Taxes $ 581,461,763 Personnel Expenses 498,122,103$
Licenses and Permits 6,705,490$ (Libraries: $17,911,352)
Intergovernmental 117,825,036$ Operating Expenses 191,585,424$
Charges for Services 62,265,263$ (Libraries: $8,570,287)
Fines and Forfeits 2,873,781$ Capital Outlay 5,747,563$
Miscellaneous Revenue 22,032,324$ (Libraries: $3,107,630)
Other Sources 164,763,465$ Debt Service 97,708,566$
Total Revenue $ 957,927,122 Grants and Aids 40,232,939$
Other Uses 124,530,526$
(Libraries: $8,624,606)
Total Expenses* 957,927,121$
General Fund (budgeted) 38,213,875$ Personnel Expenses 17,911,352$
Charges for Services 1,560,000$ Operating Expenses 8,570,287$
Miscellaneous Revenue 43,000$ Capital Outlay 3,107,630$
Total Revenues 39,816,875$ Other Uses 8,624,606$
Total Expenditures 38,213,875$
City of Jacksonville General Fund Revenues by Source,
FY 2012 Adopted Budget
City of Jacksonville General Fund Expenditures by Use,
FY 2012 Adopted Budget
City of Jacksonville Total Revenues by Source,
FY 2012 Adopted Budget
City of Jacksonville Total Expenditures by Use,
FY 2012 Adopted Budget
Source: 2012 Fiscal Year Annual Budget, page 58 (page 58 in PDF
view)
(http://www.coj.net/getattachment/Departments/Finance/Budget
/Adopted‐Annual‐Budget‐FY‐11‐‐‐FY‐12‐with‐page‐
numbers.pdf.aspx)Source: 2012 Fiscal Year Annual Budget, page 58 (page 58 in
PDF view)
(http://www.coj.net/getattachment/Departments/Finance/
Budget/Adopted‐Annual‐Budget‐FY‐11‐‐‐FY‐12‐with‐page‐
*Note: Does not include a beginning fund balance of
$584,839,000. Total is $1,000 less from published source due
to rounding error.
Source: 2012 Fiscal Year Annual Budget, page 90 (page 90 in
PDF view)
(http://www.coj.net/getattachment/Departments/Finance/
Budget/Adopted‐Annual‐Budget‐FY‐11‐‐‐FY‐12‐with‐page‐
numbers.pdf.aspx)
Source: 2012 Fiscal Year Annual Budget, page 93 (page 93 in PDF
view)
(http://www.coj.net/getattachment/Departments/Finance/Budget
/Adopted‐Annual‐Budget‐FY‐11‐‐‐FY‐12‐with‐page‐
City of Jacksonville Public Libraries Revenues by Source,
FY 2012 Adopted Budget
City of Jacksonville Public Libraries Expenditures by Use,
FY 2012 Adopted Budget
Source: Fiscal Year 2012 Annual Budget, page 134 (page 134 in PDF
view)
(http://www.coj.net/getattachment/Departments/Finance/Budget
/Adopted‐Annual‐Budget‐FY‐11‐‐‐FY‐12‐with‐page‐
numbers.pdf.aspx)
*Note: Total is $1 less than published source due to rounding error.
Source: Fiscal Year 2012 Annual Budget, page 134 (page 134
in PDF view)
(http://www.coj.net/getattachment/Departments/Finance/
Budget/Adopted‐Annual‐Budget‐FY‐11‐‐‐FY‐12‐with‐page‐
numbers.pdf.aspx)
Appendix F- Detailed Source Tables Page F-56

Local Taxes 445,484,650$ General Government 153,495,009$
State Taxes 67,383,830$ Public Safety 319,618,848$
Licenses and Privileges 11,354,406$ Parks & Recreation 26,280,432$
Fines and Forfeitures 9,086,259$ Public Works 22,641,145$
Grants 1,686,490$ Solid Waste Management 47,104,435$
Charges for Service 226,217,682$ Sewer Fund 55,469,455$
Use of Money 7,486,679$ Storm Water Fund 10,668,549$
Intergovernmental 4,222,685$ Public Services & Neighborhoods 17,261,806$
Other Revenue 8,174,338$ Housing & Community Development 4,728,608$
Transfers In 191,382,569$ Judicial 17,744,257$
Total Revenues 972,479,588$ Health Services 13,225,000$
Memphis Area Transit Authority (MATA) 14,930,000$
Other Grants & Agencies 41,609,460$
Debt Service 131,700,888$
Interest and Other Costs 49,384,659$
Total Expenditures 925,862,551$
Local Taxes 365,305,898$ Personal Services 394,549,208$
State Taxes 61,060,816$ Materials & Supplies 101,919,285$
Licenses and Privileges 11,155,462$ Capital Outlay 2,840,655$
Fines and Forfeitures 8,147,943$ Grants & Subsidies 77,308,735$
Charges for Services 810,850$ Inventory 91,675$
Use of Money and Property 336,313$ Transfer Out 989,240$
Federal Grants $ - Charges for Services^ (37,614,496)$
Other Revenues $ 3,930,711 Total Expenditures (Net) 540,084,302$
Transfers In $ 91,034,745
Total Revenue $ 541,782,738
City of Memphis 13,368,000$ Personnel 11,623,000$
Shelby County 700,000$
City of Bartlett 1,051,000$
State and Federal 91,000$ Operating 3,541,000$
Fines and Fees 903,000$ Foundation for the Library 707,000$
Other 131,000$ Friends of the Library 98,000$
Foundation for the Library 634,000$ Total Expenditures 17,049,000$
Friends of the Library 117,000$
Total Revenue $ 16,995,000
**Note: Does not include a beginning fund balance of $308,910,853.
Source: 2008 Fiscal Year Adopted Budget, Summary, page S-2 (page 2 in
PDF view)
(http://www.memphistn.gov/pdf_forms/FY2008AdoptedOpBudget/Sum
mary.pdf)
City of Memphis Total Revenues by Source,
FY 2008 Actual Budget
City of Memphis Total Expenditures by Use,
FY 2008 Actual Budget
Source: 2010 Fiscal Year Adopted Operating Budget, Summary, City-WIde
Tax Policy, page S-13 (page 5 in PDF view)
(http://www.memphistn.gov/pdf_forms/FY2010_OpBudget/CityWide_Ta
xPolicy.pdf)
City of Memphis General Fund Expenditures by Use,
FY 2008 Adopted Budget
City of Memphis General Fund Revenues by Source,
FY 2008 Adopted Budget
*Note: 2008 City-Wide Adopted Budget not made available, therefore FY
2008 Actual numbers from the FY 2010 Adopted Budget were used.
*Note: 2008 City-Wide Adopted Budget not made available,
therefore FY 2008 Actual numbers from the FY 2010 Adopted Budget
were used.
Source: 2010 Fiscal Year Adopted Operating Budget, Summary, City-
WIde Tax Policy, page S-13 (page 5 in PDF view)
(http://www.memphistn.gov/pdf_forms/FY2010_OpBudget/CityWid
e_TaxPolicy.pdf)
Source: 2008 Fiscal Year Adopted Budget, Summary, page S-1 (page
1 in PDF view)
(http://www.memphistn.gov/pdf_forms/FY2008AdoptedOpBudget/
Summary.pdf)
^Note: Charges for Services are payments due for specific services
provided by the City of Memphis or for the use
of City Property.
Sources: 2008 Annual Report, Memphis Public Library & Information
Center, page 17 (page 17 in PDF view)
(http://www.memphislibrary.org/about/support/2008-Annual-
Report.pdf) 2009 Annual Report, Memphis Public Library &
Information Center, page 13 (page 15 in PDF view)
*Note: The City's FY 2008 Operating Budget page on "Public
Services & Neighborhoods" shows that the library's FY 2008 Adopted
Net Expenditures was $15,310,840
(http://www.memphistn.gov/pdf_forms/FY2008AdoptedOpBudget/
PublicServices.pdf)
Sources: 2008 Annual Report, Memphis Public Library & Information
Center, page 17 (page 17 in PDF view)
(http://www.memphislibrary.org/about/support/2008-Annual-
Report.pdf) 2009 Annual Report, Memphis Public Library & Information
Center, page 13 (page 15 in PDF view)
(http://www.memphislibrary.org/about/support/2009-annual-
report.pdf)
Memphis Public Library Expenses by Use,
Library Year 2008
Memphis Public Library Revenues by Source,
Library Year 2008
Materials, Technology Programs, Collections,
Books, Databases & Serials 1,080,000$
Appendix F- Detailed Source Tables Page F-57

Local Taxes 487,665,573$ General Government 183,930,970$
State Taxes 66,495,670$ Public Safety 347,070,322$
Licenses and Privileges 11,250,873$ Parks & Recreation 26,110,028$
Fines and Forfeitures 8,873,855$ Public Works 26,566,290$
Grants 1,293,173$ Special Revenue Fund 52,855,967$
Charges for Service 250,456,285$ Sewer Fund 52,319,850$
Use of Money 8,325,667$ Storm Water Fund 20,857,000$
Intergovernmental 2,477,423$ Public Services & Neighborhoods 21,390,013$
Other Revenue 11,833,176$ Housing & Community Development 5,167,148$
Transfers In 94,501,307$ Judicial 20,694,574$
Total Revenues** 943,173,002$ Health Services 13,754,191$
Memphis Area Transit Authority (MATA) 17,930,000$
Other Grants & Agencies 46,706,155$
Debt Service 62,284,534$
Interest and Other Costs 53,865,172$
Total Expenditures 951,502,214$
Local Taxes 409,048,979$ Personnel 424,540,459$
State Taxes 66,495,670$ Materials & Supplies 110,958,028$
Licenses and Privileges 11,250,873$ Capital Outlay 2,594,434$
Fines and Forfeitures 8,873,855$ Grants & Subsidies 77,722,936$
Charges for Services 912,877$ Inventory 91,675$
Use of Money and Property 4,375,667$ Transfer Out 5,666,003$
Federal Grants -$ Charges for Services^ (40,810,947)$
Other Revenues 4,156,533$ Total Expenditures (Net) 580,762,588$
Transfers In 75,687,785$
Total Revenue 580,802,239$
City of Memphis 14,264,000$ Personnel 11,867,000$
Shelby County 650,000$
City of Bartlett 979,000$
State and Federal -$ Operating 3,625,000$
Fines and Fees 741,000$ Foundation for the Library 397,000$
Other 14,000$ Total Expenditures 17,045,000$
Foundation for the Library 455,000$
Total Revenue 17,103,000$
*Note: The City's FY 2009 Operating Budget page on "Public
Services & Neighborhoods" was not made available, therefore the
library's 2009 Annual Report was used. Donations from "Friends of
the Library" could not be found for Library Year 2009.
City of Memphis General Fund Revenues by Source,
FY 2009 Adopted Budget
City of Memphis General Fund Expenditures by Use,
FY 2009 Adopted Budget
Source: 2009 Fiscal Year Adopted Budget, General Fund Summary,
page GFS- (page 1 in PDF view)
(http://www.memphistn.gov/pdf_forms/CIPAdoptedOpBudget/5-
GeneralFundSummary.pdf)
Source: 2009 Annual Report, Memphis Public Library & Information
Center, page 13 (page 15 PDF view)
(http://www.memphislibrary.org/about/support/2009-annual-
report.pdf)
Source: 2009 Annual Report, Memphis Public Library & Information
Center, page 13 (page 15 PDF view)
(http://www.memphislibrary.org/about/support/2009-annual-
report.pdf)
Materials, Technology Programs, Collections,
Books, Databases & Serials $ 1,156,000
*Note: 2009 City-Wide Adopted Budget not made available, therefore
FY 2009 Budget numbers from the FY 2010 Adopted Budget were
used.
*Note: 2009 City-Wide Adopted Budget not made available,
therefore FY 2009 Budget numbers from the FY 2010 Adopted
Budget were used.
*Note: Expenses for "Friends of the Library" could not be found for
Library Year 2009
Source: 2010 Fiscal Year Adopted Operating Budget, Summary, City-
WIde Tax Policy, page S-13 (page 5 in PDF view)
(http://www.memphistn.gov/pdf_forms/FY2010_OpBudget/CityWid
e_TaxPolicy.pdf)
City of Memphis Total Revenues by Source,
FY 2009 Operating Budget*
City of Memphis Total Expenditures by Use,
FY 2009 Operating Budget*
Memphis Public Library Revenues by Source,
Library Year 2009
Memphis Public Library Expenses by Use,
Library Year 2009
Source: 2010 Fiscal Year Adopted Operating Budget, Summary, City-
WIde Tax Policy, page S-13 (page 5 in PDF view)
(http://www.memphistn.gov/pdf_forms/FY2010_OpBudget/CityWide
_TaxPolicy.pdf)
**Note: Does not include a beginning fund balance of $355,527,890.
Source: 2009 Fiscal Year Adopted Budget, General Fund Summary,
page GFS-2 (page 2 in PDF view)
(http://www.memphistn.gov/pdf_forms/CIPAdoptedOpBudget/5-
GeneralFundSummary.pdf)
^Note: Charges for Services are payments due for specific services
provided by the City of Memphis or for the use
of City Property.
Appendix F- Detailed Source Tables Page F-58

Local Taxes 492,743,102$ General Government 182,151,724$
State Taxes 61,653,667$ Public Safety 357,805,523$
Licenses and Privileges 11,250,873$ Parks & Recreation 22,992,843$
Fines and Forfeitures 8,873,855$ Public Works 25,585,522$
Grants 1,068,869$ Solid Waste Management 52,444,884$
Charges for Service 265,966,334$ Sewer Fund 65,872,000$
Use of Money 7,465,669$ Storm Water Fund 22,271,000$
Intergovernmental 2,496,839$
Other Revenue 10,251,303$
Transfers In 89,438,089$ Housing & Community Development 4,691,213$
Total Revenues 951,208,600$ Judicial 17,551,063$
Health Services 5,000,000$
Memphis Area Transit Authority (MATA) 17,930,000$
Other Grants & Agencies 41,579,453$
Debt Service 64,938,016$
Interest and Other Costs 54,341,871$
Total Expenditures 953,921,890$
Local Taxes 412,614,167$ Personnel 428,870,165$
State Taxes 61,653,667$ Materials & Supplies 102,738,598$
Licenses and Privileges 11,250,873$ Capital Outlay 2,498,345$
Fines and Forfeitures 8,873,855$ Grants & Subsidies 62,393,239$
Grants -$ Inventory 91,675$
Charges for Services 912,877$ Transfer Out 4,853,041$
Use of Money 3,515,669$ Charges for Services^ (40,025,299)$
Other Revenues 4,156,471$ Total Expenditures (Net) 561,419,764$
Transfers 74,322,433$
Total Revenue 577,300,012$
City of Memphis* 16,910,288$ Personnel Services 12,099,775$
Shelby County Materials & Supplies 4,810,513$
City of Bartlett Capital Outlay -$
State and Federal Total Expenditures* 16,910,288$
Total Revenue $ 16,910,288
*Note: The county reports the share of the library's general fund as an
expenditure. Thus, for the purpose of this report, the library's general fund
revenue was budgeted from the county's general fund budget above.
City of Memphis General Fund Revenues by Source,
FY 2010 Adopted Operating Budget
City of Memphis General Fund Expenditures by Use,
FY 2010 Adopted Operating Budget
Memphis Public Library Services Revenues by Source,
FY 2010 Adopted Operating Budget
Memphis Public Library Expenditures by Use,
FY 2010 Adopted Operating Budget
*Note: Library Annual Reports for 2010 are not available. After speaking
to the library director (Keenon McCloy), we were directed to the Division of
Public Services and Neighborhoods section of the City of Memphis budget.
The listed amount was taken from the city's FY 2010 Adopted Operating
Budget, General Fund Expenditures, Public Services & Neighborhoods, page
GFE 294 (page 26 in PDF view)
(http://www.memphistn.gov/pdf_forms/FY2010_OpBudget/PUBLIC_SERVI
CES_NEIGHBORHOODS.pdf)
*Note: Library Annual Reports for 2010 are not available. After
speaking to the library director (Keenon McCloy), we were directed to
the Division of Public Services and Neighborhoods section of the City of
Memphis budget. The listed amount was taken from the city's FY 2010
Adopted Operating Budget, General Fund Expenditures, Public Services
& Neighborhoods, page GFE 294 (page 26 in PDF view)
(http://www.memphistn.gov/pdf_forms/FY2010_OpBudget/PUBLIC_SE
RVICES_NEIGHBORHOODS.pdf)
*Note: Does not include a beginning fund balance of $98,038,447.
City of Memphis Total Revenues by Source,
FY 2010 Adopted Operating Budget
City of Memphis Total Expenditures by Use,
FY 2010 Adopted Operating Budget
Source: 2010 Fiscal Year Adopted Budget, Summary, City-Wide Tax Policy,
page S-15 (page 7 in PDF view)
(http://www.memphistn.gov/pdf_forms/FY2010_OpBudget/CityWide_Tax
Policy.pdf)
Source: 2010 Fiscal Year Adopted Budget, Summary, City-Wide Tax
Policy, page S-15 (page 7 in PDF view)
(http://www.memphistn.gov/pdf_forms/FY2010_OpBudget/CityWide_
TaxPolicy.pdf)
Source: 2010 Fiscal Year Adopted Operating Budget, Summary, City-WIde
Tax Policy, page S-13 (page 5 in PDF view)
(http://www.memphistn.gov/pdf_forms/FY2010_OpBudget/CityWide_Tax
Policy.pdf)
Source: 2010 Fiscal Year Adopted Operating Budget, Summary, City-
WIde Tax Policy, page S-13, S-29 (page 5, 21 in PDF view)
(http://www.memphistn.gov/pdf_forms/FY2010_OpBudget/CityWide_
TaxPolicy.pdf)
Public Services & Neighborhoods
(Libraries: $16,910,288) 18,766,778$
*Note: Does not include a beginning fund balance of $333,876,379.
^Note: Charges for Services are payments due for specific services
provided by the City of Memphis or for the use
of City Property.
Appendix F- Detailed Source Tables Page F-59

Local Taxes 504,850,296$ General Government 63,283,143$
State Taxes 52,045,528$ Public Safety 388,478,240$
Licenses and Privileges 11,287,710$ Parks & Recreation 28,071,375$
Fines and Forfeitures 10,250,000$ Public Works 26,539,887$
Grants 131,000$ Special Revenue Fund 62,094,769$
Charges for Service 288,806,054$ Sewer Fund 75,766,000$
Use of Money 4,035,679$ Storm Water Fund 24,732,500$
Intergovernmental 2,072,243$ Internal Service Fund 156,912,193$
Divisional Revenue 42,606,558$
Other Revenue 42,799,807$
Transfers In 140,178,504$ Housing & Community Development 4,761,631$
Total Revenues 1,099,063,379$ Judicial 19,642,593$
Health Services -$
Memphis Area Transit Authority (MATA) 16,930,000$
Other Grants & Agencies 101,659,012$
Debt Service 24,099,970$
Interest and Other Costs 106,561,265$
Total Expenditures 1,123,332,879$
Local Taxes 422,636,835$ Personnel 437,928,476$
State Taxes 52,045,528$ Materials & Supplies 105,228,180$
Licenses and Privileges 11,287,710$ Capital Outlay 1,336,772$
Fines and Forfeitures 10,245,000$ Grants & Subsidies 63,601,398$
Grants -$ Inventory 75,300$
Charges for Services 917,400$ Transfer Out 64,996,056$
Use of Money 2,035,679$ Charges for Services^ (42,606,558)$
Divisional Revenue 42,606,558$ Total Expenditures (Net) 630,559,624$
Other Revenues 7,880,881$
Transfers 127,766,897$
Total Revenue 677,422,488$
City of Memphis* 17,503,447$ Personnel Services 12,588,304$
Shelby County Materials & Supplies 4,915,143$
City of Bartlett Capital Outlay -$
State and Federal Total Expenditures* 17,503,447$
Fines and Fees
Other
Total Revenue $ 17,503,447
Source: 2011 Fiscal Year Adopted Budget, Summary, City-Wide
Adopted Budget, page S-17 (page 4 in PDF view)
(http://memphistn.gov/pdf_forms/FY2011_AD_OP/CityWide_Adopte
dBudgetSummary.pdf)
^Note: Charges for Services are payments due for specific services
provided by the City of Memphis or for the use
of City Property.
Source: 2011 Fiscal Year Adopted Budget, Summary, City-Wide
Adopted Budget, page S-17 (page 4 in PDF view)
(http://memphistn.gov/pdf_forms/FY2011_AD_OP/CityWide_Adopte
dBudgetSummary.pdf)
*Note: Does not include a beginning fund balance of $77,140,839
Memphis Public Library Services Revenues by Source,
FY 2011 Adopted Operating Budget
Memphis Public Library Expenditures by Use,
FY 2011 Adopted Operating Budget
*Note: Library Annual Reports for 2011 are not available. After
speaking to the library director (Keenon McCloy), we were directed to
the Division of Public Services and Neighborhoods section of the City
of Memphis budget. The listed amount was taken from the city's FY
2011 Adopted Operating Budget, General Fund Expenditures, Public
Services & Neighborhoods, page GFE 299 (page 25 in PDF view)
(http://www.memphistn.gov/pdf_forms/FY2011_AD_OP/PUBLIC_SER
VICES_NEIGHBORHOODS.pdf)
*Note: Library Annual Reports for 2011 are not available. After
speaking to the library director (Keenon McCloy), we were directed to
the Division of Public Services and Neighborhoods section of the City
of Memphis budget. The listed amount was taken from the city's FY
2011 Adopted Operating Budget, General Fund Expenditures, Public
Services & Neighborhoods, page GFE 299 (page 25 in PDF
view)(http://www.memphistn.gov/pdf_forms/FY2011_AD_OP/PUBLI
C_SERVICES_NEIGHBORHOODS.pdf)
*Note: The county reports the share of the library's general fund as
an expenditure. Thus, for the purpose of this report, the library's
general fund revenue was budgeted from the county's general fund
budget above.
City of Memphis Total Revenues by Source,
FY 2011 Adopted Operating Budget
City of Memphis Total Expenditures by Use,
FY 2011 Adopted Operating Budget
City of Memphis General Fund Revenues by Source,
FY 2011 Adopted Operating Budget
City of Memphis General Fund Expenditures by Use,
FY 2011 Adopted Operating Budget
Public Services & Neighborhoods
(Libraries: $17,503,447) 23,800,301$
*Note: Does not include a beginning fund balance of $160,441,022
Source: 2011 Fiscal Year Adopted Budget, Summary, City-Wide
Adopted Budget, page S-16 (page 3 in PDF view)
(http://memphistn.gov/pdf_forms/FY2011_AD_OP/CityWide_Adopte
dBudgetSummary.pdf)
Source: 2011 Fiscal Year Adopted Operating Budget, Summary, City-
Wide Adopted Budget, pages S-16, S-30 (pages 3, 17 in PDF view)
(http://memphistn.gov/pdf_forms/FY2011_AD_OP/CityWide_Adopte
dBudgetSummary.pdf)
Appendix F- Detailed Source Tables Page F-60

Local Taxes 523,925,314$ Personnel 481,651,759$
State Taxes 56,548,505$ Materials & Supplies 185,138,848$
Licenses and Privileges 10,221,821$ Capital Outlay 4,768,770$
Fines and Forfeitures 21,117,500$ Grants & Subsidies 76,083,148$
Grants (Federal and State) 8,213,911$ Inventory 18,961,550$
Charges for Service 246,319,847$ Transfer Out 97,992,130$
Use of Money 1,938,151$ Health Claims Incurred 113,100,000$
Health Premium Revenues 115,534,103$ Interest and Bond Cost 116,789,440$
Intergovernmental 6,674,624$ Other Expenditures 4,826,853$
Proceeds from Refunding Bonds 75,400,000$ Retirement of Refunded Debt 75,400,000$
Other Revenue 26,844,651$ Planning & Development Grant 6,280,398$
Transfers In 124,351,823$ Total Expenditures 1,180,992,896$
Total Revenues 1,217,090,250$
Local Taxes 436,659,583$ Personnel 413,868,243$
State Taxes 56,548,505$ Materials & Supplies 108,189,401$
Licenses and Privileges 10,221,821$ Capital Outlay 959,592$
Fines and Forfeitures 21,117,500$ Grants & Subsidies 76,083,148$
Grants 1,793,067$ Inventory/ Other Expenses 225,300$
Charges for Services 31,636,225$ Transfer Out 62,075,084$
Use of Money 673,151$ Total Expenditures 661,400,768$
Other/Intergov't Revenues 31,446,847$
Transfers 98,486,897$
Total Revenue 688,583,596$
City of Memphis* 16,252,395$ Personnel Services 11,549,986$ Shelby County Materials & Supplies 4,702,409$
City of Bartlett Program Revenue (2,400,000)$
State and Federal Total Expenditures* 13,852,395$
Fines and Fees
Other
Total Revenue $ 16,252,395
*Note: Categories used in reporting expenditures changed in the 2012
Adopted Budget Report compared to previous reports.
Source: 2012 Fiscal Year Adopted Budget, Summary, City‐Wide
Adopted Budget, page 36 (page 10 in PDF view)
(http://memphistn.gov/pdf_forms/fy2012_adopted_op/CityWide_Ado
ptedBudgetSummary.pdf)
City of Memphis Total Revenues by Source,
FY 2012 Adopted Operating Budget
City of Memphis Total Expenditures by Use,
FY 2012 Adopted Operating Budget*
Source: 2012 Fiscal Year Adopted Budget, Summary, City‐Wide
Adopted Budget, page 36 (page 10 in PDF view)
(http://memphistn.gov/pdf_forms/fy2012_adopted_op/CityWide_Ado
ptedBudgetSummary.pdf)
Source: 2012 Fiscal Year Adopted Budget, Summary, City‐Wide
Adopted Budget, page 38 (page 12 in PDF view)
(http://memphistn.gov/pdf_forms/fy2012_adopted_op/CityWide_Ado
ptedBudgetSummary.pdf)Source: 2012 Fiscal Year Adopted Budget, Summary, City‐Wide
Adopted Budget, page 38 (page 12 in PDF view)
(http://memphistn.gov/pdf_forms/fy2012_adopted_op/CityWide_Ado
ptedBudgetSummary.pdf)
City of Memphis General Fund Revenues by Source,
FY 2012 Adopted Operating Budget
City of Memphis General Fund Expenditures by Use,
FY 2012 Adopted Operating Budget
Source: 2012 Fiscal Year Adopted Budget, pages 50‐51, 54, 274, 281
(pages 59‐60, 62, 282, 289 in PDF view)
(http://memphistn.gov/pdf_forms/fy2012_adopted_op/MemphisOpb
udget2012Adopted.pdf)
*Note: The city reports the share of the library's general fund as an
expenditure. Thus, for the purpose of this report, the library's general
fund revenue was budgeted from the city's general fund budget.
Memphis Public Library Services Revenues by Source,
FY 2012 Adopted Operating Budget
Memphis Public Library Expenditures by Use,
FY 2012 Adopted Operating Budget
Source: 2012 Fiscal Year Adopted Budget, pages 50‐51, 54, 274, 281
(pages 59‐60, 62, 282, 289 in PDF view)
(http://memphistn.gov/pdf_forms/fy2012_adopted_op/MemphisOpb
udget2012Adopted.pdf)
Appendix F- Detailed Source Tables Page F-61

Property Taxes 771,110,400$ General Government 152,987,100$
Local Option Sales Tax 290,463,100$ Fiscal Administration 16,577,900$
Grants & Contributions 280,655,400$ Administration of Justice 64,778,900$
All Other Revenues 201,767,400$ Law Enforcement & Jails 204,925,800$
Fund Balance Appropriated 21,786,800$ Fire Prevention & Control 111,964,500$
Total Revenues 1,565,783,100$ Regulation & Inspection 20,896,900$
Conservation of Resources 513,100$
Social Services 9,193,100$
Health & Hospitals 87,649,700$
Public Libraries 21,377,200$
Recreational & Cultural 47,810,600$
Infrastructure & Transportation 74,266,400$
Education 595,924,200$
Debt Service 156,917,700$
Transfers -$
Total Expenses 1,565,783,100$
Property Taxes 350,229,500$ General Government 129,418,100$
Local Option Sales Tax 96,093,000$ Fiscal Administration 16,577,900$
Grants & Contributions 77,833,400$ Administration of Justice 64,778,900$
All Other Revenues 176,743,700$ Law Enforcement & Jails 204,925,800$
Fund Balance Appropriated 5,395,200$ Fire Prevention & Control 48,666,400$
Total Revenues 706,294,800$ Regulation & Inspection 19,805,200$
Conservation of Resources 513,100$
Social Services 9,193,100$
Health & Hospitals 87,649,700$
Public Libraries 21,377,200$
Recreational & Cultural 47,675,200$
Infrastructure & Transportation 55,714,200$
Education -$
Debt Service -$
Total Expenses 706,294,800$
General Fund (budgeted)* 21,377,200$ General Fund: Personal Services 15,670,500$
Charges Commissions, & Fees** (617,000)$ General Fund: Utilities 1,566,300$
Special Purpose Fund: Federal Grants 14,300$ General Fund: Professional & Purchased Services 769,800$
Special Purpose Fund: State Grants 273,000$ General Fund: Travel, Tuition, and Dues 42,400$
Special Purpose Fund: Other Program Revenues 1,183,600$ General Fund: Communications 583,600$
Special Purpose Fund: Transfers from Other Funds 2,000$ General Fund: Repairs & Maintenance Services 482,600$
Total Revenue 22,233,100$ General Fund: Internal Service Fee 1,999,600$
General Fund: Other Expenses 793,000$
General Fund: Transfers to Other Funds -$
Special Purpose Fund: Personal Services 233,600$
Special Purpose Fund: Utilities -$
Special Purpose Fund: Professional & Purchased Services 47,000$
Special Purpose Fund: Travel, Tuition, and Dues 2,500$
Special Purpose Fund: Communications 17,800$
Special Purpose Fund: Repairs & Maintenance Services -$
Special Purpose Fund: Internal Service Fee -$
Special Purpose Fund: Other Expenses 260,100$
Special Purpose Fund: Special Projects 909,900$
Special Purpose Fund: Transfers to Other Funds 2,000$
Subtotal - General Fund Expenditures 23,380,700$
Subtotal - Special Purpose Fund Expenditures 1,472,900$
Total Expenditures 24,853,600$
Source: 2008 Fiscal Year Operating Budget, page A-3 (page 16 in PDF view)
(http://www.nashville.gov/citizens_budget/docs/budgetbook/fy2008/
fy08_final_budget.pdf)
Metropolitan Nashville, Davidson County Total Revenues
by Source,
FY 2008 Operating Budget
Metropolitan Nashville, Davidson County Total Expenditures
by Use,
FY 2008 Operating Budget
Source: 2008 Fiscal Year Operating Budget, page A-3 (page 16 in PDF view)
(http://www.nashville.gov/citizens_budget/docs/budgetbook/fy2008/
fy08_final_budget.pdf)
Metropolitan Nashville, Davidson County General Fund Revenues by Source,
FY 2008 Operating Budget
Metropolitan Nashville, Davidson County General Fund Expenditures by Use,
FY 2008 Operating Budget
Source: 2008 Fiscal Year Operating Budget, page A-3 (page 16 in PDF view)
(http://www.nashville.gov/citizens_budget/docs/budgetbook/fy2008/
fy08_final_budget.pdf)
Source: 2008 Fiscal Year Operating Budget, pages G-1, G-14, G-15 (pages 492, 504, 505 in
PDF view) (http://www.nashville.gov/citizens_budget/docs/budgetbook/fy2008/
fy08_final_budget.pdf)
*Note: The county reports the share of the library's general fund as an expenditure. Thus,
for the purpose of this report, the library's general fund revenue was budgeted from the
county's general fund budget above. If the library's share of the general fund is not
considered a revenue source for the library, its total revenues would only be $2,089,900
($617,000 from Charges & Fees + $1,472,900 from Special Funds) for 2008 fiscal year (page
G-1 or page 492 in PDF view).
Metropolitan Nashville, Davidson County Public Libraries Revenues by Source,
FY 2008 Operating Budget
Metropolitan Nashville, Davidson County Public Libraries Expenditures,
FY 2008 Operating Budget
Appendix F- Detailed Source Tables Page F-62

Property Taxes 763,046,200$ General Government 159,956,100$
Local Option Sales Tax 296,842,000$ Fiscal Administration 25,631,700$
Grants & Contributions 278,883,200$ Administration of Justice 57,959,300$
All Other Revenues 200,033,100$ Law Enforcement & Jails 199,216,900$
Fund Balance Appropriated 31,394,900$ Fire Prevention & Control 107,367,200$
Total Revenues 1,570,199,400$ Regulation & Inspection 20,304,700$
Conservation of Resources 476,800$
Social Services 8,830,700$
Health & Hospitals 84,095,700$
Public Libraries 19,981,100$
Recreational & Cultural 43,234,000$
Infrastructure & Transportation 64,666,500$
Education 619,007,900$
Debt Service 159,470,800$
Transfers -$
Total Expenses 1,570,199,400$
Property Taxes 346,440,000$ General Government 135,685,000$
Local Option Sales Tax 98,050,900$ Fiscal Administration 25,631,700$
Grants & Contributions 76,708,600$ Administration of Justice 57,959,300$
All Other Revenues 170,557,500$ Law Enforcement & Jails 199,216,900$
Fund Balance Appropriated -$ Fire Prevention & Control 47,227,500$ Total Revenues 691,757,000$ Regulation & Inspection 19,461,300$
Conservation of Resources 476,800$
Social Services 8,830,700$
Health & Hospitals 84,095,700$
Public Libraries 19,981,100$
Recreational & Cultural 42,876,300$
Infrastructure & Transportation 50,314,700$
Education -$
Debt Service -$ Total Expenses 691,757,000$
General Fund (budgeted)* 19,981,100$ General Fund: Personal Services 15,055,900$
Charges Commissions, & Fees (579,000)$ General Fund: Utilities 1,591,300$
Special Purpose Fund: Federal Grants 8,800$ General Fund: Professional & Purchased Services 543,700$
Special Purpose Fund: State Grants 273,000$ General Fund: Travel, Tuition, and Dues 24,400$
Special Purpose Fund: Other Program Revenues 918,400$ General Fund: Communications 657,900$
Special Purpose Fund: Transfers from Other Funds 2,000$ General Fund: Repairs & Maintenance Services 442,600$
Total Revenue 20,604,300$ General Fund: Internal Service Fee 1,279,300$
General Fund: Other Expenses 408,500$
General Fund: Transfers to Other Funds -$
Special Purpose Fund: Personal Services 265,600$
Special Purpose Fund: Utilities -$
Special Purpose Fund: Professional & Purchased Services 39,000$
Special Purpose Fund: Travel, Tuition, and Dues 2,500$
Special Purpose Fund: Communications 17,800$
Special Purpose Fund: Repairs & Maintenance Services -$
Special Purpose Fund: Internal Service Fee -$
Special Purpose Fund: Other Expenses 875,300$
Special Purpose Fund: Transfers to Other Funds 2,000$
Subtotal - General Fund Expenditures 21,205,800$
Subtotal - Special Purpose Fund Expenditures 1,202,200$
Total Expenditures 22,408,000$
Source: 2009 Fiscal Year Operating Budget, page A-4 (page 17 in PDF view)
(http://www.nashville.gov/citizens_budget/docs/budgetbook/fy2009/
fy09_final_budget.pdf)
Metropolitan Nashville, Davidson County Total Revenues
by Source,
FY 2009 Operating Budget
Metropolitan Nashville, Davidson County Total Expenditures
by Use,
FY 2009 Operating Budget
Metropolitan Nashville, Davidson County General Fund Revenues by Source,
FY 2009 Operating Budget
Metropolitan Nashville, Davidson County General Fund Expenditures by Use,
FY 2009 Operating Budget
Source: 2009 Fiscal Year Operating Budget, page A-4 (page 17 in PDF view)
(http://www.nashville.gov/citizens_budget/docs/budgetbook/fy2009/
fy09_final_budget.pdf)
Source: 2009 Fiscal Year Operating Budget, page A-4 (page 17 in PDF view)
(http://www.nashville.gov/citizens_budget/docs/budgetbook/fy2009/
fy09_final_budget.pdf)
Source: 2009 Fiscal Year Operating Budget, pages G-1, G-14, G-15 (pages 493, 506, 507 in
PDF view) (http://www.nashville.gov/citizens_budget/docs/budgetbook/fy2009/
fy09_final_budget.pdf)
*Note: The county reports the share of the library's general fund as an expenditure. Thus,
for the purpose of this report, the library's general fund revenue was budgeted from the
county's general fund budget above. If the library's share of the general fund is not
considered a revenue source for the library, its total revenues would only be $1,781,200
($579,000 from Charges & Fees + $1,472,900 from Special Funds) for 2009 fiscal year (page
G-1 or page 493 in PDF view).
**Note: According to Nashville's CFO, Chase Adams, this revenue collected by the library is
deposited back to the Metro's general fund and has no bearing on the library's operating
budget. Therefore, to be on the conservative side and to avoid double counting of this
source of revenue for the metro's general fund, this amount is subtracted from the library's
total revenue.
Source: 2009 Fiscal Year Operating Budget, page A-4 (page 17 in PDF view)
(http://www.nashville.gov/citizens_budget/docs/budgetbook/fy2009/
fy09_final_budget.pdf)
Source: 2009 Fiscal Year Operating Budget, pages G-1, G-14, G-15 (pages 493, 506, 507 in
PDF view) (http://www.nashville.gov/citizens_budget/docs/budgetbook/fy2009/
fy09_final_budget.pdf)
Metropolitan Nashville, Davidson County Public Libraries Revenues by Source,
FY 2009 Operating Budget
Metropolitan Nashville, Davidson County Public Libraries Expenditures,
FY 2009 Operating Budget
Appendix F- Detailed Source Tables Page F-63

Property Taxes 762,827,600$ General Government 162,455,200$
Local Option Sales Tax 272,818,200$ Fiscal Administration 23,192,100$
Grants & Contributions 282,721,000$ Administration of Justice 55,806,400$
All Other Revenues 187,799,500$ Law Enforcement & Jails 196,092,500$
Fund Balance Appropriated 35,996,400$ Fire Prevention & Control 104,296,500$
Total Revenues 1,542,162,700$ Regulation & Inspection 20,953,900$
Conservation of Resources 557,900$
Social Services 8,084,600$
Health & Hospitals 76,153,400$
Public Libraries 18,917,200$
Recreational & Cultural 39,592,900$
Infrastructure & Transportation 64,125,100$
Education 612,614,400$
Debt Service 159,320,600$
Transfers -$
Total Expenses 1,542,162,700$
Property Taxes 346,779,600$ General Government 137,501,900$
Local Option Sales Tax 88,034,900$ Fiscal Administration 23,192,100$
Grants & Contributions 74,581,300$ Administration of Justice 55,806,400$
All Other Revenues 158,348,900$ Law Enforcement & Jails 196,092,500$
Fund Balance Appropriated -$ Fire Prevention & Control 45,677,300$
Total Revenues 667,744,700$ Regulation & Inspection 19,654,300$
Conservation of Resources 557,900$
Social Services 8,084,600$
Health & Hospitals 76,153,400$
Public Libraries 18,917,200$
Recreational & Cultural 39,181,000$
Infrastructure & Transportation 46,926,100$
Education -$
Debt Service -$
Total Expenses 667,744,700$
General Fund (budgeted)* 18,917,200$ General Fund: Personal Services 13,495,100$
Charges Commissions, & Fees** (508,200)$ General Fund: Utilities 1,591,300$
Special Purpose Fund: Federal Grants 10,300$ General Fund: Professional & Purchased Services 544,300$
Special Purpose Fund: State Grants 273,000$ General Fund: Travel, Tuition, and Dues 14,400$
Special Purpose Fund: Other Program Revenues 1,023,400$ General Fund: Communications 613,600$
Special Purpose Fund: Transfers from Other Funds 2,000$ General Fund: Repairs & Maintenance Services 442,000$
Total Revenue 19,717,700$ General Fund: Internal Service Fee 1,386,400$
General Fund: Other Expenses 812,900$
General Fund: Transfers to Other Funds -$
Special Purpose Fund: Personal Services 395,600$
Special Purpose Fund: Utilities -$
Special Purpose Fund: Professional & Purchased Services 56,300$
Special Purpose Fund: Travel, Tuition, and Dues 2,500$
Special Purpose Fund: Communications 21,300$
Special Purpose Fund: Repairs & Maintenance Services 3,500$
Special Purpose Fund: Internal Service Fee -$
Special Purpose Fund: Other Expenses 827,500$
Special Purpose Fund: Transfers to Other Funds 2,000$
Subtotal - General Fund Expenditures 20,208,700$
Subtotal - Special Purpose Fund Expenditures 1,308,700$
Total Expenditures 21,517,400$
Source: 2010 Fiscal Year Operating Budget, page A-3 (page 20 in PDF view)
(http://www.nashville.gov/citizens_budget/docs/budgetbook/fy2010/
fy10_final_budget.pdf)
Metropolitan Nashville, Davidson County Total Revenues
by Source,
FY 2010 Operating Budget
Metropolitan Nashville, Davidson County Total Expenditures
by Use,
FY 2010 Operating Budget
Metropolitan Nashville, Davidson County General Fund Revenues by Source,
FY 2010 Operating Budget
Metropolitan Nashville, Davidson County General Fund Expenditures by Use,
FY 2010 Operating Budget
Source: 2010 Fiscal Year Operating Budget, page A-3 (page 20 in PDF view)
(http://www.nashville.gov/citizens_budget/docs/budgetbook/fy2010/
fy10_final_budget.pdf)
Source: 2010 Fiscal Year Operating Budget, page A-3 (page 20 in PDF view)
(http://www.nashville.gov/citizens_budget/docs/budgetbook/fy2010/
fy10_final_budget.pdf)
Source: 2010 Fiscal Year Operating Budget, pages H-1, H-12, H-13 (pages 512, 523, 524 in
PDF view) (http://www.nashville.gov/citizens_budget/docs/budgetbook/fy2010/
fy10_final_budget.pdf)
*Note: The county reports the share of the library's general fund as an expenditure. Thus,
for the purpose of this report, the library's general fund revenue was budgeted from the
county's general fund budget above. If the library's share of the general fund is not
considered a revenue source for the library, its total revenues would only be $1,816,900
($508,200 from Charges & Fees + $1,308,700 from Special Funds) for 2010 fiscal year (page
H-1 or page 512 in PDF view).
**Note: According to Nashville's CFO, Chase Adams, this revenue collected by the library is
deposited back to the Metro's general fund and has no bearing on the library's operating
budget. Therefore, to be on the conservative side and to avoid double counting of this
source of revenue for the metro's general fund, this amount is subtracted from the library's
total revenue.
Source: 2010 Fiscal Year Operating Budget, page A-3 (page 20 in PDF view)
(http://www.nashville.gov/citizens_budget/docs/budgetbook/fy2010/
fy10_final_budget.pdf)
Source: 2010 Fiscal Year Operating Budget, pages H-1, H-12, H-13 (pages 512, 523, 524 in
PDF view) (http://www.nashville.gov/citizens_budget/docs/budgetbook/fy2010/
fy10_final_budget.pdf)
Metropolitan Nashville, Davidson County Public Libraries Revenues by Source,
FY 2010 Operating Budget
Metropolitan Nashville, Davidson County Public Libraries Expenditures,
FY 2010 Operating Budget
Appendix F- Detailed Source Tables Page F-64
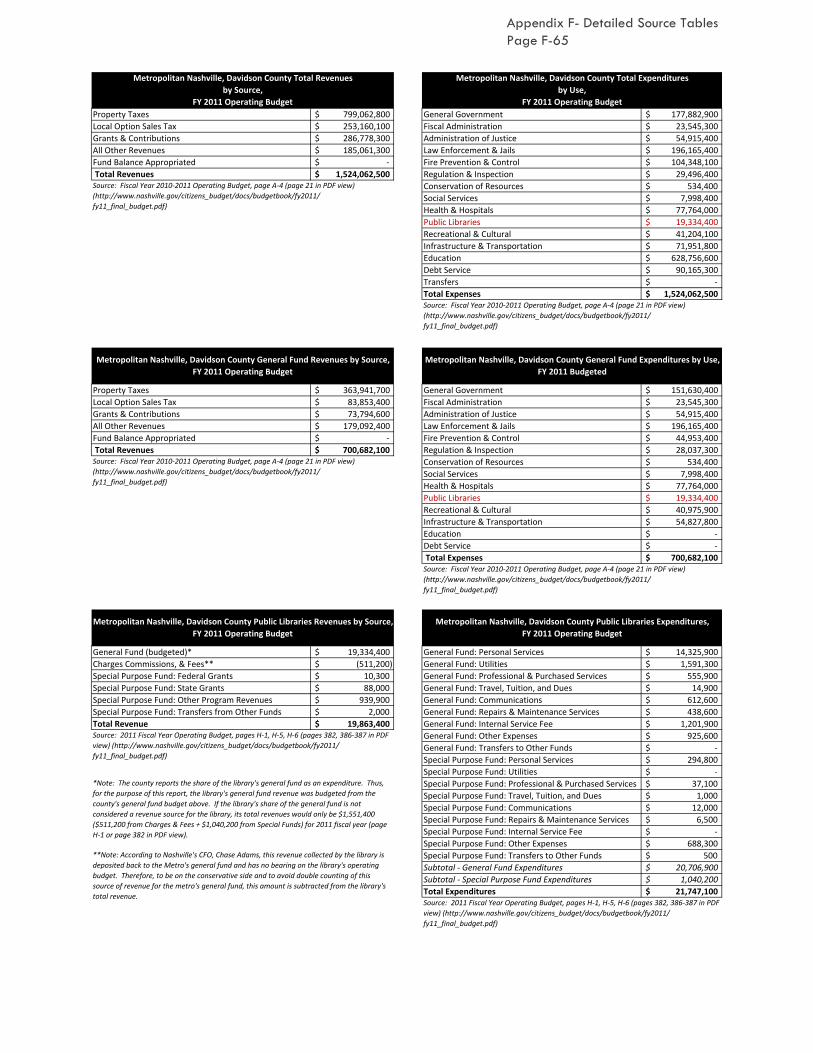
Property Taxes 799,062,800$ General Government 177,882,900$
Local Option Sales Tax 253,160,100$ Fiscal Administration 23,545,300$
Grants & Contributions 286,778,300$ Administration of Justice 54,915,400$
All Other Revenues 185,061,300$ Law Enforcement & Jails 196,165,400$
Fund Balance Appropriated -$ Fire Prevention & Control 104,348,100$
Total Revenues 1,524,062,500$ Regulation & Inspection 29,496,400$
Conservation of Resources 534,400$
Social Services 7,998,400$
Health & Hospitals 77,764,000$
Public Libraries 19,334,400$
Recreational & Cultural 41,204,100$
Infrastructure & Transportation 71,951,800$
Education 628,756,600$
Debt Service 90,165,300$
Transfers -$
Total Expenses 1,524,062,500$
Property Taxes 363,941,700$ General Government 151,630,400$
Local Option Sales Tax 83,853,400$ Fiscal Administration 23,545,300$
Grants & Contributions 73,794,600$ Administration of Justice 54,915,400$
All Other Revenues 179,092,400$ Law Enforcement & Jails 196,165,400$
Fund Balance Appropriated -$ Fire Prevention & Control 44,953,400$
Total Revenues 700,682,100$ Regulation & Inspection 28,037,300$
Conservation of Resources 534,400$
Social Services 7,998,400$
Health & Hospitals 77,764,000$
Public Libraries 19,334,400$
Recreational & Cultural 40,975,900$
Infrastructure & Transportation 54,827,800$
Education -$
Debt Service -$
Total Expenses 700,682,100$
General Fund (budgeted)* 19,334,400$ General Fund: Personal Services 14,325,900$
Charges Commissions, & Fees** (511,200)$ General Fund: Utilities 1,591,300$
Special Purpose Fund: Federal Grants 10,300$ General Fund: Professional & Purchased Services 555,900$
Special Purpose Fund: State Grants 88,000$ General Fund: Travel, Tuition, and Dues 14,900$
Special Purpose Fund: Other Program Revenues 939,900$ General Fund: Communications 612,600$
Special Purpose Fund: Transfers from Other Funds 2,000$ General Fund: Repairs & Maintenance Services 438,600$
Total Revenue 19,863,400$ General Fund: Internal Service Fee 1,201,900$
General Fund: Other Expenses 925,600$
General Fund: Transfers to Other Funds -$
Special Purpose Fund: Personal Services 294,800$
Special Purpose Fund: Utilities -$
Special Purpose Fund: Professional & Purchased Services 37,100$
Special Purpose Fund: Travel, Tuition, and Dues 1,000$
Special Purpose Fund: Communications 12,000$
Special Purpose Fund: Repairs & Maintenance Services 6,500$
Special Purpose Fund: Internal Service Fee -$
Special Purpose Fund: Other Expenses 688,300$
Special Purpose Fund: Transfers to Other Funds 500$
Subtotal - General Fund Expenditures 20,706,900$
Subtotal - Special Purpose Fund Expenditures 1,040,200$
Total Expenditures 21,747,100$
Metropolitan Nashville, Davidson County Total Revenues
by Source,
FY 2011 Operating Budget
Metropolitan Nashville, Davidson County Total Expenditures
by Use,
FY 2011 Operating Budget
Source: Fiscal Year 2010-2011 Operating Budget, page A-4 (page 21 in PDF view)
(http://www.nashville.gov/citizens_budget/docs/budgetbook/fy2011/
fy11_final_budget.pdf)
Source: Fiscal Year 2010-2011 Operating Budget, page A-4 (page 21 in PDF view)
(http://www.nashville.gov/citizens_budget/docs/budgetbook/fy2011/
fy11_final_budget.pdf)
Metropolitan Nashville, Davidson County General Fund Revenues by Source,
FY 2011 Operating Budget
Metropolitan Nashville, Davidson County General Fund Expenditures by Use,
FY 2011 Budgeted
Source: Fiscal Year 2010-2011 Operating Budget, page A-4 (page 21 in PDF view)
(http://www.nashville.gov/citizens_budget/docs/budgetbook/fy2011/
fy11_final_budget.pdf)
Source: Fiscal Year 2010-2011 Operating Budget, page A-4 (page 21 in PDF view)
(http://www.nashville.gov/citizens_budget/docs/budgetbook/fy2011/
fy11_final_budget.pdf)
Source: 2011 Fiscal Year Operating Budget, pages H-1, H-5, H-6 (pages 382, 386-387 in PDF
view) (http://www.nashville.gov/citizens_budget/docs/budgetbook/fy2011/
fy11_final_budget.pdf)
*Note: The county reports the share of the library's general fund as an expenditure. Thus,
for the purpose of this report, the library's general fund revenue was budgeted from the
county's general fund budget above. If the library's share of the general fund is not
considered a revenue source for the library, its total revenues would only be $1,551,400
($511,200 from Charges & Fees + $1,040,200 from Special Funds) for 2011 fiscal year (page
H-1 or page 382 in PDF view).
**Note: According to Nashville's CFO, Chase Adams, this revenue collected by the library is
deposited back to the Metro's general fund and has no bearing on the library's operating
budget. Therefore, to be on the conservative side and to avoid double counting of this
source of revenue for the metro's general fund, this amount is subtracted from the library's
total revenue.
Source: 2011 Fiscal Year Operating Budget, pages H-1, H-5, H-6 (pages 382, 386-387 in PDF
view) (http://www.nashville.gov/citizens_budget/docs/budgetbook/fy2011/
fy11_final_budget.pdf)
Metropolitan Nashville, Davidson County Public Libraries Revenues by Source,
FY 2011 Operating Budget
Metropolitan Nashville, Davidson County Public Libraries Expenditures,
FY 2011 Operating Budget
Appendix F- Detailed Source Tables Page F-65

Property Taxes 793,717,900$ General Government 175,232,400$
Local Option Sales Tax 264,196,600$ Fiscal Administration 22,808,900$
Grants & Contributions 315,863,700$ Administration of Justice 54,888,300$
All Other Revenues 187,403,100$ Law Enforcement & Jails 205,571,200$
Fund Balance Appropriated 24,597,400$ Fire Prevention & Control 107,104,600$
Total Revenues 1,585,778,700$ Regulation & Inspection 31,897,000$
Conservation of Resources 519,100$
Social Services 8,087,500$
Health & Hospitals 77,768,400$
Public Libraries 20,183,400$
Recreational & Cultural 42,423,300$
Infrastructure & Transportation 76,769,300$
Education 669,743,300$
Debt Service 92,782,000$
Transfers ‐$
Total Expenses 1,585,778,700$
Property Taxes 360,698,800$ General Government 150,697,000$
Local Option Sales Tax 87,428,700$ Fiscal Administration 22,808,900$
Grants & Contributions 77,634,000$ Administration of Justice 54,888,300$
All Other Revenues 193,341,800$ Law Enforcement & Jails 205,571,200$
Fund Balance Appropriated ‐$ Fire Prevention & Control 46,080,200$
Total Revenues 719,103,300$ Regulation & Inspection 30,315,400$
Conservation of Resources 519,100$
Social Services 8,087,500$
Health & Hospitals 77,768,400$
Public Libraries 20,183,400$
Recreational & Cultural 42,223,300$
Infrastructure & Transportation 59,960,600$
Education ‐$
Debt Service ‐$
Total Expenses 719,103,300$
General Fund (budgeted)* 20,183,400$ General Fund: Personal Services 14,673,200$
Charges Commissions, & Fees** (485,400)$ General Fund: Utilities 1,643,100$
Special Purpose Fund: Federal Grants 18,800$ General Fund: Professional & Purchased Services 488,700$
Special Purpose Fund: State Grants 267,000$ General Fund: Travel, Tuition, and Dues 17,700$
Special Purpose Fund: Other Program Revenues 1,137,800$ General Fund: Communications 569,900$
Special Purpose Fund: Transfers from Other Funds 200$ General Fund: Repairs & Maintenance Services 478,700$
Total Revenue 21,121,800$ General Fund: Internal Service Fee 1,046,700$
General Fund: Other Expenses 1,416,600$
General Fund: Transfers to Other Funds ‐$
Special Purpose Fund: Personal Services 272,500$
Special Purpose Fund: Utilities ‐$
Special Purpose Fund: Professional & Purchased Services 115,200$
Special Purpose Fund: Travel, Tuition, and Dues 1,500$
Special Purpose Fund: Communications 12,000$
Special Purpose Fund: Repairs & Maintenance Services 8,800$
Special Purpose Fund: Internal Service Fee ‐$
Special Purpose Fund: Other Expenses 1,013,600$
Special Purpose Fund: Transfers to Other Funds 200$
Subtotal ‐ General Fund Expenditures 20,334,600$
Subtotal ‐ Special Purpose Fund Expenditures 1,423,800$
Total Expenditures 21,758,400$
Metropolitan Nashville, Davidson County Total Revenues
by Source,
FY 2012 Operating Budget
Metropolitan Nashville, Davidson County Total Expenditures
by Use,
FY 2012 Operating Budget
Source: Fiscal Year 2011‐2012 Operating Budget, page A‐4 (page 21 in PDF view)
(http://www.nashville.gov/citizens_budget/docs/budgetbook/fy2012/fy12_final_budget.pd
f)
Source: Fiscal Year 2010‐2011 Operating Budget, page A‐4 (page 21 in PDF view)
(http://www.nashville.gov/citizens_budget/docs/budgetbook/fy2012/fy12_final_budget.p
df)
Metropolitan Nashville, Davidson County General Fund Revenues by Source,
FY 2012 Operating Budget
Metropolitan Nashville, Davidson County General Fund Expenditures by Use,
FY 2012 Budgeted
**Note: According to Nashville's CFO, Chase Adams, this revenue collected by the library is
deposited back to the Metro's general fund and has no bearing on the library's operating
budget. Therefore, to be on the conservative side and to avoid double counting of this
source of revenue for the metro's general fund, this amount is subtracted from the library's
total revenue.Source: 2012 Fiscal Year Operating Budget, pages I‐5 through I‐6 (pages 396‐397 in PDF
view)
(http://www.nashville.gov/citizens_budget/docs/budgetbook/fy2012/fy12_final_budget.p
df)
Source: Fiscal Year 2011‐2012 Operating Budget, page A‐4 (page 21 in PDF view)
(http://www.nashville.gov/citizens_budget/docs/budgetbook/fy2012/fy12_final_budget.pd
f)
Source: Fiscal Year 2011‐2012 Operating Budget, page A‐4 (page 21 in PDF view)
(http://www.nashville.gov/citizens_budget/docs/budgetbook/fy2012/fy12_final_budget.p
df)
Metropolitan Nashville, Davidson County Public Libraries Revenues by Source,
FY 2012 Operating Budget
Metropolitan Nashville, Davidson County Public Libraries Expenditures,
FY 2012 Operating Budget
Source: 2012 Fiscal Year Operating Budget, pages I‐1 through I‐8 (pages 392‐399 in PDF
view)
(http://www.nashville.gov/citizens_budget/docs/budgetbook/fy2012/fy12_final_budget.pd
f)
*Note: The county reports the share of the library's general fund as an expenditure. Thus,
for the purpose of this report, the library's general fund revenue was budgeted from the
county's general fund budget above. If the library's share of the general fund is not
considered a revenue source for the library, its total revenues would only be $1,909,200
($485,400 from Charges & Fees + $1,423,800 from Special Funds) for 2012 fiscal year (page I‐
1 or page 392 in PDF view).
Appendix F- Detailed Source Tables Page F-66
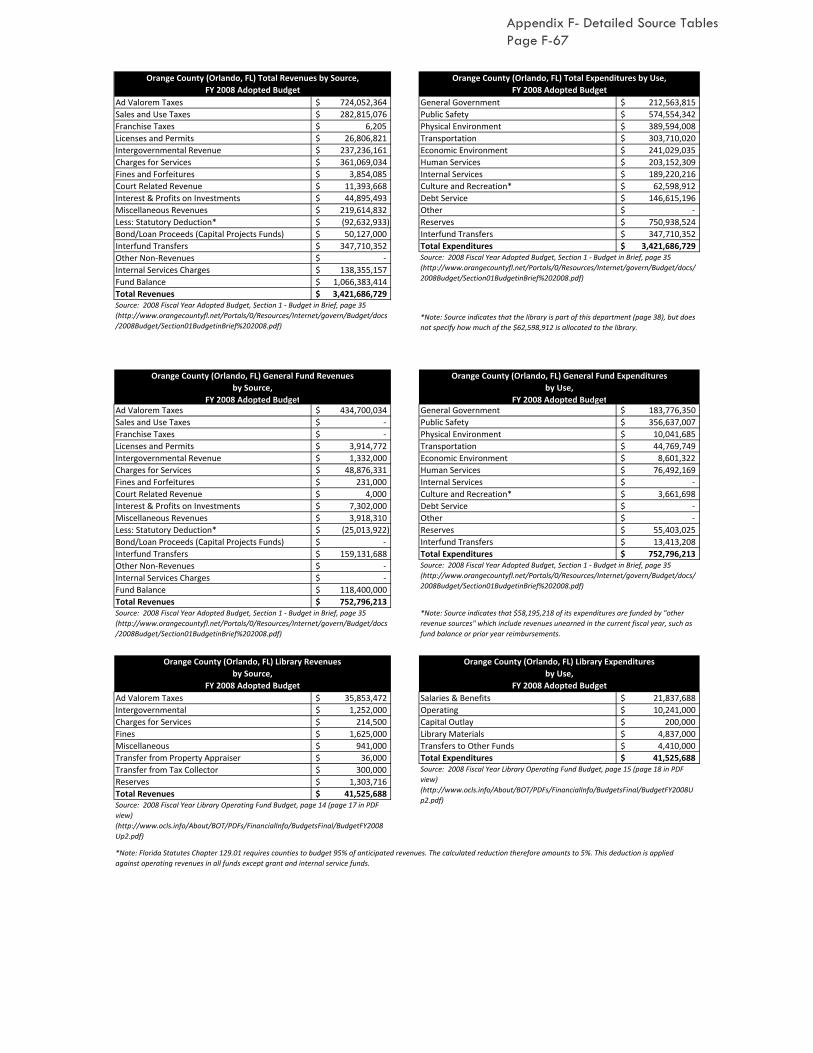
Ad Valorem Taxes 724,052,364$ General Government 212,563,815$
Sales and Use Taxes 282,815,076$ Public Safety 574,554,342$
Franchise Taxes 6,205$ Physical Environment 389,594,008$
Licenses and Permits 26,806,821$ Transportation 303,710,020$
Intergovernmental Revenue 237,236,161$ Economic Environment 241,029,035$
Charges for Services 361,069,034$ Human Services 203,152,309$
Fines and Forfeitures 3,854,085$ Internal Services 189,220,216$
Court Related Revenue 11,393,668$ Culture and Recreation* 62,598,912$
Interest & Profits on Investments 44,895,493$ Debt Service 146,615,196$
Miscellaneous Revenues 219,614,832$ Other -$
Less: Statutory Deduction* (92,632,933)$ Reserves 750,938,524$
Bond/Loan Proceeds (Capital Projects Funds) 50,127,000$ Interfund Transfers 347,710,352$
Interfund Transfers 347,710,352$ Total Expenditures 3,421,686,729$
Other Non-Revenues -$
Internal Services Charges 138,355,157$
Fund Balance 1,066,383,414$
Total Revenues 3,421,686,729$
Ad Valorem Taxes 434,700,034$ General Government 183,776,350$
Sales and Use Taxes -$ Public Safety 356,637,007$
Franchise Taxes -$ Physical Environment 10,041,685$
Licenses and Permits 3,914,772$ Transportation 44,769,749$
Intergovernmental Revenue 1,332,000$ Economic Environment 8,601,322$
Charges for Services 48,876,331$ Human Services 76,492,169$
Fines and Forfeitures 231,000$ Internal Services -$
Court Related Revenue 4,000$ Culture and Recreation* 3,661,698$
Interest & Profits on Investments 7,302,000$ Debt Service -$
Miscellaneous Revenues 3,918,310$ Other -$
Less: Statutory Deduction* (25,013,922)$ Reserves 55,403,025$
Bond/Loan Proceeds (Capital Projects Funds) -$ Interfund Transfers 13,413,208$
Interfund Transfers 159,131,688$ Total Expenditures 752,796,213$
Other Non-Revenues -$
Internal Services Charges -$
Fund Balance 118,400,000$
Total Revenues 752,796,213$
Ad Valorem Taxes 35,853,472$ Salaries & Benefits 21,837,688$
Intergovernmental 1,252,000$ Operating 10,241,000$
Charges for Services 214,500$ Capital Outlay 200,000$
Fines 1,625,000$ Library Materials 4,837,000$
Miscellaneous 941,000$ Transfers to Other Funds 4,410,000$
Transfer from Property Appraiser 36,000$ Total Expenditures 41,525,688$
Transfer from Tax Collector 300,000$
Reserves 1,303,716$
Total Revenues 41,525,688$
Orange County (Orlando, FL) Total Revenues by Source,
FY 2008 Adopted Budget
Orange County (Orlando, FL) Total Expenditures by Use,
FY 2008 Adopted Budget
Source: 2008 Fiscal Year Adopted Budget, Section 1 - Budget in Brief, page 35
(http://www.orangecountyfl.net/Portals/0/Resources/Internet/govern/Budget/docs
/2008Budget/Section01BudgetinBrief%202008.pdf)
Source: 2008 Fiscal Year Adopted Budget, Section 1 - Budget in Brief, page 35
(http://www.orangecountyfl.net/Portals/0/Resources/Internet/govern/Budget/docs/
2008Budget/Section01BudgetinBrief%202008.pdf)
*Note: Source indicates that the library is part of this department (page 38), but does
not specify how much of the $62,598,912 is allocated to the library.
Source: 2008 Fiscal Year Library Operating Fund Budget, page 14 (page 17 in PDF
view)
(http://www.ocls.info/About/BOT/PDFs/FinancialInfo/BudgetsFinal/BudgetFY2008
Up2.pdf)
*Note: Florida Statutes Chapter 129.01 requires counties to budget 95% of anticipated revenues. The calculated reduction therefore amounts to 5%. This deduction is applied
against operating revenues in all funds except grant and internal service funds.
Source: 2008 Fiscal Year Library Operating Fund Budget, page 15 (page 18 in PDF
view)
(http://www.ocls.info/About/BOT/PDFs/FinancialInfo/BudgetsFinal/BudgetFY2008U
p2.pdf)
Orange County (Orlando, FL) General Fund Revenues
by Source,
FY 2008 Adopted Budget
Orange County (Orlando, FL) General Fund Expenditures
by Use,
FY 2008 Adopted Budget
Source: 2008 Fiscal Year Adopted Budget, Section 1 - Budget in Brief, page 35
(http://www.orangecountyfl.net/Portals/0/Resources/Internet/govern/Budget/docs/
2008Budget/Section01BudgetinBrief%202008.pdf)
*Note: Source indicates that $58,195,218 of its expenditures are funded by "other
revenue sources" which include revenues unearned in the current fiscal year, such as
fund balance or prior year reimbursements.
Source: 2008 Fiscal Year Adopted Budget, Section 1 - Budget in Brief, page 35
(http://www.orangecountyfl.net/Portals/0/Resources/Internet/govern/Budget/docs
/2008Budget/Section01BudgetinBrief%202008.pdf)
Orange County (Orlando, FL) Library Revenues
by Source,
FY 2008 Adopted Budget
Orange County (Orlando, FL) Library Expenditures
by Use,
FY 2008 Adopted Budget
Appendix F- Detailed Source Tables Page F-67

Ad Valorem Taxes 725,657,331$ General Government 207,552,736$
Other Taxes 293,640,832$ Public Safety 594,748,150$
Permits and Fees 23,492,932$ Physical Environment 372,582,580$
Intergovernmental Revenue 224,907,841$ Transportation 286,509,696$
Charges for Services 368,734,620$ Economic Environment 199,925,165$
Fines and Forfeitures 4,484,000$ Human Services 194,901,402$
Court Related Revenue 9,092,500$ Internal Services 229,288,606$
Interest & Profits on Investments 33,465,190$ Culture and Recreation* 52,266,068$
Miscellaneous Revenues 201,169,729$ Debt Service -$
Less: Statutory Deduction* (91,344,216)$ Other 145,223,367$
Bond/Loan Proceeds (Enterprise Funds) 8,000,000$ Reserves 794,668,010$
Interfund Transfers 393,396,831$ Interfund Transfers 393,396,831$
Other Non-Revenues -$ Total Expenditures 3,471,062,611$
Internal Service Charges 134,374,299$
Fund Balance 1,141,990,722$
Total Revenues 3,471,062,611$
Ad Valorem Taxes 436,637,478$ General Government 177,181,547$
Other Taxes 2,400,000$ Public Safety 363,564,906$
Permits and Fees 675,240$ Physical Environment 8,168,771$
Intergovernmental Revenue 1,387,000$ Transportation 40,261,235$
Charges for Services 55,737,783$ Economic Environment 8,380,209$
Fines and Forfeitures 754,000$ Human Services 79,868,366$
Court Related Revenue 13,000$ Internal Services 21,554,667$
Interest & Profits on Investments 7,182,000$ Culture and Recreation* 3,795,504$
Miscellaneous Revenues 5,879,550$ Debt Service -$
Less: Statutory Deduction* (25,533,303)$ Other -$
Bond/Loan Proceeds (Enterprise Funds) -$ Reserves 55,393,278$
Interfund Transfers 178,257,001$ Interfund Transfers 16,321,266$
Other Non-Revenues -$ Total Expenditures 774,489,749$
Internal Service Charges -$
Fund Balance 111,100,000$
Total Revenues 774,489,749$
Ad Valorem Taxes 36,007,392$ Salaries & Benefits 22,004,024$
Intergovernmental 1,245,000$ Operating 10,779,000$
Charges for Services 274,000$ Capital Outlay 2,050,000$
Fines 2,100,000$ Library Materials 5,022,000$
Miscellaneous 641,000$ Transfers to Other Funds 1,670,000$
Transfer from Property Appraiser 36,000$ Total Expenditures 41,525,024$
Transfer from Tax Collector 300,000$
Reserves 921,632$
Total Revenues 41,525,024$
Orange County (Orlando, FL) Total Revenues by Source,
FY 2009 Adopted Budget
Orange County (Orlando, FL) Total Expenditures by Use,
FY 2009 Adopted Budget
Source: 2009 Fiscal Year Adopted Budget, Section 1 - Budget in Brief, page 35
(http://orangecountyfl.net/Portals/0/Resources/Internet/govern/Budget/docs/2009
Budget/Section01BudgetinBrief2009.pdf)
Source: 2009 Fiscal Year Adopted Budget, Section 1 - Budget in Brief, page 35
(http://orangecountyfl.net/Portals/0/Resources/Internet/govern/Budget/docs/200
9Budget/Section01BudgetinBrief2009.pdf)
*Note: Source indicates that the library is part of this department (page 38), but
does not specify how much of the $52,266,068 is allocated to the library.
Orange County (Orlando, FL) General Fund Revenues
by Source,
FY 2009 Adopted Budget
Orange County (Orlando, FL) General Fund Expenditures by Use,
FY 2009 Adopted Budget
*Note: Florida Statutes Chapter 129.01 requires counties to budget 95% of anticipated revenues. The calculated reduction therefore amounts to 5%. This deduction is applied
against operating revenues in all funds except grant and internal service funds.
Source: 2009 Fiscal Year Library Operating Fund Budget, page 16 (page 19 in PDF
view)
(http://www.ocls.info/About/BOT/PDFs/FinancialInfo/BudgetsFinal/BudgetFY2009
Final.pdf)Source: 2009 Fiscal Year Library Operating Fund Budget, page 15 (page 18 in PDF
view)
(http://www.ocls.info/About/BOT/PDFs/FinancialInfo/BudgetsFinal/BudgetFY2009Fi
nal.pdf)
Source: 2009 Fiscal Year Adopted Budget, Section 1 - Budget in Brief, page 35
(http://orangecountyfl.net/Portals/0/Resources/Internet/govern/Budget/docs/2009
Budget/Section01BudgetinBrief2009.pdf)
Source: 2009 Fiscal Year Adopted Budget, Section 1 - Budget in Brief, page 35
(http://orangecountyfl.net/Portals/0/Resources/Internet/govern/Budget/docs/200
9Budget/Section01BudgetinBrief2009.pdf)
*Note: Source indicates that $48,214,165 of its expenditures are funded by "other
revenue sources" which include revenues unearned in the current fiscal year, such
as fund balance or prior year reimbursements.
Orange County (Orlando, FL) Library Revenues
by Source,
FY 2009 Adopted Budget
Orange County (Orlando, FL) Library Expenditures
by Use,
FY 2009 Adopted Budget
Appendix F- Detailed Source Tables Page F-68

Ad Valorem Taxes 646,378,934$ General Government 209,178,291$
Sales and Use Taxes 252,392,258$ Public Safety 557,838,650$
Franchise Taxes -$ Physical Environment 343,094,354$
Licenses and Permits 10,621,697$ Transportation 239,043,062$
Intergovernmental Revenue 200,322,262$ Economic Environment 168,346,393$
Charges for Services 352,091,882$ Human Services 133,134,618$
Fines and Forfeitures 3,356,568$ Internal Services 204,857,225$
Court Related Revenue 10,783,033$ Culture and Recreation* 41,375,430$
Interest & Profits on Investments 18,131,286$ Debt Service 127,876,368$
Miscellaneous Revenues 97,543,270$ Other -$
Less: Statutory Deduction* (76,229,456)$ Reserves 743,621,029$
Bond/Loan Proceeds (Enterprise Funds) 19,000,000$ Interfund Transfers 373,817,462$
Interfund Transfers 373,817,462$ Total Expenditures 3,142,182,882$
Other Non-Revenues -$
Internal Service Charges 125,252,958$
Fund Balance 1,108,720,828$
Total Revenues 3,142,182,982$
Ad Valorem Taxes 390,184,082$ General Government 184,249,103$
Sales and Use Taxes 2,200,000$ Public Safety 358,573,215$
Franchise Taxes -$ Physical Environment 7,708,369$
Licenses and Permits 676,150$ Transportation 35,319,427$
Intergovernmental Revenue 1,446,550$ Economic Environment 8,172,675$
Charges for Services 53,849,090$ Human Services 74,382,479$
Fines and Forfeitures 611,908$ Internal Services 3,093,696$
Court Related Revenue 20,533$ Culture and Recreation* 3,633,415$
Interest & Profits on Investments 4,317,165$ Debt Service -$
Miscellaneous Revenues 6,178,870$ Other -$
Less: Statutory Deduction* (22,974,217)$ Reserves 51,733,767$
Bond/Loan Proceeds (Enterprise Funds) -$ Internal Services 21,831,774$
Interfund Transfers 202,187,789$ Total Expenditures 748,697,920$
Other Non-Revenues -$
Internal Service Charges -$
Fund Balance 110,000,000$
Total Revenues 748,697,920$
Ad Valorem Taxes 32,049,516$ Salaries & Benefits 22,487,399$
Intergovernmental 1,025,000$ Operating 10,266,000$
Charges for Services 335,000$ Capital Outlay 695,000$
Fines 1,865,000$ Library Materials 4,764,000$
Miscellaneous 386,000$ Total Expenditures 38,212,399$
Transfer from Branch Debt Service Fund -$
Transfer from Property Appraiser 35,000$
Transfer from Tax Collector 350,000$
Reserves 2,166,883$
Total Revenues 38,212,399$
Orange County (Orlando, FL) Total Revenues by Source,
FY 2010 Adopted Budget
Orange County (Orlando, FL) Total Expenditures by Use,
FY 2010 Adopted Budget
Source: 2010 Fiscal Year Adopted Budget, Section 1 - Budget in Brief, page 35
(http://www.orangecountyfl.net/Portals/0/Resources/Internet/govern/Budget/doc
s/2010Budget/Section01BudgetinBrief.pdf)
Source: 2010 Fiscal Year Adopted Budget, Section 1 - Budget in Brief, page 35
(http://www.orangecountyfl.net/Portals/0/Resources/Internet/govern/Budget/doc
s/2010Budget/Section01BudgetinBrief.pdf)
*Note: Source indicates that the library is part of this department (page 38), but
does not specify how much of the $41,375,430 is allocated to the library.
Orange County (Orlando, FL) General Fund Revenues
by Source,
FY 2010 Adopted Budget
Orange County (Orlando, FL) General Fund Expenditures
by Use,
FY 2010 Adopted Budget
*Note: Florida Statutes Chapter 129.01 requires counties to budget 95% of anticipated revenues. The calculated reduction therefore amounts to 5%. This deduction is applied
against operating revenues in all funds except grant and internal service funds.
Source: 2010 Fiscal Year Library Operating Fund Budget, page 13 (page 17 in PDF
view)
(http://www.ocls.info/About/BOT/PDFs/FinancialInfo/BudgetsFinal/BudgetFY2010F
inal.pdf)
Source: 2010 Fiscal Year Library Operating Fund Budget, page 14 (page 18 in PDF
view)
(http://www.ocls.info/About/BOT/PDFs/FinancialInfo/BudgetsFinal/BudgetFY2010
Final.pdf)
Source: 2010 Fiscal Year Adopted Budget, Section 1 - Budget in Brief, page 35
(http://www.orangecountyfl.net/Portals/0/Resources/Internet/govern/Budget/doc
s/2010Budget/Section01BudgetinBrief.pdf)
Source: 2010 Fiscal Year Adopted Budget, Section 1 - Budget in Brief, page 35
(http://www.orangecountyfl.net/Portals/0/Resources/Internet/govern/Budget/doc
s/2010Budget/Section01BudgetinBrief.pdf)
*Note: Source indicates that $37,742,115 of its expenditures are funded by "other
revenue sources" which include revenues unearned in the current fiscal year, such
as fund balance or prior year reimbursements.
Orange County (Orlando, FL) Library Revenues
by Source,
FY 2010 Adopted Budget
Orange County (Orlando, FL) Library Expenditures
by Use,
FY 2010 Adopted Budget
Appendix F- Detailed Source Tables Page F-69
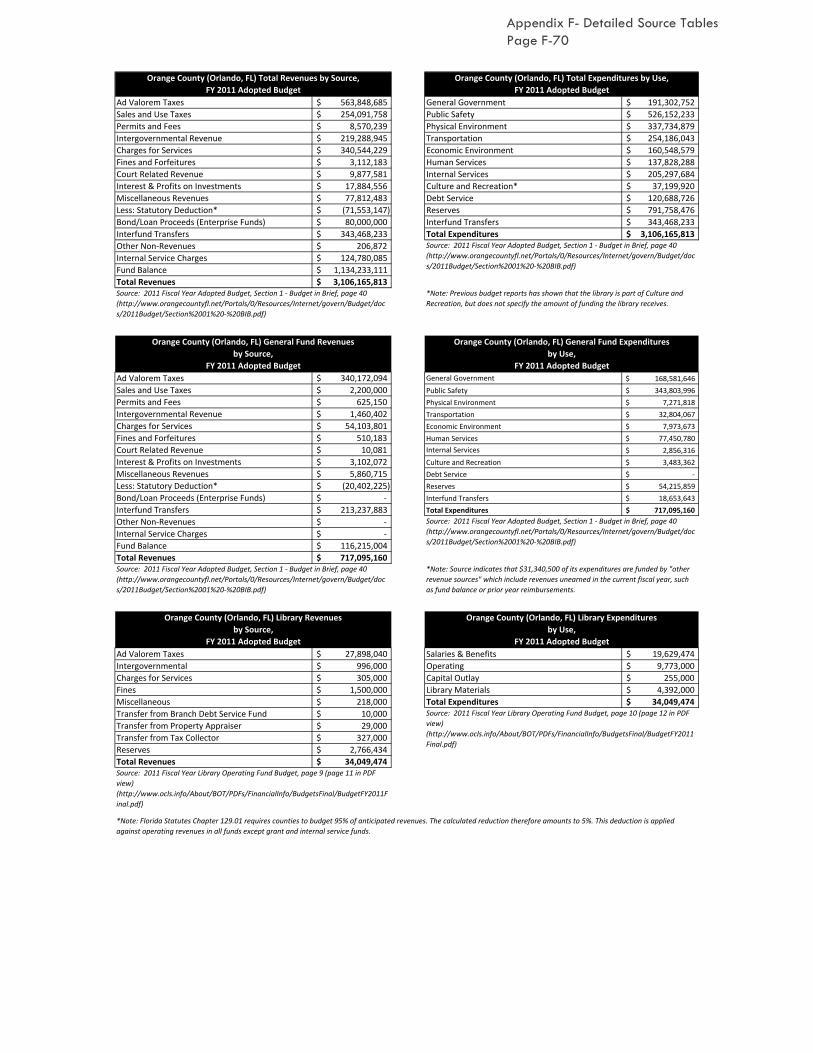
Ad Valorem Taxes 563,848,685$ General Government 191,302,752$
Sales and Use Taxes 254,091,758$ Public Safety 526,152,233$
Permits and Fees 8,570,239$ Physical Environment 337,734,879$
Intergovernmental Revenue 219,288,945$ Transportation 254,186,043$
Charges for Services 340,544,229$ Economic Environment 160,548,579$
Fines and Forfeitures 3,112,183$ Human Services 137,828,288$
Court Related Revenue 9,877,581$ Internal Services 205,297,684$
Interest & Profits on Investments 17,884,556$ Culture and Recreation* 37,199,920$
Miscellaneous Revenues 77,812,483$ Debt Service 120,688,726$
Less: Statutory Deduction* (71,553,147)$ Reserves 791,758,476$
Bond/Loan Proceeds (Enterprise Funds) 80,000,000$ Interfund Transfers 343,468,233$
Interfund Transfers 343,468,233$ Total Expenditures 3,106,165,813$
Other Non-Revenues 206,872$
Internal Service Charges 124,780,085$
Fund Balance 1,134,233,111$
Total Revenues 3,106,165,813$
Ad Valorem Taxes 340,172,094$ General Government 168,581,646$
Sales and Use Taxes 2,200,000$ Public Safety 343,803,996$
Permits and Fees 625,150$ Physical Environment 7,271,818$
Intergovernmental Revenue 1,460,402$ Transportation 32,804,067$
Charges for Services 54,103,801$ Economic Environment 7,973,673$
Fines and Forfeitures 510,183$ Human Services 77,450,780$
Court Related Revenue 10,081$ Internal Services 2,856,316$
Interest & Profits on Investments 3,102,072$ Culture and Recreation 3,483,362$
Miscellaneous Revenues 5,860,715$ Debt Service -$
Less: Statutory Deduction* (20,402,225)$ Reserves 54,215,859$
Bond/Loan Proceeds (Enterprise Funds) -$ Interfund Transfers 18,653,643$
Interfund Transfers 213,237,883$ Total Expenditures 717,095,160$
Other Non-Revenues -$
Internal Service Charges -$
Fund Balance 116,215,004$
Total Revenues 717,095,160$
Ad Valorem Taxes 27,898,040$ Salaries & Benefits 19,629,474$
Intergovernmental 996,000$ Operating 9,773,000$
Charges for Services 305,000$ Capital Outlay 255,000$
Fines 1,500,000$ Library Materials 4,392,000$
Miscellaneous 218,000$ Total Expenditures 34,049,474$
Transfer from Branch Debt Service Fund 10,000$
Transfer from Property Appraiser 29,000$
Transfer from Tax Collector 327,000$
Reserves 2,766,434$
Total Revenues 34,049,474$
Orange County (Orlando, FL) General Fund Revenues
by Source,
FY 2011 Adopted Budget
Orange County (Orlando, FL) General Fund Expenditures
by Use,
FY 2011 Adopted Budget
Source: 2011 Fiscal Year Adopted Budget, Section 1 - Budget in Brief, page 40
(http://www.orangecountyfl.net/Portals/0/Resources/Internet/govern/Budget/doc
s/2011Budget/Section%2001%20-%20BIB.pdf)
Orange County (Orlando, FL) Total Revenues by Source,
FY 2011 Adopted Budget
Orange County (Orlando, FL) Total Expenditures by Use,
FY 2011 Adopted Budget
Source: 2011 Fiscal Year Adopted Budget, Section 1 - Budget in Brief, page 40
(http://www.orangecountyfl.net/Portals/0/Resources/Internet/govern/Budget/doc
s/2011Budget/Section%2001%20-%20BIB.pdf)
Source: 2011 Fiscal Year Adopted Budget, Section 1 - Budget in Brief, page 40
(http://www.orangecountyfl.net/Portals/0/Resources/Internet/govern/Budget/doc
s/2011Budget/Section%2001%20-%20BIB.pdf)
*Note: Previous budget reports has shown that the library is part of Culture and
Recreation, but does not specify the amount of funding the library receives.
Source: 2011 Fiscal Year Library Operating Fund Budget, page 10 (page 12 in PDF
view)
(http://www.ocls.info/About/BOT/PDFs/FinancialInfo/BudgetsFinal/BudgetFY2011
Final.pdf)
Source: 2011 Fiscal Year Library Operating Fund Budget, page 9 (page 11 in PDF
view)
(http://www.ocls.info/About/BOT/PDFs/FinancialInfo/BudgetsFinal/BudgetFY2011F
inal.pdf)
*Note: Florida Statutes Chapter 129.01 requires counties to budget 95% of anticipated revenues. The calculated reduction therefore amounts to 5%. This deduction is applied
against operating revenues in all funds except grant and internal service funds.
Source: 2011 Fiscal Year Adopted Budget, Section 1 - Budget in Brief, page 40
(http://www.orangecountyfl.net/Portals/0/Resources/Internet/govern/Budget/doc
s/2011Budget/Section%2001%20-%20BIB.pdf)
*Note: Source indicates that $31,340,500 of its expenditures are funded by "other
revenue sources" which include revenues unearned in the current fiscal year, such
as fund balance or prior year reimbursements.
Orange County (Orlando, FL) Library Revenues
by Source,
FY 2011 Adopted Budget
Orange County (Orlando, FL) Library Expenditures
by Use,
FY 2011 Adopted Budget
Appendix F- Detailed Source Tables Page F-70
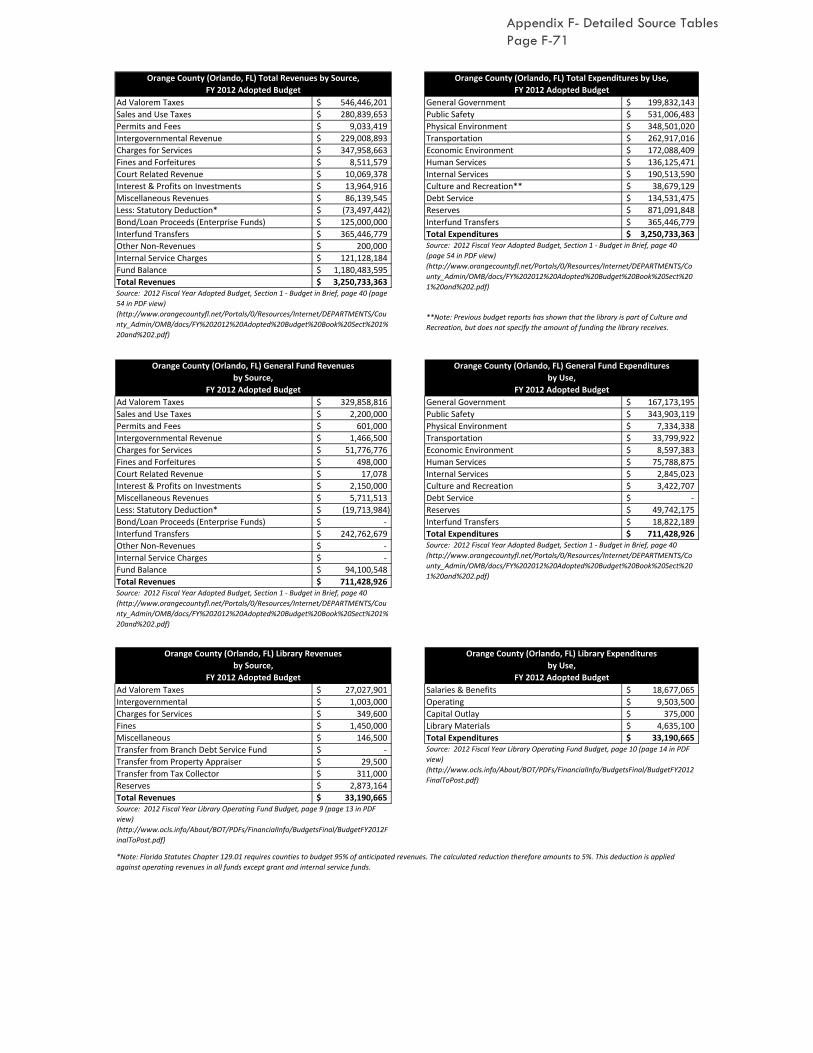
Ad Valorem Taxes 546,446,201$ General Government 199,832,143$
Sales and Use Taxes 280,839,653$ Public Safety 531,006,483$
Permits and Fees 9,033,419$ Physical Environment 348,501,020$
Intergovernmental Revenue 229,008,893$ Transportation 262,917,016$
Charges for Services 347,958,663$ Economic Environment 172,088,409$
Fines and Forfeitures 8,511,579$ Human Services 136,125,471$
Court Related Revenue 10,069,378$ Internal Services 190,513,590$
Interest & Profits on Investments 13,964,916$ Culture and Recreation** 38,679,129$
Miscellaneous Revenues 86,139,545$ Debt Service 134,531,475$
Less: Statutory Deduction* (73,497,442)$ Reserves 871,091,848$
Bond/Loan Proceeds (Enterprise Funds) 125,000,000$ Interfund Transfers 365,446,779$
Interfund Transfers 365,446,779$ Total Expenditures 3,250,733,363$
Other Non‐Revenues 200,000$
Internal Service Charges 121,128,184$
Fund Balance 1,180,483,595$
Total Revenues 3,250,733,363$
Ad Valorem Taxes 329,858,816$ General Government 167,173,195$
Sales and Use Taxes 2,200,000$ Public Safety 343,903,119$
Permits and Fees 601,000$ Physical Environment 7,334,338$
Intergovernmental Revenue 1,466,500$ Transportation 33,799,922$
Charges for Services 51,776,776$ Economic Environment 8,597,383$
Fines and Forfeitures 498,000$ Human Services 75,788,875$
Court Related Revenue 17,078$ Internal Services 2,845,023$
Interest & Profits on Investments 2,150,000$ Culture and Recreation 3,422,707$
Miscellaneous Revenues 5,711,513$ Debt Service ‐$
Less: Statutory Deduction* (19,713,984)$ Reserves 49,742,175$
Bond/Loan Proceeds (Enterprise Funds) ‐$ Interfund Transfers 18,822,189$
Interfund Transfers 242,762,679$ Total Expenditures 711,428,926$
Other Non‐Revenues ‐$
Internal Service Charges ‐$
Fund Balance 94,100,548$
Total Revenues 711,428,926$
Ad Valorem Taxes 27,027,901$ Salaries & Benefits 18,677,065$
Intergovernmental 1,003,000$ Operating 9,503,500$
Charges for Services 349,600$ Capital Outlay 375,000$
Fines 1,450,000$ Library Materials 4,635,100$
Miscellaneous 146,500$ Total Expenditures 33,190,665$
Transfer from Branch Debt Service Fund ‐$
Transfer from Property Appraiser 29,500$
Transfer from Tax Collector 311,000$
Reserves 2,873,164$
Total Revenues 33,190,665$ Source: 2012 Fiscal Year Library Operating Fund Budget, page 9 (page 13 in PDF
view)
(http://www.ocls.info/About/BOT/PDFs/FinancialInfo/BudgetsFinal/BudgetFY2012F
inalToPost.pdf)
*Note: Florida Statutes Chapter 129.01 requires counties to budget 95% of anticipated revenues. The calculated reduction therefore amounts to 5%. This deduction is applied
against operating revenues in all funds except grant and internal service funds.
Source: 2012 Fiscal Year Adopted Budget, Section 1 ‐ Budget in Brief, page 40
(http://www.orangecountyfl.net/Portals/0/Resources/Internet/DEPARTMENTS/Cou
nty_Admin/OMB/docs/FY%202012%20Adopted%20Budget%20Book%20Sect%201%
20and%202.pdf)
Orange County (Orlando, FL) Library Revenues
by Source,
FY 2012 Adopted Budget
Orange County (Orlando, FL) Library Expenditures
by Use,
FY 2012 Adopted Budget
Source: 2012 Fiscal Year Library Operating Fund Budget, page 10 (page 14 in PDF
view)
(http://www.ocls.info/About/BOT/PDFs/FinancialInfo/BudgetsFinal/BudgetFY2012
FinalToPost.pdf)
Source: 2012 Fiscal Year Adopted Budget, Section 1 ‐ Budget in Brief, page 40
(http://www.orangecountyfl.net/Portals/0/Resources/Internet/DEPARTMENTS/Co
unty_Admin/OMB/docs/FY%202012%20Adopted%20Budget%20Book%20Sect%20
1%20and%202.pdf)
Orange County (Orlando, FL) General Fund Revenues
by Source,
FY 2012 Adopted Budget
Orange County (Orlando, FL) General Fund Expenditures
by Use,
FY 2012 Adopted Budget
Orange County (Orlando, FL) Total Revenues by Source,
FY 2012 Adopted Budget
Orange County (Orlando, FL) Total Expenditures by Use,
FY 2012 Adopted Budget
Source: 2012 Fiscal Year Adopted Budget, Section 1 ‐ Budget in Brief, page 40 (page
54 in PDF view)
(http://www.orangecountyfl.net/Portals/0/Resources/Internet/DEPARTMENTS/Cou
nty_Admin/OMB/docs/FY%202012%20Adopted%20Budget%20Book%20Sect%201%
20and%202.pdf)
Source: 2012 Fiscal Year Adopted Budget, Section 1 ‐ Budget in Brief, page 40
(page 54 in PDF view)
(http://www.orangecountyfl.net/Portals/0/Resources/Internet/DEPARTMENTS/Co
unty_Admin/OMB/docs/FY%202012%20Adopted%20Budget%20Book%20Sect%20
1%20and%202.pdf)
**Note: Previous budget reports has shown that the library is part of Culture and
Recreation, but does not specify the amount of funding the library receives.
Appendix F- Detailed Source Tables Page F-71
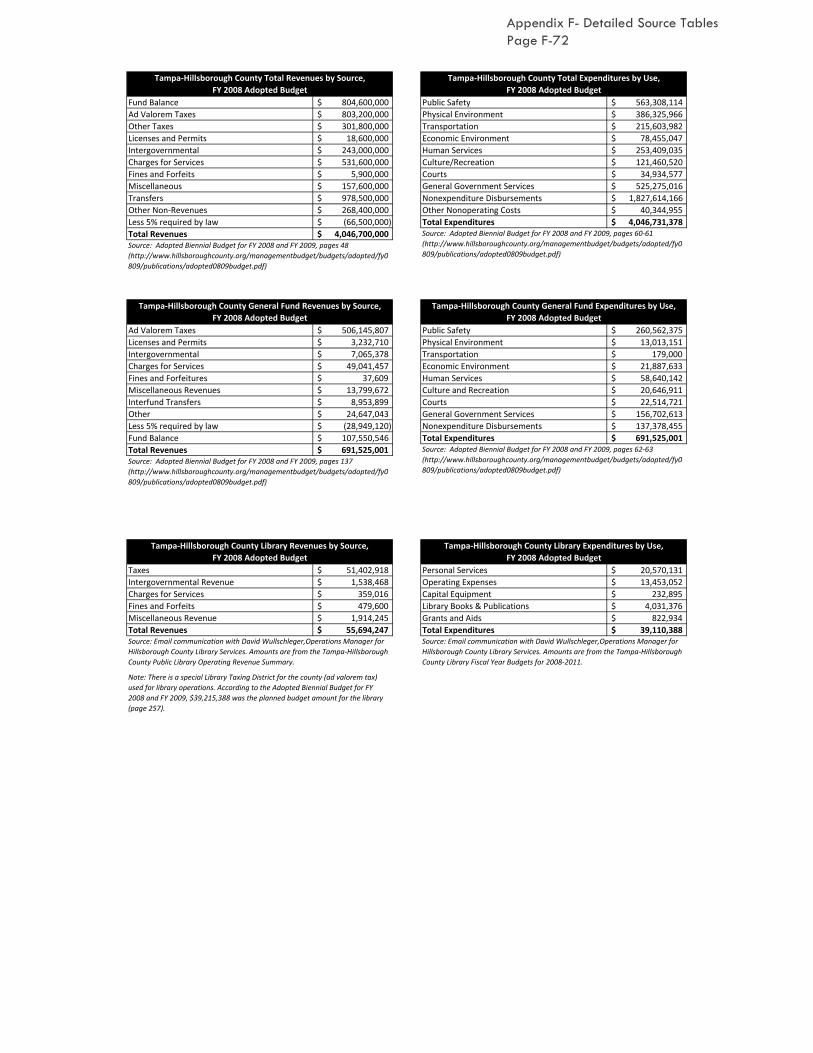
Fund Balance 804,600,000$ Public Safety 563,308,114$
Ad Valorem Taxes 803,200,000$ Physical Environment 386,325,966$
Other Taxes 301,800,000$ Transportation 215,603,982$
Licenses and Permits 18,600,000$ Economic Environment 78,455,047$
Intergovernmental 243,000,000$ Human Services 253,409,035$
Charges for Services 531,600,000$ Culture/Recreation 121,460,520$
Fines and Forfeits 5,900,000$ Courts 34,934,577$
Miscellaneous 157,600,000$ General Government Services 525,275,016$
Transfers 978,500,000$ Nonexpenditure Disbursements 1,827,614,166$
Other Non-Revenues 268,400,000$ Other Nonoperating Costs 40,344,955$
Less 5% required by law (66,500,000)$ Total Expenditures 4,046,731,378$
Total Revenues 4,046,700,000$
Ad Valorem Taxes 506,145,807$ Public Safety 260,562,375$
Licenses and Permits 3,232,710$ Physical Environment 13,013,151$
Intergovernmental 7,065,378$ Transportation 179,000$
Charges for Services 49,041,457$ Economic Environment 21,887,633$
Fines and Forfeitures 37,609$ Human Services 58,640,142$
Miscellaneous Revenues 13,799,672$ Culture and Recreation 20,646,911$
Interfund Transfers 8,953,899$ Courts 22,514,721$
Other 24,647,043$ General Government Services 156,702,613$
Less 5% required by law (28,949,120)$ Nonexpenditure Disbursements 137,378,455$
Fund Balance 107,550,546$ Total Expenditures 691,525,001$
Total Revenues 691,525,001$
Taxes 51,402,918$ Personal Services 20,570,131$
Intergovernmental Revenue 1,538,468$ Operating Expenses 13,453,052$
Charges for Services 359,016$ Capital Equipment 232,895$
Fines and Forfeits 479,600$ Library Books & Publications 4,031,376$
Miscellaneous Revenue 1,914,245$ Grants and Aids 822,934$
Total Revenues 55,694,247$ Total Expenditures 39,110,388$
Source: Adopted Biennial Budget for FY 2008 and FY 2009, pages 137
(http://www.hillsboroughcounty.org/managementbudget/budgets/adopted/fy0
809/publications/adopted0809budget.pdf)
Note: There is a special Library Taxing District for the county (ad valorem tax)
used for library operations. According to the Adopted Biennial Budget for FY
2008 and FY 2009, $39,215,388 was the planned budget amount for the library
(page 257).
Tampa-Hillsborough County Library Revenues by Source,
FY 2008 Adopted Budget
Tampa-Hillsborough County Library Expenditures by Use,
FY 2008 Adopted Budget
Source: Adopted Biennial Budget for FY 2008 and FY 2009, pages 62-63
(http://www.hillsboroughcounty.org/managementbudget/budgets/adopted/fy0
809/publications/adopted0809budget.pdf)
Source: Email communication with David Wullschleger,Operations Manager for
Hillsborough County Library Services. Amounts are from the Tampa-Hillsborough
County Public Library Operating Revenue Summary.
Source: Email communication with David Wullschleger,Operations Manager for
Hillsborough County Library Services. Amounts are from the Tampa-Hillsborough
County Library Fiscal Year Budgets for 2008-2011.
Tampa-Hillsborough County Total Revenues by Source,
FY 2008 Adopted Budget
Tampa-Hillsborough County Total Expenditures by Use,
FY 2008 Adopted Budget
Tampa-Hillsborough County General Fund Expenditures by Use,
FY 2008 Adopted Budget
Source: Adopted Biennial Budget for FY 2008 and FY 2009, pages 60-61
(http://www.hillsboroughcounty.org/managementbudget/budgets/adopted/fy0
809/publications/adopted0809budget.pdf)
Tampa-Hillsborough County General Fund Revenues by Source,
FY 2008 Adopted Budget
Source: Adopted Biennial Budget for FY 2008 and FY 2009, pages 48
(http://www.hillsboroughcounty.org/managementbudget/budgets/adopted/fy0
809/publications/adopted0809budget.pdf)
Appendix F- Detailed Source Tables Page F-72

Fund Balance 908,300,000$ Public Safety 542,816,104$
Ad Valorem Taxes 756,500,000$ Physical Environment 390,715,311$
Other Taxes 284,200,000$ Transportation 212,221,701$
Licenses and Permits 13,900,000$ Economic Environment 94,776,731$
Intergovernmental 235,800,000$ Human Services 245,886,765$
Charges for Services 554,200,000$ Culture/Recreation 124,380,167$
Fines and Forfeits 5,400,000$ Courts 44,963,959$
Miscellaneous 143,200,000$ General Government Services 504,937,844$
Transfers 1,059,200,000$ Nonexpenditure Disbursements 1,831,846,926$
Other Non-Revenues 142,800,000$ Other Nonoperating Costs 39,413,156$
Less 5% required by law (71,300,000)$ Total Expenditures 4,031,958,664$
Total Revenues 4,032,200,000$
Ad Valorem Taxes 482,031,070$ Public Safety 272,781,636$
Local Business Tax 1,284,366$ Physical Environment 15,593,680$
Permits and Fees 2,407,184$ Transportation 176,000$
Intergovernmental 5,714,033$ Economic Environment 21,608,217$
Charges for Services 58,361,304$ Human Services 58,089,611$
Fines and Forfeitures 43,059$ Culture and Recreation 20,438,491$
Miscellaneous Revenues 13,885,644$ Courts 12,548,582$
Interfund Transfers 15,038,139$ General Government Services 138,944,914$
Other 32,053,941$ Nonexpenditure Disbursements 164,374,713$
Less 5% required by law (29,562,131)$ Total Expenditures 704,555,844$
Fund Balance 123,299,235$
Total Revenues 704,555,844$
Taxes 44,950,905$ Personal Services 21,208,876$
Intergovernmental Revenue 1,446,048$ Operating Expenses 13,369,720$
Charges for Services 240,513$ Capital Equipment 401,833$
Fines and Forfeits 516,600$ Library Books & Publications 4,476,759$
Miscellaneous Revenue 2,139,245$ Grants and Aids 640,134$
Total Revenues 49,293,311$ Total Expenditures 40,097,322$
Source: Adopted Biennial Budget for FY 2010 and FY 2011, page 159
(http://www.hillsboroughcounty.org/managementbudget/budgets/adopted/fy1
011/publications/adoptedfy10fy11budget.pdf)
Source: Adopted Biennial Budget for FY 2010 and FY 2011, pages 72-73
(http://www.hillsboroughcounty.org/managementbudget/budgets/adopted/fy1
011/publications/adoptedfy10fy11budget.pdf)
Note: There is a special Library Taxing District for the county (ad valorem tax)
used for library operations. According to the Adopted Biennial Budget for FY
2010 and FY 2011, $40,097,322 was the planned budget amount for the library.
(page 277)
Tampa-Hillsborough County Library Revenues by Source,
FY 2009 Adopted Budget
Tampa-Hillsborough County Library Expenditures by Use,
FY 2009 Adopted Budget
Source: Email communication with David Wullschleger, Operations Manager for
Hillsborough County Library Services. Amounts are from the Tampa-Hillsborough
County Public Library Operating Revenue Summary.
Source: Email communication with David Wullschleger, Operations Manager for
Hillsborough County Library Services. Amounts are from the Tampa-Hillsborough
County Library Fiscal Year Budgets for 2008-2011.
Tampa-Hillsborough County Total Revenues by Source,
FY 2009 Adopted Budget
Tampa-Hillsborough County Total Expenditures by Use,
FY 2009 Adopted Budgeted
Tampa-Hillsborough County General Fund Expenditures by Use,
FY 2009 Adopted Budget
Tampa-Hillsborough County General Fund Revenues by Source,
FY 2009 Adopted Budget
Source: Adopted Biennial Budget for FY 2010 and FY 2011, page 62
(http://www.hillsboroughcounty.org/managementbudget/budgets/adopted/fy1
011/publications/adoptedfy10fy11budget.pdf)
Source: Adopted Biennial Budget for FY 2010 and FY 2011, pages 70-71
(http://www.hillsboroughcounty.org/managementbudget/budgets/adopted/fy1
011/publications/adoptedfy10fy11budget.pdf)
Appendix F- Detailed Source Tables Page F-73
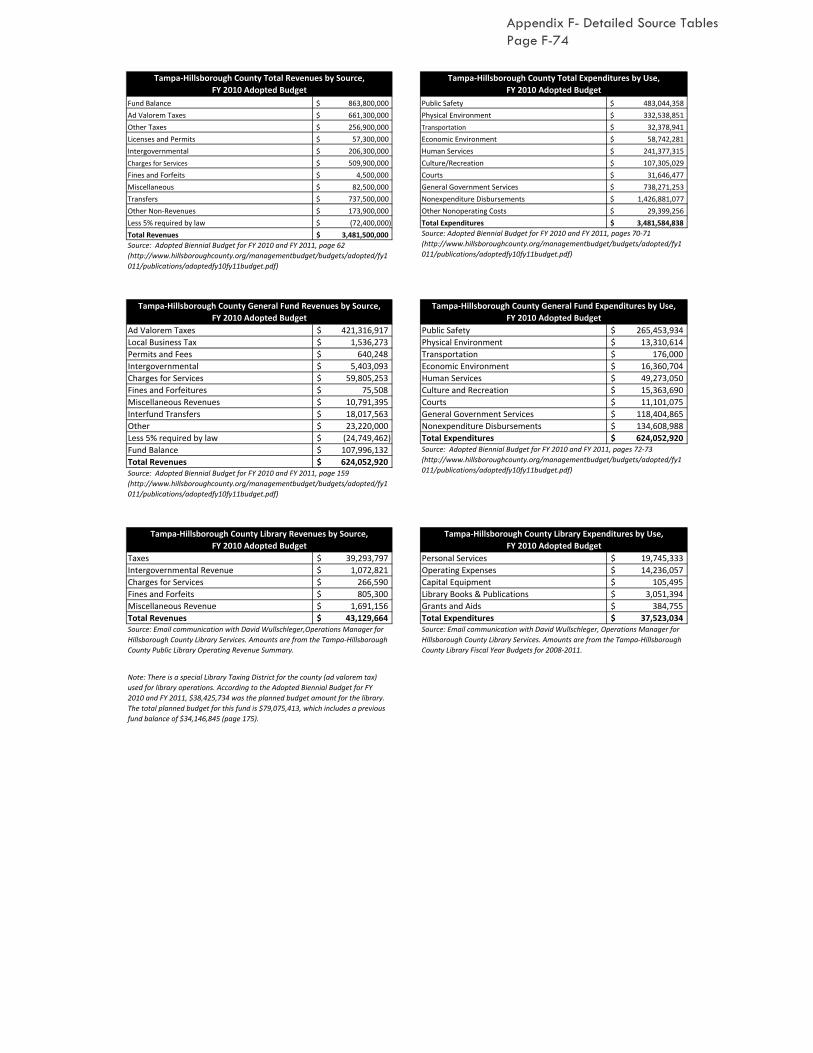
Fund Balance 863,800,000$ Public Safety 483,044,358$
Ad Valorem Taxes 661,300,000$ Physical Environment 332,538,851$
Other Taxes 256,900,000$ Transportation 32,378,941$
Licenses and Permits 57,300,000$ Economic Environment 58,742,281$
Intergovernmental 206,300,000$ Human Services 241,377,315$
Charges for Services 509,900,000$ Culture/Recreation 107,305,029$
Fines and Forfeits 4,500,000$ Courts 31,646,477$
Miscellaneous 82,500,000$ General Government Services 738,271,253$
Transfers 737,500,000$ Nonexpenditure Disbursements 1,426,881,077$
Other Non-Revenues 173,900,000$ Other Nonoperating Costs 29,399,256$
Less 5% required by law (72,400,000)$ Total Expenditures 3,481,584,838$
Total Revenues 3,481,500,000$
Ad Valorem Taxes 421,316,917$ Public Safety 265,453,934$
Local Business Tax 1,536,273$ Physical Environment 13,310,614$
Permits and Fees 640,248$ Transportation 176,000$
Intergovernmental 5,403,093$ Economic Environment 16,360,704$
Charges for Services 59,805,253$ Human Services 49,273,050$
Fines and Forfeitures 75,508$ Culture and Recreation 15,363,690$
Miscellaneous Revenues 10,791,395$ Courts 11,101,075$
Interfund Transfers 18,017,563$ General Government Services 118,404,865$
Other 23,220,000$ Nonexpenditure Disbursements 134,608,988$
Less 5% required by law (24,749,462)$ Total Expenditures 624,052,920$
Fund Balance 107,996,132$
Total Revenues 624,052,920$
Taxes 39,293,797$ Personal Services 19,745,333$
Intergovernmental Revenue 1,072,821$ Operating Expenses 14,236,057$
Charges for Services 266,590$ Capital Equipment 105,495$
Fines and Forfeits 805,300$ Library Books & Publications 3,051,394$
Miscellaneous Revenue 1,691,156$ Grants and Aids 384,755$
Total Revenues 43,129,664$ Total Expenditures 37,523,034$
Source: Adopted Biennial Budget for FY 2010 and FY 2011, pages 70-71
(http://www.hillsboroughcounty.org/managementbudget/budgets/adopted/fy1
011/publications/adoptedfy10fy11budget.pdf)
Note: There is a special Library Taxing District for the county (ad valorem tax)
used for library operations. According to the Adopted Biennial Budget for FY
2010 and FY 2011, $38,425,734 was the planned budget amount for the library.
The total planned budget for this fund is $79,075,413, which includes a previous
fund balance of $34,146,845 (page 175).
Source: Email communication with David Wullschleger, Operations Manager for
Hillsborough County Library Services. Amounts are from the Tampa-Hillsborough
County Library Fiscal Year Budgets for 2008-2011.
Tampa-Hillsborough County Total Revenues by Source,
FY 2010 Adopted Budget
Tampa-Hillsborough County Total Expenditures by Use,
FY 2010 Adopted Budget
Tampa-Hillsborough County General Fund Expenditures by Use,
FY 2010 Adopted Budget
Tampa-Hillsborough County General Fund Revenues by Source,
FY 2010 Adopted Budget
Tampa-Hillsborough County Library Revenues by Source,
FY 2010 Adopted Budget
Tampa-Hillsborough County Library Expenditures by Use,
FY 2010 Adopted Budget
Source: Adopted Biennial Budget for FY 2010 and FY 2011, page 159
(http://www.hillsboroughcounty.org/managementbudget/budgets/adopted/fy1
011/publications/adoptedfy10fy11budget.pdf)
Source: Adopted Biennial Budget for FY 2010 and FY 2011, pages 72-73
(http://www.hillsboroughcounty.org/managementbudget/budgets/adopted/fy1
011/publications/adoptedfy10fy11budget.pdf)
Source: Email communication with David Wullschleger,Operations Manager for
Hillsborough County Library Services. Amounts are from the Tampa-Hillsborough
County Public Library Operating Revenue Summary.
Source: Adopted Biennial Budget for FY 2010 and FY 2011, page 62
(http://www.hillsboroughcounty.org/managementbudget/budgets/adopted/fy1
011/publications/adoptedfy10fy11budget.pdf)
Appendix F- Detailed Source Tables Page F-74

Fund Balance 776,300,000$ Public Safety 532,693,720$
Ad Valorem Taxes 603,900,000$ Physical Environment 361,080,975$
Other Taxes 268,100,000$ Transportation 80,601,997$
Licenses and Permits 58,000,000$ Economic Environment 52,346,530$
Intergovernmental 215,800,000$ Human Services 244,439,723$
Charges for Services 560,100,000$ Culture/Recreation 105,485,883$
Fines and Forfeits 4,500,000$ Courts 30,022,244$
Miscellaneous 55,200,000$ General Government Services 824,667,407$
Transfers 798,900,000$ Nonexpenditure Disbursements 1,520,596,528$
Other Non-Revenues 510,100,000$ Other Nonoperating Costs 28,074,830$
Less 5% required by law (71,000,000)$ Total Expenditures 3,780,009,837$
Total Revenues 3,779,900,000$
Ad Valorem Taxes 385,656,553$ Public Safety 273,042,275$
Local Business Tax 1,596,273$ Physical Environment 12,169,338$
Permits and Fees 631,633$ Transportation 176,000$
Intergovernmental 5,718,105$ Economic Environment 14,630,847$
Charges for Services 61,213,747$ Human Services 41,826,193$
Fines and Forfeitures 58,012$ Culture and Recreation 14,229,316$
Miscellaneous Revenues 9,770,171$ Courts 11,024,592$
Interfund Transfers 33,702,941$ General Government Services 116,805,135$
Other 22,070,000$ Nonexpenditure Disbursements 123,664,076$
Less 5% required by law* (22,935,372)$ Total Expenditures 607,567,772$
Fund Balance 110,085,709$
Total Revenues 607,567,772$
Taxes 34,893,356$ Personal Services 19,799,040$
Intergovernmental Revenue 910,388$ Operating Expenses 13,735,987$
Charges for Services 278,740$ Capital Equipment 107,595$
Fines and Forfeits 523,550$ Library Books & Publications 2,893,773$
Miscellaneous Revenue 1,282,322$ Grants and Aids 384,755$
Total Revenues 37,888,356$ Total Expenditures 36,921,150$
Note: There is a special Library Taxing District for the county (ad valorem tax)
used for library operations. According to the Adopted Biennial Budget for FY
2010 and FY 2011, $39,442,452 was the planned budget amount for the library.
The total planned budget for this fund is $79,075,413, which includes a previous
fund balance of $34,146,845 (page 175).
Tampa-Hillsborough County Total Revenues by Source,
FY 2011 Planned Budget
Tampa-Hillsborough County Total Expenditures by Use,
FY 2011 Planned Budget
Tampa-Hillsborough County General Fund Revenues by Source,
FY 2011 Planned Budget
Tampa - Hillsborough County General Fund Expenditures by Use,
FY 2011 Planned Budget
Source: Adopted Biennial Budget for FY 2010 and FY 2011, page 62
(http://www.hillsboroughcounty.org/managementbudget/budgets/adopted/fy1
011/publications/adoptedfy10fy11budget.pdf)
Source: Adopted Biennial Budget for FY 2010 and FY 2011, pages 70-71
(http://www.hillsboroughcounty.org/managementbudget/budgets/adopted/fy1
011/publications/adoptedfy10fy11budget.pdf)
*Note: Florida Statutes Chapter 129.01 requires counties to budget 95% of
anticipated revenues. The calculated reduction therefore amounts to 5%. This
deduction is applied against operating revenues in all funds except grant and
internal service funds.
Source: Adopted Biennial Budget for FY 2010 and FY 2011, page 159
(http://www.hillsboroughcounty.org/managementbudget/budgets/adopted/fy1
011/publications/adoptedfy10fy11budget.pdf)
Source: Adopted Biennial Budget for FY 2010 and FY 2011, pages 72-73
(http://www.hillsboroughcounty.org/managementbudget/budgets/adopted/fy1
011/publications/adoptedfy10fy11budget.pdf)
Tampa-Hillsborough County Library Revenues by Source,
FY 2011 Adopted Budget
Tampa-Hillsborough County Library Expenditures by Use,
FY 2011 Adopted Budget
Source: Email communication with David Wullschleger, Operations Manager for
Hillsborough County Library Services. Amounts are from the Tampa-Hillsborough
County Public Library Operating Revenue Summary.
Source: Email communication with David Wullschleger, Operations Manager for
Hillsborough County Library Services. Amounts are from the Tampa-Hillsborough
County Library Fiscal Year Budgets for 2008-2011.
Appendix F- Detailed Source Tables Page F-75
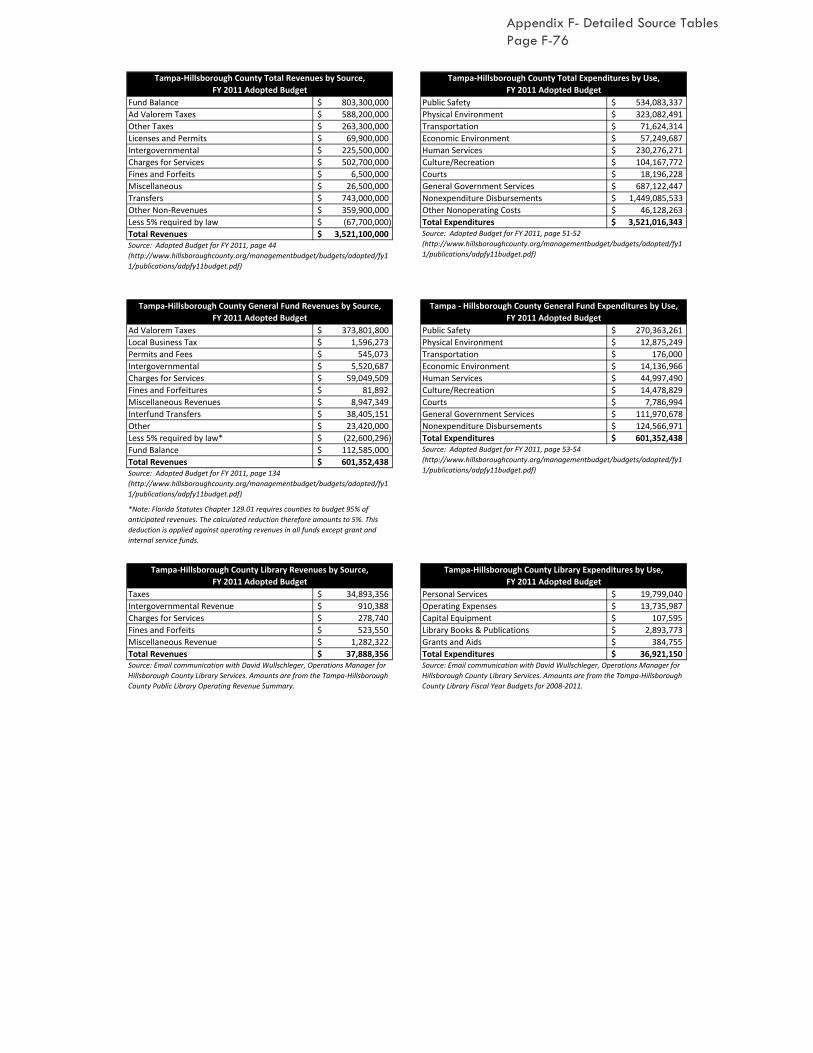
Fund Balance 803,300,000$ Public Safety 534,083,337$
Ad Valorem Taxes 588,200,000$ Physical Environment 323,082,491$
Other Taxes 263,300,000$ Transportation 71,624,314$
Licenses and Permits 69,900,000$ Economic Environment 57,249,687$
Intergovernmental 225,500,000$ Human Services 230,276,271$
Charges for Services 502,700,000$ Culture/Recreation 104,167,772$
Fines and Forfeits 6,500,000$ Courts 18,196,228$
Miscellaneous 26,500,000$ General Government Services 687,122,447$
Transfers 743,000,000$ Nonexpenditure Disbursements 1,449,085,533$
Other Non‐Revenues 359,900,000$ Other Nonoperating Costs 46,128,263$
Less 5% required by law (67,700,000)$ Total Expenditures 3,521,016,343$
Total Revenues 3,521,100,000$
Ad Valorem Taxes 373,801,800$ Public Safety 270,363,261$
Local Business Tax 1,596,273$ Physical Environment 12,875,249$
Permits and Fees 545,073$ Transportation 176,000$
Intergovernmental 5,520,687$ Economic Environment 14,136,966$
Charges for Services 59,049,509$ Human Services 44,997,490$
Fines and Forfeitures 81,892$ Culture/Recreation 14,478,829$
Miscellaneous Revenues 8,947,349$ Courts 7,786,994$
Interfund Transfers 38,405,151$ General Government Services 111,970,678$
Other 23,420,000$ Nonexpenditure Disbursements 124,566,971$
Less 5% required by law* (22,600,296)$ Total Expenditures 601,352,438$
Fund Balance 112,585,000$
Total Revenues 601,352,438$
Taxes 34,893,356$ Personal Services 19,799,040$
Intergovernmental Revenue 910,388$ Operating Expenses 13,735,987$
Charges for Services 278,740$ Capital Equipment 107,595$
Fines and Forfeits 523,550$ Library Books & Publications 2,893,773$
Miscellaneous Revenue 1,282,322$ Grants and Aids 384,755$
Total Revenues 37,888,356$ Total Expenditures 36,921,150$
Source: Adopted Budget for FY 2011, page 53‐54
(http://www.hillsboroughcounty.org/managementbudget/budgets/adopted/fy1
1/publications/adpfy11budget.pdf)Source: Adopted Budget for FY 2011, page 134
(http://www.hillsboroughcounty.org/managementbudget/budgets/adopted/fy1
1/publications/adpfy11budget.pdf)
*Note: Florida Statutes Chapter 129.01 requires counties to budget 95% of
anticipated revenues. The calculated reduction therefore amounts to 5%. This
deduction is applied against operating revenues in all funds except grant and
internal service funds.
Tampa‐Hillsborough County Library Revenues by Source,
FY 2011 Adopted Budget
Tampa‐Hillsborough County Library Expenditures by Use,
FY 2011 Adopted Budget
Source: Email communication with David Wullschleger, Operations Manager for
Hillsborough County Library Services. Amounts are from the Tampa‐Hillsborough
County Public Library Operating Revenue Summary.
Source: Email communication with David Wullschleger, Operations Manager for
Hillsborough County Library Services. Amounts are from the Tampa‐Hillsborough
County Library Fiscal Year Budgets for 2008‐2011.
Tampa‐Hillsborough County Total Revenues by Source,
FY 2011 Adopted Budget
Tampa‐Hillsborough County Total Expenditures by Use,
FY 2011 Adopted Budget
Source: Adopted Budget for FY 2011, page 51‐52
(http://www.hillsboroughcounty.org/managementbudget/budgets/adopted/fy1
1/publications/adpfy11budget.pdf)Source: Adopted Budget for FY 2011, page 44
(http://www.hillsboroughcounty.org/managementbudget/budgets/adopted/fy1
1/publications/adpfy11budget.pdf)
Tampa‐Hillsborough County General Fund Revenues by Source,
FY 2011 Adopted Budget
Tampa ‐ Hillsborough County General Fund Expenditures by Use,
FY 2011 Adopted Budget
Appendix F- Detailed Source Tables Page F-76

Fund Balance 868,600,000$ Public Safety 547,303,096$
Ad Valorem Taxes 564,100,000$ Physical Environment 300,636,622$
Other Taxes 273,000,000$ Transportation 1,620,704$
Licenses and Permits 51,600,000$ Economic Environment 37,938,063$
Intergovernmental 212,700,000$ Human Services 220,492,511$
Charges for Services 513,200,000$ Culture/Recreation 60,953,063$
Fines and Forfeits 5,600,000$ Courts 21,018,318$
Miscellaneous 43,700,000$ General Government Services 407,036,967$
Transfers 551,100,000$ Nonexpenditure Disbursements 1,294,464,538$
Other Non‐Revenues (101,400,000)$ Other Nonoperating Costs 17,806,213$
Less 5% required by law (73,000,000)$ Total Expenditures 2,909,270,095$
Total Revenues 2,909,200,000$
Ad Valorem Taxes 358,203,108$ Public Safety 266,659,127$
Local Business Tax 1,535,000$ Physical Environment 11,891,765$
Permits and Fees 682,500$ Transportation 186,000$
Intergovernmental 7,770,976$ Economic Environment 15,419,172$
Charges for Services 63,111,353$ Human Services 38,662,453$
Fines and Forfeitures 37,047$ Culture/Recreation 11,049,320$
Miscellaneous Revenues 7,410,263$ Courts 7,536,073$
Interfund Transfers 27,593,068$ General Government Services 118,192,909$
Other 24,734,255$ Nonexpenditure Disbursements 125,877,113$
Less 5% required by law* (21,662,437)$ Total Expenditures 595,473,932$
Fund Balance 126,058,799$
Total Revenues 595,473,932$
Taxes 33,463,287$ Personal Services 16,937,804$
Intergovernmental Revenue 1,022,250$ Operating Expenses 11,984,223$
Charges for Services 283,950$ Capital Equipment 232,285$
Fines and Forfeits 476,600$ Library Books & Publications 3,241,947$
Miscellaneous Revenue 308,934$ Grants and Aids ‐$
Total Revenues 35,555,021$ Total Expenditures 32,396,259$
Tampa‐Hillsborough County Total Revenues by Source,
FY 2012 Adopted Budget
Tampa‐Hillsborough County Total Expenditures by Use,
FY 2012 Adopted Budget
Source: Adopted Biennial Budget for FY 2012 and FY 2013, page 62‐63
(http://www.hillsboroughcounty.org/managementbudget/budgets/adopted/fy1
2/publications/adpfy12fy13budget.pdf)Source: Adopted Biennial Budget for FY 2012 and FY 2013, page 54
(http://www.hillsboroughcounty.org/managementbudget/budgets/adopted/fy1
2/publications/adpfy12fy13budget.pdf)
Tampa‐Hillsborough County General Fund Revenues by Source,
FY 2012 Adopted Budget
Tampa‐Hillsborough County General Fund Expenditures by Use,
FY 2012 Adopted Budget
Source: Adopted Biennial Budget for FY 2012 and FY 2013, page 64‐65
(http://www.hillsboroughcounty.org/managementbudget/budgets/adopted/fy1
2/publications/adpfy12fy13budget.pdf)Source: Adopted Biennial Budget for FY 2012 and FY 2013, page 150
(http://www.hillsboroughcounty.org/managementbudget/budgets/adopted/fy1
2/publications/adpfy12fy13budget.pdf)
*Note: Florida Statutes Chapter 129.01 requires counties to budget 95% of
anticipated revenues. The calculated reduction therefore amounts to 5%. This
deduction is applied against operating revenues in all funds except grant and
internal service funds.
Tampa‐Hillsborough County Library Revenues by Source,
FY 2012 Adopted Budget
Tampa‐Hillsborough County Library Expenditures by Use,
FY 2012 Adopted Budget
Source: Email communication with David Wullschleger, Operations Manager for
Hillsborough County Library Services. Amounts are from the Tampa‐Hillsborough
County Public Library Operating Revenue Summary.
Source: Email communication with David Wullschleger, Operations Manager for
Hillsborough County Library Services. Amounts are from the Tampa‐Hillsborough
County Library Fiscal Year Budget for 2012 as of December 31, 2011.
Appendix F- Detailed Source Tables Page F-77

Taxes 777,084,688$ General Government / Administration 87,254,589$
Intergovernmental* 154,285,739$ Human Services 249,549,982$
Charges For Services 80,055,128$ Debt Service 145,725,615$
Licenses & Permits 4,351,191$ Environmental Services 21,156,719$
Fines & Forfeitures -$ Public Safety 139,659,453$
Investment Earnings 24,137,410$ Community Development 62,044,381$
Miscellaneous 925,170$ Depreciation and Amortization 551,000$
Bond Proceeds and Premiums 314,970,000$ Cost of Service 27,862,670$
Appropriated Fund Balance 22,552,348$ Education 644,437,265$
Total Revenues by Source 1,378,361,674$ Total Operating Expenses 1,378,241,674$
Ad Valorem Taxes 551,440,000$ General Government 39,138,025$
Sales Tax 157,228,000$ Community Services 23,663,761$
Other Taxes -$ Environmental Services 8,898,319$
Lease/Rental Vehicle Tax 2,500,000$ General Services Administration 27,238,883$
Payment in Lieu of Taxes 1,201,000$ Human Services 228,317,773$
Real Property Transfer (Excise) Tax 12,300,000$ Medical Examiner 200,000$
Penalties & Interest 2,500,000$ Public Safety 22,203,626$
Federal Shared Revenue 5,220,335$ City-County Bureau of Identification 4,206,671$
State Shared Revenue 109,724,019$ Sheriff 57,648,710$
Local Shared Revenue 3,480,119$ Non-Departmental 9,211,967$
Licenses and Permits 4,347,191$ Transfers to Other Funds 180,601,000$
Charges for Services 55,620,734$ Education 318,702,265$
Investment Earnings 354,410$ Total Operating Expenses 920,031,000$
Miscellaneous 472,444$
Other Financing Sources 12,411,748$
Transfers 1,231,000$
Total General Fund Revenue 920,031,000$
General Fund* 16,136,622$ Personnel Services 11,284,243$
Intergovernmental Revenues 637,500$ Operating Expenses 4,852,379$
Fees & Other Revenues 845,000$ Capital Outlay -$
Total General Fund Revenue 17,619,122$ Total Expenditures 16,136,622$
*Note: This amount ($16,136,622) is reported as a county expenditure given to
"Community Services," a county department that the public library is under. This
amount matches page 50 of 2008 Fiscal Year Adopted Budget for "Community
Services" which is labeled as Expenditures Totals on page 108. For the purpose
of calculating the library's revenue, this amount is treated as revenue received by
the library from the county. Thus, UNC Charlotte Urban Institute added this
expenditure line item from the county to the library's reported revenue from
other sources to obtain the library's total revenue ($17,619,122).
Source: 2008 Fiscal Year Adopted Budget, page 50 (page 4 in PDF view)
(http://www.wakegov.com/NR/rdonlyres/02CBA41A-6D78-4879-AD7D-
17FD409F27C5/0/generalfund.pdf) and page 108 (page 10 in PDF view)
(http://www.wakegov.com/NR/rdonlyres/EF9E6065-073B-49CA-85B8-
79DCE105884D/0/communityservices.pdf)
Wake County Government Total Revenues by Source,
FY 2008 Adopted Budget
Wake County Government Expenditures by Use,
FY 2008 Adopted Budget
Source: 2008 Fiscal Year Adopted Budget, page 23 (page 3 in PDF view)
(http://www.wakegov.com/NR/rdonlyres/0F4C5D3B-4A03-4C93-BC84-
8B9034136334/0/budgethighlights.pdf)
Wake County Government General Fund Revenue by Source,
FY 2008 Adopted Budget
Wake County Government General Fund Expenditures,
FY 2008 Adopted Budget
Source: 2008 Fiscal Year Adopted Budget, pages 50-52 (pages 4-6 in PDF view)
(http://www.wakegov.com/NR/rdonlyres/02CBA41A-6D78-4879-AD7D-
17FD409F27C5/0/generalfund.pdf)
Source: 2008 Fiscal Year Adopted Budget, pages 47-49 (pages 1-3 in PDF view)
(http://www.wakegov.com/NR/rdonlyres/02CBA41A-6D78-4879-AD7D-
17FD409F27C5/0/generalfund.pdf)
Wake County Public Libraries Revenue by Source,
FY 2008 Adopted Budget
Wake County Public Libraries Expenditures,
FY 2008 Adopted Budget
Source: 2008 Fiscal Year Adopted Budget, page 108 (page 10 in PDF view)
(http://www.wakegov.com/NR/rdonlyres/EF9E6065-073B-49CA-85B8-
79DCE105884D/0/communityservices.pdf)
Source: 2008 Fiscal Year Adopted Budget, page 22 (page 2 in PDF view)
(http://www.wakegov.com/NR/rdonlyres/0F4C5D3B-4A03-4C93-BC84-
8B9034136334/0/budgethighlights.pdf)
*Note: This was broken down into federal, state, and local government in later
reports.
Appendix F- Detailed Source Tables Page F-78
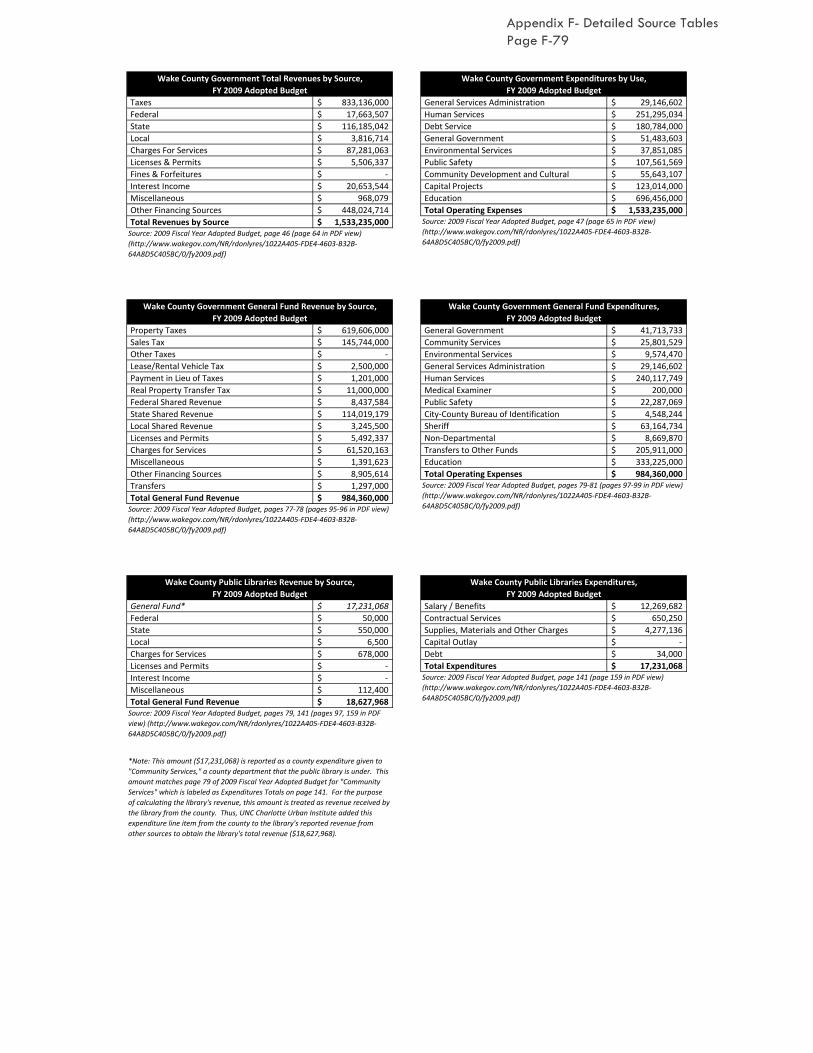
Taxes 833,136,000$ General Services Administration 29,146,602$
Federal 17,663,507$ Human Services 251,295,034$
State 116,185,042$ Debt Service 180,784,000$
Local 3,816,714$ General Government 51,483,603$
Charges For Services 87,281,063$ Environmental Services 37,851,085$
Licenses & Permits 5,506,337$ Public Safety 107,561,569$
Fines & Forfeitures -$ Community Development and Cultural 55,643,107$
Interest Income 20,653,544$ Capital Projects 123,014,000$
Miscellaneous 968,079$ Education 696,456,000$
Other Financing Sources 448,024,714$ Total Operating Expenses 1,533,235,000$
Total Revenues by Source 1,533,235,000$
Property Taxes 619,606,000$ General Government 41,713,733$
Sales Tax 145,744,000$ Community Services 25,801,529$
Other Taxes -$ Environmental Services 9,574,470$
Lease/Rental Vehicle Tax 2,500,000$ General Services Administration 29,146,602$
Payment in Lieu of Taxes 1,201,000$ Human Services 240,117,749$
Real Property Transfer Tax 11,000,000$ Medical Examiner 200,000$
Federal Shared Revenue 8,437,584$ Public Safety 22,287,069$
State Shared Revenue 114,019,179$ City-County Bureau of Identification 4,548,244$
Local Shared Revenue 3,245,500$ Sheriff 63,164,734$
Licenses and Permits 5,492,337$ Non-Departmental 8,669,870$
Charges for Services 61,520,163$ Transfers to Other Funds 205,911,000$
Miscellaneous 1,391,623$ Education 333,225,000$
Other Financing Sources 8,905,614$ Total Operating Expenses 984,360,000$
Transfers 1,297,000$
Total General Fund Revenue 984,360,000$
General Fund* 17,231,068$ Salary / Benefits 12,269,682$
Federal 50,000$ Contractual Services 650,250$
State 550,000$ Supplies, Materials and Other Charges 4,277,136$
Local 6,500$ Capital Outlay -$
Charges for Services 678,000$ Debt 34,000$
Licenses and Permits -$ Total Expenditures 17,231,068$
Interest Income -$
Miscellaneous 112,400$
Total General Fund Revenue 18,627,968$
*Note: This amount ($17,231,068) is reported as a county expenditure given to
"Community Services," a county department that the public library is under. This
amount matches page 79 of 2009 Fiscal Year Adopted Budget for "Community
Services" which is labeled as Expenditures Totals on page 141. For the purpose
of calculating the library's revenue, this amount is treated as revenue received by
the library from the county. Thus, UNC Charlotte Urban Institute added this
expenditure line item from the county to the library's reported revenue from
other sources to obtain the library's total revenue ($18,627,968).
Wake County Government Total Revenues by Source,
FY 2009 Adopted Budget
Wake County Government Expenditures by Use,
FY 2009 Adopted Budget
Source: 2009 Fiscal Year Adopted Budget, page 47 (page 65 in PDF view)
(http://www.wakegov.com/NR/rdonlyres/1022A405-FDE4-4603-B32B-
64A8D5C405BC/0/fy2009.pdf)Source: 2009 Fiscal Year Adopted Budget, page 46 (page 64 in PDF view)
(http://www.wakegov.com/NR/rdonlyres/1022A405-FDE4-4603-B32B-
64A8D5C405BC/0/fy2009.pdf)
Wake County Government General Fund Revenue by Source,
FY 2009 Adopted Budget
Wake County Government General Fund Expenditures,
FY 2009 Adopted Budget
Source: 2009 Fiscal Year Adopted Budget, pages 79-81 (pages 97-99 in PDF view)
(http://www.wakegov.com/NR/rdonlyres/1022A405-FDE4-4603-B32B-
64A8D5C405BC/0/fy2009.pdf)Source: 2009 Fiscal Year Adopted Budget, pages 77-78 (pages 95-96 in PDF view)
(http://www.wakegov.com/NR/rdonlyres/1022A405-FDE4-4603-B32B-
64A8D5C405BC/0/fy2009.pdf)
Wake County Public Libraries Revenue by Source,
FY 2009 Adopted Budget
Wake County Public Libraries Expenditures,
FY 2009 Adopted Budget
Source: 2009 Fiscal Year Adopted Budget, page 141 (page 159 in PDF view)
(http://www.wakegov.com/NR/rdonlyres/1022A405-FDE4-4603-B32B-
64A8D5C405BC/0/fy2009.pdf)
Source: 2009 Fiscal Year Adopted Budget, pages 79, 141 (pages 97, 159 in PDF
view) (http://www.wakegov.com/NR/rdonlyres/1022A405-FDE4-4603-B32B-
64A8D5C405BC/0/fy2009.pdf)
Appendix F- Detailed Source Tables Page F-79

Taxes 812,360,300$ General Services Administration 27,020,958$
Federal 20,771,258$ Human Services 238,308,447$
State 125,629,970$ Debt Service 195,824,000$
Local 3,779,533$ General Government 43,081,699$
Charges For Services 85,365,938$ Environmental Services 36,579,025$
Licenses & Permits 4,124,719$ Public Safety 105,011,328$
Fines & Forfeitures -$ Community Development and Cultural 55,408,754$
Interest Income 7,072,954$ Capital Projects 402,463,000$
Miscellaneous 2,925,313$ Education 345,584,774$
Other Financing Sources 387,252,000$ Total Operating Expenses 1,449,281,985$
Total Revenues by Source 1,449,281,985$
Property Taxes 626,761,300$ General Government 32,589,943$
Sales Tax 122,633,000$ Community Services 25,058,504$
Other Taxes -$ Environmental Services 8,012,025$
Lease/Rental Vehicle Tax 2,500,000$ General Services Administration 27,020,958$
Payment in Lieu of Taxes 1,201,000$ Human Services 227,474,402$
Real Property Transfer Tax 6,500,000$ Medical Examiner 200,000$
Federal Shared Revenue 9,375,785$ Public Safety 21,216,184$
State Shared Revenue 113,148,292$ City-County Bureau of Identification 4,155,748$
Local Shared Revenue 3,221,900$ Sheriff 61,578,706$
Licenses and Permits 4,116,219$ Non-Departmental 9,641,756$
Charges for Services 62,026,882$ Transfers to Other Funds 206,135,000$
Miscellaneous 737,622$ Education 330,516,774$
Other Financing Sources -$ Total Operating Expenses 953,600,000$
Transfers 1,378,000$
Total General Fund Revenue 953,600,000$
General Fund* 16,324,601$ Salary / Benefits 12,177,007$
Federal -$ Contractual Services 626,350$
State 495,000$ Supplies, Materials and Other Charges 3,487,244$
Local 4,000$ Capital Outlay -$
Charges for Services 668,000$ Debt 34,000$
Licenses and Permits -$ Total Expenditures 16,324,601$
Interest Income -$
Miscellaneous 152,400$
Total Revenue 17,644,001$
*Note: This amount ($16,324,601) is reported as a county expenditure given to
"Community Services," a county department that the public library is under. This
amount matches page 92 of 2010 Fiscal Year Adopted Budget for "Community
Services" which is labeled as Expenditures Totals on page 160. For the purpose
of calculating the library's revenue, this amount is treated as revenue received by
the library from the county. Thus, UNC Charlotte Urban Institute added this
expenditure line item from the county to the library's reported revenue from
other sources to obtain the library's total revenue ($17,644,001).
Wake County Government Total Revenues by Source,
FY 2010 Adopted Budget
Wake County Government Expenditures by Use,
FY 2010 Adopted Budget
Source: 2010 Fiscal Year Adopted Budget, page 59 (page 63 in PDF view)
(http://www.wakegov.com/NR/rdonlyres/C2F6D61A-B4E9-4816-9E97-
14199D3DBDDC/0/fy2010.pdf)Source: 2010 Fiscal Year Adopted Budget, page 58 (page 62 in PDF view)
(http://www.wakegov.com/NR/rdonlyres/C2F6D61A-B4E9-4816-9E97-
14199D3DBDDC/0/fy2010.pdf)
Wake County Government General Fund Revenue by Source,
FY 2010 Adopted Budget
Wake County Government General Fund Expenditures,
FY 2010 Adopted Budget
Source: 2010 Fiscal Year Adopted Budget, General Fund Revenue Summary
pages 92-94 (pages 96-98 in PDF view)
(http://www.wakegov.com/NR/rdonlyres/C2F6D61A-B4E9-4816-9E97-
14199D3DBDDC/0/fy2010.pdf)Source: 2010 Fiscal Year Adopted Budget, General Fund Revenue Summary
pages 89-91 (pages 93-95 in PDF view)
(http://www.wakegov.com/NR/rdonlyres/C2F6D61A-B4E9-4816-9E97-
14199D3DBDDC/0/fy2010.pdf)
Wake County Public Libraries Revenue by Source,
FY 2010 Adopted Budget
Wake County Public Libraries Expenditures,
FY 2010 Adopted Budget
Source: 2010 Fiscal Year Adopted Budget, page 160 (page 164 in PDF view)
(http://www.wakegov.com/NR/rdonlyres/C2F6D61A-B4E9-4816-9E97-
14199D3DBDDC/0/fy2010.pdf)
Source: 2010 Fiscal Year Adopted Budget, pages 92, 160 (pages 96, 164 in PDF
view) (http://www.wakegov.com/NR/rdonlyres/C2F6D61A-B4E9-4816-9E97-
14199D3DBDDC/0/fy2010.pdf)
Appendix F- Detailed Source Tables Page F-80

Taxes 805,779,421$ General Services Administration 34,066,977$
Federal 25,873,174$ Human Services 238,831,083$
State 117,294,928$ Debt Service 207,950,000$
Local 7,443,200$ General Government 39,493,615$
Charges For Services 92,501,713$ Environmental Services 35,924,960$
Licenses & Permits 2,967,964$ Public Safety 108,511,415$
Fines & Forfeitures -$ Community Development and Cultural 53,892,258$
Interest Income 11,336,222$ Capital Projects 76,852,000$
Miscellaneous 4,430,556$ Education 454,494,274$
Other Financing Sources 182,389,403$ Total Operating Expenses 1,250,016,582$
Total Revenues by Source 1,250,016,581$
Property Taxes 632,638,000$ General Government 32,095,150$
Sales Tax 113,634,000$ Community Services 25,708,758$
Other Taxes -$ Environmental Services 7,859,960$
Lease/Rental Vehicle Tax 2,500,000$ General Services Administration 23,800,740$
Payment in Lieu of Taxes 1,230,421$ Human Services 226,180,341$
Real Property Transfer Tax 5,300,000$ Medical Examiner 195,000$
Federal Shared Revenue 15,161,217$ Public Safety 23,439,827$
State Shared Revenue 105,878,532$ City-County Bureau of Identification 4,204,707$
Local Shared Revenue 7,105,500$ Sheriff 62,623,778$
Licenses and Permits 2,959,464$ Non-Departmental 6,548,465$
Charges for Services 61,123,578$ Transfers to Other Funds 209,069,000$
Miscellaneous 377,288$ Education 329,494,274$
Other Financing Sources 2,000,000$ Total Operating Expenses 951,220,000$
Transfers 1,312,000$
Total General Fund Revenue 951,220,000$
General Fund * 17,616,069$ Salary / Benefits 12,516,306$
Federal -$ Contractual Services 585,350$
State 495,000$ Supplies, Materials and Other Charges 4,480,413$
Local -$ Capital Outlay -$
Charges for Services 481,000$ Debt 34,000$
Licenses and Permits -$ Total Expenditures 17,616,069$
Interest Income -$
Miscellaneous 182,400$
Total Revenue 18,774,469$
*Note: This amount ($17,616,069) is reported as a county expenditure given to
"Community Services," a county department that the public library is under. This
amount matches page 102 of 2011 Fiscal Year Adopted Budget for "Community
Services" which is labeled as Expenditures Totals on page 160. For the purpose
of calculating the library's revenue, this amount is treated as revenue received by
the library from the county. Thus, UNC Charlotte Urban Institute added this
expenditure line item from the county to the library's reported revenue from
other sources to obtain the library's total revenue ($18,774,469).
Wake County Government Total Revenues by Source,
FY 2011 Adopted Budget
Wake County Government Expenditures by Use,
FY 2011 Adopted Budget
Source: 2011 Fiscal Year Adopted Budget, page 61 (page 65 in PDF view)
(http://www.wakegov.com/NR/rdonlyres/F8746C7A-AE8D-4FBC-977C-
71C32E3A4A31/0/wake_fy2011_adopted_budget.pdf)Source: 2011 Fiscal Year Adopted Budget, page 60 (page 64 in PDF view)
(http://www.wakegov.com/NR/rdonlyres/F8746C7A-AE8D-4FBC-977C-
71C32E3A4A31/0/wake_fy2011_adopted_budget.pdf)
Wake County Government General Fund Revenue by Source,
FY 2011 Adopted Budget
Wake County Government General Fund Expenditures,
FY 2011 Adopted Budget
Source: Source: 2011 Fiscal Year Adopted Budget, General Fund Expenditure
Summary pages 102-104 (pages 106-109 in PDF view)
(http://www.wakegov.com/NR/rdonlyres/F8746C7A-AE8D-4FBC-977C-
71C32E3A4A31/0/wake_fy2011_adopted_budget.pdf)Source: 2011 Fiscal Year Adopted Budget, General Fund Revenue Summary
pages 99-101 (pages 103-105 in PDF view)
(http://www.wakegov.com/NR/rdonlyres/F8746C7A-AE8D-4FBC-977C-
71C32E3A4A31/0/wake_fy2011_adopted_budget.pdf)
Wake County Public Libraries Revenue by Source,
FY 2011 Adopted Budget
Wake County Public Libraries Expenditures,
FY 2011 Adopted Budget
Source: 2011 Fiscal Year Adopted Budget, page 160 (page 164 in PDF view)
(http://www.wakegov.com/NR/rdonlyres/F8746C7A-AE8D-4FBC-977C-
71C32E3A4A31/0/wake_fy2011_adopted_budget.pdf)
Source: 2011 Fiscal Year Adopted Budget, pages 102, 160 (pages 106, 164 in PDF
view) (http://www.wakegov.com/NR/rdonlyres/F8746C7A-AE8D-4FBC-977C-
71C32E3A4A31/0/wake_fy2011_adopted_budget.pdf)
Appendix F- Detailed Source Tables Page F-81
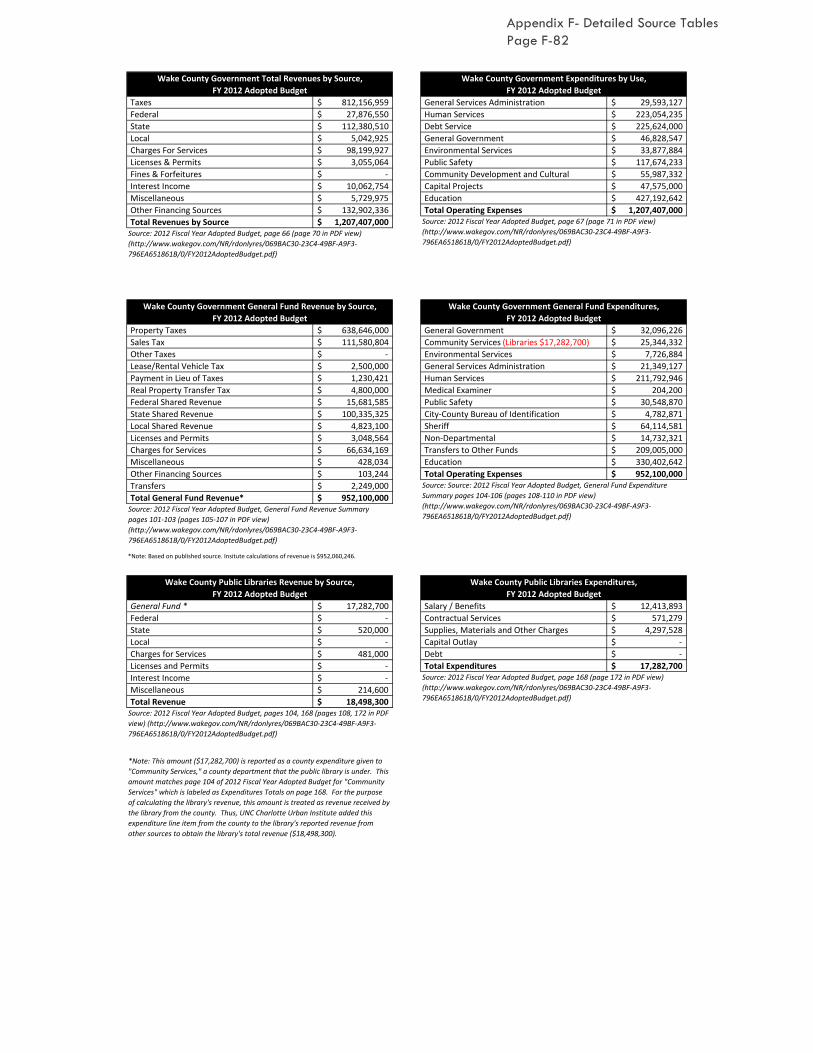
Taxes 812,156,959$ General Services Administration 29,593,127$
Federal 27,876,550$ Human Services 223,054,235$
State 112,380,510$ Debt Service 225,624,000$
Local 5,042,925$ General Government 46,828,547$
Charges For Services 98,199,927$ Environmental Services 33,877,884$
Licenses & Permits 3,055,064$ Public Safety 117,674,233$
Fines & Forfeitures ‐$ Community Development and Cultural 55,987,332$
Interest Income 10,062,754$ Capital Projects 47,575,000$
Miscellaneous 5,729,975$ Education 427,192,642$
Other Financing Sources 132,902,336$ Total Operating Expenses 1,207,407,000$
Total Revenues by Source 1,207,407,000$
Property Taxes 638,646,000$ General Government 32,096,226$
Sales Tax 111,580,804$ Community Services (Libraries $17,282,700) 25,344,332$
Other Taxes ‐$ Environmental Services 7,726,884$
Lease/Rental Vehicle Tax 2,500,000$ General Services Administration 21,349,127$
Payment in Lieu of Taxes 1,230,421$ Human Services 211,792,946$
Real Property Transfer Tax 4,800,000$ Medical Examiner 204,200$
Federal Shared Revenue 15,681,585$ Public Safety 30,548,870$
State Shared Revenue 100,335,325$ City‐County Bureau of Identification 4,782,871$
Local Shared Revenue 4,823,100$ Sheriff 64,114,581$
Licenses and Permits 3,048,564$ Non‐Departmental 14,732,321$
Charges for Services 66,634,169$ Transfers to Other Funds 209,005,000$
Miscellaneous 428,034$ Education 330,402,642$
Other Financing Sources 103,244$ Total Operating Expenses 952,100,000$
Transfers 2,249,000$
Total General Fund Revenue* 952,100,000$
General Fund * 17,282,700$ Salary / Benefits 12,413,893$
Federal ‐$ Contractual Services 571,279$
State 520,000$ Supplies, Materials and Other Charges 4,297,528$
Local ‐$ Capital Outlay ‐$
Charges for Services 481,000$ Debt ‐$
Licenses and Permits ‐$ Total Expenditures 17,282,700$
Interest Income ‐$
Miscellaneous 214,600$
Total Revenue 18,498,300$
Wake County Government Total Revenues by Source,
FY 2012 Adopted Budget
Wake County Government Expenditures by Use,
FY 2012 Adopted Budget
Source: 2012 Fiscal Year Adopted Budget, page 67 (page 71 in PDF view)
(http://www.wakegov.com/NR/rdonlyres/069BAC30‐23C4‐49BF‐A9F3‐
796EA651861B/0/FY2012AdoptedBudget.pdf)
Wake County Government General Fund Revenue by Source,
FY 2012 Adopted Budget
Wake County Government General Fund Expenditures,
FY 2012 Adopted Budget
Source: 2012 Fiscal Year Adopted Budget, page 66 (page 70 in PDF view)
(http://www.wakegov.com/NR/rdonlyres/069BAC30‐23C4‐49BF‐A9F3‐
796EA651861B/0/FY2012AdoptedBudget.pdf)
*Note: This amount ($17,282,700) is reported as a county expenditure given to
"Community Services," a county department that the public library is under. This
amount matches page 104 of 2012 Fiscal Year Adopted Budget for "Community
Services" which is labeled as Expenditures Totals on page 168. For the purpose
of calculating the library's revenue, this amount is treated as revenue received by
the library from the county. Thus, UNC Charlotte Urban Institute added this
expenditure line item from the county to the library's reported revenue from
other sources to obtain the library's total revenue ($18,498,300).
Source: Source: 2012 Fiscal Year Adopted Budget, General Fund Expenditure
Summary pages 104‐106 (pages 108‐110 in PDF view)
(http://www.wakegov.com/NR/rdonlyres/069BAC30‐23C4‐49BF‐A9F3‐
796EA651861B/0/FY2012AdoptedBudget.pdf)Source: 2012 Fiscal Year Adopted Budget, General Fund Revenue Summary
pages 101‐103 (pages 105‐107 in PDF view)
(http://www.wakegov.com/NR/rdonlyres/069BAC30‐23C4‐49BF‐A9F3‐
796EA651861B/0/FY2012AdoptedBudget.pdf)
Wake County Public Libraries Revenue by Source,
FY 2012 Adopted Budget
Wake County Public Libraries Expenditures,
FY 2012 Adopted Budget
Source: 2012 Fiscal Year Adopted Budget, page 168 (page 172 in PDF view)
(http://www.wakegov.com/NR/rdonlyres/069BAC30‐23C4‐49BF‐A9F3‐
796EA651861B/0/FY2012AdoptedBudget.pdf)
Source: 2012 Fiscal Year Adopted Budget, pages 104, 168 (pages 108, 172 in PDF
view) (http://www.wakegov.com/NR/rdonlyres/069BAC30‐23C4‐49BF‐A9F3‐
796EA651861B/0/FY2012AdoptedBudget.pdf)
*Note: Based on published source. Insitute calculations of revenue is $952,060,246.
Appendix F- Detailed Source Tables Page F-82