Embed Size (px)
Citation preview
174
V. Comparative Value Chain and Economic
Analysis of the Furniture/Wood Processing
Sector (Chairs) in Ethiopia, Tanzania, Zambia,
China and Vietnam
175
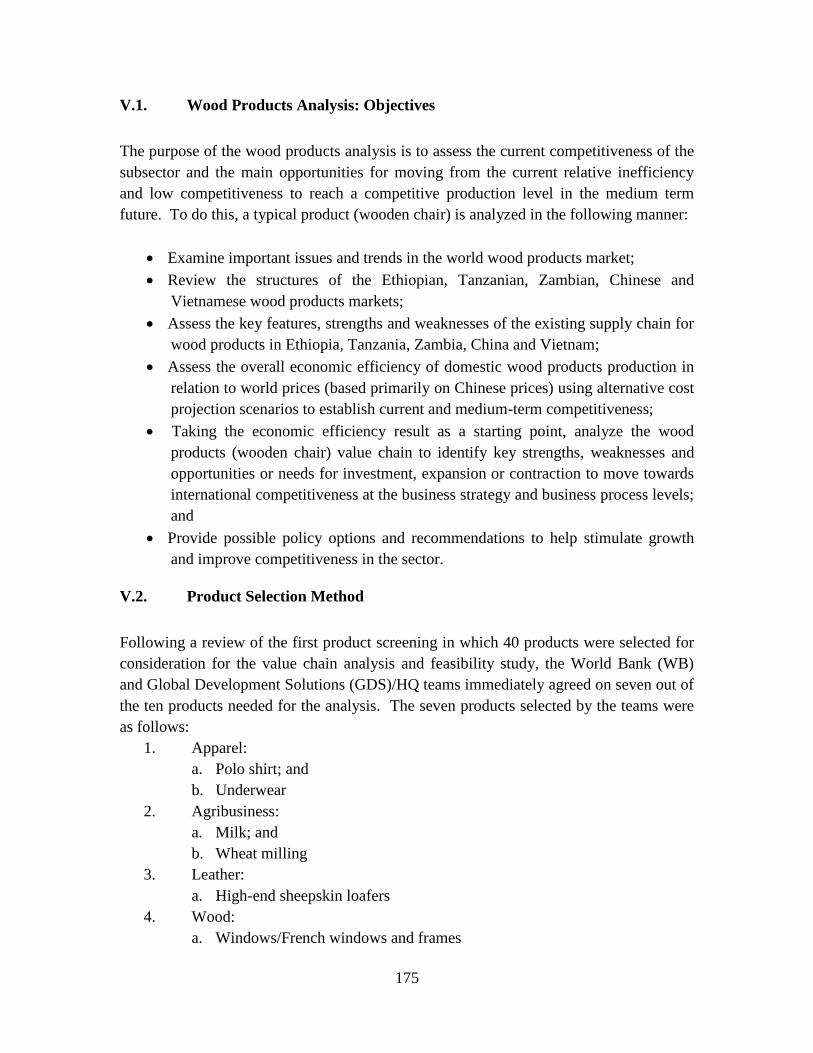
V.1. Wood Products Analysis: Objectives
The purpose of the wood products analysis is to assess the current competitiveness of the
subsector and the main opportunities for moving from the current relative inefficiency
and low competitiveness to reach a competitive production level in the medium term
future. To do this, a typical product (wooden chair) is analyzed in the following manner:
Examine important issues and trends in the world wood products market;
Review the structures of the Ethiopian, Tanzanian, Zambian, Chinese and
Vietnamese wood products markets;
Assess the key features, strengths and weaknesses of the existing supply chain for
wood products in Ethiopia, Tanzania, Zambia, China and Vietnam;
Assess the overall economic efficiency of domestic wood products production in
relation to world prices (based primarily on Chinese prices) using alternative cost
projection scenarios to establish current and medium-term competitiveness;
Taking the economic efficiency result as a starting point, analyze the wood
products (wooden chair) value chain to identify key strengths, weaknesses and
opportunities or needs for investment, expansion or contraction to move towards
international competitiveness at the business strategy and business process levels;
and
Provide possible policy options and recommendations to help stimulate growth
and improve competitiveness in the sector.
V.2. Product Selection Method
Following a review of the first product screening in which 40 products were selected for
consideration for the value chain analysis and feasibility study, the World Bank (WB)
and Global Development Solutions (GDS)/HQ teams immediately agreed on seven out of
the ten products needed for the analysis. The seven products selected by the teams were
as follows:
1. Apparel:
a. Polo shirt; and
b. Underwear
2. Agribusiness:
a. Milk; and
b. Wheat milling
3. Leather:
a. High-end sheepskin loafers
4. Wood:
a. Windows/French windows and frames
176
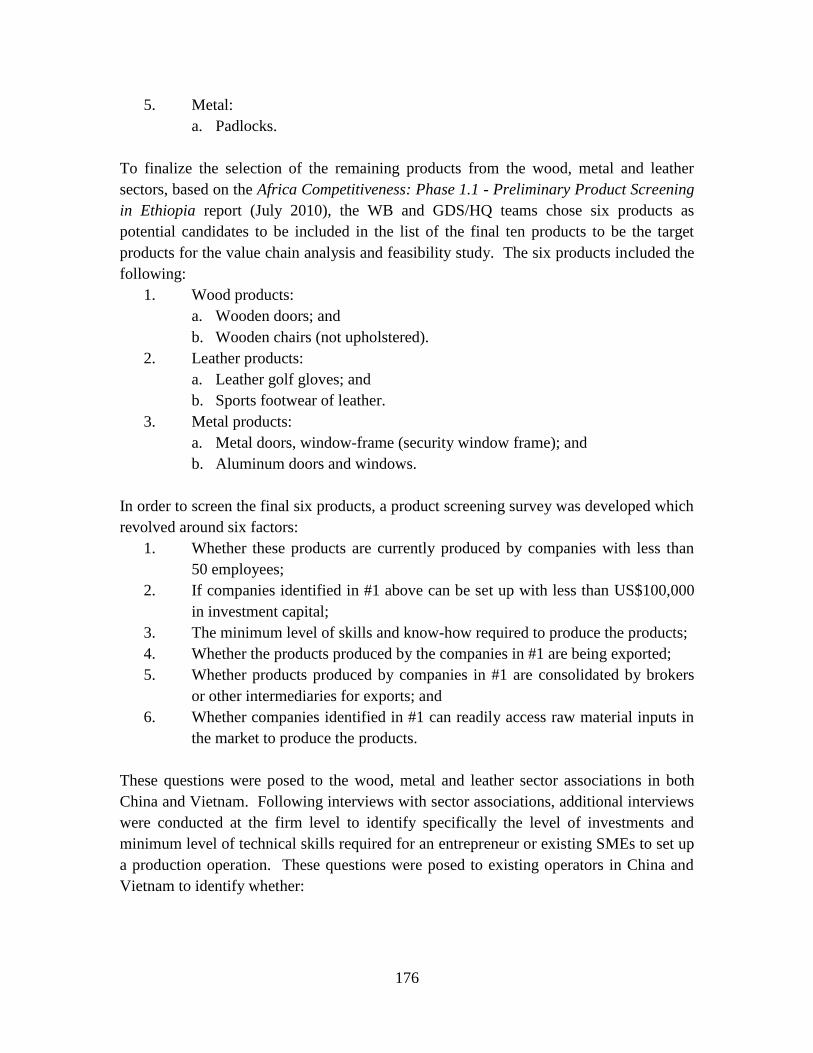
5. Metal:
a. Padlocks.
To finalize the selection of the remaining products from the wood, metal and leather
sectors, based on the Africa Competitiveness: Phase 1.1 - Preliminary Product Screening
in Ethiopia report (July 2010), the WB and GDS/HQ teams chose six products as
potential candidates to be included in the list of the final ten products to be the target
products for the value chain analysis and feasibility study. The six products included the
following:
1. Wood products:
a. Wooden doors; and
b. Wooden chairs (not upholstered).
2. Leather products:
a. Leather golf gloves; and
b. Sports footwear of leather.
3. Metal products:
a. Metal doors, window-frame (security window frame); and
b. Aluminum doors and windows.
In order to screen the final six products, a product screening survey was developed which
revolved around six factors:
1. Whether these products are currently produced by companies with less than
50 employees;
2. If companies identified in #1 above can be set up with less than US$100,000
in investment capital;
3. The minimum level of skills and know-how required to produce the products;
4. Whether the products produced by the companies in #1 are being exported;
5. Whether products produced by companies in #1 are consolidated by brokers
or other intermediaries for exports; and
6. Whether companies identified in #1 can readily access raw material inputs in
the market to produce the products.
These questions were posed to the wood, metal and leather sector associations in both
China and Vietnam. Following interviews with sector associations, additional interviews
were conducted at the firm level to identify specifically the level of investments and
minimum level of technical skills required for an entrepreneur or existing SMEs to set up
a production operation. These questions were posed to existing operators in China and
Vietnam to identify whether:

177
Barriers to market entry, particularly from a financial and skills
requirement, were sufficiently low to allow entrepreneurs and SMEs in
Ethiopia to easily establish operations; and
These products are currently being produced by SMEs in China and
Vietnam, and are effectively being sold in local and export markets.
The product screening survey identified the following products as viable candidates to be
targeted for the value chain and feasibility analysis.
1. Wood product:
a. Wooden chairs (soft wood); and
b. Wooden door (semi-solid).
Although French windows and their frames made of wood had originally been
preselected for analysis, a decision was made to opt to analyze both wooden
chairs and wooden doors. This decision stemmed from the fact that French
windows require glass thus introducing an outside factor that could influence
the manufacturing of the final product. Wooden doors (without glass) and
wooden chairs (without upholstery) are more representative of wood
processing exclusively.
2. Leather products: Leather golf gloves or sports glove of comparable structure
and weight.
3. Metal products: Both the pre-selected products (security window frame; and
aluminum doors and windows) were screened out of the selection due to
various factors including high initial investment requirements. As a result,
further analyses of products identified during the preliminary product
screening were conducted. Interviews with metal sector associations and
enterprises currently operating in China and Vietnam, as well as interviews
with existing operators in the fabricated metal products sector in Ethiopia
identified crown corks (bottle caps) as a viable candidate to be targeted for
value chain analysis. Crown corks currently are produced in four of the five
countries, but Ethiopia continues to import substantial volumes of this product,
including imports from China. As a result, crown corks have been chosen as
the final fabricated metal product to be the focus of a value chain analysis in
the target countries.
178
V.2.1. Respective Government Definitions of Small, Medium and
Large Enterprises in Ethiopia, Tanzania, Zambia, China and
Vietnam
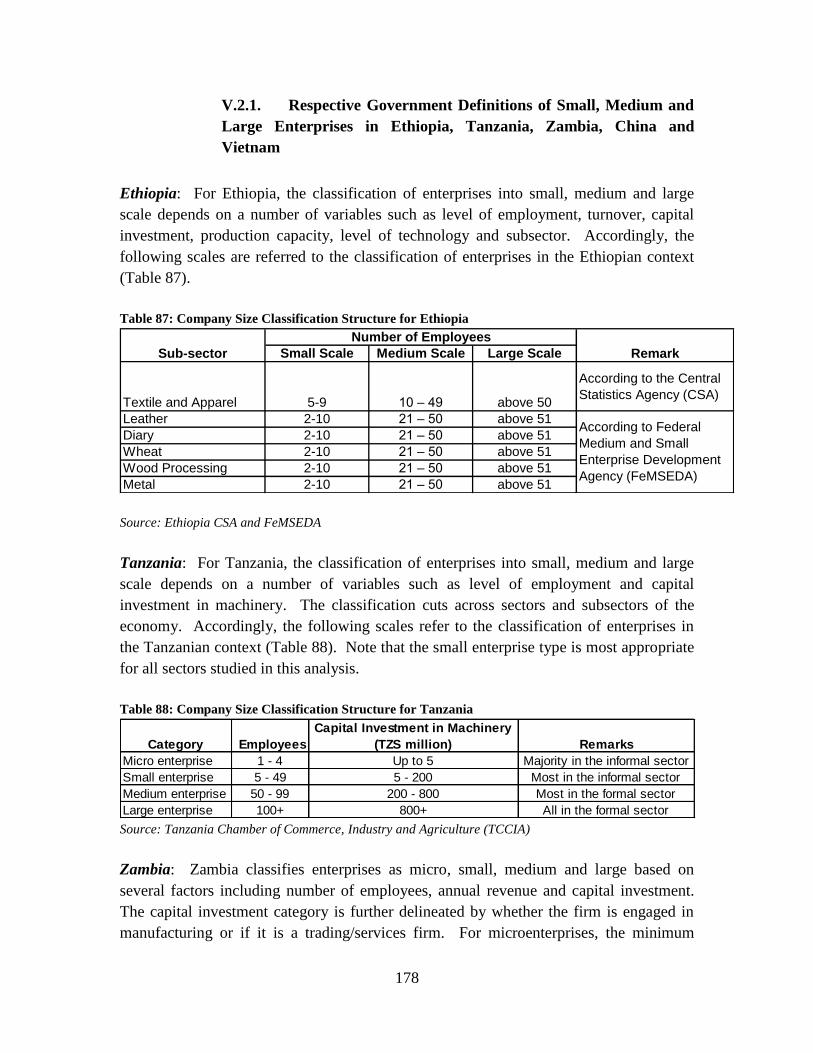
Ethiopia: For Ethiopia, the classification of enterprises into small, medium and large
scale depends on a number of variables such as level of employment, turnover, capital
investment, production capacity, level of technology and subsector. Accordingly, the
following scales are referred to the classification of enterprises in the Ethiopian context
(Table 87).
Table 87: Company Size Classification Structure for Ethiopia
Small Scale Medium Scale Large Scale
Textile and Apparel 5-9 10 – 49 above 50
According to the Central
Statistics Agency (CSA)
Leather 2-10 21 – 50 above 51
Diary 2-10 21 – 50 above 51
Wheat 2-10 21 – 50 above 51
Wood Processing 2-10 21 – 50 above 51
Metal 2-10 21 – 50 above 51
According to Federal
Medium and Small
Enterprise Development
Agency (FeMSEDA)
Sub-sector Remark
Number of Employees
Source: Ethiopia CSA and FeMSEDA
Tanzania: For Tanzania, the classification of enterprises into small, medium and large
scale depends on a number of variables such as level of employment and capital
investment in machinery. The classification cuts across sectors and subsectors of the
economy. Accordingly, the following scales refer to the classification of enterprises in
the Tanzanian context (Table 88). Note that the small enterprise type is most appropriate
for all sectors studied in this analysis.
Table 88: Company Size Classification Structure for Tanzania
Category Employees
Capital Investment in Machinery
(TZS million) Remarks
Micro enterprise 1 - 4 Up to 5 Majority in the informal sector
Small enterprise 5 - 49 5 - 200 Most in the informal sector
Medium enterprise 50 - 99 200 - 800 Most in the formal sector
Large enterprise 100+ 800+ All in the formal sector Source: Tanzania Chamber of Commerce, Industry and Agriculture (TCCIA)
Zambia: Zambia classifies enterprises as micro, small, medium and large based on
several factors including number of employees, annual revenue and capital investment.
The capital investment category is further delineated by whether the firm is engaged in
manufacturing or if it is a trading/services firm. For microenterprises, the minimum
179
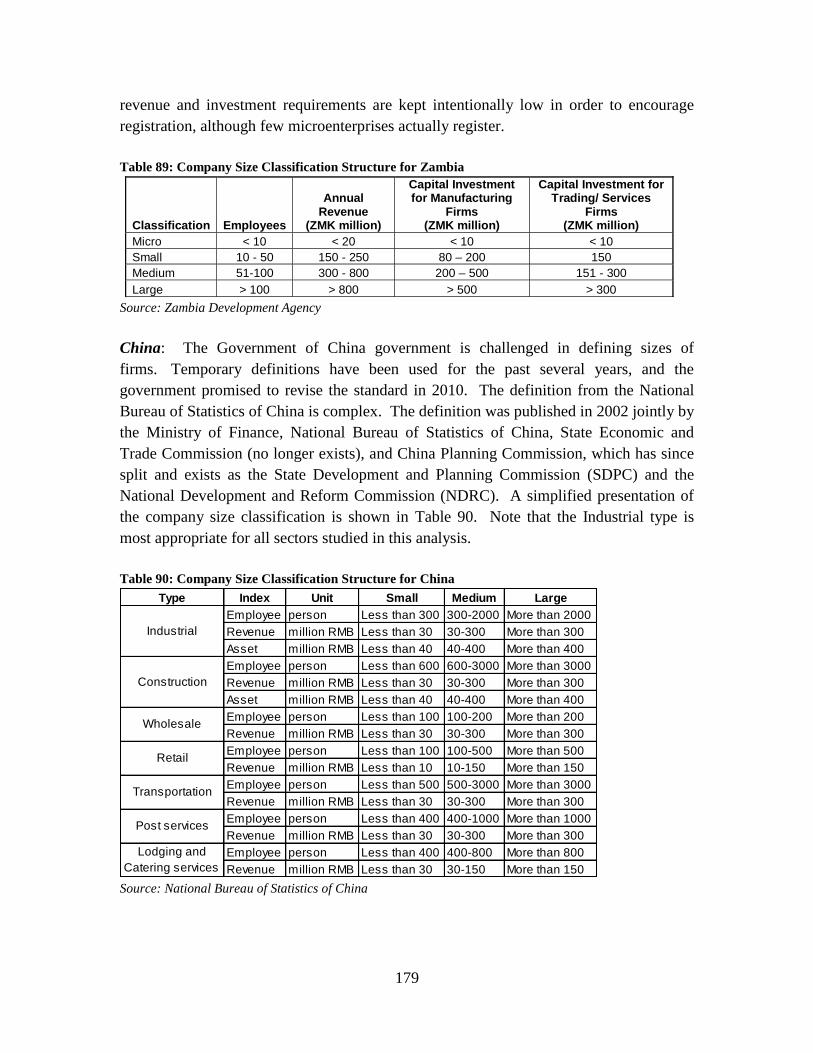
revenue and investment requirements are kept intentionally low in order to encourage
registration, although few microenterprises actually register.
Table 89: Company Size Classification Structure for Zambia
Classification Employees
Annual Revenue
(ZMK million)
Capital Investment for Manufacturing
Firms (ZMK million)
Capital Investment for Trading/ Services
Firms (ZMK million)
Micro < 10 < 20 < 10 < 10
Small 10 - 50 150 - 250 80 – 200 150
Medium 51-100 300 - 800 200 – 500 151 - 300
Large > 100 > 800 > 500 > 300
Source: Zambia Development Agency
China: The Government of China government is challenged in defining sizes of
firms. Temporary definitions have been used for the past several years, and the
government promised to revise the standard in 2010. The definition from the National
Bureau of Statistics of China is complex. The definition was published in 2002 jointly by
the Ministry of Finance, National Bureau of Statistics of China, State Economic and
Trade Commission (no longer exists), and China Planning Commission, which has since
split and exists as the State Development and Planning Commission (SDPC) and the
National Development and Reform Commission (NDRC). A simplified presentation of
the company size classification is shown in Table 90. Note that the Industrial type is
most appropriate for all sectors studied in this analysis.
Table 90: Company Size Classification Structure for China
Type Index Unit Small Medium Large
Employee person Less than 300 300-2000 More than 2000
Revenue million RMB Less than 30 30-300 More than 300
Asset million RMB Less than 40 40-400 More than 400
Employee person Less than 600 600-3000 More than 3000
Revenue million RMB Less than 30 30-300 More than 300
Asset million RMB Less than 40 40-400 More than 400
Employee person Less than 100 100-200 More than 200
Revenue million RMB Less than 30 30-300 More than 300
Employee person Less than 100 100-500 More than 500
Revenue million RMB Less than 10 10-150 More than 150
Employee person Less than 500 500-3000 More than 3000
Revenue million RMB Less than 30 30-300 More than 300
Employee person Less than 400 400-1000 More than 1000
Revenue million RMB Less than 30 30-300 More than 300
Employee person Less than 400 400-800 More than 800
Revenue million RMB Less than 30 30-150 More than 150
Lodging and
Catering services
Industrial
Construction
Wholesale
Retail
Transportation
Post services
Source: National Bureau of Statistics of China
180
Vietnam: A small firm has less than 50 laborers, while a medium-size firm has 51-200
laborers. Within the small and medium-size classifications, there are some detailed
categories depending on the purpose of research and management. For instance, a firm
with less than 10 laborers is called a super small-size firm. Such a regulation is in line
with Social Insurance Law.75
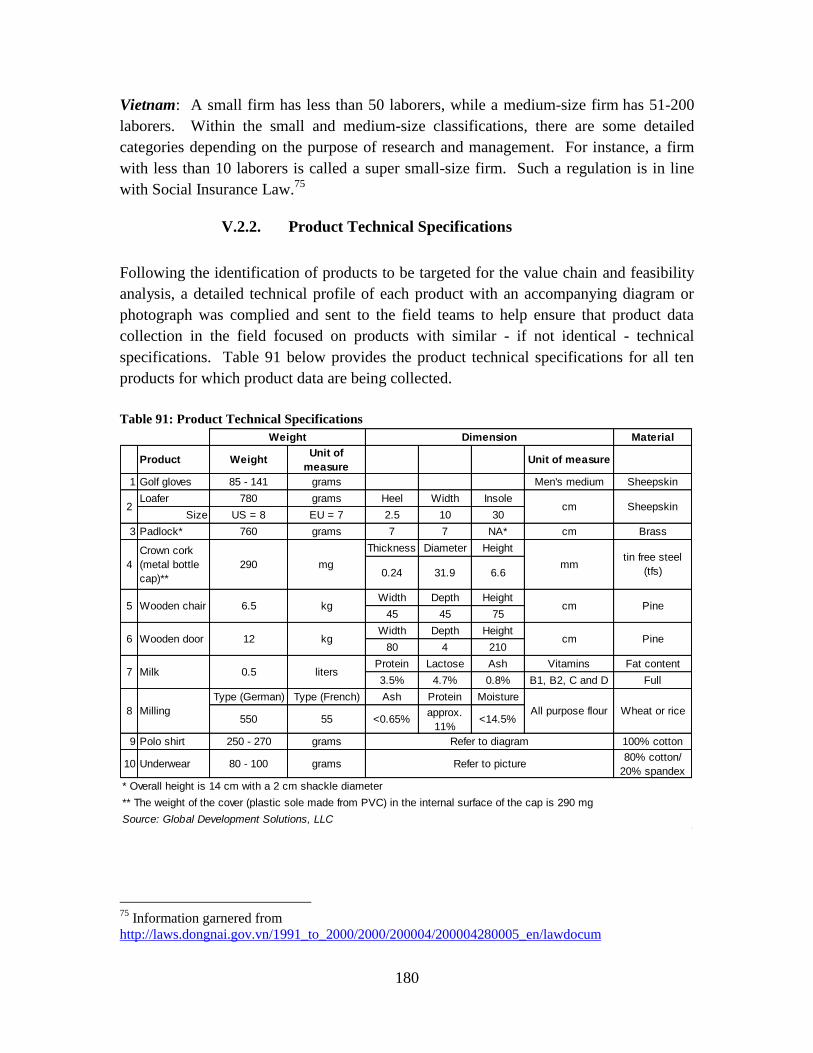
V.2.2. Product Technical Specifications
Following the identification of products to be targeted for the value chain and feasibility
analysis, a detailed technical profile of each product with an accompanying diagram or
photograph was complied and sent to the field teams to help ensure that product data
collection in the field focused on products with similar - if not identical - technical
specifications. Table 91 below provides the product technical specifications for all ten
products for which product data are being collected.
Table 91: Product Technical Specifications
Material
Product WeightUnit of
measureUnit of measure
1 Golf gloves 85 - 141 grams Men's medium Sheepskin
Loafer 780 grams Heel Width Insole
Size US = 8 EU = 7 2.5 10 30
3 Padlock* 760 grams 7 7 NA* cm Brass
Thickness Diameter Height
0.24 31.9 6.6
Width Depth Height
45 45 75
Width Depth Height
80 4 210
Protein Lactose Ash Vitamins Fat content
3.5% 4.7% 0.8% B1, B2, C and D Full
Type (German) Type (French) Ash Protein Moisture
550 55 <0.65%approx.
11%<14.5%
9 Polo shirt 250 - 270 grams 100% cotton
10 Underwear 80 - 100 grams80% cotton/
20% spandex
* Overall height is 14 cm with a 2 cm shackle diameter
** The weight of the cover (plastic sole made from PVC) in the internal surface of the cap is 290 mg
Source: Global Development Solutions, LLC
Pine
Wheat or rice
Dimension
All purpose flour
cm
Refer to diagram
Weight
cm
mm
cm
tin free steel
(tfs)
Sheepskin
Pine
mg
kg
kg
liters
Refer to picture
Crown cork
(metal bottle
cap)**
Wooden chair
Wooden door
Milk
Milling
290
6.5
12
0.5
2
4
5
6
7
8
75
Information garnered from
http://laws.dongnai.gov.vn/1991_to_2000/2000/200004/200004280005_en/lawdocum
181
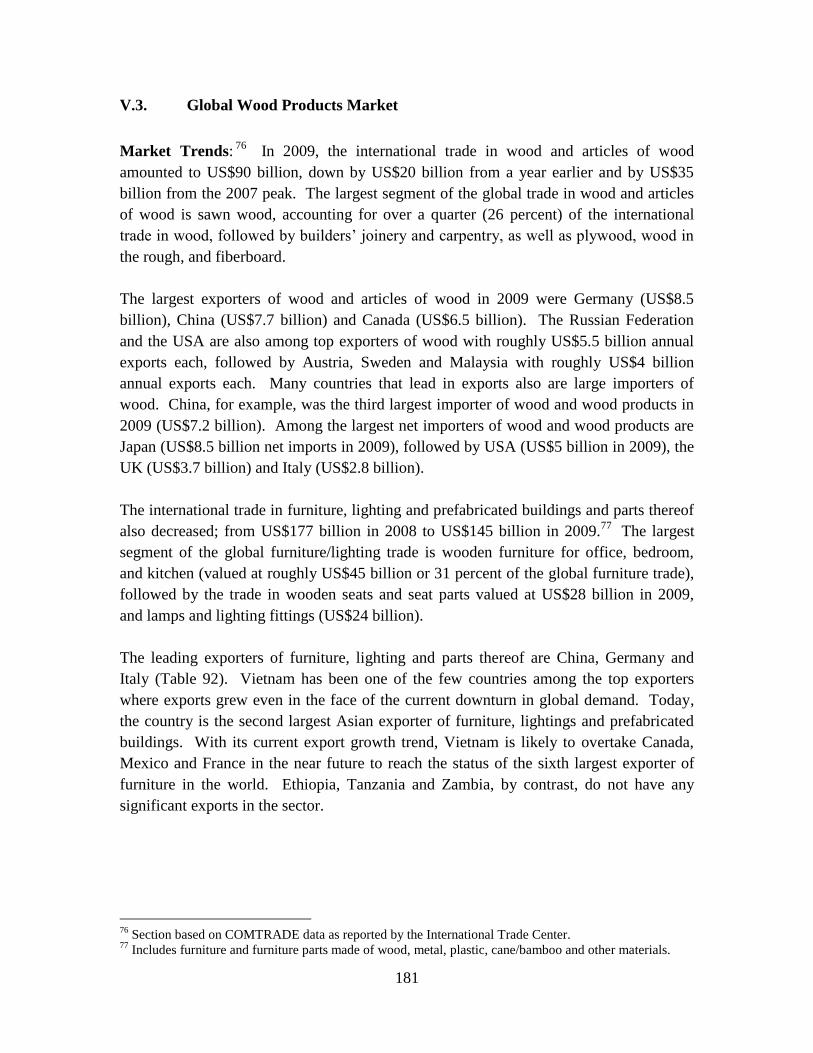
V.3. Global Wood Products Market
Market Trends:76
In 2009, the international trade in wood and articles of wood
amounted to US$90 billion, down by US$20 billion from a year earlier and by US$35
billion from the 2007 peak. The largest segment of the global trade in wood and articles
of wood is sawn wood, accounting for over a quarter (26 percent) of the international
trade in wood, followed by builders‘ joinery and carpentry, as well as plywood, wood in
the rough, and fiberboard.
The largest exporters of wood and articles of wood in 2009 were Germany (US$8.5
billion), China (US$7.7 billion) and Canada (US$6.5 billion). The Russian Federation
and the USA are also among top exporters of wood with roughly US$5.5 billion annual
exports each, followed by Austria, Sweden and Malaysia with roughly US$4 billion
annual exports each. Many countries that lead in exports also are large importers of
wood. China, for example, was the third largest importer of wood and wood products in
2009 (US$7.2 billion). Among the largest net importers of wood and wood products are
Japan (US$8.5 billion net imports in 2009), followed by USA (US$5 billion in 2009), the
UK (US$3.7 billion) and Italy (US$2.8 billion).
The international trade in furniture, lighting and prefabricated buildings and parts thereof
also decreased; from US$177 billion in 2008 to US$145 billion in 2009.77
The largest
segment of the global furniture/lighting trade is wooden furniture for office, bedroom,
and kitchen (valued at roughly US$45 billion or 31 percent of the global furniture trade),
followed by the trade in wooden seats and seat parts valued at US$28 billion in 2009,
and lamps and lighting fittings (US$24 billion).
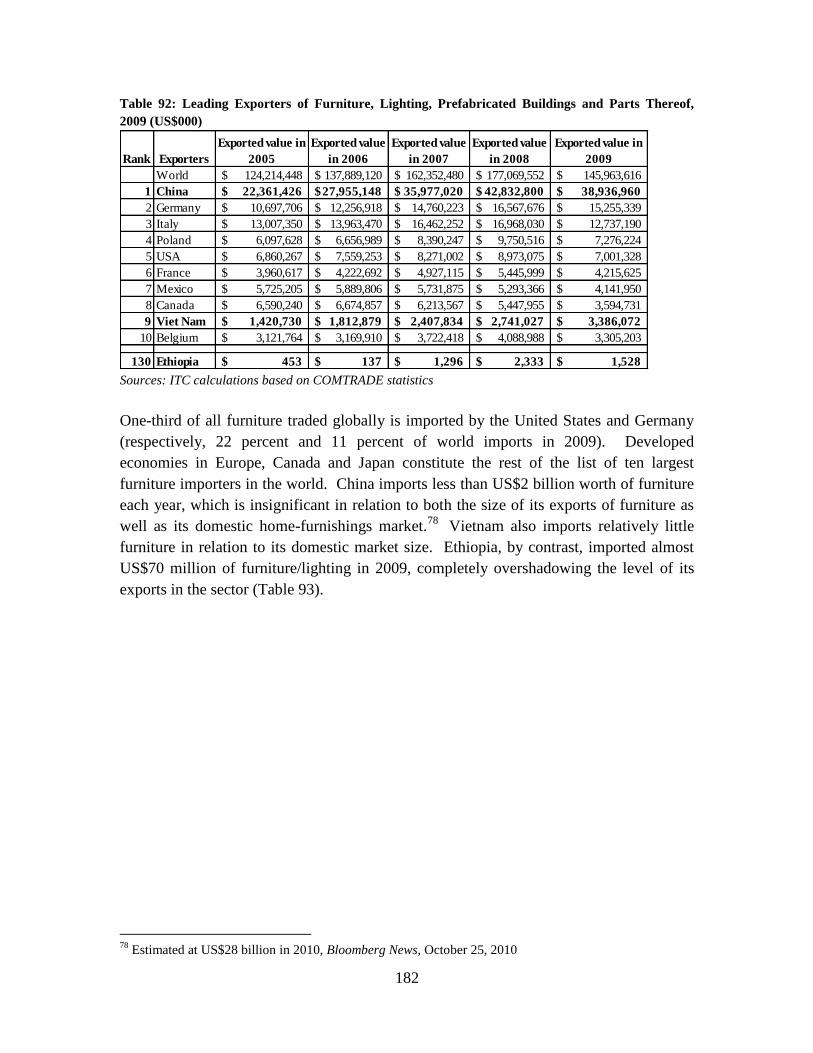
The leading exporters of furniture, lighting and parts thereof are China, Germany and
Italy (Table 92). Vietnam has been one of the few countries among the top exporters
where exports grew even in the face of the current downturn in global demand. Today,
the country is the second largest Asian exporter of furniture, lightings and prefabricated
buildings. With its current export growth trend, Vietnam is likely to overtake Canada,
Mexico and France in the near future to reach the status of the sixth largest exporter of
furniture in the world. Ethiopia, Tanzania and Zambia, by contrast, do not have any
significant exports in the sector.
76
Section based on COMTRADE data as reported by the International Trade Center. 77
Includes furniture and furniture parts made of wood, metal, plastic, cane/bamboo and other materials.
182
Table 92: Leading Exporters of Furniture, Lighting, Prefabricated Buildings and Parts Thereof,
2009 (US$000)
Rank Exporters
Exported value in
2005
Exported value
in 2006
Exported value
in 2007
Exported value
in 2008
Exported value in
2009
World 124,214,448$ 137,889,120$ 162,352,480$ 177,069,552$ 145,963,616$
1 China 22,361,426$ 27,955,148$ 35,977,020$ 42,832,800$ 38,936,960$
2 Germany 10,697,706$ 12,256,918$ 14,760,223$ 16,567,676$ 15,255,339$
3 Italy 13,007,350$ 13,963,470$ 16,462,252$ 16,968,030$ 12,737,190$
4 Poland 6,097,628$ 6,656,989$ 8,390,247$ 9,750,516$ 7,276,224$
5 USA 6,860,267$ 7,559,253$ 8,271,002$ 8,973,075$ 7,001,328$
6 France 3,960,617$ 4,222,692$ 4,927,115$ 5,445,999$ 4,215,625$
7 Mexico 5,725,205$ 5,889,806$ 5,731,875$ 5,293,366$ 4,141,950$
8 Canada 6,590,240$ 6,674,857$ 6,213,567$ 5,447,955$ 3,594,731$
9 Viet Nam 1,420,730$ 1,812,879$ 2,407,834$ 2,741,027$ 3,386,072$
10 Belgium 3,121,764$ 3,169,910$ 3,722,418$ 4,088,988$ 3,305,203$
130 Ethiopia 453$ 137$ 1,296$ 2,333$ 1,528$ Sources: ITC calculations based on COMTRADE statistics
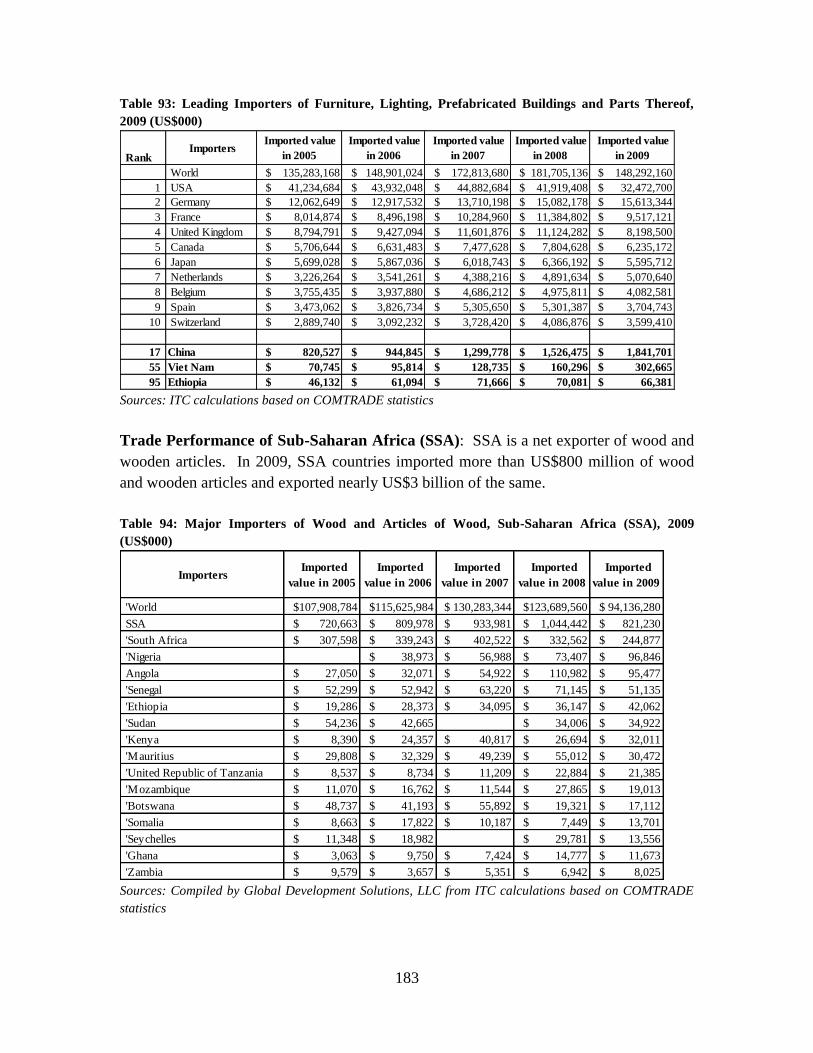
One-third of all furniture traded globally is imported by the United States and Germany
(respectively, 22 percent and 11 percent of world imports in 2009). Developed
economies in Europe, Canada and Japan constitute the rest of the list of ten largest
furniture importers in the world. China imports less than US$2 billion worth of furniture
each year, which is insignificant in relation to both the size of its exports of furniture as
well as its domestic home-furnishings market.78
Vietnam also imports relatively little
furniture in relation to its domestic market size. Ethiopia, by contrast, imported almost
US$70 million of furniture/lighting in 2009, completely overshadowing the level of its
exports in the sector (Table 93).
78
Estimated at US$28 billion in 2010, Bloomberg News, October 25, 2010
183
Table 93: Leading Importers of Furniture, Lighting, Prefabricated Buildings and Parts Thereof,
2009 (US$000)
Rank Importers
Imported value
in 2005
Imported value
in 2006
Imported value
in 2007
Imported value
in 2008
Imported value
in 2009
World $ 135,283,168 $ 148,901,024 $ 172,813,680 $ 181,705,136 $ 148,292,160
1 USA $ 41,234,684 $ 43,932,048 $ 44,882,684 $ 41,919,408 $ 32,472,700
2 Germany $ 12,062,649 $ 12,917,532 $ 13,710,198 $ 15,082,178 $ 15,613,344
3 France $ 8,014,874 $ 8,496,198 $ 10,284,960 $ 11,384,802 $ 9,517,121
4 United Kingdom $ 8,794,791 $ 9,427,094 $ 11,601,876 $ 11,124,282 $ 8,198,500
5 Canada $ 5,706,644 $ 6,631,483 $ 7,477,628 $ 7,804,628 $ 6,235,172
6 Japan $ 5,699,028 $ 5,867,036 $ 6,018,743 $ 6,366,192 $ 5,595,712
7 Netherlands $ 3,226,264 $ 3,541,261 $ 4,388,216 $ 4,891,634 $ 5,070,640
8 Belgium $ 3,755,435 $ 3,937,880 $ 4,686,212 $ 4,975,811 $ 4,082,581
9 Spain $ 3,473,062 $ 3,826,734 $ 5,305,650 $ 5,301,387 $ 3,704,743
10 Switzerland $ 2,889,740 $ 3,092,232 $ 3,728,420 $ 4,086,876 $ 3,599,410
17 China $ 820,527 $ 944,845 $ 1,299,778 $ 1,526,475 $ 1,841,701
55 Viet Nam $ 70,745 $ 95,814 $ 128,735 $ 160,296 $ 302,665
95 Ethiopia $ 46,132 $ 61,094 $ 71,666 $ 70,081 $ 66,381 Sources: ITC calculations based on COMTRADE statistics
Trade Performance of Sub-Saharan Africa (SSA): SSA is a net exporter of wood and
wooden articles. In 2009, SSA countries imported more than US$800 million of wood
and wooden articles and exported nearly US$3 billion of the same.
Table 94: Major Importers of Wood and Articles of Wood, Sub-Saharan Africa (SSA), 2009
(US$000)
Importers Imported
value in 2005
Imported
value in 2006
Imported
value in 2007
Imported
value in 2008
Imported
value in 2009
'World $107,908,784 $115,625,984 $ 130,283,344 $123,689,560 $ 94,136,280
SSA $ 720,663 $ 809,978 $ 933,981 $ 1,044,442 $ 821,230
'South Africa $ 307,598 $ 339,243 $ 402,522 $ 332,562 $ 244,877
'Nigeria $ 38,973 $ 56,988 $ 73,407 $ 96,846
Angola $ 27,050 $ 32,071 $ 54,922 $ 110,982 $ 95,477
'Senegal $ 52,299 $ 52,942 $ 63,220 $ 71,145 $ 51,135
'Ethiopia $ 19,286 $ 28,373 $ 34,095 $ 36,147 $ 42,062
'Sudan $ 54,236 $ 42,665 $ 34,006 $ 34,922
'Kenya $ 8,390 $ 24,357 $ 40,817 $ 26,694 $ 32,011
'Mauritius $ 29,808 $ 32,329 $ 49,239 $ 55,012 $ 30,472
'United Republic of Tanzania $ 8,537 $ 8,734 $ 11,209 $ 22,884 $ 21,385
'Mozambique $ 11,070 $ 16,762 $ 11,544 $ 27,865 $ 19,013
'Botswana $ 48,737 $ 41,193 $ 55,892 $ 19,321 $ 17,112
'Somalia $ 8,663 $ 17,822 $ 10,187 $ 7,449 $ 13,701
'Seychelles $ 11,348 $ 18,982 $ 29,781 $ 13,556
'Ghana $ 3,063 $ 9,750 $ 7,424 $ 14,777 $ 11,673
'Zambia $ 9,579 $ 3,657 $ 5,351 $ 6,942 $ 8,025 Sources: Compiled by Global Development Solutions, LLC from ITC calculations based on COMTRADE
statistics
184
South Africa, with its relatively developed wood processing industry and housing market,
is the largest SSA importer of wood, followed by Nigeria and Angola (Table 94 above).
Most SSA countries import limited amounts and are net exporters of wood.
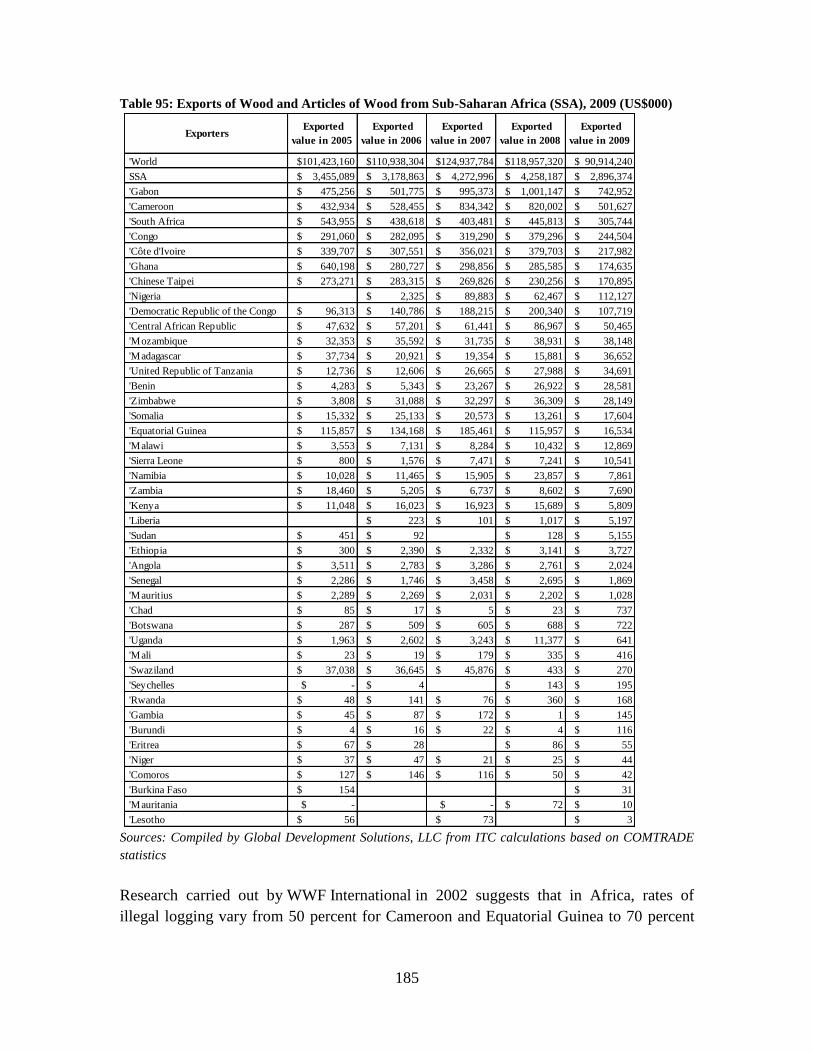
In terms of exports, five countries export 90 percent (US$2 billion) of all wood and
articles of wood from SSA each year: Gabon, Cameroon, South Africa, Congo and Ivory
Coast. Illegal logging is rife in SSA and export figures are generally considered to reflect
only a portion of actual wood exports from the region.
185
Table 95: Exports of Wood and Articles of Wood from Sub-Saharan Africa (SSA), 2009 (US$000)
Exporters Exported
value in 2005
Exported
value in 2006
Exported
value in 2007
Exported
value in 2008
Exported
value in 2009
'World $101,423,160 $110,938,304 $124,937,784 $118,957,320 $ 90,914,240
SSA $ 3,455,089 $ 3,178,863 $ 4,272,996 $ 4,258,187 $ 2,896,374
'Gabon $ 475,256 $ 501,775 $ 995,373 $ 1,001,147 $ 742,952
'Cameroon $ 432,934 $ 528,455 $ 834,342 $ 820,002 $ 501,627
'South Africa $ 543,955 $ 438,618 $ 403,481 $ 445,813 $ 305,744
'Congo $ 291,060 $ 282,095 $ 319,290 $ 379,296 $ 244,504
'Côte d'Ivoire $ 339,707 $ 307,551 $ 356,021 $ 379,703 $ 217,982
'Ghana $ 640,198 $ 280,727 $ 298,856 $ 285,585 $ 174,635
'Chinese Taipei $ 273,271 $ 283,315 $ 269,826 $ 230,256 $ 170,895
'Nigeria $ 2,325 $ 89,883 $ 62,467 $ 112,127
'Democratic Republic of the Congo $ 96,313 $ 140,786 $ 188,215 $ 200,340 $ 107,719
'Central African Republic $ 47,632 $ 57,201 $ 61,441 $ 86,967 $ 50,465
'Mozambique $ 32,353 $ 35,592 $ 31,735 $ 38,931 $ 38,148
'Madagascar $ 37,734 $ 20,921 $ 19,354 $ 15,881 $ 36,652
'United Republic of Tanzania $ 12,736 $ 12,606 $ 26,665 $ 27,988 $ 34,691
'Benin $ 4,283 $ 5,343 $ 23,267 $ 26,922 $ 28,581
'Zimbabwe $ 3,808 $ 31,088 $ 32,297 $ 36,309 $ 28,149
'Somalia $ 15,332 $ 25,133 $ 20,573 $ 13,261 $ 17,604
'Equatorial Guinea $ 115,857 $ 134,168 $ 185,461 $ 115,957 $ 16,534
'Malawi $ 3,553 $ 7,131 $ 8,284 $ 10,432 $ 12,869
'Sierra Leone $ 800 $ 1,576 $ 7,471 $ 7,241 $ 10,541
'Namibia $ 10,028 $ 11,465 $ 15,905 $ 23,857 $ 7,861
'Zambia $ 18,460 $ 5,205 $ 6,737 $ 8,602 $ 7,690
'Kenya $ 11,048 $ 16,023 $ 16,923 $ 15,689 $ 5,809
'Liberia $ 223 $ 101 $ 1,017 $ 5,197
'Sudan $ 451 $ 92 $ 128 $ 5,155
'Ethiopia $ 300 $ 2,390 $ 2,332 $ 3,141 $ 3,727
'Angola $ 3,511 $ 2,783 $ 3,286 $ 2,761 $ 2,024
'Senegal $ 2,286 $ 1,746 $ 3,458 $ 2,695 $ 1,869
'Mauritius $ 2,289 $ 2,269 $ 2,031 $ 2,202 $ 1,028
'Chad $ 85 $ 17 $ 5 $ 23 $ 737
'Botswana $ 287 $ 509 $ 605 $ 688 $ 722
'Uganda $ 1,963 $ 2,602 $ 3,243 $ 11,377 $ 641
'Mali $ 23 $ 19 $ 179 $ 335 $ 416
'Swaziland $ 37,038 $ 36,645 $ 45,876 $ 433 $ 270
'Seychelles $ - $ 4 $ 143 $ 195
'Rwanda $ 48 $ 141 $ 76 $ 360 $ 168
'Gambia $ 45 $ 87 $ 172 $ 1 $ 145
'Burundi $ 4 $ 16 $ 22 $ 4 $ 116
'Eritrea $ 67 $ 28 $ 86 $ 55
'Niger $ 37 $ 47 $ 21 $ 25 $ 44
'Comoros $ 127 $ 146 $ 116 $ 50 $ 42
'Burkina Faso $ 154 $ 31
'Mauritania $ - $ - $ 72 $ 10
'Lesotho $ 56 $ 73 $ 3 Sources: Compiled by Global Development Solutions, LLC from ITC calculations based on COMTRADE
statistics
Research carried out by WWF International in 2002 suggests that in Africa, rates of
illegal logging vary from 50 percent for Cameroon and Equatorial Guinea to 70 percent

186
in Gabon and 80 percent in Liberia.79
What generally is known is that the bulk of exports
from SSA are in the form of rough unprocessed logs (roundwood). Mirror trade data
from Gabon, for example, show that 75 percent (US$550 million) of the officially
recorded exports are in the form of rough wood. Almost 90 percent of Cameroon‘s
officially recorded exports are in the form of rough or sawn wood form.
The most valued forms of wood exports, such as builder‘s joinery and carpentry of wood
(includes doors, windows, flooring, etc.), are done in limited scale in only a few SSA
countries. South Africa, for example, exported US$30 million of builders‘ joinery in
2009 (US$20 million of which are doors and their frames), down from US$80 million in
2005. The next SSA countries to export valuable builder‘s joinery can be found at the
very bottom of the list of exporters: Zimbabwe and Ivory Coast, each with roughly US$2
million of builder‘s joinery exports in 2009.
The inability of SSA countries to add value to their wood resources is further exemplified
by the furniture trade. South Africa alone exports roughly 90 percent of all furniture and
lighting products from SSA (in value terms). All the rest of SSA countries combined
exported US$61 million worth of furniture and related articles of all types; only 0.04
percent of the world exports.
Table 96: Leading SSA Exporters of Furniture, Lighting, Prefabricated Buildings and Parts Thereof,
2009 (US$000)
Exporters Exported
value in 2005
Exported
value in 2006
Exported
value in 2007
Exported
value in 2008
Exported
value in 2009
'World $ 124,214,448 $ 137,889,120 $ 162,352,480 $ 177,069,552 $ 145,963,616
SSA $ 670,836 $ 631,158 $ 719,545 $ 724,320 $ 519,253
'South Africa $ 594,544 $ 539,386 $ 605,587 $ 588,922 $ 457,511
'Nigeria $ 96 $ 925 $ 2,358 $ 8,936
'Kenya $ 15,532 $ 22,646 $ 21,303 $ 21,349 $ 7,341
'Malawi $ 2,554 $ 3,484 $ 1,874 $ 3,121 $ 5,687
'Angola $ 90 $ 88 $ 672 $ 229 $ 5,318
'Mauritius $ 3,293 $ 3,165 $ 3,365 $ 4,031 $ 4,780
'Ghana $ 8,595 $ 14,018 $ 6,305 $ 8,518 $ 3,895
Tanzania $ 876 $ 1,864 $ 2,897 $ 27,381 $ 2,693
'Burkina Faso $ 1,616 $ 2,413
'Mozambique $ 298 $ 1,012 $ 432 $ 6,271 $ 2,272
'Sierra Leone $ 3,576 $ 2,711 $ 2,902 $ 1,400 $ 2,104
'Cameroon $ 968 $ 502 $ 1,562 $ 2,120 $ 2,092
'Zambia $ 210 $ 709 $ 20,206 $ 631 $ 1,992
'Senegal $ 1,485 $ 1,985 $ 3,272 $ 2,791 $ 1,904
'Botswana $ 2,403 $ 2,447 $ 3,256 $ 1,333 $ 1,814
'Côte d'Ivoire $ 8,354 $ 5,496 $ 8,045 $ 2,432 $ 1,808
'Rwanda $ 97 $ 9 $ 50 $ 421 $ 1,799
'Ethiopia $ 453 $ 137 $ 1,296 $ 2,333 $ 1,528
79
The Timber Footprint of G8 and China, WWF International, 2002.
187
Sources: Compiled by Global Development Solutions, LLC from ITC calculations based on COMTRADE
statistics
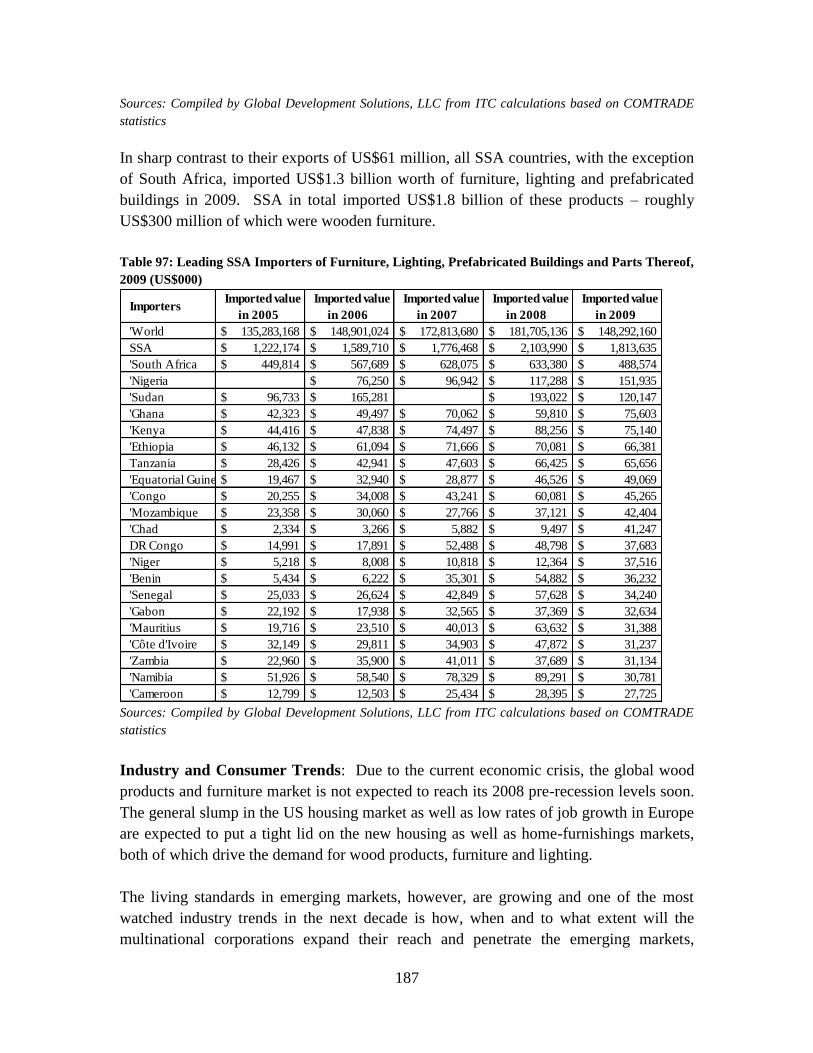
In sharp contrast to their exports of US$61 million, all SSA countries, with the exception
of South Africa, imported US$1.3 billion worth of furniture, lighting and prefabricated
buildings in 2009. SSA in total imported US$1.8 billion of these products – roughly
US$300 million of which were wooden furniture.
Table 97: Leading SSA Importers of Furniture, Lighting, Prefabricated Buildings and Parts Thereof,
2009 (US$000)
Importers Imported value
in 2005
Imported value
in 2006
Imported value
in 2007
Imported value
in 2008
Imported value
in 2009
'World $ 135,283,168 $ 148,901,024 $ 172,813,680 $ 181,705,136 $ 148,292,160
SSA $ 1,222,174 $ 1,589,710 $ 1,776,468 $ 2,103,990 $ 1,813,635
'South Africa $ 449,814 $ 567,689 $ 628,075 $ 633,380 $ 488,574
'Nigeria $ 76,250 $ 96,942 $ 117,288 $ 151,935
'Sudan $ 96,733 $ 165,281 $ 193,022 $ 120,147
'Ghana $ 42,323 $ 49,497 $ 70,062 $ 59,810 $ 75,603
'Kenya $ 44,416 $ 47,838 $ 74,497 $ 88,256 $ 75,140
'Ethiopia $ 46,132 $ 61,094 $ 71,666 $ 70,081 $ 66,381
Tanzania $ 28,426 $ 42,941 $ 47,603 $ 66,425 $ 65,656
'Equatorial Guinea $ 19,467 $ 32,940 $ 28,877 $ 46,526 $ 49,069
'Congo $ 20,255 $ 34,008 $ 43,241 $ 60,081 $ 45,265
'Mozambique $ 23,358 $ 30,060 $ 27,766 $ 37,121 $ 42,404
'Chad $ 2,334 $ 3,266 $ 5,882 $ 9,497 $ 41,247
DR Congo $ 14,991 $ 17,891 $ 52,488 $ 48,798 $ 37,683
'Niger $ 5,218 $ 8,008 $ 10,818 $ 12,364 $ 37,516
'Benin $ 5,434 $ 6,222 $ 35,301 $ 54,882 $ 36,232
'Senegal $ 25,033 $ 26,624 $ 42,849 $ 57,628 $ 34,240
'Gabon $ 22,192 $ 17,938 $ 32,565 $ 37,369 $ 32,634
'Mauritius $ 19,716 $ 23,510 $ 40,013 $ 63,632 $ 31,388
'Côte d'Ivoire $ 32,149 $ 29,811 $ 34,903 $ 47,872 $ 31,237
'Zambia $ 22,960 $ 35,900 $ 41,011 $ 37,689 $ 31,134
'Namibia $ 51,926 $ 58,540 $ 78,329 $ 89,291 $ 30,781
'Cameroon $ 12,799 $ 12,503 $ 25,434 $ 28,395 $ 27,725 Sources: Compiled by Global Development Solutions, LLC from ITC calculations based on COMTRADE
statistics
Industry and Consumer Trends: Due to the current economic crisis, the global wood
products and furniture market is not expected to reach its 2008 pre-recession levels soon.
The general slump in the US housing market as well as low rates of job growth in Europe
are expected to put a tight lid on the new housing as well as home-furnishings markets,
both of which drive the demand for wood products, furniture and lighting.
The living standards in emerging markets, however, are growing and one of the most
watched industry trends in the next decade is how, when and to what extent will the
multinational corporations expand their reach and penetrate the emerging markets,
188
especially in China, Russia, and India. China‘s home-furnishings market, for example, is
estimated at US$28 billion in 2010 and is growing with the prosperity of its workforce
and attracting major investments by multinationals. Ikea, for example, plans to more than
double the number of its outlets in China to 18 by 2015, thus making a total investment of
nearly US$1.5 billion in the country. Investment by Ikea and other retailers in Russia,
India, Brazil, etc., also are increasing.
The wood/furniture industry also is seeing significant trends in the direction of:
Increased awareness among consumers on issues related to sustainable forestry,
chain of custody and other good forest-to-furniture industry practices; and
Increased regulatory interventions in the EU and North America, especially in the
direction of laws for elimination of formaldehyde in wood products and laws
against illegal exploitation of wood.
The last point warrants further explanation as it relates indirectly to Sub-Saharan Africa
and its timber exports. The Lacey Act, which stipulates that wood products in the USA
must have certification showing they are legal, came into effect in April 2010 in the USA.
Unlike previous related legislation, this statute is fact-based rather than document-based.
If a product imported into the US turns out be of illegal (logging) origin, this fact will
override any statement or document to the contrary. In addition, under the EU Due
Diligence Regulation, which will be mandatory from January 2012, everyone selling
timber to the EU will have to use a ‗checking‘ system to ensure that wood is not illegal.
As a result of these developments, many furniture and wood processing firms throughout
the world are increasingly implementing chain of custody supply chain management
policies to avoid sanctions and safeguard their prestige. In Vietnam, for example, almost
200 wood processing firms use chain of custody management practice. Chain of custody
is being used increasingly more in China although precise figures are not available.
The chain of custody measures implemented by wood processing firms globally are
anticipated to affect negatively Sub-Saharan Africa (SSA). SSA is a big supplier of
tropical timber to wood processing firms worldwide, but the region is known and
suspected to have high rates of illegal logging. The region‘s ability to maintain its
exports of timber is most likely to be challenged by the recent regulations in the main
consumer markets in the EU and USA. The degree to which SSA exports will be
challenged by recent regulations in the USA and EU currently is not known. What is
known is that, notwithstanding the regulations, identification of illegally logged or traded
wood is technically difficult. In this respect, in the short-term, recent regulations are
likely to adversely impact (depress) prices of wood coming from SSA more than the
actual volume of wood coming from SSA.
189
V.4. Comparative Sector Profiles: Wood Products Sector
Key Indicators: Similar to most other sectors, China‘s presence in the furniture industry
has grown significantly over the last decade. Chinese furniture exports increased by 335
percent from 1994 to 2001, and by 545 percent from 2001 to 2009 when the total export
value of furniture reached US$25.6 billion. According to the official Chinese Bureau of
Statistics, the wood processing and furniture industry employed roughly 1.3 million
people in almost 11,000 firms in 2008. This statistic, however, covers only a certain size
of firms (those with reported revenues of RMB5 million), which leaves many small and
medium firms out of the official statistics. According to some estimates, the furniture
industry alone employs over 5 million people. Approximately 30 percent of the total
shipments and 50 percent of the export of furniture are from one south China province:
Guangdong.
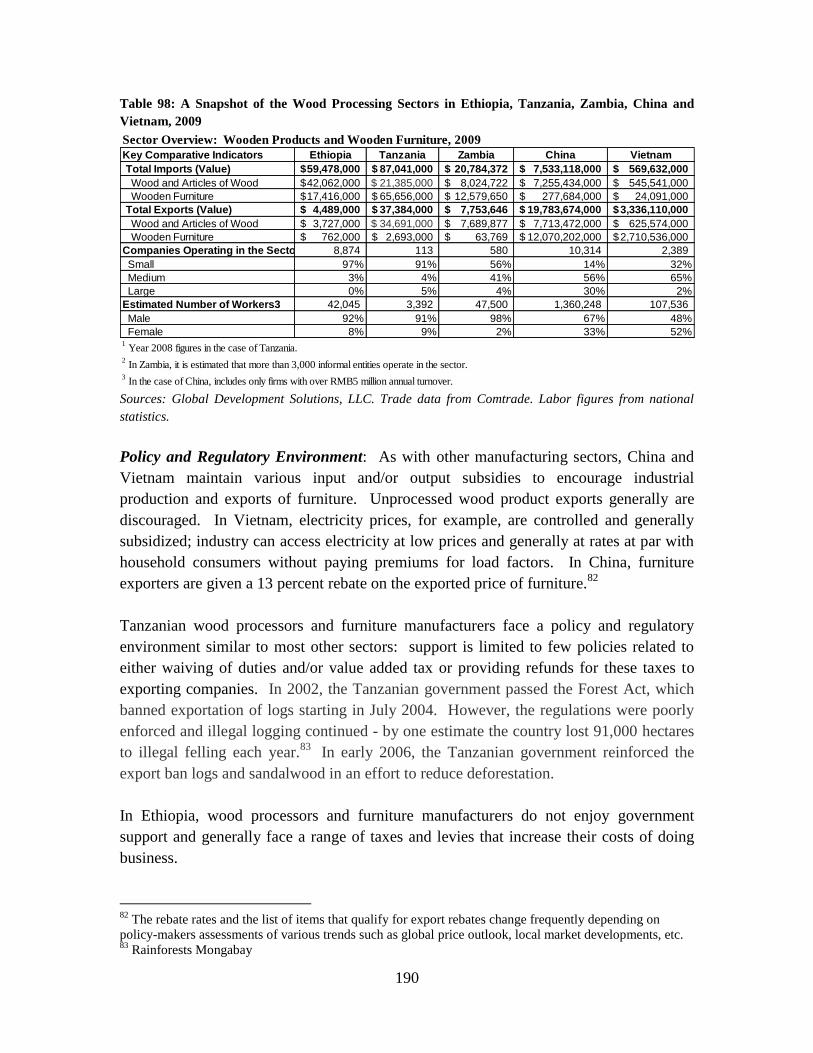
In Ethiopia, roughly 9,000 firms employing 42,000 people operate in the wooden
products and furniture sector. The vast majority of firms in the sector are small and most
workers in the industry are male. The situation is almost identical in Tanzania: roughly
90 percent of the workers in the sector are male and work in small firms.80
In Zambia, a
higher percentage of the more than 47,000 workers are male (approximately 98 percent)
and a higher percentage of the firms are of medium size (41 percent) (Table 98).81
In
Vietnam and China, there is a mix of enterprises in terms of their size. Since the official
Chinese statistics do not capture enterprises with turnover less than RMB5 million, the
share of small firms in the industry is most probably much higher than the 14 percent
reported by the official statistics.
80
Data for Tanzania does not include micro/small enterprises employing less than 10 people. Data for such
firms, such as small workshops, repair shops, etc, are not available – an estimated 95 percent of all
manufacturing firms belong in this unregistered category of firms. 81
As is the case with Tanzania, Zambia has a significant informal sector and it is not known how much
these unregistered companies are accounted for in the statistics.
190
Table 98: A Snapshot of the Wood Processing Sectors in Ethiopia, Tanzania, Zambia, China and
Vietnam, 2009
Sector Overview: Wooden Products and Wooden Furniture, 2009
Key Comparative Indicators Ethiopia Tanzania Zambia China Vietnam
Total Imports (Value) 59,478,000$ 87,041,000$ 20,784,372$ 7,533,118,000$ 569,632,000$
Wood and Articles of Wood 42,062,000$ $ 21,385,000 8,024,722$ 7,255,434,000$ 545,541,000$
Wooden Furniture 17,416,000$ 65,656,000$ 12,579,650$ 277,684,000$ 24,091,000$
Total Exports (Value) 4,489,000$ 37,384,000$ 7,753,646$ 19,783,674,000$ 3,336,110,000$
Wood and Articles of Wood 3,727,000$ $ 34,691,000 7,689,877$ 7,713,472,000$ 625,574,000$
Wooden Furniture 762,000$ 2,693,000$ 63,769$ 12,070,202,000$ 2,710,536,000$
Companies Operating in the Sector1,2,3 8,874 113 580 10,314 2,389
Small 97% 91% 56% 14% 32%
Medium 3% 4% 41% 56% 65%
Large 0% 5% 4% 30% 2%
Estimated Number of Workers3 42,045 3,392 47,500 1,360,248 107,536
Male 92% 91% 98% 67% 48%
Female 8% 9% 2% 33% 52%1 Year 2008 figures in the case of Tanzania.
2 In Zambia, it is estimated that more than 3,000 informal entities operate in the sector.
3 In the case of China, includes only firms with over RMB5 million annual turnover.
Sources: Global Development Solutions, LLC. Trade data from Comtrade. Labor figures from national
statistics.
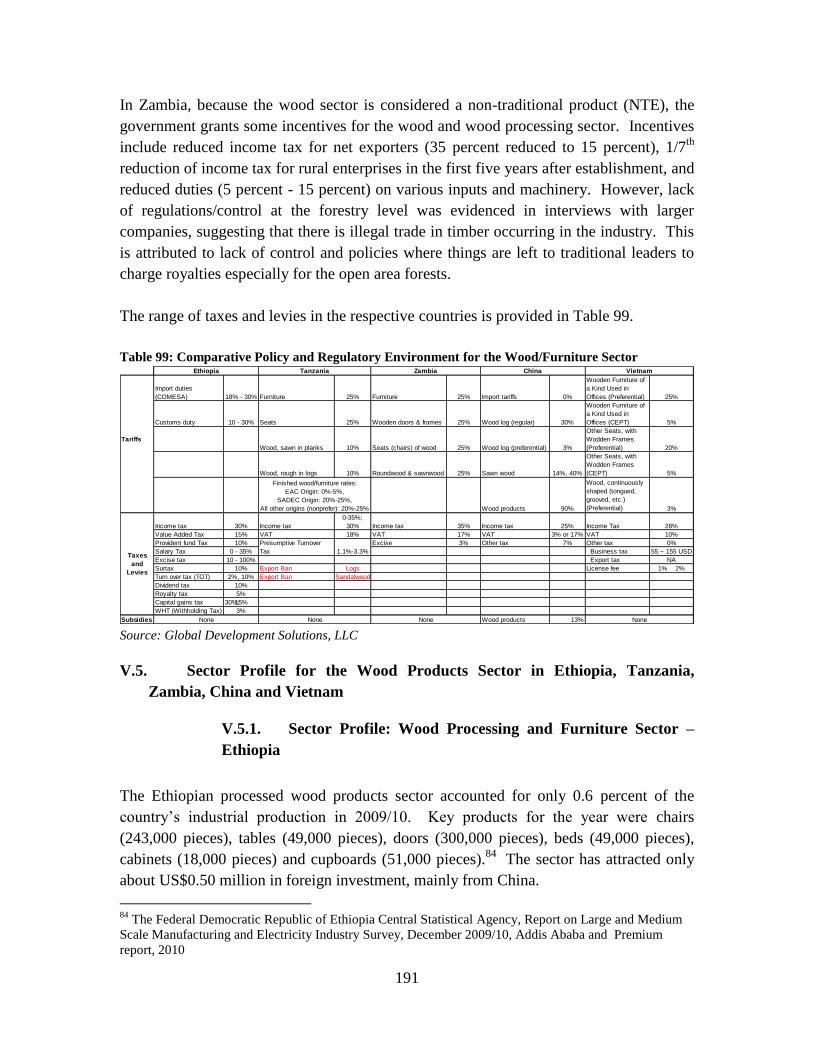
Policy and Regulatory Environment: As with other manufacturing sectors, China and
Vietnam maintain various input and/or output subsidies to encourage industrial
production and exports of furniture. Unprocessed wood product exports generally are
discouraged. In Vietnam, electricity prices, for example, are controlled and generally
subsidized; industry can access electricity at low prices and generally at rates at par with
household consumers without paying premiums for load factors. In China, furniture
exporters are given a 13 percent rebate on the exported price of furniture.82
Tanzanian wood processors and furniture manufacturers face a policy and regulatory
environment similar to most other sectors: support is limited to few policies related to
either waiving of duties and/or value added tax or providing refunds for these taxes to
exporting companies. In 2002, the Tanzanian government passed the Forest Act, which
banned exportation of logs starting in July 2004. However, the regulations were poorly
enforced and illegal logging continued - by one estimate the country lost 91,000 hectares
to illegal felling each year.83
In early 2006, the Tanzanian government reinforced the
export ban logs and sandalwood in an effort to reduce deforestation.
In Ethiopia, wood processors and furniture manufacturers do not enjoy government
support and generally face a range of taxes and levies that increase their costs of doing
business.
82
The rebate rates and the list of items that qualify for export rebates change frequently depending on
policy-makers assessments of various trends such as global price outlook, local market developments, etc. 83
Rainforests Mongabay
191
In Zambia, because the wood sector is considered a non-traditional product (NTE), the
government grants some incentives for the wood and wood processing sector. Incentives
include reduced income tax for net exporters (35 percent reduced to 15 percent), 1/7th
reduction of income tax for rural enterprises in the first five years after establishment, and
reduced duties (5 percent - 15 percent) on various inputs and machinery. However, lack
of regulations/control at the forestry level was evidenced in interviews with larger
companies, suggesting that there is illegal trade in timber occurring in the industry. This
is attributed to lack of control and policies where things are left to traditional leaders to
charge royalties especially for the open area forests.
The range of taxes and levies in the respective countries is provided in Table 99.
Table 99: Comparative Policy and Regulatory Environment for the Wood/Furniture Sector
Import duties
(COMESA) 18% - 30% Furniture 25% Furniture 25% Import tariffs 0%
Wooden Furniture of
a Kind Used in
Offices (Preferential) 25%
Customs duty 10 - 30% Seats 25% Wooden doors & frames 25% Wood log (regular) 30%
Wooden Furniture of
a Kind Used in
Offices (CEPT) 5%
Tariffs
Wood, sawn in planks 10% Seats (chairs) of wood 25% Wood log (preferential) 3%
Other Seats, with
Wodden Frames
(Preferential) 20%
Wood, rough in logs 10% Roundwood & sawnwood 25% Sawn wood 14%, 40%
Other Seats, with
Wodden Frames
(CEPT) 5%
Wood products 90%
Wood, continuously
shaped (tongued,
grooved, etc.)
(Preferential) 3%
Income tax 30% Income tax
0-35%;
30% Income tax 35% Income tax 25% Income Tax 28%
Value Added Tax 15% VAT 18% VAT 17% VAT 3% or 17% VAT 10%
Provident fund Tax 10% Excise 3% Other tax 7% Other tax 0%
Salary Tax 0 - 35% Business tax 55 ~ 155 USD
Excise tax 10 - 100% Export tax NA
Surtax 10% Export Ban Logs License fee 1% 2%
Turn over tax (TOT) 2%, 10% Export Ban Sandalwood
Dividend tax 10%
Royalty tax 5%
Capital gains tax 30%;15%
WHT (Withholding Tax) 3%
Subsidies Wood products 13%
China Vietnam
NoneNoneNone
ZambiaEthiopia Tanzania
Finished wood/furniture rates:
EAC Origin: 0%-5%,
SADEC Origin: 20%-25%,
All other origins (nonprefer): 20%-25%
None
Presumptive Turnover
Tax 1.1%-3.3%Taxes
and
Levies
Source: Global Development Solutions, LLC
V.5. Sector Profile for the Wood Products Sector in Ethiopia, Tanzania,
Zambia, China and Vietnam
V.5.1. Sector Profile: Wood Processing and Furniture Sector –
Ethiopia
The Ethiopian processed wood products sector accounted for only 0.6 percent of the
country‘s industrial production in 2009/10. Key products for the year were chairs
(243,000 pieces), tables (49,000 pieces), doors (300,000 pieces), beds (49,000 pieces),
cabinets (18,000 pieces) and cupboards (51,000 pieces).84
The sector has attracted only
about US$0.50 million in foreign investment, mainly from China.
84
The Federal Democratic Republic of Ethiopia Central Statistical Agency, Report on Large and Medium
Scale Manufacturing and Electricity Industry Survey, December 2009/10, Addis Ababa and Premium
report, 2010
192
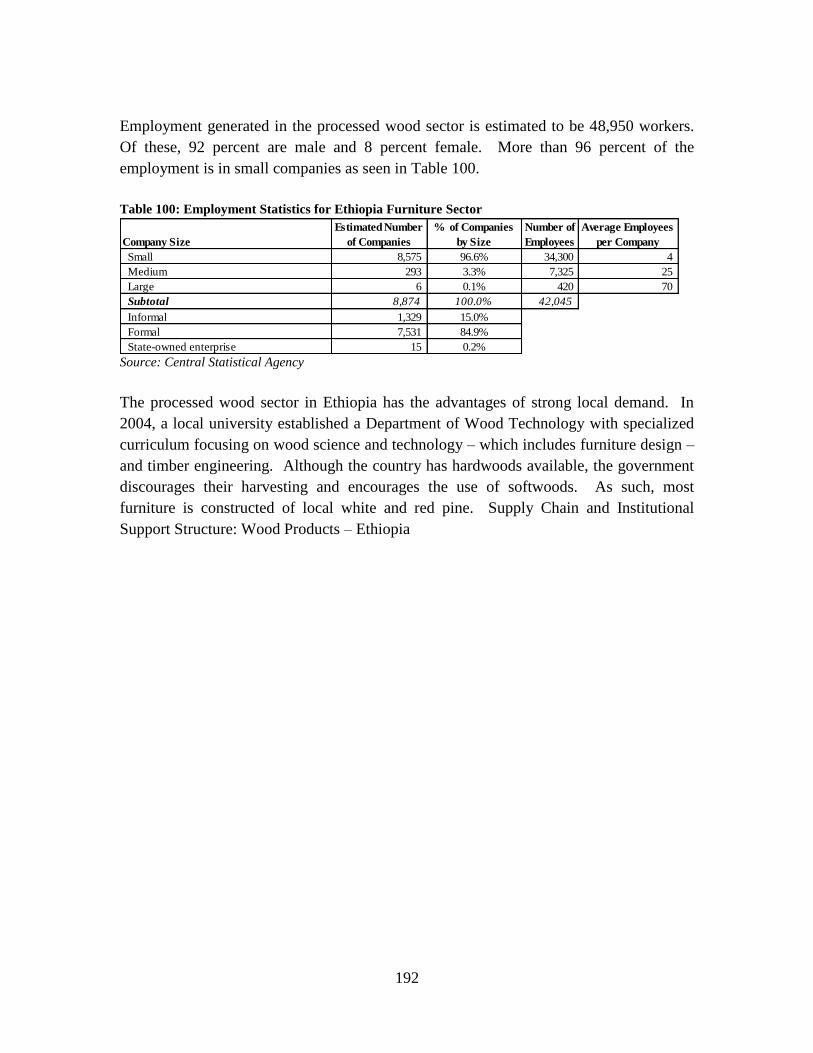
Employment generated in the processed wood sector is estimated to be 48,950 workers.
Of these, 92 percent are male and 8 percent female. More than 96 percent of the
employment is in small companies as seen in Table 100.
Table 100: Employment Statistics for Ethiopia Furniture Sector
Company Size
Estimated Number
of Companies
% of Companies
by Size
Number of
Employees
Average Employees
per Company
Small 8,575 96.6% 34,300 4
Medium 293 3.3% 7,325 25
Large 6 0.1% 420 70
Subtotal 8,874 100.0% 42,045
Informal 1,329 15.0%
Formal 7,531 84.9%
State-owned enterprise 15 0.2% Source: Central Statistical Agency
The processed wood sector in Ethiopia has the advantages of strong local demand. In
2004, a local university established a Department of Wood Technology with specialized
curriculum focusing on wood science and technology – which includes furniture design –
and timber engineering. Although the country has hardwoods available, the government
discourages their harvesting and encourages the use of softwoods. As such, most
furniture is constructed of local white and red pine. Supply Chain and Institutional
Support Structure: Wood Products – Ethiopia
193
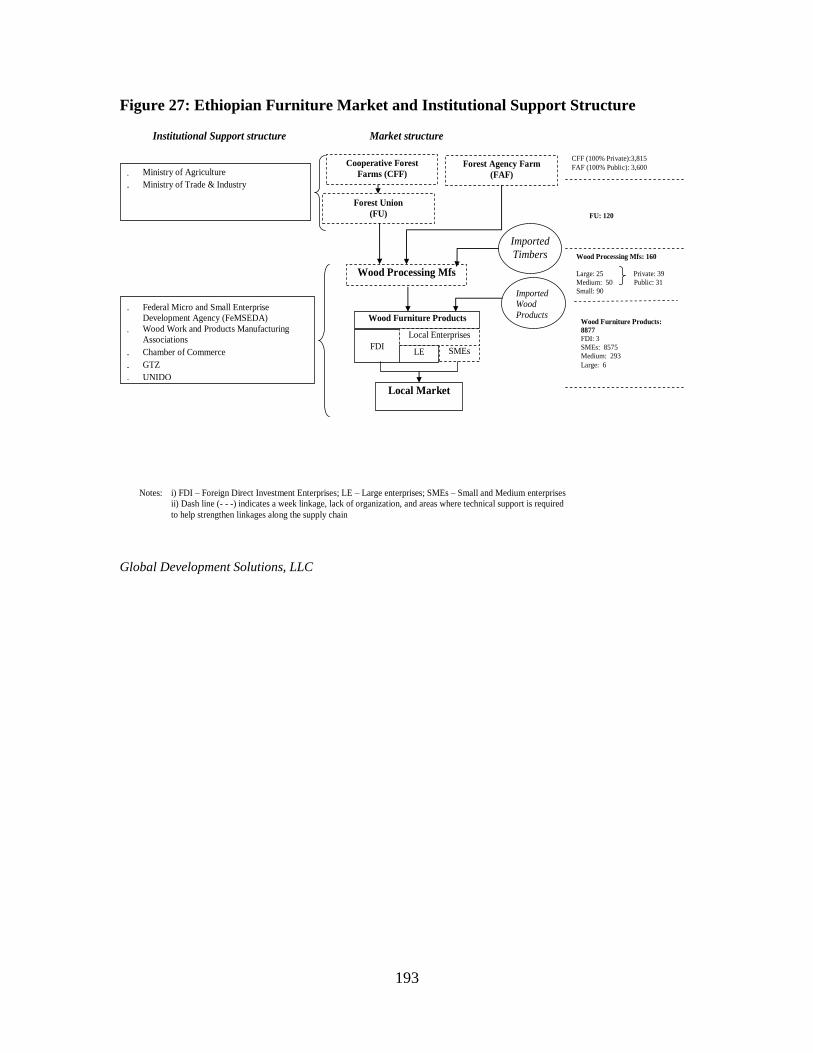
Figure 27: Ethiopian Furniture Market and Institutional Support Structure Ethiopian Furniture Market and Institutional Support Structure
Market structure Institutional Support structure
Cooperative Forest Farms (CFF)
- Ministry of Agriculture
- Ministry of Trade & Industry
Wood Processing Mfs
Imported
Timbers
Wood Furniture Products
FDI LE SMEs
Local Market
- Federal Micro and Small Enterprise
Development Agency (FeMSEDA) - Wood Work and Products Manufacturing
Associations
- Chamber of Commerce
- GTZ
- UNIDO
Notes: i) FDI – Foreign Direct Investment Enterprises; LE – Large enterprises; SMEs – Small and Medium enterprises
ii) Dash line (- - -) indicates a week linkage, lack of organization, and areas where technical support is required
to help strengthen linkages along the supply chain
Local Enterprises
CFF (100% Private):3,815
FAF (100% Public): 3,600
Wood Furniture Products:
8877
FDI: 3
SMEs: 8575
Medium: 293
Large: 6
Forest Agency Farm
(FAF)
Forest Union
(FU)
Imported
Wood
Products
FU: 120
Wood Processing Mfs: 160
Large: 25 Private: 39
Medium: 50 Public: 31
Small: 90
Global Development Solutions, LLC
194
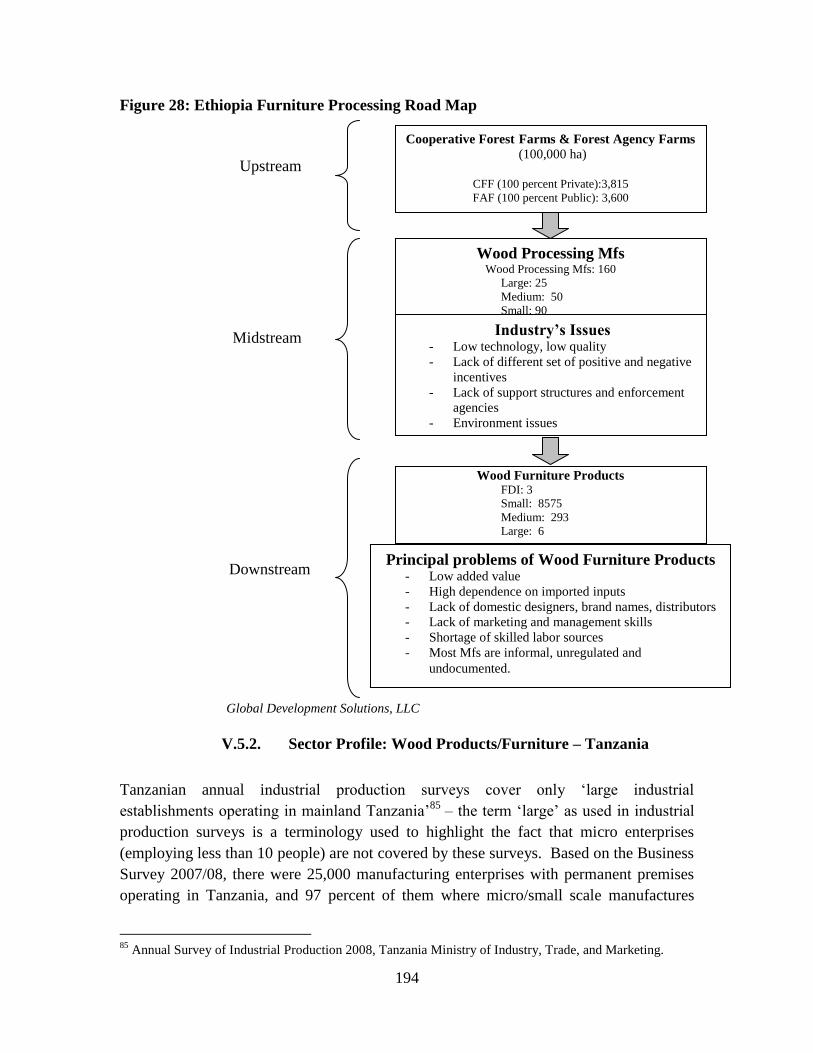
Figure 28: Ethiopia Furniture Processing Road Map
Global Development Solutions, LLC
V.5.2. Sector Profile: Wood Products/Furniture – Tanzania
Tanzanian annual industrial production surveys cover only ‗large industrial
establishments operating in mainland Tanzania‘85
– the term ‗large‘ as used in industrial
production surveys is a terminology used to highlight the fact that micro enterprises
(employing less than 10 people) are not covered by these surveys. Based on the Business
Survey 2007/08, there were 25,000 manufacturing enterprises with permanent premises
operating in Tanzania, and 97 percent of them where micro/small scale manufactures
85
Annual Survey of Industrial Production 2008, Tanzania Ministry of Industry, Trade, and Marketing.
Cooperative Forest Farms & Forest Agency Farms (100,000 ha)
CFF (100 percent Private):3,815
FAF (100 percent Public): 3,600
Wood Processing Mfs Wood Processing Mfs: 160
Large: 25
Medium: 50
Small: 90
Industry’s Issues - Low technology, low quality
- Lack of different set of positive and negative
incentives
- Lack of support structures and enforcement
agencies
- Environment issues
Wood Furniture Products FDI: 3
Small: 8575
Medium: 293
Large: 6
Upstream
Downstream Principal problems of Wood Furniture Products
- Low added value
- High dependence on imported inputs
- Lack of domestic designers, brand names, distributors
- Lack of marketing and management skills
- Shortage of skilled labor sources
- Most Mfs are informal, unregulated and
undocumented.
Midstream
195
with less than 10 workers. 86
Virtually no official data is kept on micro/small scale
manufacturing enterprises, as such this sector profile covers only firms employing 10 or
more people, officially recorded as ‗industrial enterprises/manufacturing establishments‘
under national statistics.
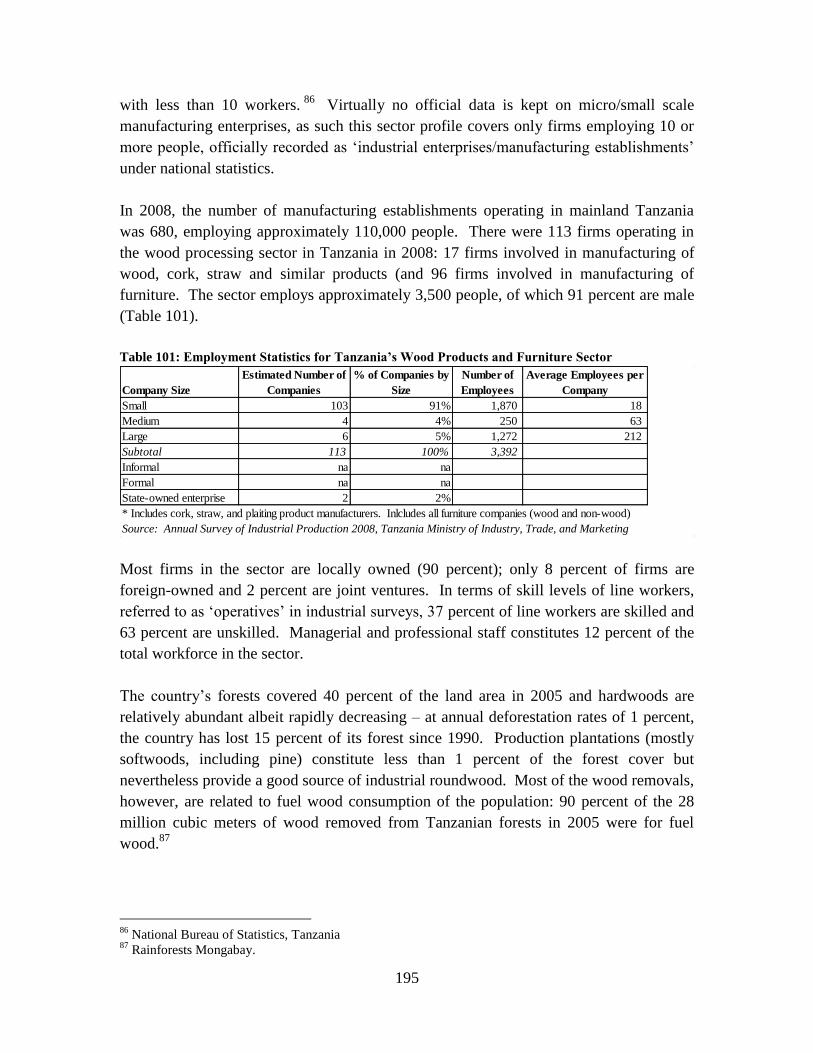
In 2008, the number of manufacturing establishments operating in mainland Tanzania
was 680, employing approximately 110,000 people. There were 113 firms operating in
the wood processing sector in Tanzania in 2008: 17 firms involved in manufacturing of
wood, cork, straw and similar products (and 96 firms involved in manufacturing of
furniture. The sector employs approximately 3,500 people, of which 91 percent are male
(Table 101).
Table 101: Employment Statistics for Tanzania’s Wood Products and Furniture Sector
Company Size
Estimated Number of
Companies
% of Companies by
Size
Number of
Employees
Average Employees per
Company
Small 103 91% 1,870 18
Medium 4 4% 250 63
Large 6 5% 1,272 212
Subtotal 113 100% 3,392
Informal na na
Formal na na
State-owned enterprise 2 2%
* Includes cork, straw, and plaiting product manufacturers. Inlcludes all furniture companies (wood and non-wood)
Source: Annual Survey of Industrial Production 2008, Tanzania Ministry of Industry, Trade, and Marketing
Most firms in the sector are locally owned (90 percent); only 8 percent of firms are
foreign-owned and 2 percent are joint ventures. In terms of skill levels of line workers,
referred to as ‗operatives‘ in industrial surveys, 37 percent of line workers are skilled and
63 percent are unskilled. Managerial and professional staff constitutes 12 percent of the
total workforce in the sector.
The country‘s forests covered 40 percent of the land area in 2005 and hardwoods are
relatively abundant albeit rapidly decreasing – at annual deforestation rates of 1 percent,
the country has lost 15 percent of its forest since 1990. Production plantations (mostly
softwoods, including pine) constitute less than 1 percent of the forest cover but
nevertheless provide a good source of industrial roundwood. Most of the wood removals,
however, are related to fuel wood consumption of the population: 90 percent of the 28
million cubic meters of wood removed from Tanzanian forests in 2005 were for fuel
wood.87
86
National Bureau of Statistics, Tanzania 87
Rainforests Mongabay.
196
According to local experts, even though precise figures are not known, the bulk of
industrial roundwood consumption of softwoods is destined for the construction industry.
The furniture sector consumes very limited quantities of mostly hard industrial
roundwood. Softwood applications for joinery (doors, windows, etc), seats (chairs) or
furniture are not popular among Tanzanian consumers – most wood-based products
manufactured in Tanzania are from hardwoods.
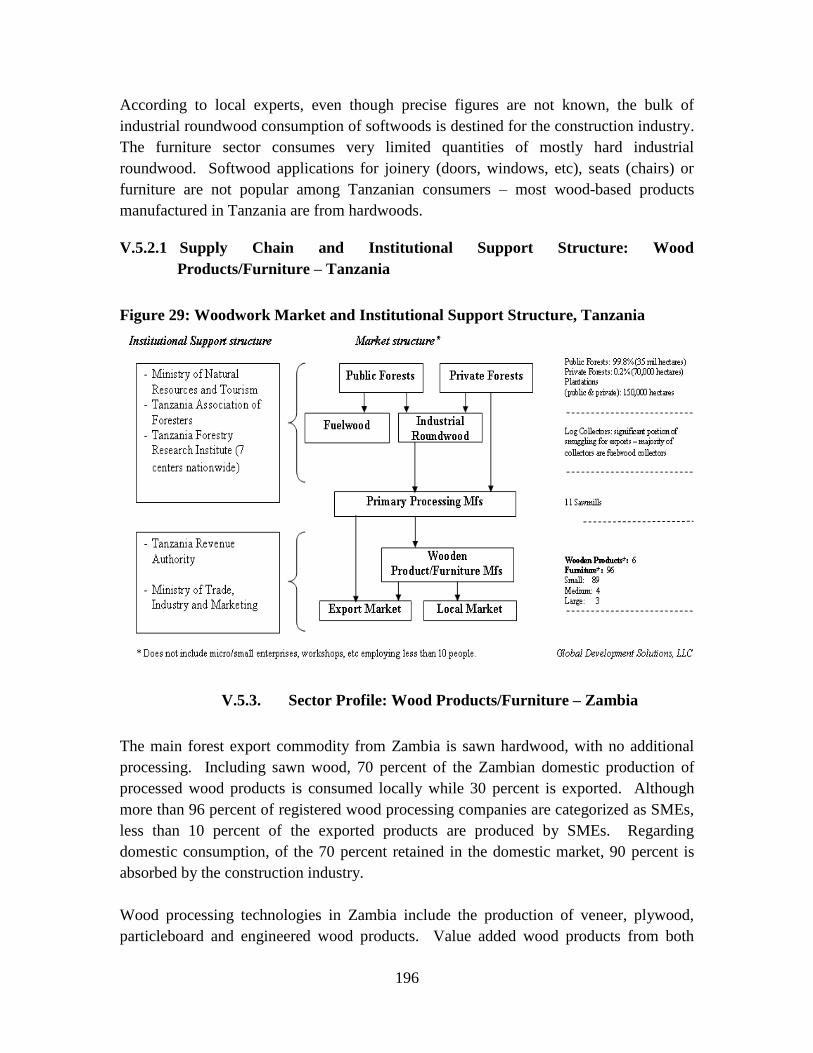
V.5.2.1 Supply Chain and Institutional Support Structure: Wood
Products/Furniture – Tanzania
Figure 29: Woodwork Market and Institutional Support Structure, Tanzania
V.5.3. Sector Profile: Wood Products/Furniture – Zambia
The main forest export commodity from Zambia is sawn hardwood, with no additional
processing. Including sawn wood, 70 percent of the Zambian domestic production of
processed wood products is consumed locally while 30 percent is exported. Although
more than 96 percent of registered wood processing companies are categorized as SMEs,
less than 10 percent of the exported products are produced by SMEs. Regarding
domestic consumption, of the 70 percent retained in the domestic market, 90 percent is
absorbed by the construction industry.
Wood processing technologies in Zambia include the production of veneer, plywood,
particleboard and engineered wood products. Value added wood products from both
197
softwood and hardwoods are produced within Zambia. However, the wood processing
industry overall is typified by small and informal companies (more than 3,000 informal
companies, 588 SMEs and only 22 large firms).
Table 102: Company and Employment Statistics for Zambian Wood Processing Sector
All Wood Processing
Firms (Incl. sawmills,
furniture, joinery, etc)
% of
Companies
by Size
% of Wooden
Furniture (Doors/
Chairs) Manufacturers
Wooden Furniture
(Doors/ Chairs)
Manufacturers
Company Size
Small 322 56% 50.0% 166
Medium 236 41% 9.0% 20
Large 22 4% 45.0% 7
Subtotal 580 100% 193
Informal > 3,000
Formal 580
State-owned enterprise 1 1 1
Est. no. workers employed in the sector 47,500
% Male 98%
% Female 2% Source: Zambia Forestry and Forest Industrial Corporation (ZAFFICO)
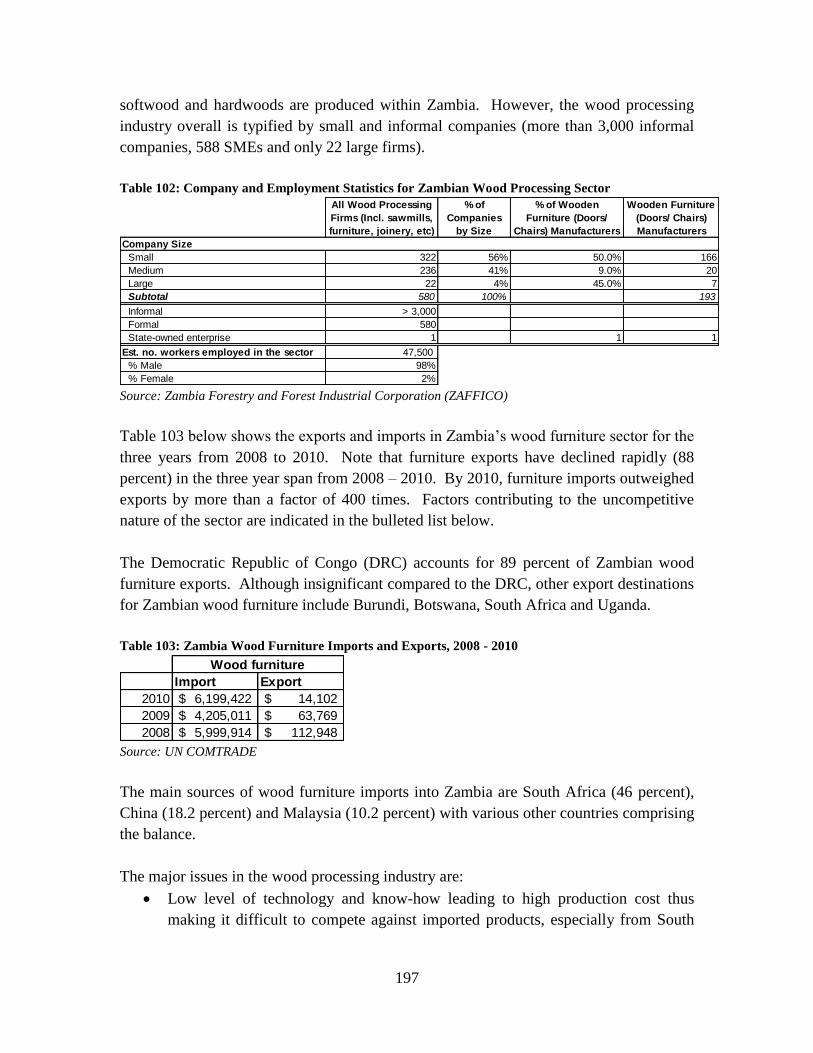
Table 103 below shows the exports and imports in Zambia‘s wood furniture sector for the
three years from 2008 to 2010. Note that furniture exports have declined rapidly (88
percent) in the three year span from 2008 – 2010. By 2010, furniture imports outweighed
exports by more than a factor of 400 times. Factors contributing to the uncompetitive
nature of the sector are indicated in the bulleted list below.
The Democratic Republic of Congo (DRC) accounts for 89 percent of Zambian wood
furniture exports. Although insignificant compared to the DRC, other export destinations
for Zambian wood furniture include Burundi, Botswana, South Africa and Uganda.
Table 103: Zambia Wood Furniture Imports and Exports, 2008 - 2010
Import Export
2010 6,199,422$ 14,102$
2009 4,205,011$ 63,769$
2008 5,999,914$ 112,948$
Wood furniture
Source: UN COMTRADE
The main sources of wood furniture imports into Zambia are South Africa (46 percent),
China (18.2 percent) and Malaysia (10.2 percent) with various other countries comprising
the balance.
The major issues in the wood processing industry are:
Low level of technology and know-how leading to high production cost thus
making it difficult to compete against imported products, especially from South
198
Africa and China. The lack of technical know-how to design and develop new
products further compounds this problem.
Difficulty in accessing finance and interest rates of more than 30 percent make it
difficult for small businesses to grow.
A large, informal wood processing sector (more than 3,000 entities) undermines
the competitiveness of larger, formal firms. The informal sector generally evades
taxes and fees and is said to have access to illegally obtained wood. The major
taxes paid by formally registered companies include income tax at 35 percent and
VAT at 16.5 percent.
The high price of accessing timber is passed through the value chain:
o Cutting trees from managed forests: in addition to the ZMK1,200,000/m3
(US$240/m3) price for purchasing roundwood, those engaging in cutting
trees from land controlled by Zambia Forest and Forestry Industries
Corporation (ZAFFICO), are required to pay ZAFFICO a commitment fee
of ZMK200,000 (US$42.60). The commitment has a 200 tree/month
requirement, as regulated by ZAFFICO (paid in full even if less than 200
trees are felled per month, yet trees cut exceeding 200 are billed in the
following month). Maximum allowable trees cut per month before
incurring a penalty is 600. For those trees cut in excess of 600, ZAFFICO
doubles the fees to the responsible company.
o Cutting trees from open areas: royalty fees ranging from ZMK400,000 to
ZMK500,000 (US$85 – US$106.40) for a cutting period of three to four
months.88
Poor primary processing technology leads to low recovery rates and these costs
also are passed through the value chain.
Poor road infrastructure, combined with inefficient trucks that are barely
roadworthy and operated illegally, drive up the costs of transporting round wood
to saw mills. The estimated average cost of transporting timber is US$340 per
20-ton load over a distance not exceeding 40 kilometers. This equates to
US$0.43/km-ton.
Lack of regulations/control at the forestry level was evidenced by interviews with
larger companies, suggesting that there is illegal trade in timber occurring in the
industry. The companies claim those in the informal sector cut trees illegally and
transport them at night. This is attributed to lack of control and policies where
things are left to tribal chiefs to charge royalties especially for the open area
forests.
88
The royalty fees are for the trees in open areas which mostly are managed by the custodians of traditional
land: the chiefs. Different chiefs charge different amounts based on the type of trees and proximity to the
markets. Fees usually are agreed based on the period of cutting rather than tonnage or area to be cut.
199
Impact of Informal Sector on Zambian Processed Wood Market
With an estimated 3,000 plus entities, the informal sector has a noticeable impact on the Zambian
processed wood sector. As an example, the informal sector sells finished chairs for a price
approximately 2.5 – 3 times lower than those produced in the formal sector. By nature of the fact that
the companies are not registered, they keep overheads to a minimum by avoiding licensing fees and
taxes. Informal sector participants – as well as many smaller enterprises as well, regardless of
registration status – also tend to use manual, non-electric hand tools thus 1) reducing maintenance
costs, 2) reducing electricity consumption, and 3) requiring less capital investment. Although the
difference in product design, workmanship and finishing between informal and formal producers is not
comparable, considering consumer purchasing power, the typical Tanzanian household will purchase
the much lower priced chair. With such price sensitivity, larger firms in the formal sector cannot
compete against the informal sector on a mass market scale. For this reason, virtually none of the
formal sector enterprises produce standard runs of non-upholstered wooden chairs. Instead, these
companies wait for an order for chairs before they produce. Designs are specific to customers‘
requests and batches can run from a few pieces to several hundred. There is no typical scenario. By
contrast, informal companies produce wooden pine chairs on a regular basis and display and sell the
chairs by the roadside of the nearest heavily traveled artery to their respective shops.
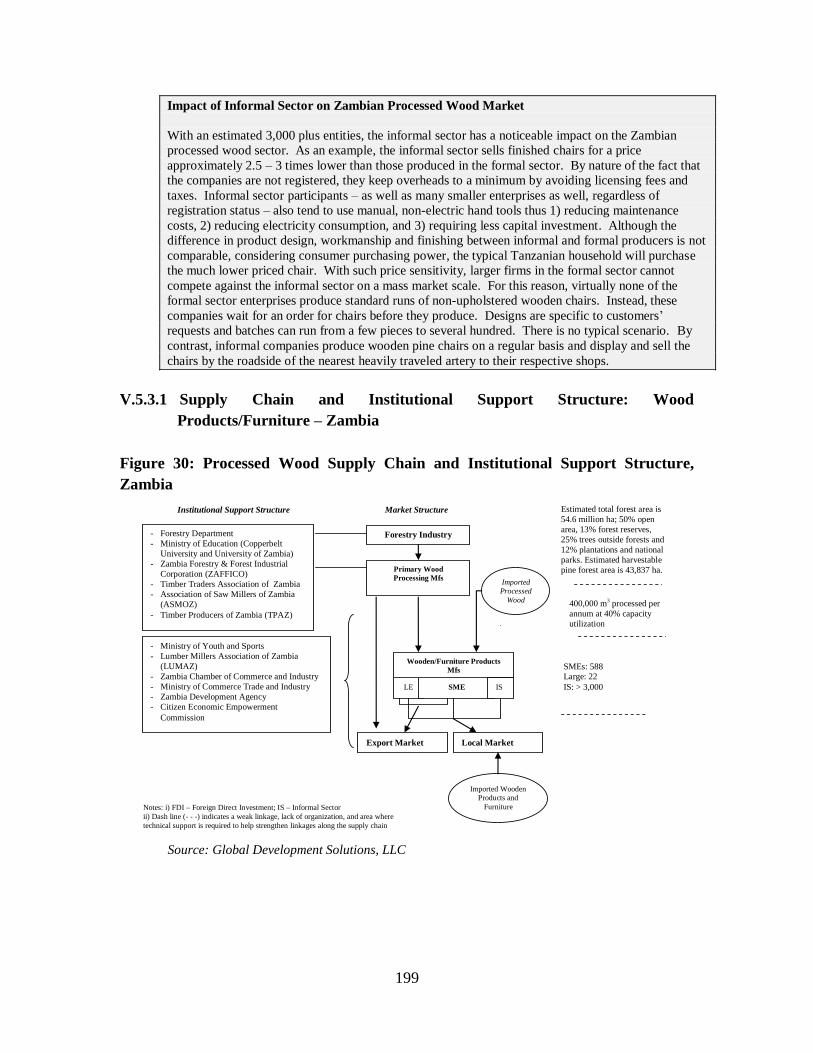
V.5.3.1 Supply Chain and Institutional Support Structure: Wood
Products/Furniture – Zambia
Figure 30: Processed Wood Supply Chain and Institutional Support Structure,
Zambia
- Forestry Department
- Ministry of Education (Copperbelt
University and University of Zambia)
- Zambia Forestry & Forest Industrial
Corporation (ZAFFICO)
- Timber Traders Association of Zambia
- Association of Saw Millers of Zambia
(ASMOZ)
- Timber Producers of Zambia (TPAZ)
- Ministry of Youth and Sports
- Lumber Millers Association of Zambia
(LUMAZ)
- Zambia Chamber of Commerce and Industry
- Ministry of Commerce Trade and Industry
- Zambia Development Agency
- Citizen Economic Empowerment
Commission
Institutional Support Structure Estimated total forest area is
54.6 million ha; 50% open
area, 13% forest reserves,
25% trees outside forests and
12% plantations and national
parks. Estimated harvestable
pine forest area is 43,837 ha.
Market Structure
Forestry Industry
Primary Wood
Processing Mfs
400,000 m3 processed per
annum at 40% capacity
utilization
Export Market Local Market
LE SME
Wooden/Furniture Products
Mfs
IS
Imported
Processed
Wood
SMEs: 588 Large: 22
IS: > 3,000
Imported Wooden
Products and
Furniture Notes: i) FDI – Foreign Direct Investment; IS – Informal Sector
ii) Dash line (- - -) indicates a weak linkage, lack of organization, and area where
technical support is required to help strengthen linkages along the supply chain
Source: Global Development Solutions, LLC
200
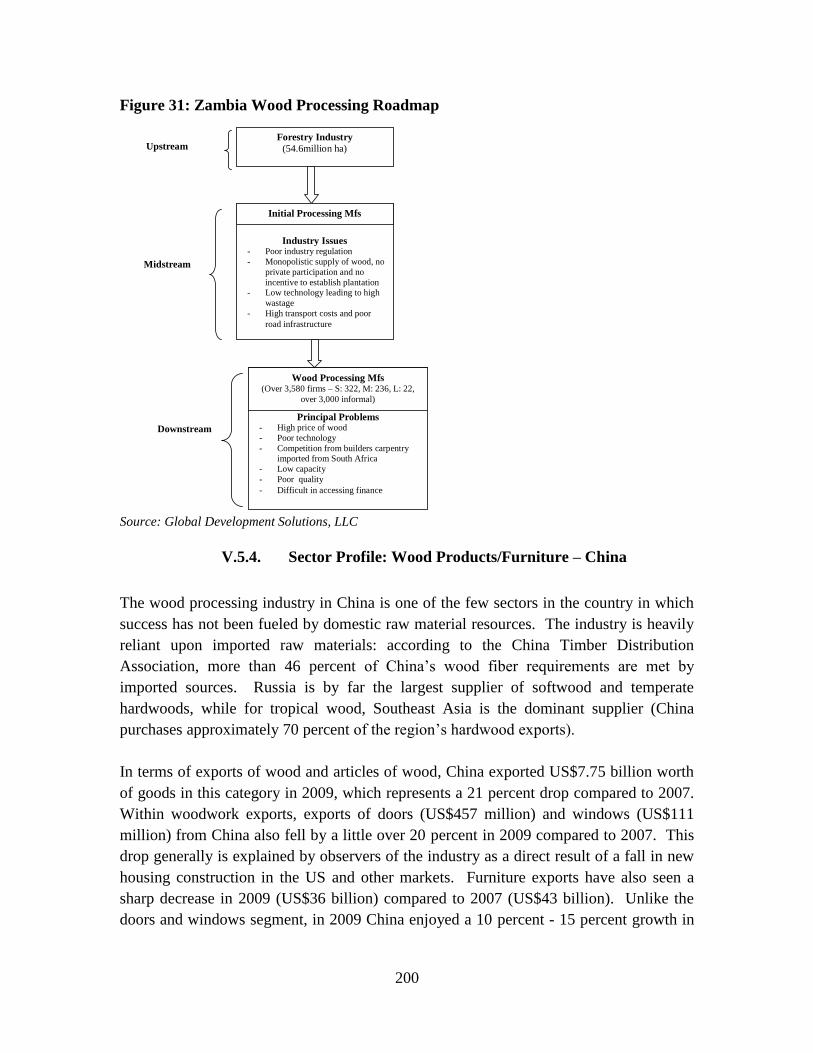
Figure 31: Zambia Wood Processing Roadmap
Forestry Industry
(54.6million ha)
Upstream
Industry Issues
- Poor industry regulation
- Monopolistic supply of wood, no
private participation and no
incentive to establish plantation - Low technology leading to high
wastage
- High transport costs and poor
road infrastructure
Initial Processing Mfs
Midstream
Industry Issues
Principal Problems - High price of wood
- Poor technology
- Competition from builders carpentry imported from South Africa
- Low capacity
- Poor quality
- Difficult in accessing finance
Wood Processing Mfs (Over 3,580 firms – S: 322, M: 236, L: 22,
over 3,000 informal)
Downstream
Source: Global Development Solutions, LLC
V.5.4. Sector Profile: Wood Products/Furniture – China
The wood processing industry in China is one of the few sectors in the country in which
success has not been fueled by domestic raw material resources. The industry is heavily
reliant upon imported raw materials: according to the China Timber Distribution
Association, more than 46 percent of China‘s wood fiber requirements are met by
imported sources. Russia is by far the largest supplier of softwood and temperate
hardwoods, while for tropical wood, Southeast Asia is the dominant supplier (China
purchases approximately 70 percent of the region‘s hardwood exports).
In terms of exports of wood and articles of wood, China exported US$7.75 billion worth
of goods in this category in 2009, which represents a 21 percent drop compared to 2007.
Within woodwork exports, exports of doors (US$457 million) and windows (US$111
million) from China also fell by a little over 20 percent in 2009 compared to 2007. This
drop generally is explained by observers of the industry as a direct result of a fall in new
housing construction in the US and other markets. Furniture exports have also seen a
sharp decrease in 2009 (US$36 billion) compared to 2007 (US$43 billion). Unlike the
doors and windows segment, in 2009 China enjoyed a 10 percent - 15 percent growth in
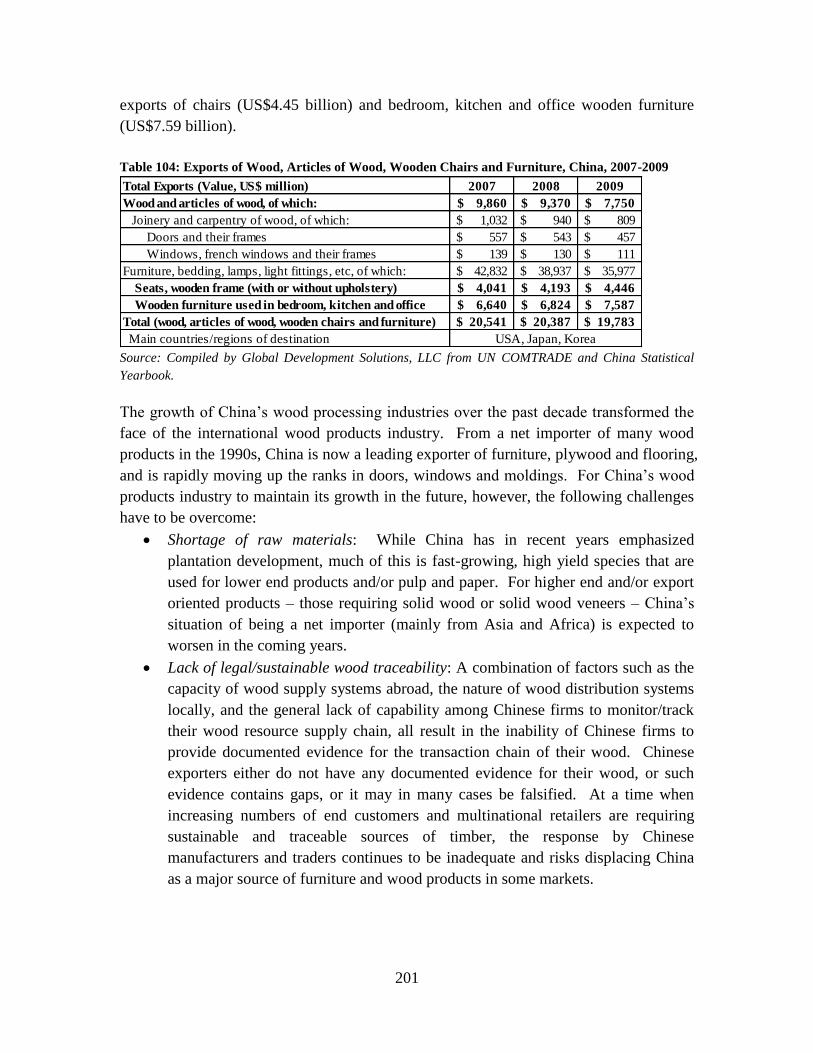
201
exports of chairs (US$4.45 billion) and bedroom, kitchen and office wooden furniture
(US$7.59 billion).
Table 104: Exports of Wood, Articles of Wood, Wooden Chairs and Furniture, China, 2007-2009
Total Exports (Value, US$ million) 2007 2008 2009
Wood and articles of wood, of which: 9,860$ 9,370$ 7,750$
Joinery and carpentry of wood, of which: 1,032$ 940$ 809$
Doors and their frames 557$ 543$ 457$
Windows, french windows and their frames 139$ 130$ 111$
Furniture, bedding, lamps, light fittings, etc, of which: 42,832$ 38,937$ 35,977$
Seats, wooden frame (with or without upholstery) 4,041$ 4,193$ 4,446$
Wooden furniture used in bedroom, kitchen and office 6,640$ 6,824$ 7,587$
Total (wood, articles of wood, wooden chairs and furniture) 20,541$ 20,387$ 19,783$
Main countries/regions of destination USA, Japan, Korea Source: Compiled by Global Development Solutions, LLC from UN COMTRADE and China Statistical
Yearbook.
The growth of China‘s wood processing industries over the past decade transformed the
face of the international wood products industry. From a net importer of many wood
products in the 1990s, China is now a leading exporter of furniture, plywood and flooring,
and is rapidly moving up the ranks in doors, windows and moldings. For China‘s wood
products industry to maintain its growth in the future, however, the following challenges
have to be overcome:
Shortage of raw materials: While China has in recent years emphasized
plantation development, much of this is fast-growing, high yield species that are
used for lower end products and/or pulp and paper. For higher end and/or export
oriented products – those requiring solid wood or solid wood veneers – China‘s
situation of being a net importer (mainly from Asia and Africa) is expected to
worsen in the coming years.
Lack of legal/sustainable wood traceability: A combination of factors such as the
capacity of wood supply systems abroad, the nature of wood distribution systems
locally, and the general lack of capability among Chinese firms to monitor/track
their wood resource supply chain, all result in the inability of Chinese firms to
provide documented evidence for the transaction chain of their wood. Chinese
exporters either do not have any documented evidence for their wood, or such
evidence contains gaps, or it may in many cases be falsified. At a time when
increasing numbers of end customers and multinational retailers are requiring
sustainable and traceable sources of timber, the response by Chinese
manufacturers and traders continues to be inadequate and risks displacing China
as a major source of furniture and wood products in some markets.
202
V.5.4.1 Supply Chain and Institutional Support Structure: Wood
Products/Furniture – China
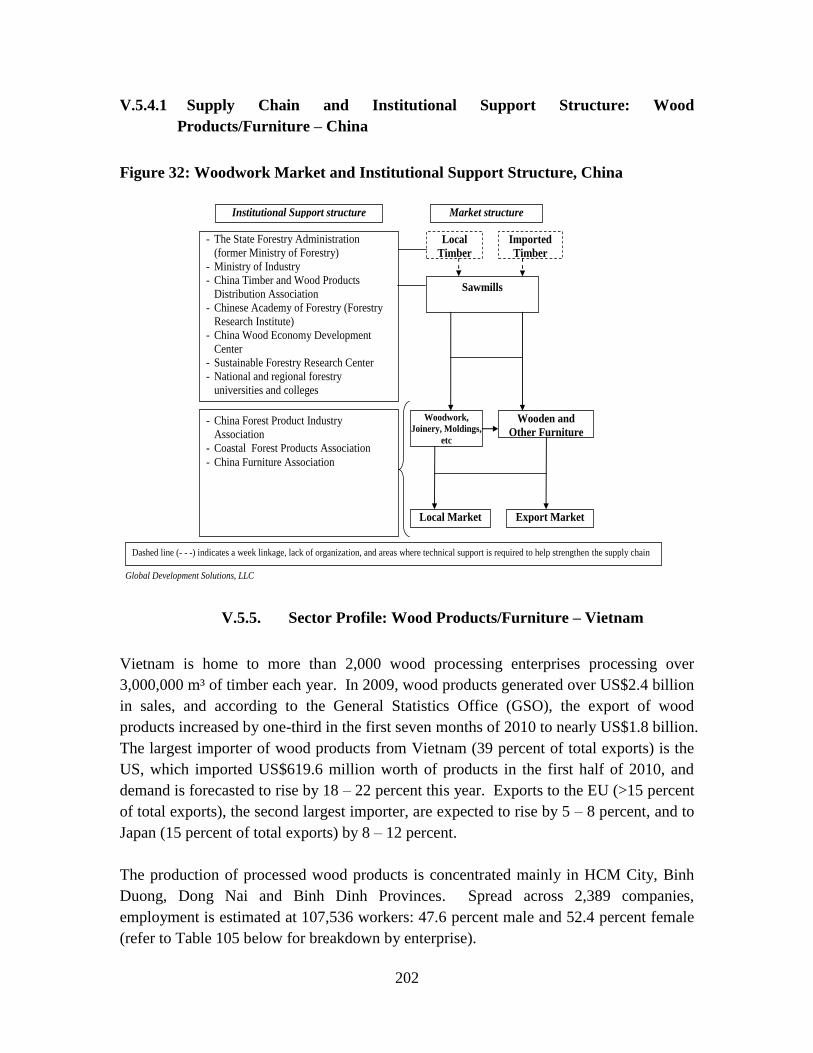
Figure 32: Woodwork Market and Institutional Support Structure, China
Woodwork Market and Institutional Support Structure, China
Market structure Institutional Support structure
- The State Forestry Administration
(former Ministry of Forestry)
- Ministry of Industry
- China Timber and Wood Products
Distribution Association
- Chinese Academy of Forestry (Forestry
Research Institute)
- China Wood Economy Development
Center
- Sustainable Forestry Research Center
- National and regional forestry
universities and colleges
- China Forest Product Industry
Association
- Coastal Forest Products Association
- China Furniture Association
Dashed line (- - -) indicates a week linkage, lack of organization, and areas where technical support is required to help strengthen the supply chain
Local
Timber
Sawmills
Woodwork,
Joinery, Moldings,
etc
Wooden and
Other Furniture
Local Market Export Market
Imported
Timber
Global Development Solutions, LLC
V.5.5. Sector Profile: Wood Products/Furniture – Vietnam
Vietnam is home to more than 2,000 wood processing enterprises processing over
3,000,000 m³ of timber each year. In 2009, wood products generated over US$2.4 billion
in sales, and according to the General Statistics Office (GSO), the export of wood
products increased by one-third in the first seven months of 2010 to nearly US$1.8 billion.
The largest importer of wood products from Vietnam (39 percent of total exports) is the
US, which imported US$619.6 million worth of products in the first half of 2010, and
demand is forecasted to rise by 18 – 22 percent this year. Exports to the EU (>15 percent
of total exports), the second largest importer, are expected to rise by 5 – 8 percent, and to
Japan (15 percent of total exports) by 8 – 12 percent.
The production of processed wood products is concentrated mainly in HCM City, Binh
Duong, Dong Nai and Binh Dinh Provinces. Spread across 2,389 companies,
employment is estimated at 107,536 workers: 47.6 percent male and 52.4 percent female
(refer to Table 105 below for breakdown by enterprise).
203
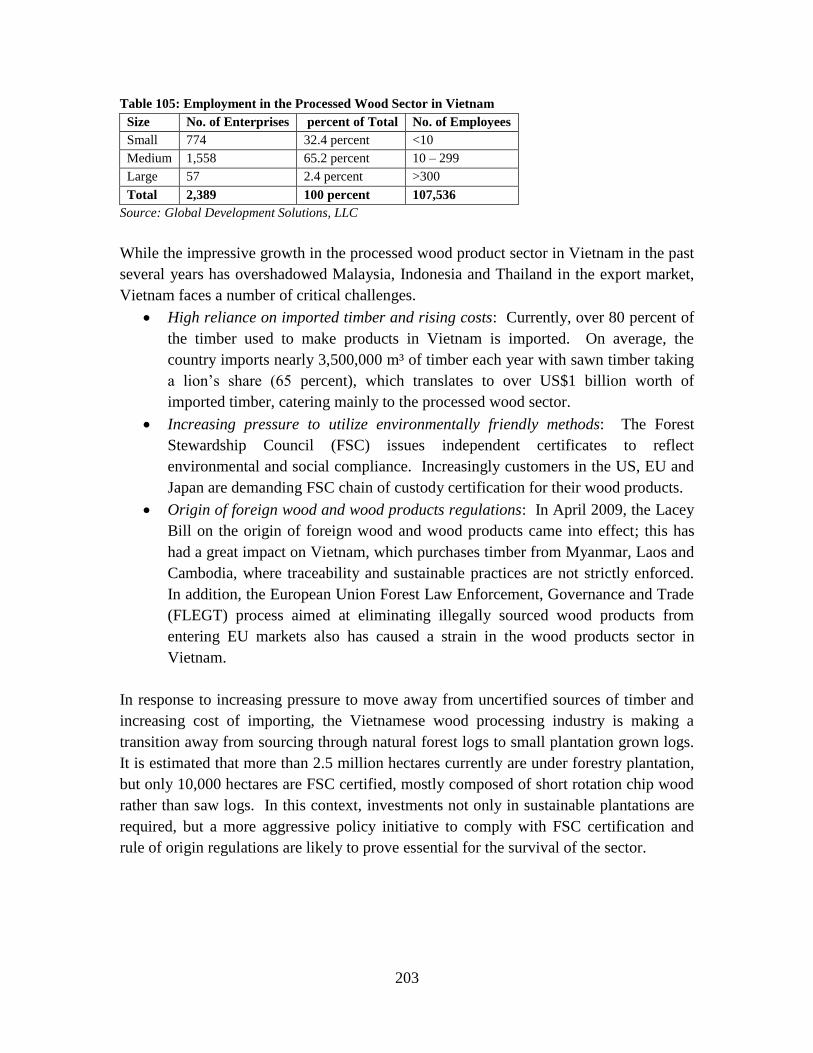
Table 105: Employment in the Processed Wood Sector in Vietnam
Size No. of Enterprises percent of Total No. of Employees
Small 774 32.4 percent <10
Medium 1,558 65.2 percent 10 – 299
Large 57 2.4 percent >300
Total 2,389 100 percent 107,536
Source: Global Development Solutions, LLC
While the impressive growth in the processed wood product sector in Vietnam in the past
several years has overshadowed Malaysia, Indonesia and Thailand in the export market,
Vietnam faces a number of critical challenges.
High reliance on imported timber and rising costs: Currently, over 80 percent of
the timber used to make products in Vietnam is imported. On average, the
country imports nearly 3,500,000 m³ of timber each year with sawn timber taking
a lion‘s share (65 percent), which translates to over US$1 billion worth of
imported timber, catering mainly to the processed wood sector.
Increasing pressure to utilize environmentally friendly methods: The Forest
Stewardship Council (FSC) issues independent certificates to reflect
environmental and social compliance. Increasingly customers in the US, EU and
Japan are demanding FSC chain of custody certification for their wood products.
Origin of foreign wood and wood products regulations: In April 2009, the Lacey
Bill on the origin of foreign wood and wood products came into effect; this has
had a great impact on Vietnam, which purchases timber from Myanmar, Laos and
Cambodia, where traceability and sustainable practices are not strictly enforced.
In addition, the European Union Forest Law Enforcement, Governance and Trade
(FLEGT) process aimed at eliminating illegally sourced wood products from
entering EU markets also has caused a strain in the wood products sector in
Vietnam.
In response to increasing pressure to move away from uncertified sources of timber and
increasing cost of importing, the Vietnamese wood processing industry is making a
transition away from sourcing through natural forest logs to small plantation grown logs.
It is estimated that more than 2.5 million hectares currently are under forestry plantation,
but only 10,000 hectares are FSC certified, mostly composed of short rotation chip wood
rather than saw logs. In this context, investments not only in sustainable plantations are
required, but a more aggressive policy initiative to comply with FSC certification and
rule of origin regulations are likely to prove essential for the survival of the sector.
204
V.5.5.1 Supply Chain and Institutional Support Structure: Wood
Products/Furniture – Vietnam
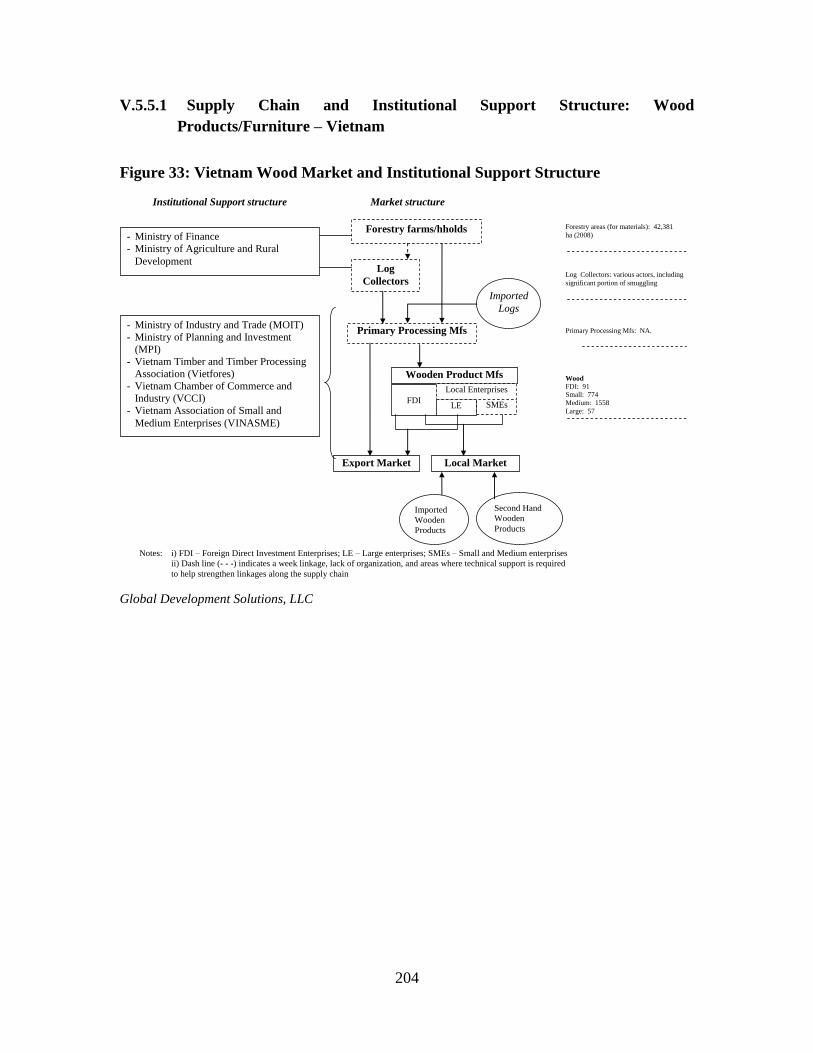
Figure 33: Vietnam Wood Market and Institutional Support Structure Vietnam Wood Market and Institutional Support Structure
Market structure Institutional Support structure
Forestry farms/hholds - Ministry of Finance
- Ministry of Agriculture and Rural
Development Log
Collectors
Primary Processing Mfs
Imported
Logs
Wooden Product Mfs
FDI LE SMEs
Export Market Local Market
- Ministry of Industry and Trade (MOIT)
- Ministry of Planning and Investment
(MPI)
- Vietnam Timber and Timber Processing
Association (Vietfores)
- Vietnam Chamber of Commerce and
Industry (VCCI)
- Vietnam Association of Small and
Medium Enterprises (VINASME)
Notes: i) FDI – Foreign Direct Investment Enterprises; LE – Large enterprises; SMEs – Small and Medium enterprises
ii) Dash line (- - -) indicates a week linkage, lack of organization, and areas where technical support is required
to help strengthen linkages along the supply chain
Second Hand
Wooden
Products
Imported
Wooden
Products
Local Enterprises
Forestry areas (for materials): 42,381
ha (2008)
Log Collectors: various actors, including
significant portion of smuggling
Primary Processing Mfs: NA.
Wood
FDI: 91 Small: 774
Medium: 1558
Large: 57
Global Development Solutions, LLC
205
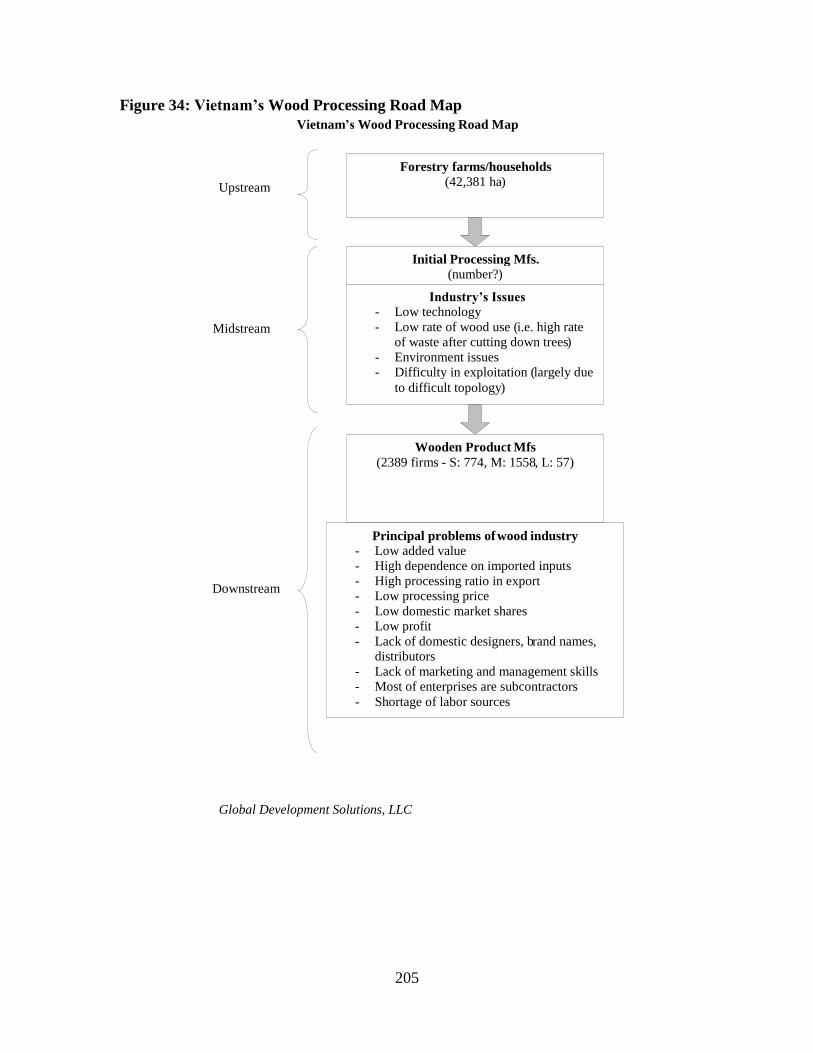
Figure 34: Vietnam’s Wood Processing Road Map
Global Development Solutions, LLC
Vietnam ’s W ood Processing Road Map
Forestry farms/households (42,381 ha )
I nitial Processing Mfs. ( number? )
Industry’s Issues - Low technology - Low rate of wood use ( i.e. high rate
of waste after cutting down trees ) - Environment issues - Difficulty in exploitation ( largely due
to difficult topology )
Wooden Product Mfs (2389 firms - S: 774, M: 1558 , L: 57 )
Upstream
Downstream
Principal problems of wood industry - Low added value - High dependence on imported inputs - High processing ratio in export - Low processing price - Low domestic market shares - L ow pr of it - Lack of domestic designers, b rand names,
distributors - Lack of marketing and management skills - Most of enterprises are subcontractors - Shortage of labor sources
Midstream
206
V.6. Economic Efficiency and Competitiveness of Wood Products/Furniture –
Chairs
V.6.1. Ethiopia: Wood Chairs
The aim of this section is to establish the basic competitiveness of the wood products
industry in Ethiopia by examining a representative product – wooden chairs – and to
assess its likely future competitiveness. This analysis complements the VCA section
which looks more closely at the strategic and business process opportunities for
upgrading and expansion at each production stage over the next five years.
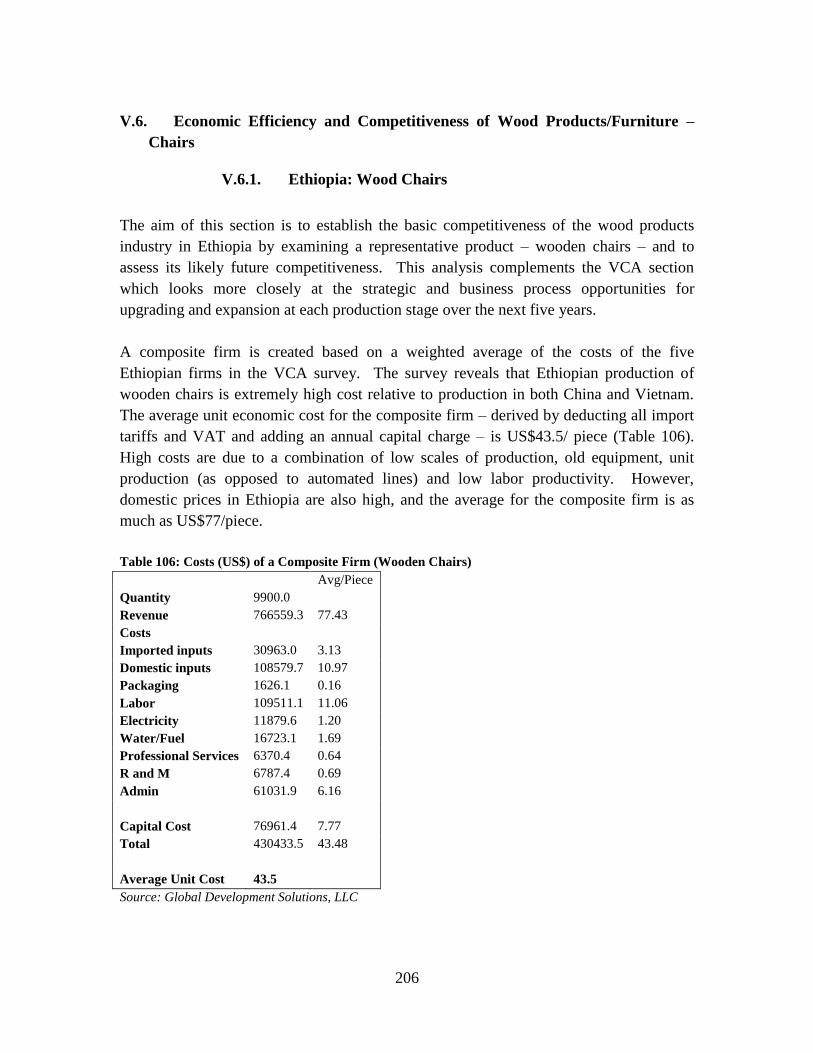
A composite firm is created based on a weighted average of the costs of the five
Ethiopian firms in the VCA survey. The survey reveals that Ethiopian production of
wooden chairs is extremely high cost relative to production in both China and Vietnam.
The average unit economic cost for the composite firm – derived by deducting all import
tariffs and VAT and adding an annual capital charge – is US$43.5/ piece (Table 106).
High costs are due to a combination of low scales of production, old equipment, unit
production (as opposed to automated lines) and low labor productivity. However,
domestic prices in Ethiopia are also high, and the average for the composite firm is as
much as US$77/piece.
Table 106: Costs (US$) of a Composite Firm (Wooden Chairs)
Avg/Piece
Quantity 9900.0
Revenue 766559.3 77.43
Costs
Imported inputs 30963.0 3.13
Domestic inputs 108579.7 10.97
Packaging 1626.1 0.16
Labor 109511.1 11.06
Electricity 11879.6 1.20
Water/Fuel 16723.1 1.69
Professional Services 6370.4 0.64
R and M 6787.4 0.69
Admin 61031.9 6.16
Capital Cost 76961.4 7.77
Total 430433.5 43.48
Average Unit Cost 43.5
Source: Global Development Solutions, LLC
207
Ethiopia imported in 2009 some US$17 million in wood furniture and exported about
US$1 million. Thus, at the margin, Ethiopia is an importer of chairs at CIF prices that are
reported to be in the range of US$17.7 to US$29 per piece. The lower end of the CIF
price range is consistent with the range of FOB export prices for China of US$14.45 to
US$17.55 reported in the VCA survey. Ethiopian production is clearly highly
uncompetitive at these prices, which are for similar utility wooden chairs. It is unclear
how local producers of chairs are able to survive under the present price competition
without tariff or other protection, but the local chairs are heavier and therefore may be
more durable and possibly suited to rougher treatment which may give them an
advantage in a particular market segment, or alternatively they may be targeted to
upcountry markets.
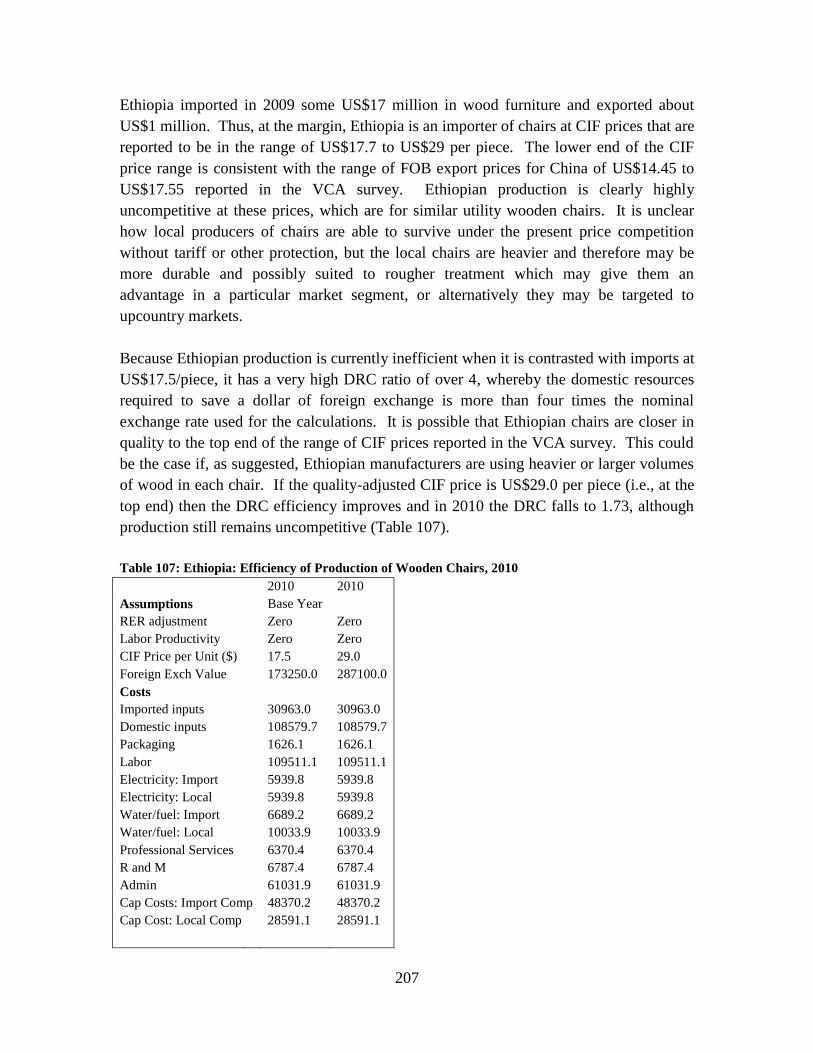
Because Ethiopian production is currently inefficient when it is contrasted with imports at
US$17.5/piece, it has a very high DRC ratio of over 4, whereby the domestic resources
required to save a dollar of foreign exchange is more than four times the nominal
exchange rate used for the calculations. It is possible that Ethiopian chairs are closer in
quality to the top end of the range of CIF prices reported in the VCA survey. This could
be the case if, as suggested, Ethiopian manufacturers are using heavier or larger volumes
of wood in each chair. If the quality-adjusted CIF price is US$29.0 per piece (i.e., at the
top end) then the DRC efficiency improves and in 2010 the DRC falls to 1.73, although
production still remains uncompetitive (Table 107).
Table 107: Ethiopia: Efficiency of Production of Wooden Chairs, 2010
2010 2010
Assumptions Base Year
RER adjustment Zero Zero
Labor Productivity Zero Zero
CIF Price per Unit ($) 17.5 29.0
Foreign Exch Value 173250.0 287100.0
Costs
Imported inputs 30963.0 30963.0
Domestic inputs 108579.7 108579.7
Packaging 1626.1 1626.1
Labor 109511.1 109511.1
Electricity: Import 5939.8 5939.8
Electricity: Local 5939.8 5939.8
Water/fuel: Import 6689.2 6689.2
Water/fuel: Local 10033.9 10033.9
Professional Services 6370.4 6370.4
R and M 6787.4 6787.4
Admin 61031.9 61031.9
Cap Costs: Import Comp 48370.2 48370.2
Cap Cost: Local Comp 28591.1 28591.1
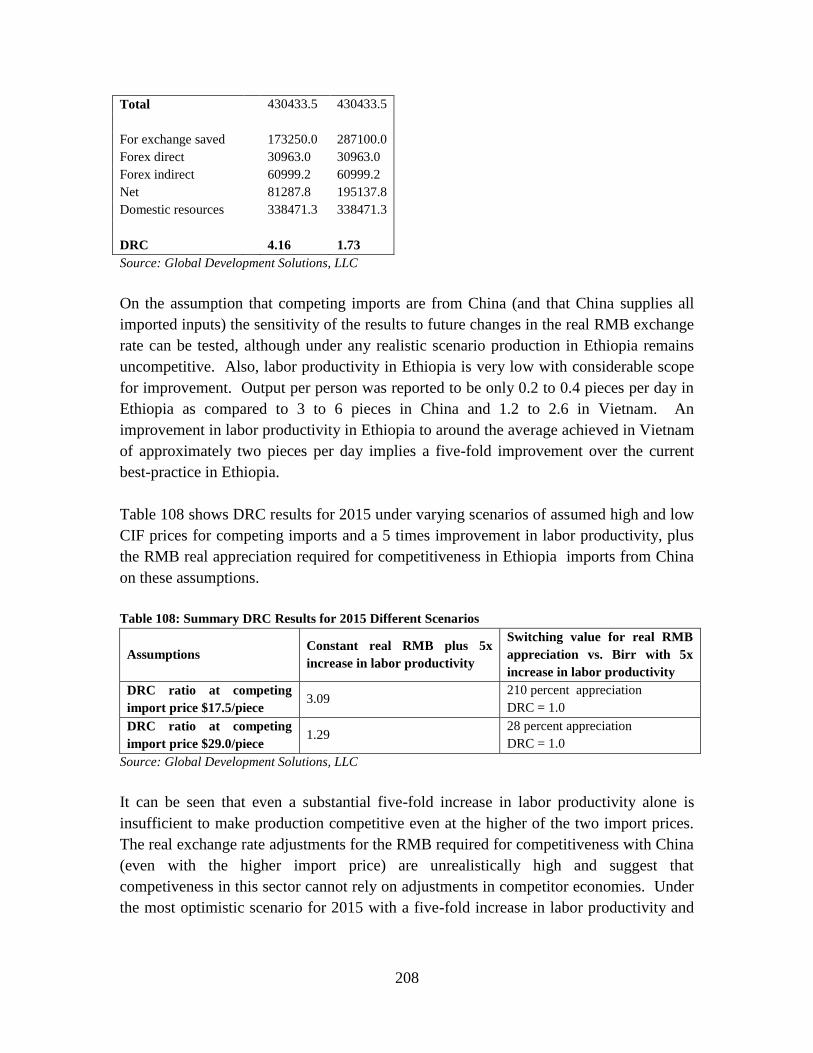
208
Total 430433.5 430433.5
For exchange saved 173250.0 287100.0
Forex direct 30963.0 30963.0
Forex indirect 60999.2 60999.2
Net 81287.8 195137.8
Domestic resources 338471.3 338471.3
DRC 4.16 1.73
Source: Global Development Solutions, LLC
On the assumption that competing imports are from China (and that China supplies all
imported inputs) the sensitivity of the results to future changes in the real RMB exchange
rate can be tested, although under any realistic scenario production in Ethiopia remains
uncompetitive. Also, labor productivity in Ethiopia is very low with considerable scope
for improvement. Output per person was reported to be only 0.2 to 0.4 pieces per day in
Ethiopia as compared to 3 to 6 pieces in China and 1.2 to 2.6 in Vietnam. An
improvement in labor productivity in Ethiopia to around the average achieved in Vietnam
of approximately two pieces per day implies a five-fold improvement over the current
best-practice in Ethiopia.
Table 108 shows DRC results for 2015 under varying scenarios of assumed high and low
CIF prices for competing imports and a 5 times improvement in labor productivity, plus
the RMB real appreciation required for competitiveness in Ethiopia imports from China
on these assumptions.
Table 108: Summary DRC Results for 2015 Different Scenarios
Assumptions Constant real RMB plus 5x
increase in labor productivity
Switching value for real RMB
appreciation vs. Birr with 5x
increase in labor productivity
DRC ratio at competing
import price $17.5/piece 3.09
210 percent appreciation
DRC = 1.0
DRC ratio at competing
import price $29.0/piece 1.29
28 percent appreciation
DRC = 1.0
Source: Global Development Solutions, LLC
It can be seen that even a substantial five-fold increase in labor productivity alone is
insufficient to make production competitive even at the higher of the two import prices.
The real exchange rate adjustments for the RMB required for competitiveness with China
(even with the higher import price) are unrealistically high and suggest that
competiveness in this sector cannot rely on adjustments in competitor economies. Under
the most optimistic scenario for 2015 with a five-fold increase in labor productivity and
209
the high import price of US$29 per piece, a real RMB appreciation of 28 percent is still
required for local production to be competitive, and this is an unlikely prospect.
If Ethiopian producers can produce despite current lack of price competitiveness, there
may be an explanation in terms of a) better durability of the product, b) additional
transport and handling costs from the port and c) tariff protection.89
However, the large
trade imbalance and the fact that Ethiopia is the smallest exporter of furniture among
African countries (see VCA) suggest that prospects are poor.
V.6.2. Tanzania: Wood Chairs
The aim of this section is to establish the basic competitiveness of wood products
manufacture in Tanzania with reference to wooden chairs and its likely future trend in
competitiveness. This is a prelude to looking more closely through the VCA at the
opportunities for investment in upgrading and expansion and reorganization of the supply
chain at each stage.
The DRC cost adjustment methodology is based on a separate methodological annex –
‗The Methodology for Efficiency and Competitiveness Analysis.‘
Tanzania‘s trade balance in wooden furniture is in deficit. Thus, at the margin, Tanzania
may be regarded as an importer of chairs. CIF import prices at Dar es Salaam port based
on Chinese products are reported to be in the range of US$17.5 to US$29 per piece,
similar to Ethiopian prices CIF Djibouti. For the analysis, a representative production
unit was used based on the VCA results. Tanzanian costs are high due to old equipment
in the survey production units and comparatively low labor productivity, leading to a
calculated economic cost of US$37.9 (Table 109).
At the above prices for imports, Tanzanian products are uncompetitive. As in the case of
Ethiopia, it is likely that the Tanzanian products are of higher weight than the Chinese
product, in which case it may be appropriate to use the higher end of the price range of
US$25.0-US$29.0, reflecting greater durability though possibly lower than average finish.
It is also the case that production in upcountry locations such as Arusha or Moshi gains
the advantage of internal transport cost protection which probably allows competitive
production in some cases.
Data collected on wooden chair production were subject to considerable uncertainty. For
example, given the very old age of the units and lack of reporting by unit owners of
89
This and the type of timber in use are currently under further investigation.

210
replacement capital cost, it was necessary make use of imputed data including Ethiopia
comparisons. The cost figures were adjusted to economic terms as follows:
The imported material inputs (sawn timber) are from the EAC and enter duty free,
although they are subject to VAT;
VAT is removed from the value of imported and domestic items; and
To allow for indirect foreign exchange content, on the basis of general norms for
East and Central Africa countries, 80 percent of fuel and electricity cost was
categorized as a foreign exchange cost.90
Table 109: DRC Analysis: Wooden Chairs - Tanzania
Output (pcs p.a.) 3120
Cost US$ Financial Economic Econ/piece
Imported
Glues 3016.00 2555.93 0.82
Varnish 4160.00 3525.42 1.13
Sanding Sealer 3120.00 2644.07 0.85
Sandpaper 3120.00 2644.07 0.85
Thinner 2496.00 2115.25 0.68
Nails 1456.00 1233.90 0.40
Domestic
Lumber 17160.00 14542.37 4.66
Labor 52000.00 52000.00 16.67
Electricity 504.00 504.00 0.16
Water 533.33 533.33 0.17
Fuel 1360.00 1360.00 0.44
R and M 2400.00 2400.00 0.77
Admin 7200.00 7200.00 2.31
Capital charge 24960.00 24960.00 8.00
Total 118218.35 37.89
Note: Capital cost per piece and wage cost per piece come from Ethiopian data.
No capital costs are reported in the Tanzania survey.
It is assumed no import duty; only VAT is payable on imported inputs.
Source: Global Development Solutions, LLC
Table 110: DRC Estimates: Wooden Chairs - Tanzania
CIF price US$ 17.5 25.0 29.0
Foreign exchange saved 54600.00 78000.00 90480.00
90
This is only an assumption but given the relatively small share of fuel in total cost the results are not
sensitive to this assumption.
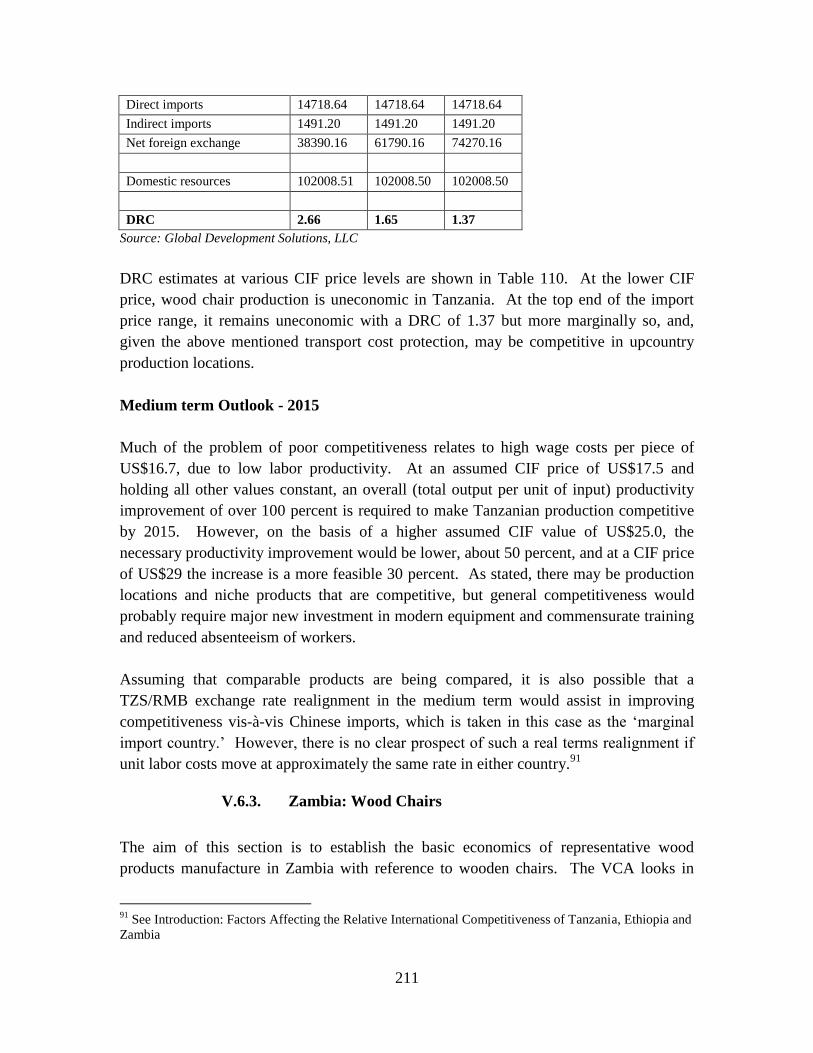
211
Direct imports 14718.64 14718.64 14718.64
Indirect imports 1491.20 1491.20 1491.20
Net foreign exchange 38390.16 61790.16 74270.16
Domestic resources 102008.51 102008.50 102008.50
DRC 2.66 1.65 1.37
Source: Global Development Solutions, LLC
DRC estimates at various CIF price levels are shown in Table 110. At the lower CIF
price, wood chair production is uneconomic in Tanzania. At the top end of the import
price range, it remains uneconomic with a DRC of 1.37 but more marginally so, and,
given the above mentioned transport cost protection, may be competitive in upcountry
production locations.
Medium term Outlook - 2015
Much of the problem of poor competitiveness relates to high wage costs per piece of
US$16.7, due to low labor productivity. At an assumed CIF price of US$17.5 and
holding all other values constant, an overall (total output per unit of input) productivity
improvement of over 100 percent is required to make Tanzanian production competitive
by 2015. However, on the basis of a higher assumed CIF value of US$25.0, the
necessary productivity improvement would be lower, about 50 percent, and at a CIF price
of US$29 the increase is a more feasible 30 percent. As stated, there may be production
locations and niche products that are competitive, but general competitiveness would
probably require major new investment in modern equipment and commensurate training
and reduced absenteeism of workers.
Assuming that comparable products are being compared, it is also possible that a
TZS/RMB exchange rate realignment in the medium term would assist in improving
competitiveness vis-à-vis Chinese imports, which is taken in this case as the ‗marginal
import country.‘ However, there is no clear prospect of such a real terms realignment if
unit labor costs move at approximately the same rate in either country.91
V.6.3. Zambia: Wood Chairs
The aim of this section is to establish the basic economics of representative wood
products manufacture in Zambia with reference to wooden chairs. The VCA looks in
91
See Introduction: Factors Affecting the Relative International Competitiveness of Tanzania, Ethiopia and
Zambia
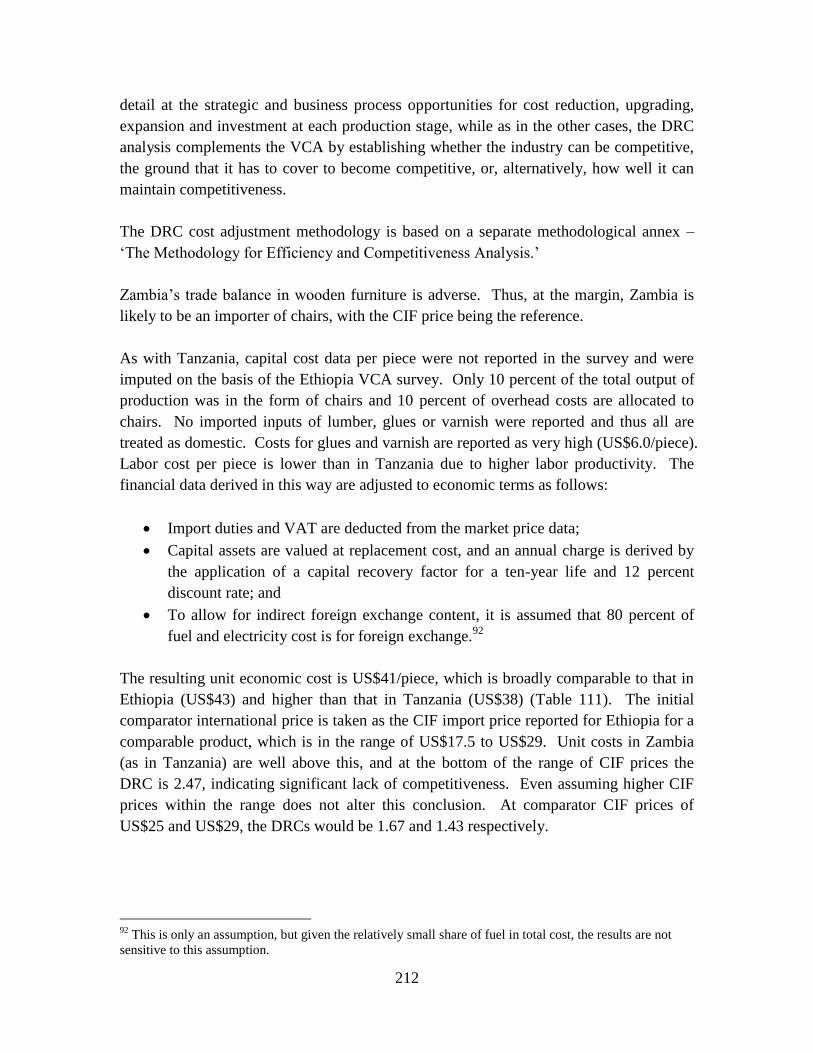
212
detail at the strategic and business process opportunities for cost reduction, upgrading,
expansion and investment at each production stage, while as in the other cases, the DRC
analysis complements the VCA by establishing whether the industry can be competitive,
the ground that it has to cover to become competitive, or, alternatively, how well it can
maintain competitiveness.
The DRC cost adjustment methodology is based on a separate methodological annex –
‗The Methodology for Efficiency and Competitiveness Analysis.‘
Zambia‘s trade balance in wooden furniture is adverse. Thus, at the margin, Zambia is
likely to be an importer of chairs, with the CIF price being the reference.
As with Tanzania, capital cost data per piece were not reported in the survey and were
imputed on the basis of the Ethiopia VCA survey. Only 10 percent of the total output of
production was in the form of chairs and 10 percent of overhead costs are allocated to
chairs. No imported inputs of lumber, glues or varnish were reported and thus all are
treated as domestic. Costs for glues and varnish are reported as very high (US$6.0/piece).
Labor cost per piece is lower than in Tanzania due to higher labor productivity. The
financial data derived in this way are adjusted to economic terms as follows:
Import duties and VAT are deducted from the market price data;
Capital assets are valued at replacement cost, and an annual charge is derived by
the application of a capital recovery factor for a ten-year life and 12 percent
discount rate; and
To allow for indirect foreign exchange content, it is assumed that 80 percent of
fuel and electricity cost is for foreign exchange.92
The resulting unit economic cost is US$41/piece, which is broadly comparable to that in
Ethiopia (US$43) and higher than that in Tanzania (US$38) (Table 111). The initial
comparator international price is taken as the CIF import price reported for Ethiopia for a
comparable product, which is in the range of US$17.5 to US$29. Unit costs in Zambia
(as in Tanzania) are well above this, and at the bottom of the range of CIF prices the
DRC is 2.47, indicating significant lack of competitiveness. Even assuming higher CIF
prices within the range does not alter this conclusion. At comparator CIF prices of
US$25 and US$29, the DRCs would be 1.67 and 1.43 respectively.
92
This is only an assumption, but given the relatively small share of fuel in total cost, the results are not
sensitive to this assumption.
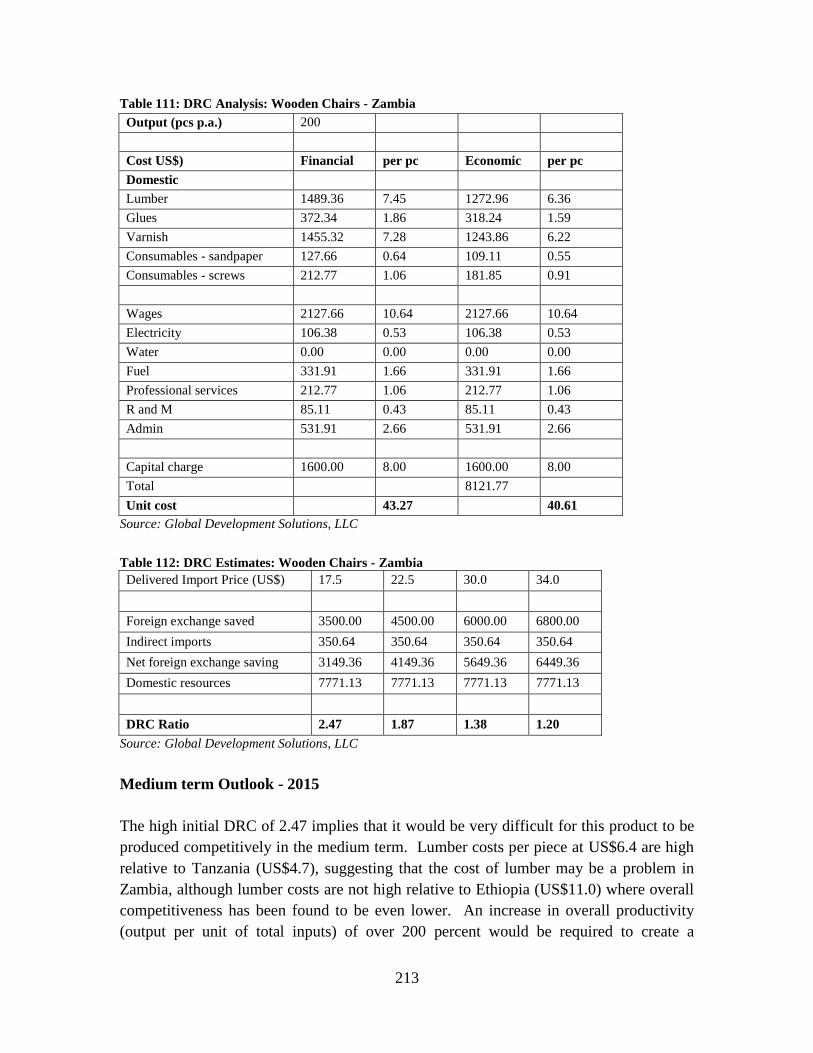
213
Table 111: DRC Analysis: Wooden Chairs - Zambia
Output (pcs p.a.) 200
Cost US$) Financial per pc Economic per pc
Domestic
Lumber 1489.36 7.45 1272.96 6.36
Glues 372.34 1.86 318.24 1.59
Varnish 1455.32 7.28 1243.86 6.22
Consumables - sandpaper 127.66 0.64 109.11 0.55
Consumables - screws 212.77 1.06 181.85 0.91
Wages 2127.66 10.64 2127.66 10.64
Electricity 106.38 0.53 106.38 0.53
Water 0.00 0.00 0.00 0.00
Fuel 331.91 1.66 331.91 1.66
Professional services 212.77 1.06 212.77 1.06
R and M 85.11 0.43 85.11 0.43
Admin 531.91 2.66 531.91 2.66
Capital charge 1600.00 8.00 1600.00 8.00
Total 8121.77
Unit cost 43.27 40.61
Source: Global Development Solutions, LLC
Table 112: DRC Estimates: Wooden Chairs - Zambia
Delivered Import Price (US$) 17.5 22.5 30.0 34.0
Foreign exchange saved 3500.00 4500.00 6000.00 6800.00
Indirect imports 350.64 350.64 350.64 350.64
Net foreign exchange saving 3149.36 4149.36 5649.36 6449.36
Domestic resources 7771.13 7771.13 7771.13 7771.13
DRC Ratio 2.47 1.87 1.38 1.20
Source: Global Development Solutions, LLC
Medium term Outlook - 2015
The high initial DRC of 2.47 implies that it would be very difficult for this product to be
produced competitively in the medium term. Lumber costs per piece at US$6.4 are high
relative to Tanzania (US$4.7), suggesting that the cost of lumber may be a problem in
Zambia, although lumber costs are not high relative to Ethiopia (US$11.0) where overall
competitiveness has been found to be even lower. An increase in overall productivity
(output per unit of total inputs) of over 200 percent would be required to create a
214
competitive cost structure at a CIF competitor price of US$17.5, and even given
significant re-equipment, this seems implausibly high.
However, this conclusion has to be qualified, because the relatively high transport costs
of fabricated chairs 93
from the East Coast (Durban or Dar es Salaam) to Zambia need to
be factored in. Taking this into account, the likely DRC at the low-end CIF price of
US$17.5 plus transport (US$22.5) falls to about 1.87, and at higher-end CIF prices
(US$25.0 to US$29.0) plus transport cost, reflecting more solid wood, the DRCs fall into
the range 1.2 to 1.4. Thus, taking into account transport costs and a higher base CIF price
for delivered imports into Zambia, competitiveness remains fairly weak, but the
productivity increases required to meet border prices are considerably smaller, implying
potential for competitiveness with a reasonable increase in productivity.
It is also possible that a ZMK/RMB exchange rate realignment in the medium term would
assist in improving competitiveness vis-à-vis Chinese imports, which is taken in this case
as the ‗marginal import country.‘94
However, there is no clear prospect of such a real
terms realignment if unit labor costs move forward at approximately the same rate in both
countries.95
V.7. Value Chain Analyses: Wooden Chairs96
Key Characteristics: The average cost of producing a wooden chair in Ethiopia is
US$40.38/piece;97
this figure is US$31.21/piece in Tanzania and US$30.97/piece in
Zambia. Ethiopian, Tanzanian and Zambian producers of wooden chairs sell exclusively
in their respective local markets. Regarding the production of wooden chairs, none of
these countries is sufficiently price-competitive to access the global (export) supply
chains. For example, as compared to Ethiopia, a similar chair98
in China costs roughly
93
The calculation is sensitive to whether chairs are imported in fully fabricated or knocked down state.
The assumption here is that real wood chairs would be imported fabricated. As such, a container load of
200 to 250 chairs would imply transport costs of about US$5.0 per chair according to VCA findings. 94
This is the case because, even though a large proportion of furniture imports come from South Africa,
China remains the lowest cost potential supplier. (Equivalent wooden chairs from South Africa are
reported as wholesaling in Lusaka for about US$40.0). 95
See Introduction: Factors Affecting the Relative International Competitiveness of Tanzania, Ethiopia and
Zambia
96
Value chain diagrams in this section reflect actual data from export oriented best practice firms. 97
Chairs made of pine species wood, 16-20 cubic meters of wood per 1,000 chairs. The chairs are made of
dried wood, then varnish/paint finished and assembled. Chairs are not upholstered. 98
Chairs made of pine species wood, 20-25 cubic meters of wood per 1,000 chairs. The chairs are made of
dried wood, then varnish/paint finished and assembled. Chairs are not upholstered.
215
three times less to make - US$12.53/chair.99
In Vietnam, a similar chair is produced at an
average cost of US$17.50.100
The VCA suggests that the wooden chair cost competitiveness in selected African
countries is diminished by two main factors:
1. The cost of lumber/wood raw materials is high in countries like Ethiopia;
2. Labor productivity is low across all three African countries.
Cost of Lumber: Lumber prices in the selected African countries vary considerably (see
Table 113 below). Ethiopian manufacturers of wooden chairs source pine lumber
domestically at an average price of US$667/m3. In Ethiopia, pine lumber comes from
local mills that source roundwood from local cooperative and/or public forests. In
Tanzania, pine lumber typically comes from private and public plantations and sells at an
average price US$275/m3. The pine lumber price differential between Ethiopia and
Tanzania can in large part be explained by the fact that Ethiopia has smaller productive
plantation areas (100,000 ha) compared to Tanzania (150,000 ha) and Tanzanian
plantations have higher maturity and yields as they were established earlier (1980s) than
those in Ethiopia. In Zambia, pine lumber comes from state-owned plantations and open
forests.101
Zambia‘s pine reserves cover a net area of 48,837 ha, less than half that of
Ethiopia and less than a third that of Tanzania. The general price for pine lumber in
Zambia is US$394.102
Factors leading to the high cost of pine lumber in Zambia were
addressed above in the sector profile. As was reported in that section, the Zambia Forest
and Forestry Industries Corporation (ZAFFICO) has a monopoly on managed forests and
controls the price of roundwood. The other option for accessing wood is through the
open areas in which the buyer must go through the local tribal chief. In either case, in
addition to the price of the roundwood, the additional commitment fee and the associated
stipulations/purchasing requirements (for ZAFFICO), and the royalty fee (for open area
felling) drive up the final price of roundwood. In addition - and as noted in the sector
profile section above - the poor road infrastructure combined with inefficient trucks lead
to high roundwood and lumber transportation costs.
99
Sampled Chinese producers sell in the local and foreign markets. Shipping cost for a preassembled chair
from Guangdong, China to Addis Ababa is approximately US$14.74/piece. Even with this high shipping
cost, a preassembled chair produced in China would be more competitive than a locally produced chair in
Ethiopia. 100
Sampled Vietnamese producers sell mostly in foreign markets. Chairs made of pine species wood, 20-
25cubic meters of wood per 1,000 chairs. The chairs are made of dried wood, then varnish/paint finished
and assembled. Chairs are not upholstered. 101
Although these are open forests, they also are controlled by local tribes, and permission to cut and the
required payment are determined by the tribal chiefs. 102
Companies reported last year‘s prices at slightly below US$400 per cubic meter but price checks as of
March 2011 indicate the price for one cubic meter of pine to cost approximately US$432.
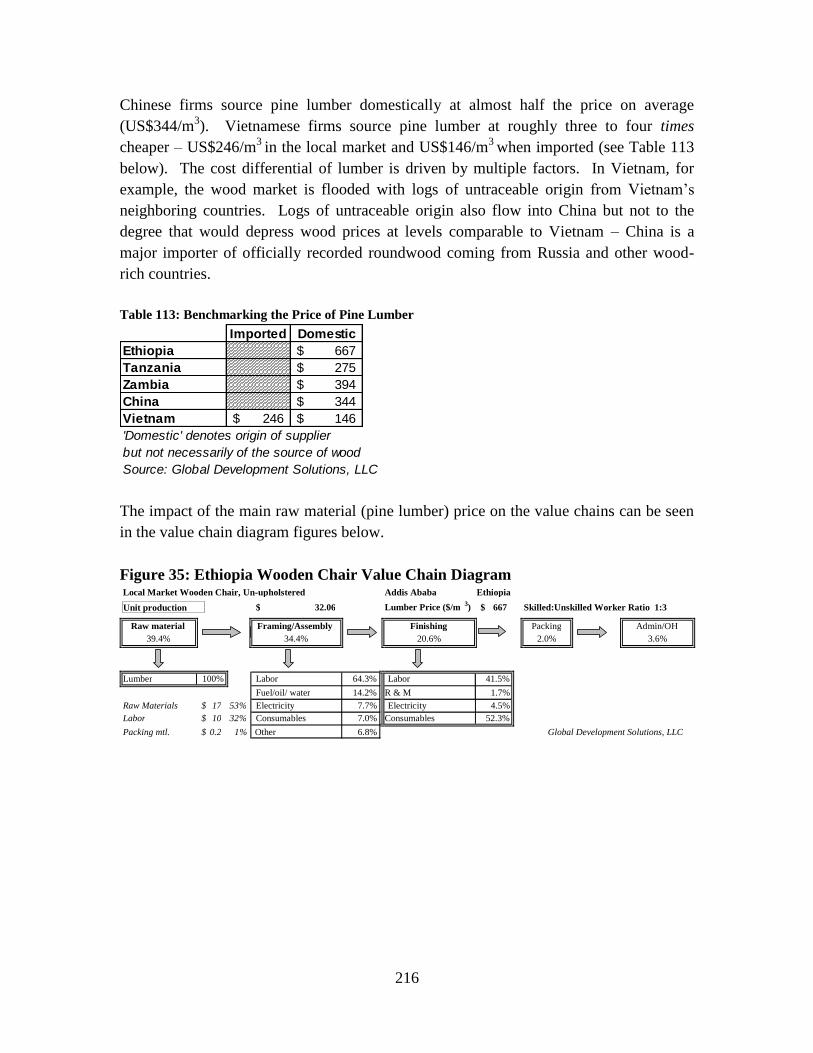
216
Chinese firms source pine lumber domestically at almost half the price on average
(US$344/m3). Vietnamese firms source pine lumber at roughly three to four times
cheaper – US$246/m3
in the local market and US$146/m3
when imported (see Table 113
below). The cost differential of lumber is driven by multiple factors. In Vietnam, for
example, the wood market is flooded with logs of untraceable origin from Vietnam‘s
neighboring countries. Logs of untraceable origin also flow into China but not to the
degree that would depress wood prices at levels comparable to Vietnam – China is a
major importer of officially recorded roundwood coming from Russia and other wood-
rich countries.
Table 113: Benchmarking the Price of Pine Lumber
Imported Domestic
Ethiopia 667$
Tanzania 275$
Zambia 394$
China 344$
Vietnam 246$ 146$
'Domestic' denotes origin of supplier
but not necessarily of the source of wood
Source: Global Development Solutions, LLC
The impact of the main raw material (pine lumber) price on the value chains can be seen
in the value chain diagram figures below.
Figure 35: Ethiopia Wooden Chair Value Chain Diagram
Local Market Wooden Chair, Un-upholstered Addis Ababa Ethiopia Unit production
cost 32.06 $ Lumber Price ($/m 3
) 667 $
Raw material Framing/Assembly Finishing Packing Admin/OH 39.4% 34.4% 20.6% 2.0% 3.6%
Lumber 100% Labor 64.3% Labor 41.5% Fuel/oil/ water 14.2% R & M 1.7%
Raw Materials 17 $ 53% Electricity 7.7% Electricity 4.5%
Labor 10 $ 32% Consumables 7.0% Consumables 52.3%
Packing mtl. 0.2 $ 1% Other 6.8%
Global Development Solutions, LLC
Skilled:Unskilled Worker Ratio 1:3
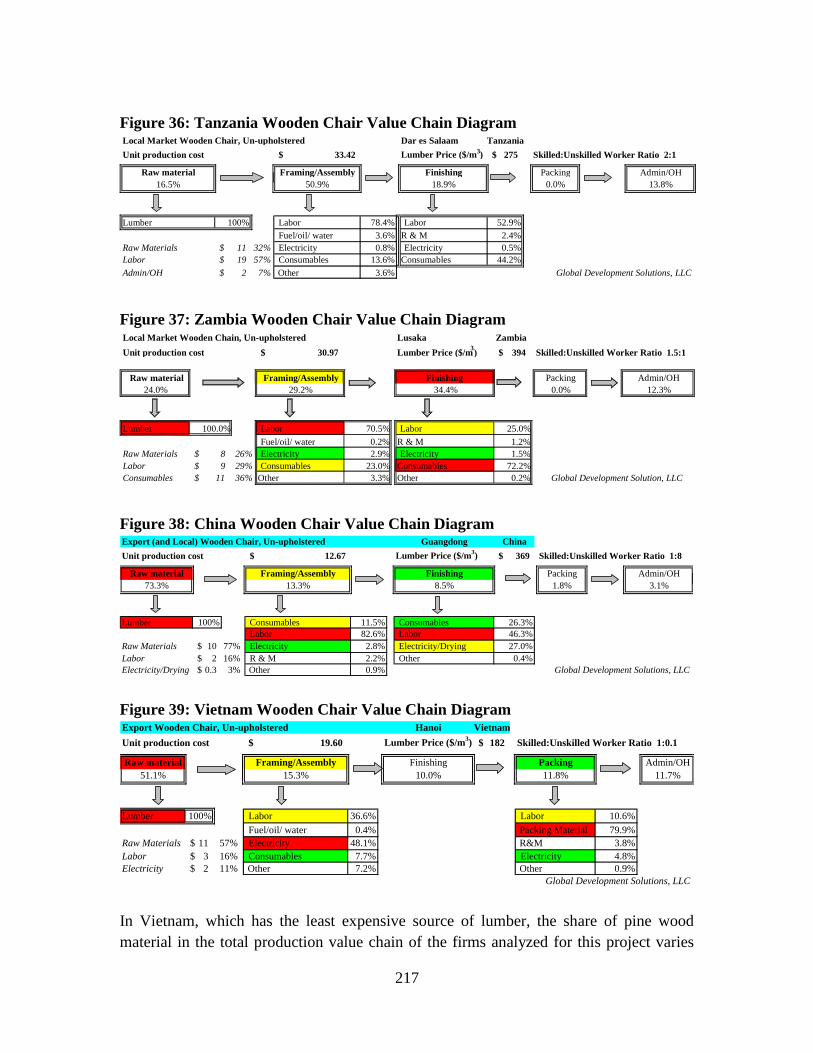
217
Figure 36: Tanzania Wooden Chair Value Chain Diagram
Figure 37: Zambia Wooden Chair Value Chain Diagram
Figure 38: China Wooden Chair Value Chain Diagram Export (and Local) Wooden Chair, Un-upholstered Guangdong China
Unit production cost 12.67$ Lumber Price ($/m3) 369$
Raw material Framing/Assembly Finishing Packing Admin/OH
73.3% 13.3% 8.5% 1.8% 3.1%
Lumber 100% Consumables 11.5% Consumables 26.3%
Labor 82.6% Labor 46.3%
Raw Materials 10$ 77% Electricity 2.8% Electricity/Drying 27.0%
Labor 2$ 16% R & M 2.2% Other 0.4%
Electricity/Drying 0.3$ 3% Other 0.9% Global Development Solutions, LLC
Skilled:Unskilled Worker Ratio 1:8
Figure 39: Vietnam Wooden Chair Value Chain Diagram
Export Wooden Chair, Un-upholstered Hanoi Vietnam
Unit production cost 19.60$ Lumber Price ($/m3) 182$
Raw material Framing/Assembly Finishing Packing Admin/OH
51.1% 15.3% 10.0% 11.8% 11.7%
Lumber 100% Labor 36.6% Labor 10.6%
Fuel/oil/ water 0.4% Packing Material 79.9%
Raw Materials 11$ 57% Electricity 48.1% R&M 3.8%
Labor 3$ 16% Consumables 7.7% Electricity 4.8%
Electricity 2$ 11% Other 7.2% Other 0.9%
Global Development Solutions, LLC
Skilled:Unskilled Worker Ratio 1:0.1
In Vietnam, which has the least expensive source of lumber, the share of pine wood
material in the total production value chain of the firms analyzed for this project varies
Local Market Wooden Chain, Un-upholstered Lusaka Zambia Unit production cost 30.97 $
Lumber Price ($/m 3 ) 394 $ Skilled:Unskilled Worker Ratio 1.5:1
Raw material Framing/Assembly Finishing Packing Admin/OH 24.0% 29.2% 34.4% 0.0% 12.3%
Lumber 100.0% Labor 70.5% Labor 25.0% Fuel/oil/ water 0.2% R & M 1.2%
Raw Materials 8 $ 26% Electricity 2.9% Electricity 1.5%
Labor 9 $ 29% Consumables 23.0% Consumables 72.2%
Consumables 11 $ 36% Other 3.3% Other 0.2% Global Development Solution, LLC
Local Market Wooden Chair, Un-upholstered Dar es Salaam Tanzania Unit production cost 33.42 $
Lumber Price ($/m 3 ) 275 $
Raw material Framing/Assembly Finishing Packing Admin/OH 16.5% 50.9% 18.9% 0.0% 13.8%
Lumber 100% Labor 78.4% Labor 52.9% Fuel/oil/ water 3.6% R & M 2.4%
Raw Materials 11 $ 32% Electricity 0.8% Electricity 0.5%
Labor 19 $ 57% Consumables 13.6% Consumables 44.2%
Admin/OH 2 $ 7% Other 3.6%
Global Development Solutions, LLC
Skilled:Unskilled Worker Ratio 2:1
218
from 36 percent to 53 percent, depending on the price of logs. For most firms, pine
lumber constitutes roughly half of the production cost. In China, where firms report
higher lumber prices than in Vietnam, the cost of lumber constitutes roughly 75 percent
of the production cost with very small variations reported.
In Ethiopia, where firms report much higher lumber prices than China and Vietnam, it
would generally be expected that the price of wood would constitute the highest share of
production costs when compared to Vietnam and China. The VCA suggests that this is
not the case. In Ethiopia, wood constitutes, on average, 35 percent of the production cost
of an un-upholstered wooden chair (the reported range being 25 - 40 percent according to
the interviewed firms). The reason behind this combination of high lumber price and low
share of wood costs in the value chain compared to China and Vietnam is that Ethiopian
wooden chair manufacturing firms report extremely low productivity levels that are
almost not comparable to China and Vietnam.
V.7.1. Benchmarking Key Variables
Productivity: Wooden chair producers report low productivity rates across all three
African countries included in this analysis. Ethiopian firms report productivity levels in
the range of 0.2 - 0.4 chairs per worker per day. Tanzania firms report slightly higher
productivity levels (0.3 – 0.7 chairs per worker per day). In Zambia productivity ranges
from 0.2 – 0.6 chairs per worker per day. While low overall productivities in these
African countries is in part associated with very low levels of capacity utilization
(typically at 50 percent for most furniture/seat manufacturing firms interviewed; slightly
higher in Zambia, up to 68 percent), the limited training and experience of both managers
as well as line workers in these firms is also a major contributor to these extremely low
productivity levels. Labor productivity in selected African countries is at least ten to
fifteen times lower than the productivity reported by firms in China (up to 6 chairs but
generally 3 - 5 chairs per person per day) and Vietnam (up to 3 chairs but on average 2
chairs per person per day) – see Table 114 below.
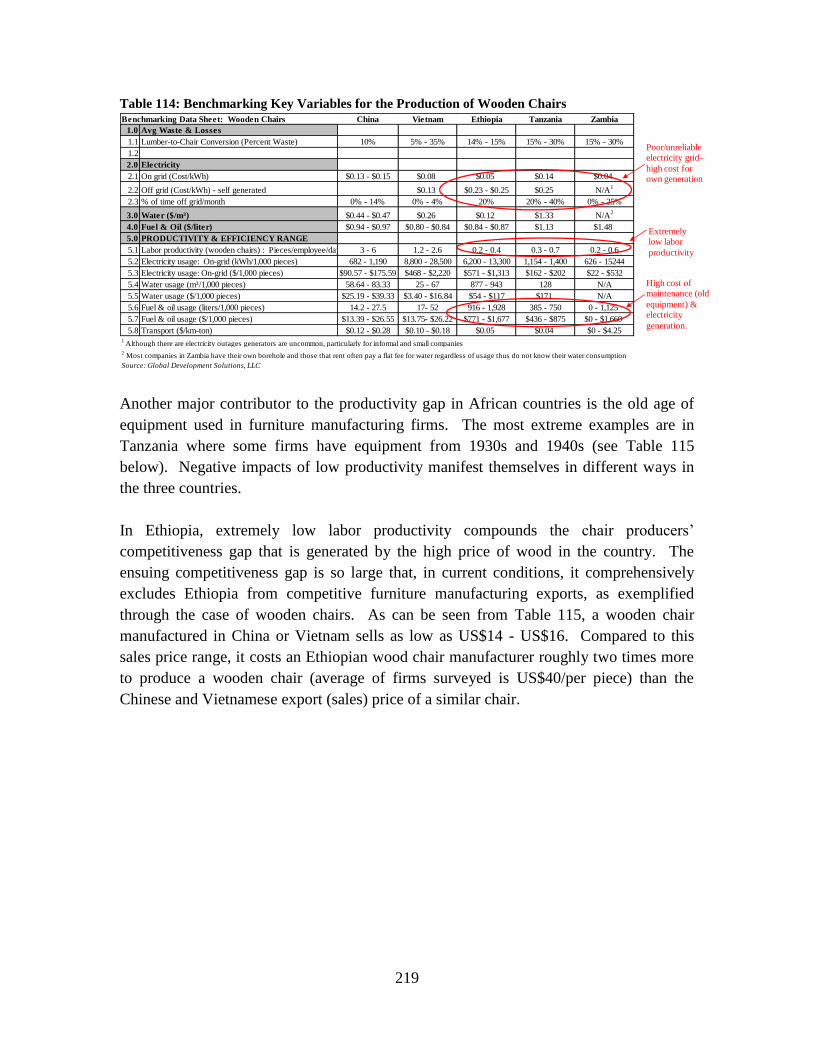
219
Table 114: Benchmarking Key Variables for the Production of Wooden Chairs Benchmarking Data Sheet: Wooden Chairs China Vietnam Ethiopia Tanzania Zambia
1.0 Avg Waste & Losses
1.1 Lumber-to-Chair Conversion (Percent Waste) 10% 5% - 35% 14% - 15% 15% - 30% 15% - 30%
1.2
2.0 Electricity
2.1 On grid (Cost/kWh) $0.13 - $0.15 $0.08 $0.05 $0.14 $0.04
2.2 Off grid (Cost/kWh) - self generated $0.13 $0.23 - $0.25 $0.25 N/A1
2.3 % of time off grid/month 0% - 14% 0% - 4% 20% 20% - 40% 0% - 25%
3.0 Water ($/m³) $0.44 - $0.47 $0.26 $0.12 $1.33 N/A2
4.0 Fuel & Oil ($/liter) $0.94 - $0.97 $0.80 - $0.84 $0.84 - $0.87 $1.13 $1.48
5.0 PRODUCTIVITY & EFFICIENCY RANGE
5.1 Labor productivity (wooden chairs) : Pieces/employee/day 3 - 6 1.2 - 2.6 0.2 - 0.4 0.3 - 0.7 0.2 - 0.6
5.2 Electricity usage: On-grid (kWh/1,000 pieces) 682 - 1,190 8,800 - 28,500 6,200 - 13,300 1,154 - 1,400 626 - 15244
5.3 Electricity usage: On-grid ($/1,000 pieces) $90.57 - $175.59 $468 - $2,220 $571 - $1,313 $162 - $202 $22 - $532
5.4 Water usage (m³/1,000 pieces) 58.64 - 83.33 25 - 67 877 - 943 128 N/A
5.5 Water usage ($/1,000 pieces) $25.19 - $39.33 $3.40 - $16.84 $54 - $117 $171 N/A
5.6 Fuel & oil usage (liters/1,000 pieces) 14.2 - 27.5 17- 52 916 - 1,928 385 - 750 0 - 1,125
5.7 Fuel & oil usage ($/1,000 pieces) $13.39 - $26.55 $13.75- $26.22 $771 - $1,677 $436 - $875 $0 - $1,660
5.8 Transport ($/km-ton) $0.12 - $0.28 $0.10 - $0.18 $0.05 $0.04 $0 - $4.251
Although there are electricity outages generators are uncommon, particularly for informal and small companies
2 Most companies in Zambia have their own borehole and those that rent often pay a flat fee for water regardless of usage thus do not know their water consumption
Source: Global Development Solutions, LLC
Poor/unreliable electricity grid-
high cost forown generation
Extremely low labor
productivity
High cost of maintenance (old
equipment) &electricity
generation.
Another major contributor to the productivity gap in African countries is the old age of
equipment used in furniture manufacturing firms. The most extreme examples are in
Tanzania where some firms have equipment from 1930s and 1940s (see Table 115
below). Negative impacts of low productivity manifest themselves in different ways in
the three countries.
In Ethiopia, extremely low labor productivity compounds the chair producers‘
competitiveness gap that is generated by the high price of wood in the country. The
ensuing competitiveness gap is so large that, in current conditions, it comprehensively
excludes Ethiopia from competitive furniture manufacturing exports, as exemplified
through the case of wooden chairs. As can be seen from Table 115, a wooden chair
manufactured in China or Vietnam sells as low as US$14 - US$16. Compared to this
sales price range, it costs an Ethiopian wood chair manufacturer roughly two times more
to produce a wooden chair (average of firms surveyed is US$40/per piece) than the
Chinese and Vietnamese export (sales) price of a similar chair.

220
Table 115: Benchmarking Key Variables for the Production of Wooden Chairs (Part 2) China Vietnam Ethiopia Tanzania Zambia
6.0 FACTORY
6.1 Capacity utilization 85% - 100% 60% - 85% 30% - 80% 50% - 60% 40% - 68%
6.2 Installed capacity (piece/day) 250 - 500 617 - 11,000 8 - 10 5 - 20 3 - 20
6.3 Labor absenteeism rate (%) 1% - 2% 1% - 8% 2% - 4% 10% - 20% 1% - 3%
6.4 Average salary/wage/month
6.5 Skilled $383 - $442 $181 - $259 $81 - $119 $150 - $200 $200 - $265
6.6 Unskilled $206 - $251 $85 - $135 $37.04 - $51.86 $75 - $125 $100 - $160
6.7 Days of operation/month 26 - 28 26 - 27 26 24 23 - 30
6.8 Average age of major equipment 3 - 7 7 - 13 4 - 25 20 - 65 4 - 28
7.0 Exported Output (finished primary product)
7.1 Direct Export without consolidator/broker 0% 70% - 100% 0% 0% 0%
7.2 Indirect Export Through Local Consolidator 0% - 50% 0% 0% 0% 0%
7.3 Indirect Export Through Overseas Consolidator 0% 10% - 100% 0% 0% 0%
8.0 Domestically Sold Output (finished primary product)
8.1 Direct Sales to Wholesalers/Retailers without consolidator 0% 0% - 20% 0% -30% 0% - 100% 0%
8.2 Direct Sales Through Own Outlets/Shops/Showrooms 50% - 100% 0% 70% - 100% 0% - 100% 100%
8.3 Indirect Sales Through Local Consolidator/Trader 0% 0% 0% 0% 0%
9.0 Unit production cost ($/piece) $11.46 - $14.49 $13.29 - $22.52 $32.06 - $49.48 $30.00 - $33.42 $14.911 - $30.97
9.1 Export Rebate ($/piece) $1.61 - $1.95 - -
10.0 Avg Selling Price (US$)
10.1 Factory gate - $59.26 - $81.48 - $17.02 - $53.19
10.2 Wholesale $13.72 - $16.96 $62.96 - $88.89 $53.33 - $60.00 -
10.3 FOB price $14.45 - $17.55 $16.19 - $26.10 - -
11.0 Avg Reject Rates
11.1 Product rejection, factory 3% - 5% 0% - 2% 0% - 9% 0% 0% - 7%
11.2 Product rejection, delivery point/client 3% - 5% 0% 0% 0% 0%1
Informal sector in Zambia produces at a significantly lower cost yet quality is inappropriate for export (poor craftsmanship & unaccpetable finishing).
Limited scale & capacity utilization
Nominally low wages but low productivity
erodes advantage
Generally old equipment
No price competitiveness
for export
Source: Global Development Solutions, LLC
As can be seen from Table 114 and Table 115 above, other weaknesses of wooden chair
manufacturing in Ethiopia, Tanzania and Zambia are:
Poor quality of electricity from the main utility grid (factories report being 20
percent of time off-grid and on generators in Ethiopia and as high 25 percent and
40 percent of time off-grid in Zambia and Tanzania respectively); and
Relatively high wastage rates (due at least in part to old equipment used).
These two inefficiencies, among others, further compound productivity problems at the
factory level. Electricity outages as well as dilapidated, high-waste inducing equipment
cause interruptions in the workflow. The net result of these bottlenecks, even without
considering the relatively high prices of lumber in Ethiopia or relatively high wages in
Tanzania and Zambia, make furniture producers in these countries inefficient, at least
insofar as wooden chairs are concerned.
Over the medium to long term, the VCA suggests that one of the most important factors
to increase the competitiveness of wooden chair manufacturing in Ethiopia, Tanzania and
Zambia would be to increase the labor and management skills since even the most basic
furniture processing and assembly skills appear to be low. For example, as can be seen
from Table 116 below, African firms report utilization rates for adhesives and glues at
200 - 250 grams/chair, which are excessive compared to 50 - 60 grams/chair used in
China and Vietnam. Varnishes and oils also are used in excess of utilization rates in

221
China and Vietnam by a factor of 4 to 10. Some of these differences could be explained
by possible consumer preferences in the local African markets for, say, heavy oil/varnish
finishes. Also, interviews with firms in Asia and Africa suggest that African producers
use cheaper finishing materials than Asian producers, something which can also lead to
higher consumption/utilization of materials. But, high utilization of these consumables
points to low know-how levels in furniture manufacturing in these countries and
reinforces the findings related to low labor productivity rates.
Table 116: Benchmarking Wooden Chair Manufacturing Costs in Ethiopia, China and Vietnam
Consumable Cost &
Utilization (Average) $/kg
grams/
chair $/chair $/kg
grams/
chair $/chair $/kg
grams/
chair $/chair $/kg
grams/
chair $/chair $/kg
grams/
chair $/chair
Adhesives/Glues 2.59$ 200 0.52$ 3.87$ 250 0.97$ 5.85$ 250 1.46$ 2.21$ 44 0.10$ 3.24$ 61 0.20$
Varnish/Finsihing Oils 2.22$ 500 1.11$ 2.67$ 500 1.33$ 3.47$ 500 1.74$ 5.10$ 50 0.25$ 7.54$ 112 0.84$
Other Consumables - - 2.59$ - - 2.80$ - - 1.10$ - - 0.16$ - - 0.44$
Total 4.22$ 5.10$ 4.30$ 0.51$ 1.48$
Ethiopia Tanzania Zambia China Vietnam
Global Development Solutions, LLC
This know-how has to be increased if Ethiopian, Tanzanian and Zambian furniture
manufacturing is to be competitive internationally, especially in relation to productivity.
With its current productivity rates, the industry would need a substantial reduction in the
cost of accessing lumber and other material, improved labor productivity, and other factor
prices to be able to compete internationally. Figure 40, for example, illustrates one
simplified scenario in which Ethiopian furniture makers could hypothetically be able to
compete with likes of China and Vietnam assuming they can produce a chair at or around
the US$15/piece benchmark.
Figure 40: Hypothetical Scenario for Achieving Export Competitiveness, Option 1
As can be seen from Figure 40, assuming all other factor costs and efficiencies are held
constant at present levels, Ethiopian firms, at current productivity levels, would need
labor prices two times cheaper and wood prices one hundred times cheaper than what
they currently pay in order to be able to produce at the assumed US$15/chair competitive
benchmark – in other words, an unworkable scenario.
Hypothetical Scenario, Export Wooden Chair, Un-upholstered Addis Ababa Ethiopia Unit production cost 14.47 $ 7 $
Raw material Framing/ Assembly Finishing Packing
Admin/ OH
0.9% 51.7% 36.1% 3.3% 8.0%
Existing Scenario Labor 47% Labor 26% Lumber ($/m 3 ) 667 $ 7 $ Fuel/oil/ water 21% R & M 2% Avg. Wage ($/month) 60 $ $30 Electricity 11% Electricity 6% Pieces/worker/day 0.2 0.2 Consumables 10% Consumables 66% Other Costs unchanged unchanged Other 10%
Lumber Price ($/m 3 )
Global Development Solutions, LLC
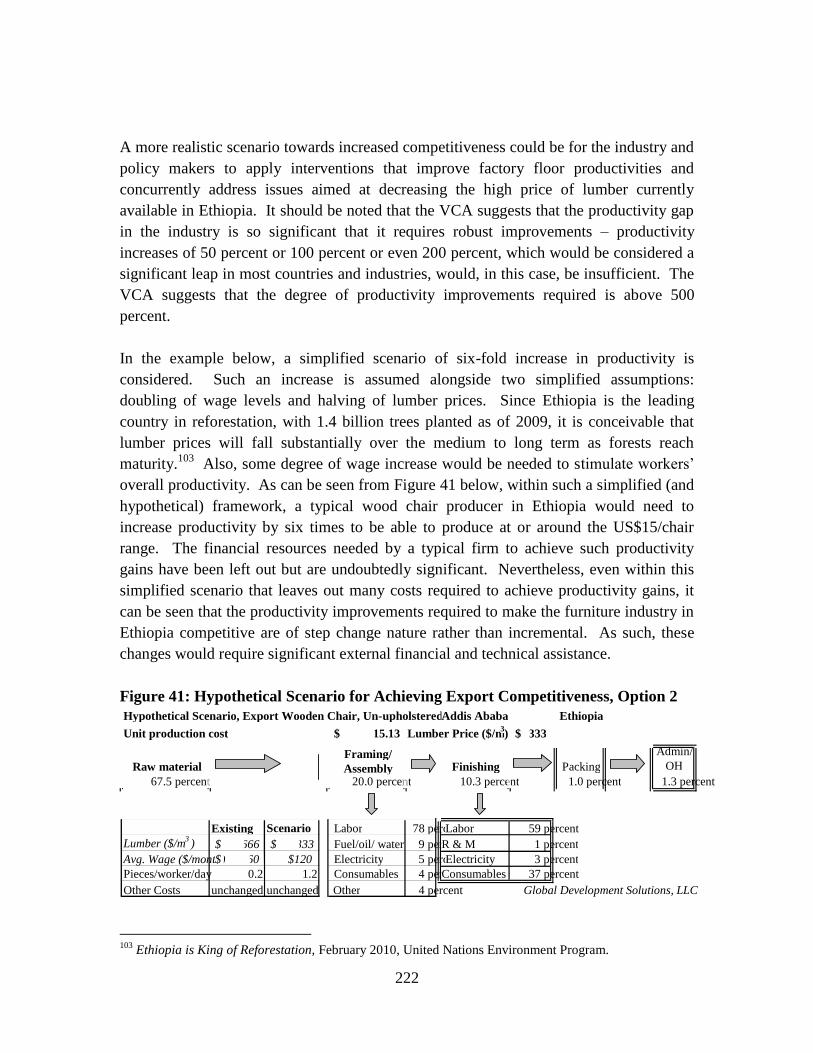
222
A more realistic scenario towards increased competitiveness could be for the industry and
policy makers to apply interventions that improve factory floor productivities and
concurrently address issues aimed at decreasing the high price of lumber currently
available in Ethiopia. It should be noted that the VCA suggests that the productivity gap
in the industry is so significant that it requires robust improvements – productivity
increases of 50 percent or 100 percent or even 200 percent, which would be considered a
significant leap in most countries and industries, would, in this case, be insufficient. The
VCA suggests that the degree of productivity improvements required is above 500
percent.
In the example below, a simplified scenario of six-fold increase in productivity is
considered. Such an increase is assumed alongside two simplified assumptions:
doubling of wage levels and halving of lumber prices. Since Ethiopia is the leading
country in reforestation, with 1.4 billion trees planted as of 2009, it is conceivable that
lumber prices will fall substantially over the medium to long term as forests reach
maturity.103
Also, some degree of wage increase would be needed to stimulate workers‘
overall productivity. As can be seen from Figure 41 below, within such a simplified (and
hypothetical) framework, a typical wood chair producer in Ethiopia would need to
increase productivity by six times to be able to produce at or around the US$15/chair
range. The financial resources needed by a typical firm to achieve such productivity
gains have been left out but are undoubtedly significant. Nevertheless, even within this
simplified scenario that leaves out many costs required to achieve productivity gains, it
can be seen that the productivity improvements required to make the furniture industry in
Ethiopia competitive are of step change nature rather than incremental. As such, these
changes would require significant external financial and technical assistance.
Figure 41: Hypothetical Scenario for Achieving Export Competitiveness, Option 2
103
Ethiopia is King of Reforestation, February 2010, United Nations Environment Program.
Hypothetical Scenario, Export Wooden Chair, Un-upholstered Addis Ababa Ethiopia Unit production cost 15.13 $ 333 $
Raw material Framing/ Assembly Finishing Packing
Admin/ OH
67.5 percent 20.0 percent 10.3 percent 1.0 percent 1.3 percent
Existing Scenario Labor 78 percent Labor 59 percent Lumber ($/m 3 ) 666 $ 333 $ Fuel/oil/ water 9 percent R & M 1 percent Avg. Wage ($/month) 60 $ $120 Electricity 5 percent Electricity 3 percent Pieces/worker/day 0.2 1.2 Consumables 4 percent Consumables 37 percent Other Costs unchanged unchanged Other 4 percent
Lumber Price ($/m 3 )
Global Development Solutions, LLC

223
V.8. Conclusions: Policy Issues and the Possibilities and Actions for Achieving
Competitiveness in Manufacture of Wooden Chairs
In current conditions, only under the most optimistic cost projection scenario would
Ethiopian, Tanzanian and Zambian furniture (wooden chairs) approach a position of
competitiveness in the international market. The key problems are a) relatively high
domestic prices of timber compared to China and Vietnam (where prices are reduced
partly by a flood in the market by logs of an unknown origin), b) relatively high cost of
labor, particularly in Tanzania and Zambia and c) very low labor productivity in terms of
chairs per worker/hour (refer to the VCA section above). China also has a highly
organized import trade in timber for re-export as wood products.
Common to the wood sectors in each of the three African countries, there are thus few if
any short to medium term strategies to improve production and export performance.
Currently there are few large-scale wood products operations, and the vast majority of
firms employ less than 50 workers. The current levels of productivity and quality appear
to be low even by the standards of neighboring countries given the low level of exports.
Over the long term, the primary avenue to gaining competitiveness must be sought in
terms of longer term upgrading to formal sector production, allowing a degree of
mechanization, and training in complementary skills.
Foreign investment in furniture has been minimal and there is no known trend towards an
increase, which suggests that productivity and other improvements needed in the industry
are not likely to come via know-how transfer of foreign investors.