Embed Size (px)
Citation preview

Niccolo Bassani Adam Niedzwiecki Angelo Collotta Matteo Maretti Wim Broothaerts Marco Mazzara Joachim Kreysa
Comparative testing round:
ILC-EURL-GMFF-CT-02/13
Comparative Testing Report on the
Detection and Quantification of GM
Events in Rice Noodles
2014
Report EUR 26863 EN

European Commission
Joint Research Centre
Institute for Health and Consumer Protection
Contact information
Molecular Biology and Genomics Unit
Address: Joint Research Centre, Via Enrico Fermi 2749, TP 201, 21027 Ispra (VA), Italy
E-mail: [email protected]
Tel.: +39 0332 78 5165
Fax: +39 0332 78 9333
https://ec.europa.eu/jrc
Legal Notice
This publication is a Science and Policy Report by the Joint Research Centre, the European Commission’s in-house science
service. It aims to provide evidence-based scientific support to the European policy-making process. The scientific output
expressed does not imply a policy position of the European Commission. Neither the European Commission nor any person
acting on behalf of the Commission is responsible for the use which might be made of this publication.
All images © European Union 2014
JRC91953
EUR 26863 EN
ISBN 978-92-79-43165-4 (PDF)
ISSN 1831-9424 (online)
doi: 10.2788/17942
Luxembourg: Publications Office of the European Union, 2014
© European Union, 2014
Reproduction is authorised provided the source is acknowledged.
Abstract
The European Union Reference Laboratory for Genetically Modified Food and Feed (EU-RL GMFF), accredited under ISO/IEC
17043, organised a comparative testing (CT) round for National Reference Laboratories (NRLs) nominated under
Regulation (EC) No 882/2004, with voluntary participation of other official control laboratories.
The test items consisted of rice noodles and commercial soybeans spiked with ground powder of soybean event DP-
356043-5 in two different concentrations (Level 1 and 2). Participants were required to perform species identification and
test for the presence of any GM event in the two test items. Any event detected then had to be quantified. Participants
could report the results in mass/mass % or copy/copy % and the EU-RL GMFF calculated the robust means (R) for Level 1
and 2 test items accordingly. The target standard deviation for CT was fixed by the Advisory Board for Comparative
Testing at 0.2 for the event, based on the experience of previous CT rounds. The robust means and target standard
deviation were used to derive z-scores for the participants’ results.
Eighty-eight laboratories from 42 countries registered for this CT round, of which 85 laboratories from 41 countries
returned at least qualitative test results.
When performing species identification, almost all laboratories correctly identified soybean and rice in both test items, and
a few laboratories also detected maize and/or oilseed rape. In total 71 laboratories reported the presence of GM material
in the test items, but 14 laboratories failed in this task. All of the 71 laboratories, except eight, correctly identified
soybean event DP-356043-5 in the test items.
Results of the quantitative evaluation of the GM content were satisfactory for both measurement units, with only two
NRLs appointed under Regulation (EC) No 1981/2006 (one measuring in m/m % and one in cp/cp %) obtaining
unsatisfactory z-scores (|z| ≥ 2.0) for both test items.
Despite the overall satisfactory outcome of this CT round, only 58 % of participants provided information on
measurement uncertainty in a complete and consistent manner, and further improvement in this crucial area is needed.

EURL-CT-02/13 CTR Final
EU-RL GMFF: Comparative testing report 1/62
EUROPEAN COMMISSION JOINT RESEARCH CENTRE
Institute for Health and Consumer Protection Molecular Biology and Genomics Unit
Comparative Testing Report on the Detection and
Quantification of GM Events in Rice Noodles
Comparative testing round: ILC-EURL-GMFF-CT-02/13
Date of issue: 16 October 2014
Report number: EURL-CT-02/13 CTR
Status: Final report
Confidentiality statement: The laboratory codes assigned to each participant in this
comparative testing round are confidential. However, the EU-RL GMFF will disclose
details of the National Reference Laboratories that have been appointed under
Regulation (EC) No 882/2004 to DG SANCO.
ISO/IEC 17043 Accreditation Proficiency Test Provider by:
EURL-CT-02/13 CTR Final
EU-RL GMFF: Comparative testing report 2/62
Address of Comparative Testing Provider
European Commission, Joint Research Centre (JRC)
Institute for Health and Consumer Protection (IHCP)
Molecular Biology and Genomics Unit – European Union Reference Laboratory for Genetically Modified
Food and Feed (EU-RL GMFF)
Via E. Fermi 2749, I-21027 Ispra (VA), Italy
E-mail: [email protected]
Phone: +39 0332 78 6518
Coordinator
Marco Mazzara
Phone: +39 0332 78 5773
E-mail: [email protected]

EURL-CT-02/13 CTR Final
EU-RL GMFF: Comparative testing report 3/62
Executive Summary
The European Union Reference Laboratory for Genetically Modified Food and Feed (EU-RL GMFF),
accredited under ISO/IEC 17043, organised a comparative testing (CT) round for National Reference
Laboratories (NRLs) nominated under Regulation (EC) No 882/2004, with voluntary participation of
other official control laboratories.
The test items consisted of rice noodles and commercial soybeans spiked with ground powder of
soybean event DP-356043-5 in two different concentrations (Level 1 and 2). Participants were
required to perform species identification and test for the presence of any GM event in the two test
items. Any event detected then had to be quantified. Participants could report the results in
mass/mass % or copy/copy % and the EU-RL GMFF calculated the robust means (µR) for Level 1 and
2 test items accordingly. The target standard deviation for CT was fixed by the Advisory Board for
Comparative Testing at 0.2 for the event, based on the experience of previous CT rounds. The robust
means and target standard deviation were used to derive z-scores for the participants’ results.
Eighty-eight laboratories from 42 countries registered for this CT round, of which 85 laboratories from
41 countries returned at least qualitative test results.
When performing species identification, almost all laboratories correctly identified soybean and rice in
both test items, and a few laboratories also detected maize and/or oilseed rape. In total 71
laboratories reported the presence of GM material in the test items, but 14 laboratories failed in this
task. All of the 71 laboratories, except eight, correctly identified soybean event DP-356043-5 in the
test items.
Results of the quantitative evaluation of the GM content were satisfactory for both measurement
units, with only two NRLs appointed under Regulation (EC) No 1981/2006 (one measuring in m/m %
and one in cp/cp %) obtaining unsatisfactory z-scores (|z| ≥ 2.0) for both test items.
Despite the overall satisfactory outcome of this CT round, only 58 % of participants provided
information on measurement uncertainty in a complete and consistent manner, and further
improvement in this crucial area is needed.
EURL-CT-02/13 CTR Final
EU-RL GMFF: Comparative testing report 4/62
Content 1. Introduction ..................................................................................................................... 6
2. Test items ......................................................................................................................... 8
2.1 Characterisation of base materials ......................................................................................... 8
2.2 Preparation and characterisation of test items ....................................................................... 8
3. Tasks to be performed by participants ............................................................................ 9
4. Results .............................................................................................................................. 9
4.1 Species identification ............................................................................................................ 9
4.2 GM detection ...................................................................................................................... 11
4.3 GM event(s) identification .................................................................................................... 11
4.4 GM event(s) quantification ................................................................................................... 12
4.4.1 Quantitative results from the participants ....................................................................... 12
4.4.3 Laboratories' performance ............................................................................................. 13
5. Discussion of results ...................................................................................................... 15
5.1 Overall performance ............................................................................................................ 15
5.2 Measurement uncertainty .................................................................................................... 17
6. Conclusions .................................................................................................................... 18
References ......................................................................................................................... 19
Acknowledgements ............................................................................................................ 20
Annex 1: Homogeneity and stability of test items ............................................................. 22
A1.1 Homogeneity of test items ................................................................................................ 22
A1.2 Stability of test items ....................................................................................................... 23
Annex 2: Species identification .......................................................................................... 24
A2.1 Rice ................................................................................................................................. 24
A2.2 Soybean ........................................................................................................................... 25
A2.3 Maize ............................................................................................................................... 26
A2.4 Oilseed Rape .................................................................................................................... 27
Annex 3: Performance statistics ........................................................................................ 28
Annex 4: Participants' results ............................................................................................ 29
Annex 5: Questionnaire data ............................................................................................. 38
Annex 6: Invitation letter .................................................................................................. 57
Annex 7: Accompanying letter to shipment of samples..................................................... 59
Annex 8: Confirmation of shipment ................................................................................... 61
Annex 9: Acknowledgement of receipt .............................................................................. 62
EURL-CT-02/13 CTR Final
EU-RL GMFF: Comparative testing report 5/62
Drafted by:
W. Broothaerts (Scientific officer) _____________________________
N. Bassani (Data analysis officer) _____________________________
Reviewers - Members of the Advisory Board:
B. China _____________________________
P. Corbisier _____________________________
H. Hird _____________________________
L. Hougs _____________________________
M. Sandberg _____________________________
M. Schulze _____________________________
I. Taverniers _____________________________
Scientific and technical approval:
M. Mazzara (Competence group leader) _____________________________
Compliance with EU-RL Quality System:
S. Cordeil (Quality manager) _____________________________
Authorisation to publish:
J. Kreysa (Head of Unit) _____________________________

EURL-CT-02/13 CTR Final
EU-RL GMFF: Comparative testing report 6/62
1. Introduction
The Joint Research Centre (JRC) of the European Commission was established as European Union
Reference Laboratory for GM Food and Feed by Regulation (EC) No 1829/2003(1). The EU-RL GMFF is
also mandated by Regulation (EC) No 882/2004(2).
Article 32 of Regulation (EC) No 882/2004 tasks the EU-RLs with the organisation of comparative
testing (CT) for National Reference Laboratories (NRLs, nominated under Regulation 882/2004) and
an appropriate follow-up of such testing. The aim of this activity is ‘to contribute to a high quality and
uniformity of analytical results’(2). Moreover, Article 12 of the said Regulation requires that the
nominated NRLs should be accredited under ISO/IEC 17025 on ‘General requirements for the
competence of testing and calibration laboratories’ and 17025-accredited laboratories must prove
their competence, e.g. by taking part in comparative testing. The EU-RL GMFF is accredited under
ISO/IEC 17043(3) to organise CT rounds.
Regulations (EC) No 1829/2003 and (EU) No 619/2011 establish a threshold for labelling of food and
feed products (0.9 %) and a minimum required performance limit (0.1 % m/m) for detecting low level
presence of GMO in feed. These values are used by the Member States of the European Union in the
official control of food and feed. Hence, an accurate determination of the GM content is of paramount
importance.
The EU-RL GMFF organised a comparative testing round for NRLs nominated under Regulation (EC)
No 882/2004. Participation was open and free of charge for any official control laboratory.
Participation was mandatory for NRLs nominated under Regulation (EC) No 882/2004 and highly
recommended for NRLs nominated under Regulation (EC) No 1981/2006(3). This comparative testing
round met the requirements of ISO/IEC 17043.
In March 2014, a total of 155 laboratories were invited to participate in this CT round of the EU-RL
GMFF (ILC-EURL-GMFF-CT-02/13) and 88 laboratories from 42 countries registered for it. Test items
were prepared by the EU-RL and shipped to registered participants in mid-April 2014 in plastic
containers containing approximately 10 g of flour. The EU-RL GMFF managed the on-line registration
and submission of results and was responsible for their evaluation. It was supported by the Advisory
Board for CT.
Eighty-five laboratories from 41 countries returned at least qualitative results (see Figures 1 and 2).
These laboratories fell into the following groups:
1. 2 were NRLs nominated only under Regulation (EC) No 882/2004 (group 1),
2. 23 were NRLs nominated only under Regulation (EC) No 1981/2006 (group 2),
3. 28 were NRLs nominated under both Regulations (group 3),
4. 5 were ENGL members but did not belong to group 1, 2 or 3 (group 4),
5. 9 were official control laboratories from EU Member States but not ENGL members (group
5),
6. 18 were official control laboratories from a third country (group 6).

EURL-CT-02/13 CTR Final
EU-RL GMFF: Comparative testing report 7/62
Figure 1. Laboratories submitting at least qualitative results, divided by group.
Figure 2. Overview of laboratories submitting at least qualitative results, divided by country.
EURL-CT-02/13 CTR Final
EU-RL GMFF: Comparative testing report 8/62
2. Test items
The test items were produced in-house by the EU-RL GMFF from ground powder of DP-356043-5,
provided by IRMM, Geel (Belgium) and rice noodles and soybeans purchased at the local market.
2.1 Characterisation of base materials
Base materials consisted of:
• 6000 g of non-GM rice noodles
• 500 g of non-GM soybeans
• 300 g of GM soybean event DP-356043-5 powder provided by IRMM, Geel, Belgium
Non-GM materials were ground using an Ultra Centrifugal Mill ZM200 (Retsch GmbH, DE). An oven-
drying method was used for determining the remaining water content in the powders. To determine
the extractability of DNA from the GM and non-GM base materials, DNA was extracted from each of
the powders in 10 independent replicates using a modified CTAB method. Extracted DNA was
quantified with Picogreen in a VersaFluor Fluorometer.
Four DNA extracts, randomly chosen from the 10 replicates, were assessed for the presence of
inhibitors using the validated le1 reference gene system and the amount of DNA validated for the
event-specific method for DP-356043-5 soybean. No inhibition was detected. The DNA extracts were
also assessed for the presence of GM-event(s) or species-specific DNA other than those relevant to
the present comparative testing round, using ABI pre-spotted plates(5). No other species were
identified in the base materials.
2.2 Preparation and characterisation of test items
Two levels of processed material (Level 1 and 2) test items were gravimetrically prepared to obtain
nominal concentration values of 0.7 m/m % and 1.5 m/m % DP-356043-5 soybean.
These test items were prepared by the EU-RL GMFF in accordance with ISO Guide 34(6) (‘General
requirements for the competence of reference material producers’), as follows:
• Two different mass fractions (mixtures) of the GM material, representing two different GM
levels, were produced by mixing pure non-GM with pure GM powder base materials, taking
into account the water content of the base materials (see Table 1 for details on mixtures);
• Each mixture was manually mixed for 10 minutes, then thoroughly mixed for 60 min in a
Turbula T10B mixer.
Table 1. Mixtures composition, in g.
GM
Noodles flour Non-GM soybean DP-356043-5 soybean
Level 1 2307.12 49.22 0.31
Level 2 2307.12 48.83 0.67
Non-GMTest items
From each of these two powder test materials, 200 test items of up to 10 g were prepared in 30 ml-
bottles using a sample divider (Retsch GmbH, Haan, DE). Bottles were labelled according to the GM
level of the test items and stored at 4°C.
EURL-CT-02/13 CTR Final
EU-RL GMFF: Comparative testing report 9/62
Homogeneity and stability testing of test items was performed in-house. Both test items were found
to be homogeneous for the GM event (p-value > 0.05), and they were found to remain stable over a
time period of 4 weeks at a 5 % significance level. Details of the testing performed are described in
Annex 1.
3. Tasks to be performed by participants
Participants in this CT round were required to analyse the two test items (Level 1 and 2), i.e.:
• Perform species identification: maize, soybean, oilseed rape and rice;
• Identify and quantify the GM event(s) detected.
Participants could report the quantitative results in m/m % or DNA cp/cp %. Additionally, laboratories
were asked to report the estimated measurement uncertainty as an absolute value, and the practical
LOD and LOQ in the appropriate measurement unit.
Participants were instructed to apply the formulas described below when reporting their results:
Mass GM event [g]
m/m % = x 100 % (1)
Total mass species [g]
GM event DNA copy numbers [cp]
cp/cp % = x 100 % (2)
Target taxon-specific DNA copy numbers [cp]
4. Results
A total of 85 laboratories from 41 countries submitted at least answers to the questionnaire and
results from species identification. Of these, 71 reported the presence of GM material at least for one
test item and 63 correctly identified soybean event DP-356043-5 in at least one test item. Quantitative
results for this event were submitted by 56 and 57 laboratories for test items 1 and 2, respectively.
4.1 Species identification
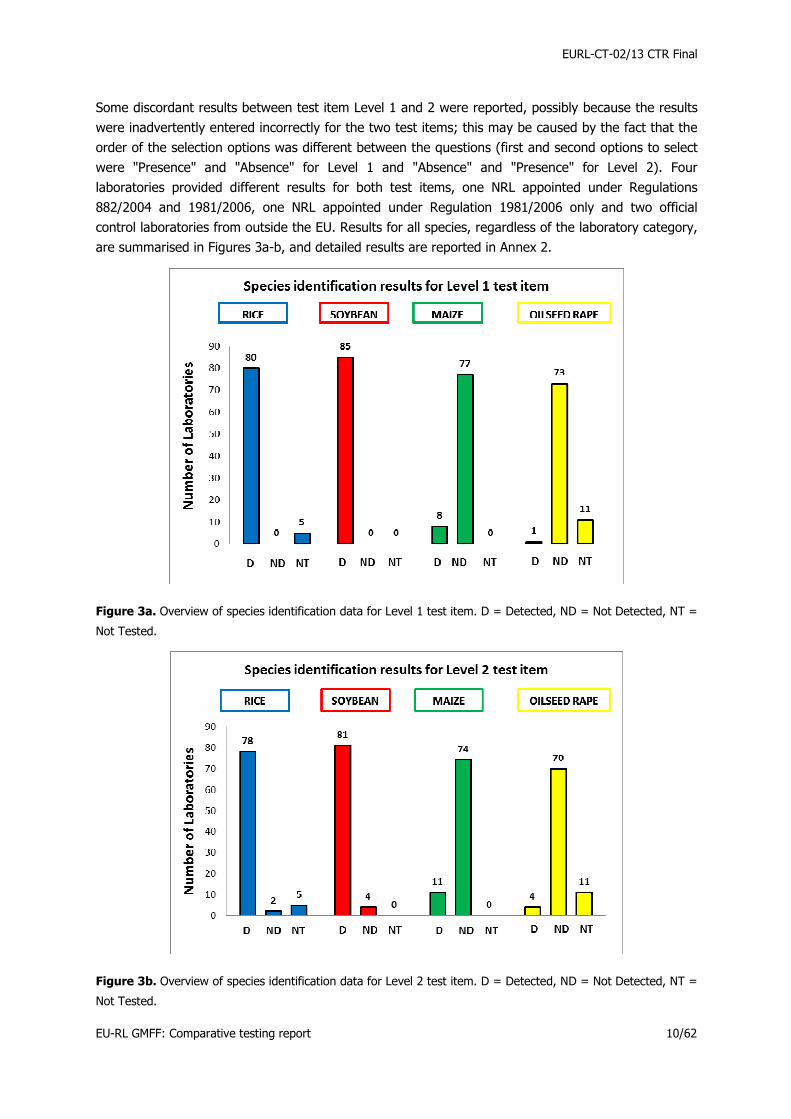
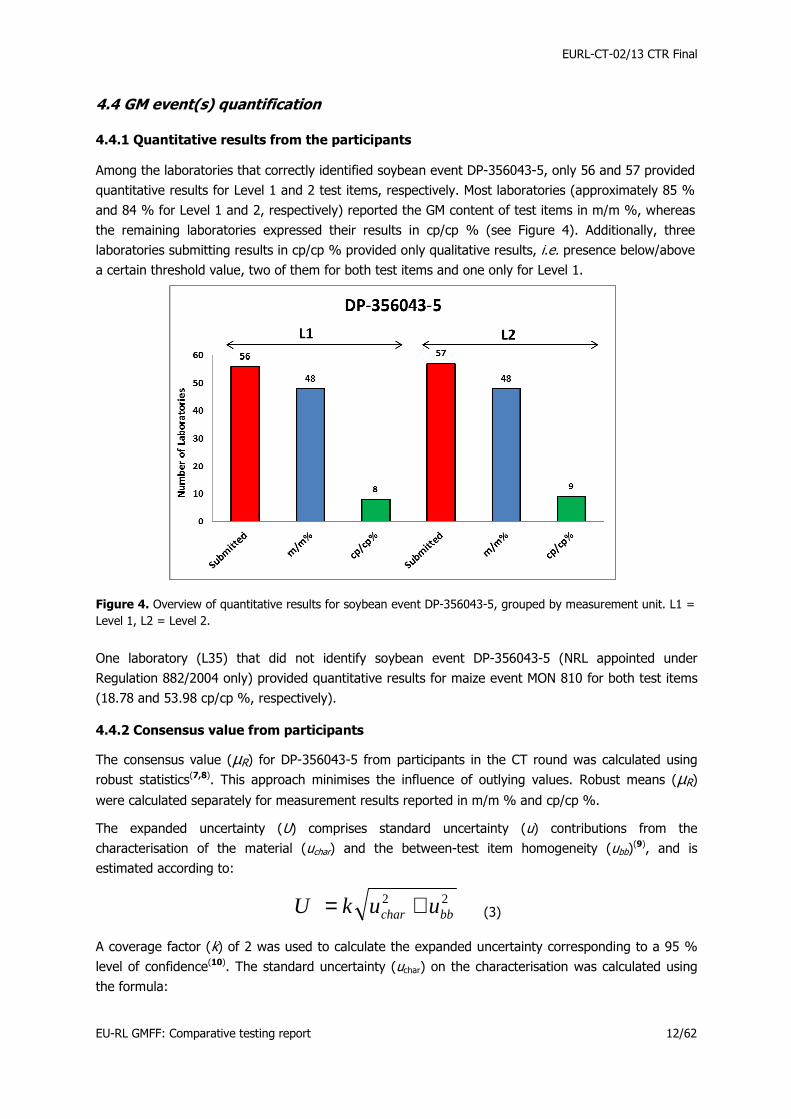
Overall, the majority of the 85 laboratories performing at least species identification correctly detected
the presence of rice and soybean (80 and 85 for Level 1, 78 and 81 for Level 2; see Figures 3a and
3b) and the absence of maize and oilseed rape (76 and 73 for Level 1, 72 and 69 for Level 2). Few
laboratories detected maize in the test items (8 and 11 for Level 1 and 2, respectively). Additionally,
the following laboratories did not test for rice or oilseed rape (5 and 11 laboratories, respectively):
• No testing for rice: one NRL appointed under both Regulations 882/2004 and 1981/2006 and
4 non-NRLs;
• No testing for oilseed rape: one NRL appointed under Regulation 1981/2006 only and 10 non-
NRLs.
EURL-CT-02/13 CTR Final
EU-RL GMFF: Comparative testing report 10/62
Some discordant results between test item Level 1 and 2 were reported, possibly because the results
were inadvertently entered incorrectly for the two test items; this may be caused by the fact that the
order of the selection options was different between the questions (first and second options to select
were "Presence" and "Absence" for Level 1 and "Absence" and "Presence" for Level 2). Four
laboratories provided different results for both test items, one NRL appointed under Regulations
882/2004 and 1981/2006, one NRL appointed under Regulation 1981/2006 only and two official
control laboratories from outside the EU. Results for all species, regardless of the laboratory category,
are summarised in Figures 3a-b, and detailed results are reported in Annex 2.
Figure 3a. Overview of species identification data for Level 1 test item. D = Detected, ND = Not Detected, NT =
Not Tested.
Figure 3b. Overview of species identification data for Level 2 test item. D = Detected, ND = Not Detected, NT =
Not Tested.

EURL-CT-02/13 CTR Final
EU-RL GMFF: Comparative testing report 11/62
4.2 GM detection
Of the 85 laboratories performing species identification, 71 reported information on the detection of
GM material, i.e. they detected the presence of either p35S or T-nos or both GM elements. The
remaining 14 laboratories, listed in Table 2, did not detect any GM element or GM event. Among
these 14 laboratories, there were 3 NRLs, 5 official control laboratories from within the EU and 6 from
third countries.
Table 2. Laboratories that performed species identification but did not report any GM event or GM element.
.
L09 3 (NRLs/882-1981)
L13 3 (NRLs/882-1981)
L40 2 (NRLs/1981)
L06 5 (Off contr EU)
L14 5 (Off contr EU)
L79 5 (Off contr EU)
L80 5 (Off contr EU)
L84 5 (Off contr EU)
L12 6 (Off contr non-EU)
L39 6 (Off contr non-EU)
L41 6 (Off contr non-EU)
L49 6 (Off contr non-EU)
L51 6 (Off contr non-EU)
L54 6 (Off contr non-EU)
Laboratory number
Group
4.3 GM event(s) identification
Of the 71 laboratories that detected GM material, 62 and 63 correctly identified soybean event DP-
356043-5 in Level 1 and 2 test items, respectively. Of the laboratories identifying events other than
DP-356043-5, one NRL appointed under Regulation 882/2004 only identified MON 810 maize and two
laboratories, including one NRL appointed under Regulation 1981/2006, only identified 40-3-2 (RR)
soybean. Five other official control laboratories, two from the EU and three from third countries, only
reported the presence of GM elements (p35S, T-nos) without performing further GM event
identification (Table 3).
Table 3. Laboratories identifying GM events other than soybean event DP-356043-5 or only reporting GM elements (names of events and elements are as reported by the participants).
L35 1 (NRLs/882) MON810 -
L32 2 (NRLs/1981) RR soy -
L36 5 (Off contr EU) 35S -
L66 5 (Off contr EU) P35S NOS
L63 6 (Off contr non-EU) P35S -
L69 6 (Off contr non-EU) P35S -
L82 6 (Off contr non-EU) P35S -
L83 6 (Off contr non-EU) Soybean Line GTS 40-3-2 -
Laboratory number
GroupEvent/
Element 1Event/
Element 2
EURL-CT-02/13 CTR Final
EU-RL GMFF: Comparative testing report 12/62
4.4 GM event(s) quantification
4.4.1 Quantitative results from the participants
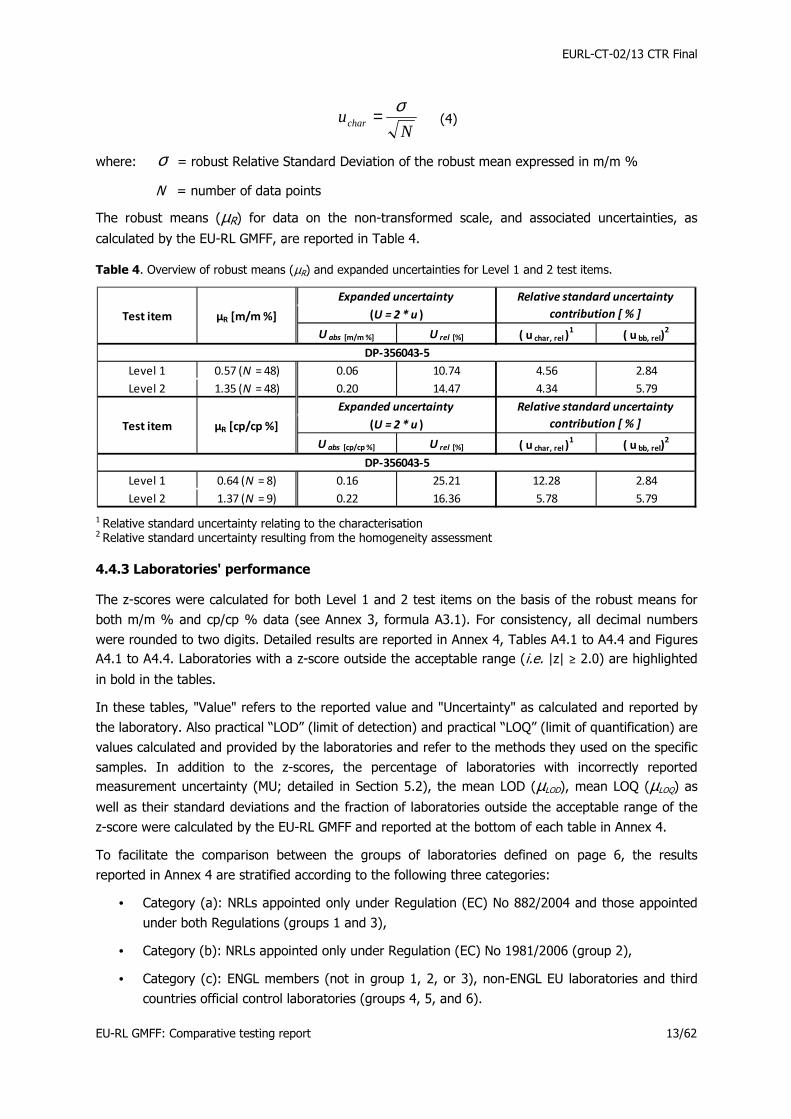
Among the laboratories that correctly identified soybean event DP-356043-5, only 56 and 57 provided
quantitative results for Level 1 and 2 test items, respectively. Most laboratories (approximately 85 %
and 84 % for Level 1 and 2, respectively) reported the GM content of test items in m/m %, whereas
the remaining laboratories expressed their results in cp/cp % (see Figure 4). Additionally, three
laboratories submitting results in cp/cp % provided only qualitative results, i.e. presence below/above
a certain threshold value, two of them for both test items and one only for Level 1.
Figure 4. Overview of quantitative results for soybean event DP-356043-5, grouped by measurement unit. L1 =
Level 1, L2 = Level 2.
One laboratory (L35) that did not identify soybean event DP-356043-5 (NRL appointed under
Regulation 882/2004 only) provided quantitative results for maize event MON 810 for both test items
(18.78 and 53.98 cp/cp %, respectively).
4.4.2 Consensus value from participants
The consensus value (µR) for DP-356043-5 from participants in the CT round was calculated using
robust statistics(7,8). This approach minimises the influence of outlying values. Robust means (µR)
were calculated separately for measurement results reported in m/m % and cp/cp %.
The expanded uncertainty (U) comprises standard uncertainty (u) contributions from the
characterisation of the material (uchar) and the between-test item homogeneity (ubb)(9), and is
estimated according to:
22bbchar uukU += (3)
A coverage factor (k) of 2 was used to calculate the expanded uncertainty corresponding to a 95 %
level of confidence(10). The standard uncertainty (uchar) on the characterisation was calculated using
the formula:
EURL-CT-02/13 CTR Final
EU-RL GMFF: Comparative testing report 13/62
Nuchar
σ= (4)
where: σ = robust Relative Standard Deviation of the robust mean expressed in m/m %
N = number of data points
The robust means (µR) for data on the non-transformed scale, and associated uncertainties, as
calculated by the EU-RL GMFF, are reported in Table 4.
Table 4. Overview of robust means (µR) and expanded uncertainties for Level 1 and 2 test items.
U abs [m/m %] U rel [%] ( u char, rel )1
( u bb, rel)2
Level 1 0.57 (N = 48) 0.06 10.74 4.56 2.84
Level 2 1.35 (N = 48) 0.20 14.47 4.34 5.79
U abs [cp/cp %] U rel [%] ( u char, rel )1
( u bb, rel)2
Level 1 0.64 (N = 8) 0.16 25.21 12.28 2.84
Level 2 1.37 (N = 9) 0.22 16.36 5.78 5.79
Test item μR [m/m %]
μR [cp/cp %] Test item
DP-356043-5
DP-356043-5
Relative standard uncertainty
contribution [ % ](U = 2 * u )
Expanded uncertainty Relative standard uncertainty
contribution [ % ](U = 2 * u )
Expanded uncertainty
1 Relative standard uncertainty relating to the characterisation 2 Relative standard uncertainty resulting from the homogeneity assessment
4.4.3 Laboratories' performance
The z-scores were calculated for both Level 1 and 2 test items on the basis of the robust means for
both m/m % and cp/cp % data (see Annex 3, formula A3.1). For consistency, all decimal numbers
were rounded to two digits. Detailed results are reported in Annex 4, Tables A4.1 to A4.4 and Figures
A4.1 to A4.4. Laboratories with a z-score outside the acceptable range (i.e. |z| ≥ 2.0) are highlighted
in bold in the tables.
In these tables, "Value" refers to the reported value and "Uncertainty" as calculated and reported by
the laboratory. Also practical “LOD” (limit of detection) and practical “LOQ” (limit of quantification) are
values calculated and provided by the laboratories and refer to the methods they used on the specific
samples. In addition to the z-scores, the percentage of laboratories with incorrectly reported
measurement uncertainty (MU; detailed in Section 5.2), the mean LOD (µLOD), mean LOQ (µLOQ) as
well as their standard deviations and the fraction of laboratories outside the acceptable range of the
z-score were calculated by the EU-RL GMFF and reported at the bottom of each table in Annex 4.
To facilitate the comparison between the groups of laboratories defined on page 6, the results
reported in Annex 4 are stratified according to the following three categories:
• Category (a): NRLs appointed only under Regulation (EC) No 882/2004 and those appointed
under both Regulations (groups 1 and 3),
• Category (b): NRLs appointed only under Regulation (EC) No 1981/2006 (group 2),
• Category (c): ENGL members (not in group 1, 2, or 3), non-ENGL EU laboratories and third
countries official control laboratories (groups 4, 5, and 6).
EURL-CT-02/13 CTR Final
EU-RL GMFF: Comparative testing report 14/62
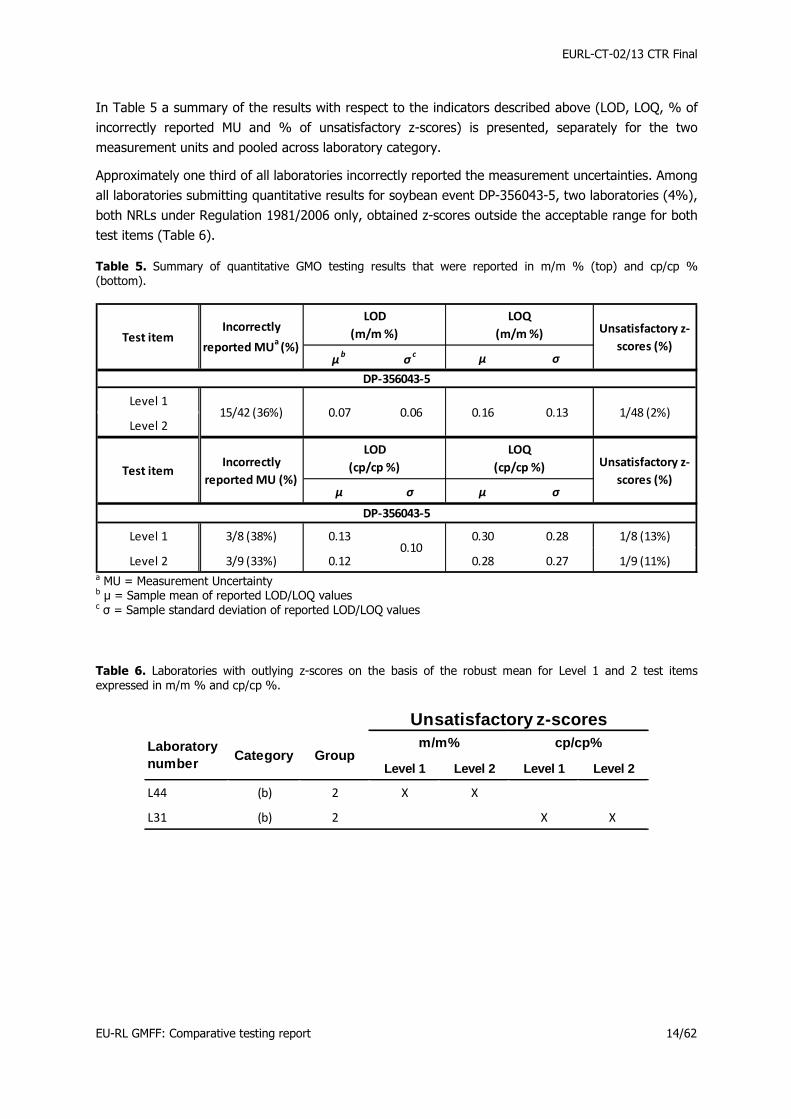
In Table 5 a summary of the results with respect to the indicators described above (LOD, LOQ, % of
incorrectly reported MU and % of unsatisfactory z-scores) is presented, separately for the two
measurement units and pooled across laboratory category.
Approximately one third of all laboratories incorrectly reported the measurement uncertainties. Among
all laboratories submitting quantitative results for soybean event DP-356043-5, two laboratories (4%),
both NRLs under Regulation 1981/2006 only, obtained z-scores outside the acceptable range for both
test items (Table 6).
Table 5. Summary of quantitative GMO testing results that were reported in m/m % (top) and cp/cp % (bottom).
μb
σc
μ σ
Level 1
Level 2
μ σ μ σ
Level 1 3/8 (38%) 0.13 0.30 0.28 1/8 (13%)
Level 2 3/9 (33%) 0.12 0.28 0.27 1/9 (11%)
Test item
0.06
Unsatisfactory z-
scores (%)
0.10
Incorrectly
reported MU (%)
LOD
(cp/cp %)
LOQ
(cp/cp %)
15/42 (36%) 0.16
DP-356043-5
DP-356043-5
0.13 1/48 (2%)
Incorrectly
reported MUa
(%)
LOD
(m/m %)
LOQ
(m/m %) Unsatisfactory z-
scores (%)
0.07
Test item
a MU = Measurement Uncertainty b µ = Sample mean of reported LOD/LOQ values c σ = Sample standard deviation of reported LOD/LOQ values
Table 6. Laboratories with outlying z-scores on the basis of the robust mean for Level 1 and 2 test items expressed in m/m % and cp/cp %.
Level 1 Level 2 Level 1 Level 2
L44 (b) 2 X X
L31 (b) 2 X X
Laboratory number
Category Groupm/m% cp/cp%
Unsatisfactory z-scores

EURL-CT-02/13 CTR Final
EU-RL GMFF: Comparative testing report 15/62
5. Discussion of results
5.1 Overall performance
In this CT round most laboratories correctly identified rice and soybean species in the test items.
Through screening for the presence of GM material, 71 out of 85 laboratories reported a positive
outcome and most of these identified the correct GM event. GM quantification was also characterised
by a satisfactory performance of most laboratories.
All underperforming laboratories for at least one of the four tasks requested in this CT round are listed
in Table 7, together with the specification of the failed task (note: this table does not include the labs
that did not correctly report the MU).
Of the 27 laboratories that underperformed at least for one task, 8 were NRLs, of which one was
appointed under Regulation 882/2004, 5 were appointed under Regulation 1981/2006 and two were
appointed under both Regulations. Of the remaining laboratories, 7 were official control laboratories
from within the EU and 12 were from third countries.
The common reason of underperformance in the species identification task was the incomplete
fulfilment of this task, i.e. the labs did not test for the presence of oilseed rape and/or rice. The
reason for this incompleteness is not clear, as the species to be screened for were clearly listed in the
invitation letter. It may be that some laboratories do not routinely test for these species, and may not
have the methods or reagents available to do so. This issue needs further investigation as it suggests
that some laboratories do not systematically test all GMOs that have been approved in the EU.
Data on GM detection were lacking for 14 laboratories, yet it is not clear if laboratories not reporting
any GM element or GM event did not detect them or did not report them correctly. On GM event
identification, over 10% of laboratories reporting the presence of GM material (i.e. 8 or 9 depending
on the test item) were not able to successfully identify soybean event DP-356043-5 that was present
in the samples at relevant levels of 0.7 and 1.5 m/m % GM for Level 1 and 2, respectively. This
finding is worrying, because this CT round mimicked real-life samples that may be received by a
laboratory and are subjected to GM testing. The underperformance of a number of laboratories in
these tasks highlights the need for further guidance in this area.
GM quantification results (for DP-356043-5 soybean), on the other hand, were satisfactory, indicating
that most laboratories that provided quantitative data are successful in performing quantitative
analyses for this event. The results of two NRLs with z-scores (|z|) ≥ 2.0 require further investigation.

EURL-CT-02/13 CTR Final
EU-RL GMFF: Comparative testing report 16/62
Table 7. List of laboratories underperforming for one of the tasks requested and reason for underperformance.
L35 (a) 1 - -Identified maize MON
810 only
Quantitative results
for MON 810 only
L05 (a) 3 - - -No quantitative result
submitted
L09 (a) 3 -No GM presence
reported
No GM event
reported
No quantitative result
submitted
L13 (a) 3 No testing for riceNo GM presence
reported
No GM event
reported
No quantitative result
submitted
L25 (b) 2 - - -No quantitative result
submitted
L31 (b) 2 - - -|z| ≥ 2.0 for both test
items
L32 (b) 2 - -Identified RR soybean
only
No quantitative result
submitted
L40 (b) 2 -No GM presence
reported
No GM event
reported
No quantitative result
submitted
L44 (b) 2 - - -|z| ≥ 2.0 for both test
items
L86 (b) 2No testing for oilseed
rape- - -
L06 (c) 5 -No GM presence
reported
No GM event
reported
No quantitative result
submitted
L14 (c) 5No testing for rice
and oilseed rape
No GM presence
reported
No GM event
reported
No quantitative result
submitted
L36 (c) 5No testing for oilseed
rape-
No GM event
reported
No quantitative result
submitted
L43 (c) 5 - - -No quantitative result
submitted
L66 (c) 5 - -No GM event
reported
No quantitative result
submitted
L79 (c) 5 -No GM presence
reported
No GM event
reported
No quantitative result
submitted
L80 (c) 5No testing for oilseed
rape
No GM presence
reported
No GM event
reported
No quantitative result
submitted
L84 (c) 5No testing for oilseed
rape
No GM presence
reported
No GM event
reported
No quantitative result
submitted
L12 (c) 6 -No GM presence
reported
No GM event
reported
No quantitative result
submitted
L39 (c) 6No testing for oilseed
rape
No GM presence
reported
No GM event
reported
No quantitative result
submitted
L41 (c) 6
Soybean not detected
in Level 2;
no testing for rice and
oilseed rape
No GM presence
reported
No GM event
reported
No quantitative result
submitted
L49 (c) 6 -No GM presence
reported
No GM event
reported
No quantitative result
submitted
L50 (c) 6 No testing for rice - - -
L51 (c) 6 -No GM presence
reported
No GM event
reported
No quantitative result
submitted
L54 (c) 6 -No GM presence
reported
No GM event
reported
No quantitative result
submitted
L63 (c) 6 - -No GM event
reported
No quantitative result
submitted
L67 (c) 6No testing for oilseed
rape- - -
L69 (c) 6No testing for oilseed
rape-
No GM event
reported
No quantitative result
submitted
L82 (c) 6No testing for rice
and oilseed rape-
No GM event
reported
No quantitative result
submitted
L83 (c) 6No testing for oilseed
rape-
Identified soybean 40-
3-2 only
No quantitative result
submitted
GM quantificationLaboratory number
Category GroupSpecies
identificationGM detection GM identification
"-" means no underperformance for a task was observed.
EURL-CT-02/13 CTR Final
EU-RL GMFF: Comparative testing report 17/62
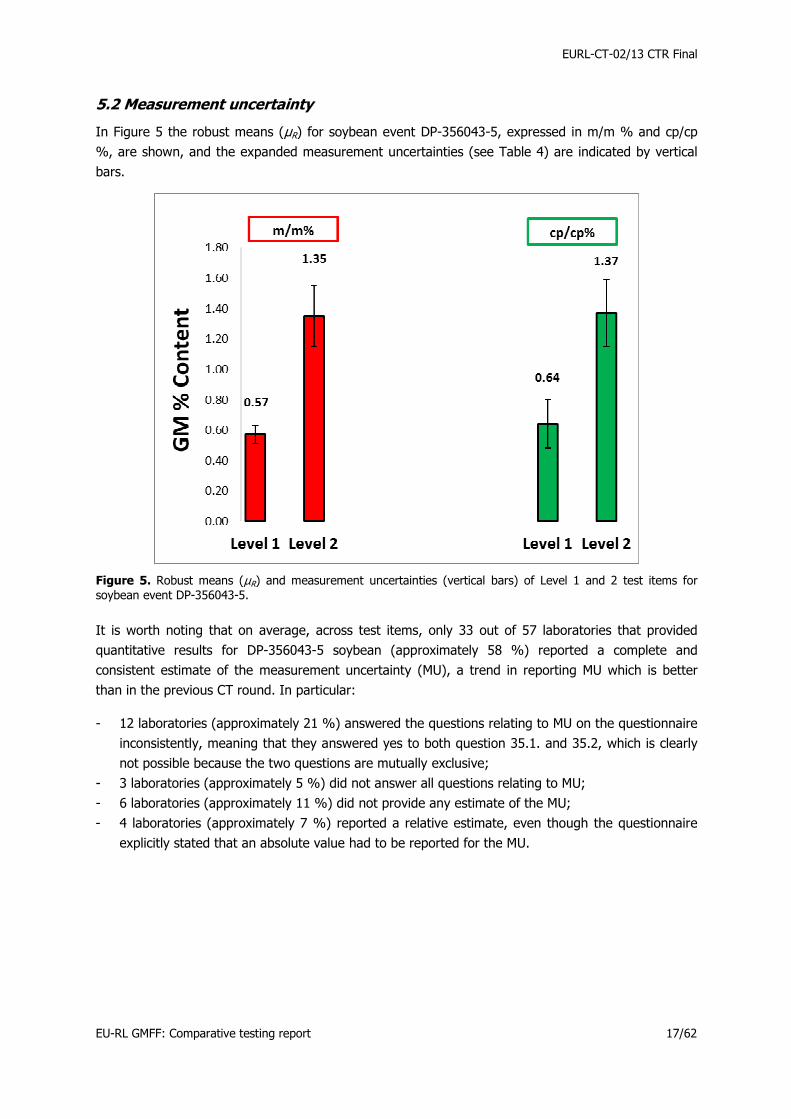
5.2 Measurement uncertainty
In Figure 5 the robust means (µR) for soybean event DP-356043-5, expressed in m/m % and cp/cp
%, are shown, and the expanded measurement uncertainties (see Table 4) are indicated by vertical
bars.
Figure 5. Robust means (µR) and measurement uncertainties (vertical bars) of Level 1 and 2 test items for soybean event DP-356043-5.
It is worth noting that on average, across test items, only 33 out of 57 laboratories that provided
quantitative results for DP-356043-5 soybean (approximately 58 %) reported a complete and
consistent estimate of the measurement uncertainty (MU), a trend in reporting MU which is better
than in the previous CT round. In particular:
- 12 laboratories (approximately 21 %) answered the questions relating to MU on the questionnaire
inconsistently, meaning that they answered yes to both question 35.1. and 35.2, which is clearly
not possible because the two questions are mutually exclusive;
- 3 laboratories (approximately 5 %) did not answer all questions relating to MU;
- 6 laboratories (approximately 11 %) did not provide any estimate of the MU;
- 4 laboratories (approximately 7 %) reported a relative estimate, even though the questionnaire
explicitly stated that an absolute value had to be reported for the MU.

EURL-CT-02/13 CTR Final
EU-RL GMFF: Comparative testing report 18/62
6. Conclusions
Participants in this CT round were required to analyse two test items consisting of a mixture of rice
noodles and soybean event DP-356043-5 at different concentrations (Level 1 and 2 test items), i.e.:
• Perform species identification: maize, soybean, oilseed rape and rice
• Identify and quantify the GM event(s) detected.
Laboratories' performance, with respect to the different tasks to be performed, has been overall
satisfactory, with some exceptions. The following general conclusions could be drawn:
• Despite the fact that almost all laboratories correctly detected soybean and rice, there were
few that did not test for all species, though explicitly requested. The reason for this deficiency
has to be investigated. In principle, every laboratory should be able to screen for all the
common plant species, as real-life samples generally come without any a priori information on
the sample matrix.
• A failure in GM detection or reporting of such data was noted for a number of laboratories
and further follow-up is needed, e.g. by requesting additional information to the laboratories
and addressing any problems reported.
• The failure in the identification of soybean event DP-356043-5 by a number of laboratories
suggests that improvements are needed in this area, as in principle all laboratories should be
able to identify an event for which a validated method exists, without possessing any
information on the event(s) actually present in the samples.
• Most laboratories that quantified soybean event DP-356043-5 performed satisfactorily on this
task.
In general, it is important that the competence of a laboratory to fulfil its mandate is measured not
only by evaluating z-scores on the quantitative results obtained, but by investigating the whole
analytical approach from species identification, GM detection and identification, and finally GM event
quantification. Such comprehensive evaluation allows identifying issues and limitations in current
practices and should on the long term improve and harmonise the performance of GMO testing
laboratories.
The measurement uncertainty (MU) was, on average across concentration levels, reported in a
complete and consistent manner by approximately 58 % of laboratories, a result which is better than
the one obtained in the previous CT round (46 %, p-value > 0.05 with Normal approximation test).
Despite this improvement, and given the importance of a correct estimation of the measurement
uncertainty, there is still a need to provide laboratories with guidance and training on this topic.

EURL-CT-02/13 CTR Final
EU-RL GMFF: Comparative testing report 19/62
References
1. European Commission (2003). Regulation (EC) No 1829/2003 of the European Parliament and
of the Council of 22 September 2003 on genetically modified food and feed. Off. J. Eur. Union
L 268: 1-23
2. European Commission (2004). Regulation (EC) No 882/2004 of the European Parliament and
of the Council of 29 April 2004 on official controls performed to ensure the verification of
compliance with feed and food law, animal health and animal welfare rules. Off. J. Eur. Union
L 191: 1-52
3. ISO/IEC 17043:2010 Conformity assessment – General requirements for proficiency testing
4. European Commission (2006). Regulation (EC) No 1981/2006 of 22 December 2006 on
detailed rules for the implementation of Article 32 of Regulation (EC) No 1829/2003 of the
European Parliament and of the Council as regards the Community reference laboratory for
genetically modified organisms. Off. J. Eur. Union L 368: 99-109
5. Querci, M., Foti, N., Bogni, B., Kluga, L., Broll, H. & Van den Eede, G. (2009). Real-time PCR-
based ready-to-use multi-target analytical system for GMO detection. Food Anal. Methods
2(4): 325-336
6. ISO Guide 34:2009 General requirements for the competence of reference material producers
7. Analytical Methods Committee (1989). Robust statistics – How not to reject outliers Part 1.
Basic Concepts. Analyst 114: 1359-1364
8. Analytical Methods Committee (2001). Robust statistics: a method for coping with outliers.
AMC Technical Brief. No. 6. April 2001
9. JCGM 100:2008 Evaluation of measurement data - Guide to the Expression of Uncertainty in
Measurement
10. EURACHEM/CITAC Guide CG4 (2000). Quantifying Uncertainty in Analytical Measurement, 2nd
edition
11. ISO 13528:2005 Statistical methods for use in proficiency testing by interlaboratory
comparisons
12. Thompson, M., Wood, R. (1993). The international harmonized protocol for the proficiency
testing of (chemical) analytical laboratories. J. AOAC Int. 76: 926-940
13. Powell, J., Owen, L. (2002). Reliability of Food Measurements: The Application of Proficiency
Testing to GMO Analysis. Accred. Qual. Ass. 7: 392-402
14. Linsinger, TPJ., van der Veen, AMH., Gawlik, BM., Pauwels, J., Lamberty, A. (2004). Planning
and combining of isochronous stability studies of CRMs. Accred. Qual. Assur. 9: 464-472
15. Thompson, M., Ellison, SLR., Owen, L., Mathieson, K., Powell, J., Key, P., Wood, R., Damant,
AP. (2006). Scoring in Genetically Modified Organism Proficiency Tests Based on Log-
Transformed Results. J. AOAC Int. 89: 232-239
16. Analytical Methods Committee (2004). GMO Proficiency Testing: Interpreting z-scores derived
from log-transformed data. RSC. AMC Technical Brief. No. 18. December 2004

EURL-CT-02/13 CTR Final
EU-RL GMFF: Comparative testing report 20/62
Acknowledgements
With respect to the raw material(s) used in this study we kindly acknowledge IRMM, JRC-Geel for
providing the ground powder of soybean event DP-356043-5. We sincerely thank Adam Niedzwiecki,
Matteo Maretti, Angelo Collotta, Fabrizia Scabini, Roberta Brustio, Stéphane Cordeil, Steven Price and
Lorella Vidmar, of the MBG Unit and EU-RL GMFF for their invaluable contributions to this eighth
comparative testing round.
The CT-Advisory Board members (Bernard China, Philippe Corbisier, Hez Hird, Lotte Hougs, Martin
Sandberg, Manuela Schulze and Isabel Taverniers) have provided invaluable input for the planning
and analysis of the CT round and intensively revised and agreed to this report. Their constructive
contribution is highly appreciated.
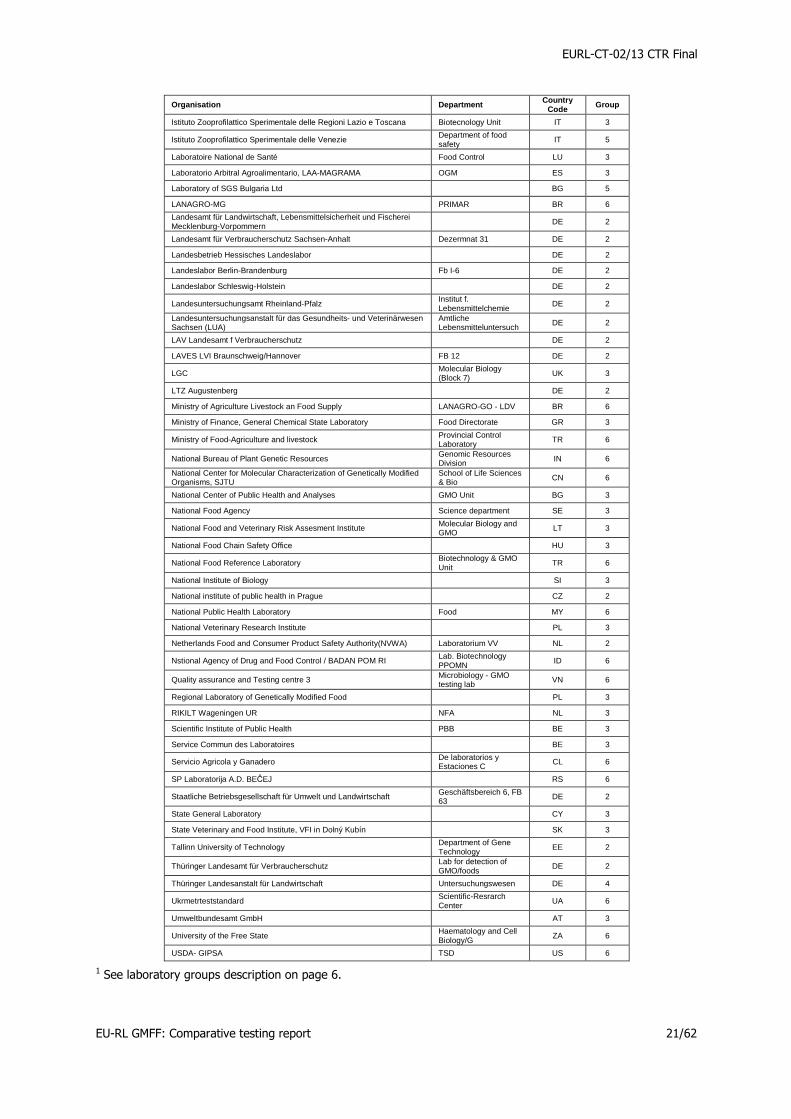
The laboratories listed below are kindly acknowledged for their participation in this exercise.
Organisation Department Country Code Group
AGES - Institute for Food Safety Vienna AT 3
Agricultural Genetics Institute GMO Detection Laboratory
VN 6
Agricultural Institute of Slovenia SL 2
Agri-Food and Veterinary Authority of Singapore Laboratories Group SG 6
Agroscope, Institute for Livestock Sciences ILS Feed Biology CH 6
American University of Science and Technology Laboratory Science &Technology
LB 6
ASL Milano 1 Laboratorio DI Prevenzione
IT 5
Bavarian Health and Food Safety Authority (LGL) DE 2
BIOMI LTD HU 4
Bundesamt für Verbraucherschutz und Lebensmittelsicherheit DE 1
Centre wallon de recherches agronomiques Valorisation des productions BE 3
Centro Nacional de Alimentacion (Agencia Espanola de Consumo Seguridad Alimentaria y Nutricion)
Biotechnology Unit ES 3
Chemischen und Veterinäruntersuchungsamt Rhein-Ruhr-Wupper (CVUA-RRW)
FG 40-5 DE 4
CRA-SCS sede di Tavazzano-Laboratorio
IT 2
Croatian centre for agriculture, food and rural affairs, Institute for seed and seedlings
Seed testing laboratory HR 4
Crop Research Institute CZ 3
CVUA Freiburg GMO Testing DE 2
Danish Veterinary and Food Agency Plantdiagnostics DK 3
ERSA Servizio fitosanitario IT 5
FASFC FASFC Melle BE 5
Federal Food Safety and Veterinary Office FSVO Risk Assessment Division
CH 4
Fera UK 2
Finnish Customs Laboratory FI 3
Finnish Food Safety Authority Evira Research and Laboratory Dept
FI 2
ILVO Technology & Food Sciences
BE 3
INIAV PT 3
Institut für Hygiene und Umwelt Gentechnik DE 2
Institute for Animal Health, Food Safety and Environment Virology LV 3
Institute for Diagnosis and Animal Health Molecular Biology and GMO
RO 1
Institute of Biochemistry and Biophysics PAS PL 2
Instytut Zootechniki PIB KLP Pracownia w Szczecinie PL 3
Istituto Zooprofilattico Sperimentale del Piemonte, Liguria e Valle d'Aosta
IT 5
Istituto Zooprofilattico Sperimentale della Lombardia ed Emilia Romagna
Reparto Genomica IT 5
Istituto Zooprofilattico Sperimentale della Sardegna Igiene degli Alimenti-Control
IT 5
Istituto Zooprofilattico Sperimentale dell'Abruzzo e del Molise G. Caporale Food Hygiene IT 5
EURL-CT-02/13 CTR Final
EU-RL GMFF: Comparative testing report 21/62
Organisation Department Country Code Group
Istituto Zooprofilattico Sperimentale delle Regioni Lazio e Toscana Biotecnology Unit IT 3
Istituto Zooprofilattico Sperimentale delle Venezie Department of food safety
IT 5
Laboratoire National de Santé Food Control LU 3
Laboratorio Arbitral Agroalimentario, LAA-MAGRAMA OGM ES 3
Laboratory of SGS Bulgaria Ltd BG 5
LANAGRO-MG PRIMAR BR 6
Landesamt für Landwirtschaft, Lebensmittelsicherheit und Fischerei Mecklenburg-Vorpommern
DE 2
Landesamt für Verbraucherschutz Sachsen-Anhalt Dezermnat 31 DE 2
Landesbetrieb Hessisches Landeslabor DE 2
Landeslabor Berlin-Brandenburg Fb I-6 DE 2
Landeslabor Schleswig-Holstein DE 2
Landesuntersuchungsamt Rheinland-Pfalz Institut f. Lebensmittelchemie
DE 2
Landesuntersuchungsanstalt für das Gesundheits- und Veterinärwesen Sachsen (LUA)
Amtliche Lebensmitteluntersuch
DE 2
LAV Landesamt f Verbraucherschutz DE 2
LAVES LVI Braunschweig/Hannover FB 12 DE 2
LGC Molecular Biology (Block 7)
UK 3
LTZ Augustenberg DE 2
Ministry of Agriculture Livestock an Food Supply LANAGRO-GO - LDV BR 6
Ministry of Finance, General Chemical State Laboratory Food Directorate GR 3
Ministry of Food-Agriculture and livestock Provincial Control Laboratory
TR 6
National Bureau of Plant Genetic Resources Genomic Resources Division IN 6
National Center for Molecular Characterization of Genetically Modified Organisms, SJTU
School of Life Sciences & Bio CN 6
National Center of Public Health and Analyses GMO Unit BG 3
National Food Agency Science department SE 3
National Food and Veterinary Risk Assesment Institute Molecular Biology and GMO
LT 3
National Food Chain Safety Office HU 3
National Food Reference Laboratory Biotechnology & GMO Unit
TR 6
National Institute of Biology SI 3
National institute of public health in Prague CZ 2
National Public Health Laboratory Food MY 6
National Veterinary Research Institute PL 3
Netherlands Food and Consumer Product Safety Authority(NVWA) Laboratorium VV NL 2
Nstional Agency of Drug and Food Control / BADAN POM RI Lab. Biotechnology PPOMN
ID 6
Quality assurance and Testing centre 3 Microbiology - GMO testing lab
VN 6
Regional Laboratory of Genetically Modified Food PL 3
RIKILT Wageningen UR NFA NL 3
Scientific Institute of Public Health PBB BE 3
Service Commun des Laboratoires BE 3
Servicio Agricola y Ganadero De laboratorios y Estaciones C
CL 6
SP Laboratorija A.D. BEČEJ RS 6
Staatliche Betriebsgesellschaft für Umwelt und Landwirtschaft Geschäftsbereich 6, FB 63
DE 2
State General Laboratory CY 3
State Veterinary and Food Institute, VFI in Dolný Kubín SK 3
Tallinn University of Technology Department of Gene Technology
EE 2
Thüringer Landesamt für Verbraucherschutz Lab for detection of GMO/foods
DE 2
Thüringer Landesanstalt für Landwirtschaft Untersuchungswesen DE 4
Ukrmetrteststandard Scientific-Resrarch Center
UA 6
Umweltbundesamt GmbH AT 3
University of the Free State Haematology and Cell Biology/G
ZA 6
USDA- GIPSA TSD US 6
1 See laboratory groups description on page 6.
EURL-CT-02/13 CTR Final
EU-RL GMFF: Comparative testing report 22/62
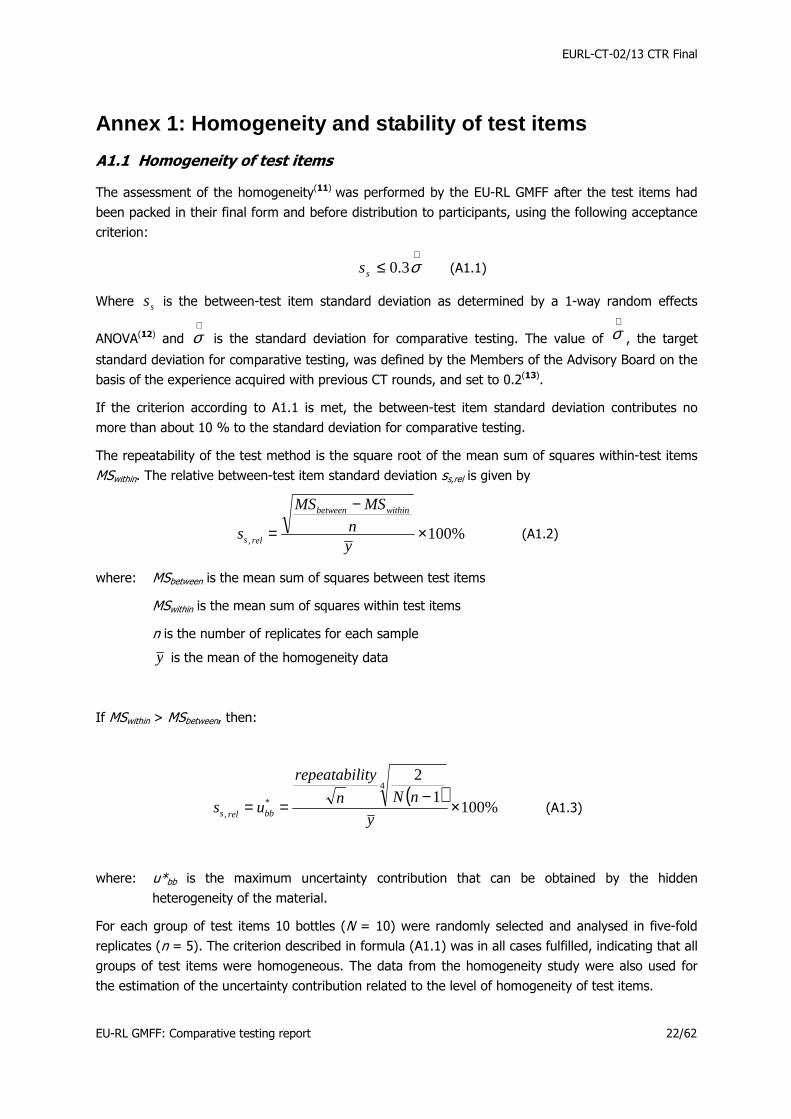
Annex 1: Homogeneity and stability of test items
A1.1 Homogeneity of test items
The assessment of the homogeneity(11) was performed by the EU-RL GMFF after the test items had
been packed in their final form and before distribution to participants, using the following acceptance
criterion:
∧≤ σ3.0ss (A1.1)
Where ss is the between-test item standard deviation as determined by a 1-way random effects
ANOVA(12) and ∧σ is the standard deviation for comparative testing. The value of
∧σ , the target
standard deviation for comparative testing, was defined by the Members of the Advisory Board on the
basis of the experience acquired with previous CT rounds, and set to 0.2(13).
If the criterion according to A1.1 is met, the between-test item standard deviation contributes no
more than about 10 % to the standard deviation for comparative testing.
The repeatability of the test method is the square root of the mean sum of squares within-test items
MSwithin. The relative between-test item standard deviation ss,rel is given by
%100, ×
−
=yn
MSMS
s
withinbetween
rels (A1.2)
where: MSbetween is the mean sum of squares between test items
MSwithin is the mean sum of squares within test items
n is the number of replicates for each sample
y is the mean of the homogeneity data
If MSwithin > MSbetween, then:
( )%100
12
4
*, ×−==
y
nNn
ityrepeatabil
us bbrels (A1.3)
where: u*bb is the maximum uncertainty contribution that can be obtained by the hidden
heterogeneity of the material.
For each group of test items 10 bottles (N = 10) were randomly selected and analysed in five-fold
replicates (n = 5). The criterion described in formula (A1.1) was in all cases fulfilled, indicating that all
groups of test items were homogeneous. The data from the homogeneity study were also used for
the estimation of the uncertainty contribution related to the level of homogeneity of test items.
EURL-CT-02/13 CTR Final
EU-RL GMFF: Comparative testing report 23/62
A1.2 Stability of test items
An isochronous short term stability study involving two Level 1 test samples with three replicates each
(N = 2, n = 3), was conducted over one, two and four weeks at +4°C and +18°C (14). The results did
not reveal an influence of time or temperature on the stability of the test items. The test items were
therefore shipped at ambient temperature. Within the time period of this comparative study, the test
materials were considered sufficiently stable.

EURL-CT-02/13 CTR Final
EU-RL GMFF: Comparative testing report 24/62
Annex 2: Species identification
A2.1 Rice
Overall, 100 % and 98 % of laboratories that tested for the presence of rice species for Level 1 and 2
test items, respectively, identified rice in the samples, without any difference between laboratory
categories. The two laboratories that did not detect this species in the Level 2 test item while
detecting it in Level 1 appears to have inadvertently indicated "absence" for the former test item for
all species, an error that might have been due to the fact that the order of the first two alternative
answers ("Absence" and "Presence") was reversed in the questionnaire between Level 1 and Level 2
questions.
Table A2.1. Results of species identification analysis for rice by laboratory category; D = Detected, ND = Not Detected. When estimating overall percentages (D and ND) per category, only laboratories that actually tested for rice were considered in the denominator.
LabCode Group Level 1 Level 2 LabCode Group Level 1 Level 2 LabCode Group Level 1 Level 2
L35 1 Detected Detected L17 2 Detected Detected L46 4 Detected Detected
L53 1 Detected Detected L20 2 Detected Detected L55 4 Detected Detected
L01 3 Detected Detected L22 2 Detected Detected L68 4 Detected Detected
L03 3 Detected Detected L23 2 Detected Detected L76 4 Detected Detected
L04 3 Detected Detected L24 2 Detected Detected L81 4 Detected Detected
L05 3 Detected Detected L27 2 Detected Detected L06 5 Detected Detected
L08 3 Detected Detected L28 2 Detected Detected L14 5 Not Tested Not Tested
L09 3 Detected Detected L29 2 Detected Detected L30 5 Detected Detected
L11 3 Detected Detected L31 2 Detected Detected L36 5 Detected Detected
L13 3 Not Tested Not Tested L32 2 Detected Not Detected L43 5 Detected Detected
L16 3 Detected Detected L33 2 Detected Detected L66 5 Detected Detected
L18 3 Detected Detected L37 2 Detected Detected L79 5 Detected Detected
L19 3 Detected Detected L40 2 Detected Detected L80 5 Detected Detected
L21 3 Detected Detected L44 2 Detected Detected L84 5 Detected Detected
L25 3 Detected Detected L48 2 Detected Detected L02 6 Detected Not Detected
L26 3 Detected Detected L52 2 Detected Detected L07 6 Detected Detected
L34 3 Detected Detected L62 2 Detected Detected L10 6 Detected Detected
L42 3 Detected Detected L71 2 Detected Detected L12 6 Detected Detected
L45 3 Detected Detected L74 2 Detected Detected L39 6 Detected Detected
L56 3 Detected Detected L75 2 Detected Detected L41 6 Not Tested Not Tested
L58 3 Detected Detected L78 2 Detected Detected L47 6 Detected Detected
L59 3 Detected Detected L86 2 Detected Detected L49 6 Detected Detected
L60 3 Detected Detected L87 2 Detected Detected L50 6 Not Tested Not Tested
L61 3 Detected Detected % D 100 96 L51 6 Detected Detected
L64 3 Detected Detected % ND 0 4 L54 6 Detected Detected
L65 3 Detected Detected L63 6 Detected Detected
L70 3 Detected Detected L67 6 Detected Detected
L72 3 Detected Detected L69 6 Detected Detected
L85 3 Detected Detected L73 6 Detected Detected
L88 3 Detected Detected L77 6 Detected Detected
% D 100 100 L82 6 Not Tested Not Tested
% ND 0 0 L83 6 Detected Detected
% D 100 96
% ND 0 4
(a) (b) (c)

EURL-CT-02/13 CTR Final
EU-RL GMFF: Comparative testing report 25/62
A2.2 Soybean
All 85 laboratories that screened for this species correctly detected it in the Level 1 test item whereas
for Level 2 81 laboratories (approximately 94 %) reported the presence of soybean in the samples.
In 4 out of 5 cases this is likely due to an error in the filling of the questionnaire rather than to an
actual error of identification; however, one laboratory acting as official control laboratory from outside
the EU actually identified soybean only in the Level 1 test item.
Table A2.2. Results of species identification analysis for soybean by laboratory category; D = Detected, ND = Not Detected. When estimating overall percentages (D and ND) per category, only laboratories that actually tested for soybean were considered in the denominator.
LabCode Group Level 1 Level 2 LabCode Group Level 1 Level 2 LabCode Group Level 1 Level 2
L35 1 Detected Detected L17 2 Detected Detected L46 4 Detected Detected
L53 1 Detected Detected L20 2 Detected Detected L55 4 Detected Detected
L01 3 Detected Detected L22 2 Detected Detected L68 4 Detected Detected
L03 3 Detected Detected L23 2 Detected Detected L76 6 Detected Detected
L04 3 Detected Detected L24 2 Detected Detected L81 4 Detected Detected
L05 3 Detected Detected L27 2 Detected Detected L06 5 Detected Detected
L08 3 Detected Detected L28 2 Detected Detected L14 5 Detected Detected
L09 3 Detected Detected L29 2 Detected Detected L30 5 Detected Detected
L11 3 Detected Detected L31 2 Detected Detected L36 5 Detected Detected
L13 3 Detected Detected L32 2 Detected Not Detected L43 5 Detected Detected
L16 3 Detected Detected L33 2 Detected Detected L66 5 Detected Detected
L18 3 Detected Detected L37 2 Detected Detected L79 5 Detected Detected
L19 3 Detected Detected L40 2 Detected Detected L80 5 Detected Detected
L21 3 Detected Detected L44 2 Detected Detected L84 5 Detected Detected
L25 2 Detected Detected L48 2 Detected Detected L02 6 Detected Not Detected
L26 3 Detected Detected L52 2 Detected Detected L07 6 Detected Detected
L34 3 Detected Detected L62 2 Detected Detected L10 6 Detected Detected
L42 3 Detected Detected L71 2 Detected Detected L12 6 Detected Detected
L45 3 Detected Detected L74 2 Detected Detected L39 6 Detected Detected
L56 3 Detected Detected L75 2 Detected Detected L41 6 Detected Not Detected
L58 3 Detected Detected L78 2 Detected Detected L47 6 Detected Detected
L59 3 Detected Detected L86 2 Detected Detected L49 6 Detected Detected
L60 3 Detected Detected L87 2 Detected Detected L50 6 Detected Detected
L61 3 Detected Detected % D 100 96 L51 6 Detected Detected
L64 3 Detected Detected % ND 0 4 L54 6 Detected Detected
L65 3 Detected Detected L63 6 Detected Detected
L70 3 Detected Detected L67 6 Detected Detected
L72 3 Detected Detected L69 6 Detected Detected
L85 3 Detected Detected L73 6 Detected Detected
L88 3 Detected Detected L77 6 Detected Detected
% D 100 100 L82 6 Detected Not Detected
% ND 0 0 L83 6 Detected Detected
% D 100 91
% ND 0 9
(a) (b) (c)

EURL-CT-02/13 CTR Final
EU-RL GMFF: Comparative testing report 26/62
A2.3 Maize
Also in this case inversion of answers presumably resulted in differences between the results reported
for Level 1 and Level 2 test items, with respectively 90 % and 87 % of laboratories correctly not
detecting maize species. A few laboratories did detect maize.
Table A2.3. Results of species identification analysis for maize by laboratory category; D = Detected, ND = Not Detected. When estimating overall percentages (D and ND) per category, only laboratories that actually tested for maize were considered in the denominator.
LabCode Group Level 1 Level 2 LabCode Group Level 1 Level 2 LabCode Group Level 1 Level 2
L35 1 Detected Detected L17 2 Not Detected Not Detected L46 4 Not Detected Not Detected
L53 1 Not Detected Not Detected L20 2 Not Detected Not Detected L55 4 Not Detected Not Detected
L01 3 Not Detected Not Detected L22 2 Detected Detected L68 4 Not Detected Not Detected
L03 3 Not Detected Not Detected L23 2 Not Detected Not Detected L76 6 Not Detected Not Detected
L04 3 Not Detected Not Detected L24 2 Not Detected Not Detected L81 4 Not Detected Not Detected
L05 3 Not Detected Not Detected L27 2 Not Detected Not Detected L06 5 Not Detected Not Detected
L08 3 Detected Detected L28 2 Not Detected Not Detected L14 5 Not Detected Not Detected
L09 3 Not Detected Not Detected L29 2 Not Detected Not Detected L30 5 Not Detected Not Detected
L11 3 Not Detected Not Detected L31 2 Not Detected Not Detected L36 5 Not Detected Not Detected
L13 3 Detected Detected L32 2 Not Detected Detected L43 5 Detected Detected
L16 3 Not Detected Not Detected L33 2 Not Detected Not Detected L66 5 Not Detected Not Detected
L18 3 Not Detected Not Detected L37 2 Not Detected Not Detected L79 5 Not Detected Not Detected
L19 3 Not Detected Not Detected L40 2 Detected Detected L80 5 Not Detected Not Detected
L21 3 Not Detected Not Detected L44 2 Not Detected Not Detected L84 5 Not Detected Not Detected
L25 3 Not Detected Not Detected L48 2 Not Detected Not Detected L02 6 Not Detected Detected
L26 3 Not Detected Not Detected L52 2 Not Detected Not Detected L07 6 Not Detected Not Detected
L34 3 Not Detected Not Detected L62 2 Not Detected Not Detected L10 6 Not Detected Not Detected
L42 3 Not Detected Not Detected L71 2 Not Detected Not Detected L12 6 Not Detected Not Detected
L45 3 Not Detected Not Detected L74 2 Not Detected Not Detected L39 6 Not Detected Not Detected
L56 3 Not Detected Not Detected L75 2 Not Detected Not Detected L41 6 Detected Detected
L58 3 Not Detected Not Detected L78 2 Not Detected Not Detected L47 6 Not Detected Not Detected
L59 3 Not Detected Not Detected L86 2 Not Detected Not Detected L49 6 Not Detected Not Detected
L60 3 Not Detected Not Detected L87 2 Not Detected Not Detected L50 6 Not Detected Not Detected
L61 3 Not Detected Not Detected % D 9 13 L51 6 Not Detected Not Detected
L64 3 Not Detected Not Detected % ND 91 87 L54 6 Not Detected Not Detected
L65 3 Not Detected Not Detected L63 6 Not Detected Not Detected
L70 3 Not Detected Not Detected L67 6 Detected Detected
L72 3 Not Detected Not Detected L69 6 Not Detected Not Detected
L85 3 Not Detected Not Detected L73 6 Not Detected Not Detected
L88 3 Not Detected Not Detected L77 6 Not Detected Not Detected
% D 10 10 L82 6 Not Detected Detected
% ND 90 90 L83 6 Not Detected Not Detected
% D 9 16
% ND 91 84
(a) (b) (c)
EURL-CT-02/13 CTR Final
EU-RL GMFF: Comparative testing report 27/62
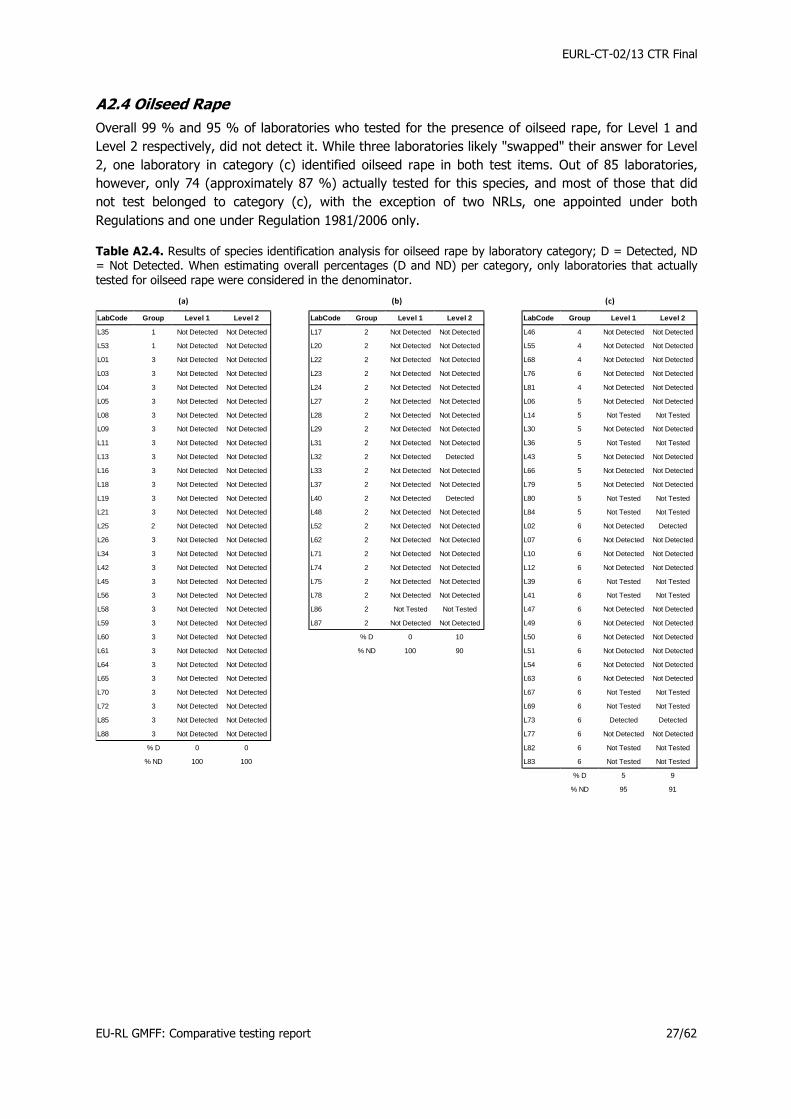
A2.4 Oilseed Rape
Overall 99 % and 95 % of laboratories who tested for the presence of oilseed rape, for Level 1 and
Level 2 respectively, did not detect it. While three laboratories likely "swapped" their answer for Level
2, one laboratory in category (c) identified oilseed rape in both test items. Out of 85 laboratories,
however, only 74 (approximately 87 %) actually tested for this species, and most of those that did
not test belonged to category (c), with the exception of two NRLs, one appointed under both
Regulations and one under Regulation 1981/2006 only.
Table A2.4. Results of species identification analysis for oilseed rape by laboratory category; D = Detected, ND = Not Detected. When estimating overall percentages (D and ND) per category, only laboratories that actually tested for oilseed rape were considered in the denominator.
LabCode Group Level 1 Level 2 LabCode Group Level 1 Level 2 LabCode Group Level 1 Level 2
L35 1 Not Detected Not Detected L17 2 Not Detected Not Detected L46 4 Not Detected Not Detected
L53 1 Not Detected Not Detected L20 2 Not Detected Not Detected L55 4 Not Detected Not Detected
L01 3 Not Detected Not Detected L22 2 Not Detected Not Detected L68 4 Not Detected Not Detected
L03 3 Not Detected Not Detected L23 2 Not Detected Not Detected L76 6 Not Detected Not Detected
L04 3 Not Detected Not Detected L24 2 Not Detected Not Detected L81 4 Not Detected Not Detected
L05 3 Not Detected Not Detected L27 2 Not Detected Not Detected L06 5 Not Detected Not Detected
L08 3 Not Detected Not Detected L28 2 Not Detected Not Detected L14 5 Not Tested Not Tested
L09 3 Not Detected Not Detected L29 2 Not Detected Not Detected L30 5 Not Detected Not Detected
L11 3 Not Detected Not Detected L31 2 Not Detected Not Detected L36 5 Not Tested Not Tested
L13 3 Not Detected Not Detected L32 2 Not Detected Detected L43 5 Not Detected Not Detected
L16 3 Not Detected Not Detected L33 2 Not Detected Not Detected L66 5 Not Detected Not Detected
L18 3 Not Detected Not Detected L37 2 Not Detected Not Detected L79 5 Not Detected Not Detected
L19 3 Not Detected Not Detected L40 2 Not Detected Detected L80 5 Not Tested Not Tested
L21 3 Not Detected Not Detected L48 2 Not Detected Not Detected L84 5 Not Tested Not Tested
L25 2 Not Detected Not Detected L52 2 Not Detected Not Detected L02 6 Not Detected Detected
L26 3 Not Detected Not Detected L62 2 Not Detected Not Detected L07 6 Not Detected Not Detected
L34 3 Not Detected Not Detected L71 2 Not Detected Not Detected L10 6 Not Detected Not Detected
L42 3 Not Detected Not Detected L74 2 Not Detected Not Detected L12 6 Not Detected Not Detected
L45 3 Not Detected Not Detected L75 2 Not Detected Not Detected L39 6 Not Tested Not Tested
L56 3 Not Detected Not Detected L78 2 Not Detected Not Detected L41 6 Not Tested Not Tested
L58 3 Not Detected Not Detected L86 2 Not Tested Not Tested L47 6 Not Detected Not Detected
L59 3 Not Detected Not Detected L87 2 Not Detected Not Detected L49 6 Not Detected Not Detected
L60 3 Not Detected Not Detected % D 0 10 L50 6 Not Detected Not Detected
L61 3 Not Detected Not Detected % ND 100 90 L51 6 Not Detected Not Detected
L64 3 Not Detected Not Detected L54 6 Not Detected Not Detected
L65 3 Not Detected Not Detected L63 6 Not Detected Not Detected
L70 3 Not Detected Not Detected L67 6 Not Tested Not Tested
L72 3 Not Detected Not Detected L69 6 Not Tested Not Tested
L85 3 Not Detected Not Detected L73 6 Detected Detected
L88 3 Not Detected Not Detected L77 6 Not Detected Not Detected
% D 0 0 L82 6 Not Tested Not Tested
% ND 100 100 L83 6 Not Tested Not Tested
% D 5 9
% ND 95 91
(a) (b) (c)
EURL-CT-02/13 CTR Final
EU-RL GMFF: Comparative testing report 28/62
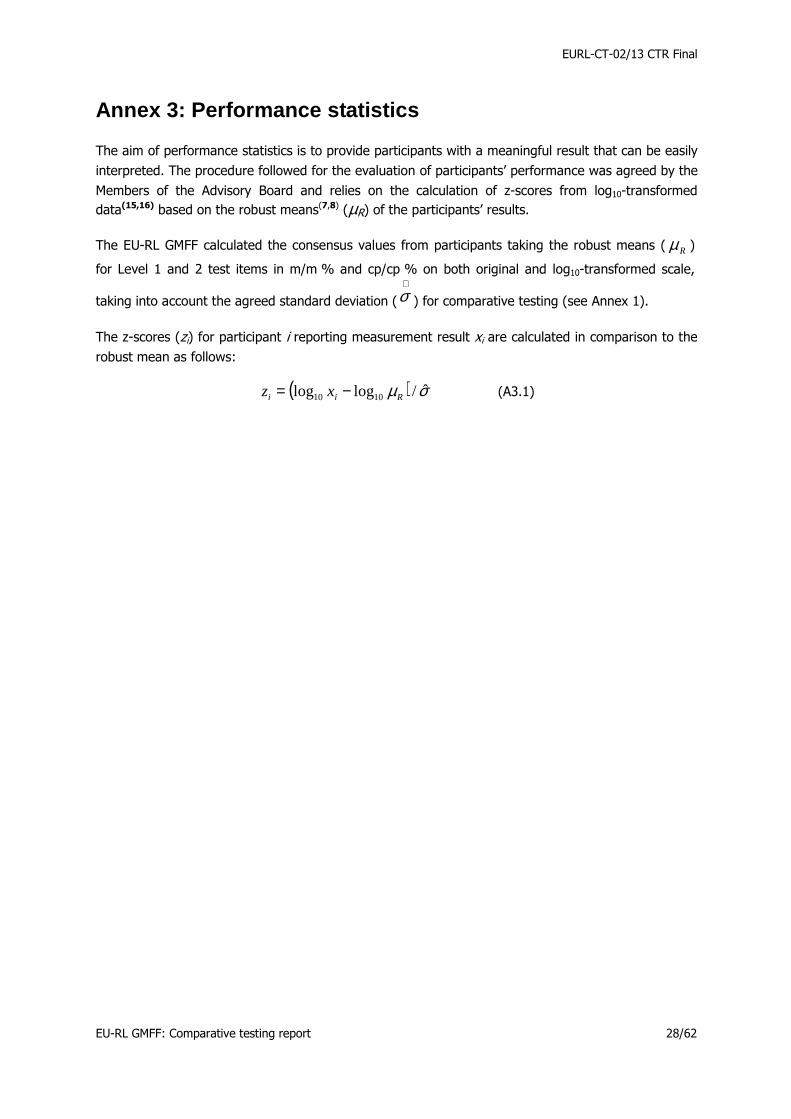
Annex 3: Performance statistics
The aim of performance statistics is to provide participants with a meaningful result that can be easily
interpreted. The procedure followed for the evaluation of participants’ performance was agreed by the
Members of the Advisory Board and relies on the calculation of z-scores from log10-transformed
data(15,16) based on the robust means(7,8) (µR) of the participants’ results.
The EU-RL GMFF calculated the consensus values from participants taking the robust means ( Rµ )
for Level 1 and 2 test items in m/m % and cp/cp % on both original and log10-transformed scale,
taking into account the agreed standard deviation (
∧σ ) for comparative testing (see Annex 1).
The z-scores (zi) for participant i reporting measurement result xi are calculated in comparison to the
robust mean as follows:
( ) σµ ˆ/loglog 1010 Rii xz −= (A3.1)

EURL-CT-02/13 CTR Final
EU-RL GMFF: Comparative testing report 29/62
Annex 4: Participants' results
The z-scores of all laboratories are reported in Tables A4.1-A4.4. For consistency, all decimal numbers
were rounded to two digits. The information is given, when the sample size allowed it, by laboratory
category and, for indicative purposes, by laboratory group (see page 6). "Value" refers to the
reported value and uncertainty as calculated and reported by the laboratory. Also “LOD” (limit of
detection) and “LOQ” (limit of quantification) are values calculated and provided by the laboratories
and refer to the methods they used for these specific samples. The z-scores, measurement
uncertainty (MU; % of incorrectly reported MU is estimated only using data from laboratories which
reported a value), mean LOD (µLOD) and mean LOQ (µLOQ) as well as their standard deviation are
calculated by the EU-RL. As an indicator for the overall performance, the fraction of laboratories
outside the acceptable range of the z-score is given and corresponding data are highlighted in bold.
Table A4.1a-c. z-scores for soybean event DP-356043-5 Level 1 test item for results reported in m/m %, laboratory category: (a), (b), and (c). - = not reported, (1) Uncertainty (U) and/or coverage factor k was reported in an inconsistent manner, (2) U was reported in an incomplete manner, (3) U seems to be a relative value. Descriptive statistics for LOD and LOQ were estimated using only data for which a value was clearly reported.
(a)
Laboratory Number
Group Value Uncertainty LOD m/m LOQ m/mz-score based on
µR = 0.57L53 1 0.72 0.20 0.03 0.11 0.55L01 3 0.56 0.22 - - 0.01L03 3 0.54 0.10 - - -0.06L04 3 0.71 69.10 (3) - - 0.53L08 3 0.47 30.00 (3) 0.09 - -0.37L11 3 0.40 0.02 (1) - - -0.72L16 3 0.33 0.12 (1) 0.03 0.10 -1.13L21 3 0.57 - 0.05 0.10 0.05L26 3 0.40 0.20 (1) - - -0.72L34 3 0.62 0.13 0.03 0.10 0.24L42 3 0.75 0.37 0.13 0.39 0.65L45 3 0.29 0.20 0.20 0.60 -1.41L56 3 0.31 0.05 (1) 0.02 0.10 -1.27L58 3 0.60 0.17 (1) 0.08 0.10 0.16L59 3 0.36 0.11 - - -0.94L60 3 0.41 - 0.05 0.06 -0.66L64 3 0.58 0.17 (1) 0.02 0.10 0.09L65 3 0.82 0.19 0.18 0.37 0.84L70 3 0.55 - 0.04 0.08 -0.02L72 3 0.61 0.37 <=0.04 <=0.08 0.20L85 3 0.73 0.78 0.10 >0.10 0.59L88 3 0.50 0.13 (1) 0.10 - -0.23
% Incorrect MU μLOD = 0.08 μLOQ = 0.18 % |zμR| ≥ 2.0
47% σLOD = 0.06 σLOQ = 0.17 0%
EURL-CT-02/13 CTR Final
EU-RL GMFF: Comparative testing report 30/62
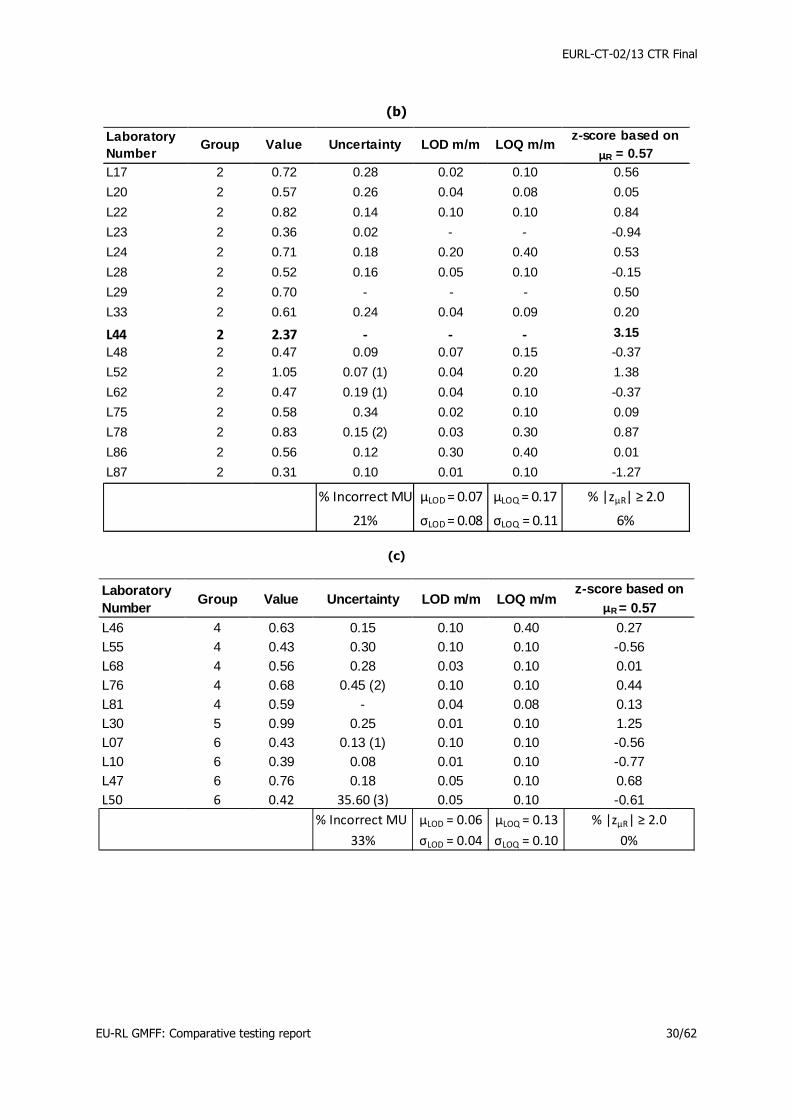
(b)
Laboratory Number
Group Value Uncertainty LOD m/m LOQ m/mz-score based on
µR = 0.57L17 2 0.72 0.28 0.02 0.10 0.56
L20 2 0.57 0.26 0.04 0.08 0.05
L22 2 0.82 0.14 0.10 0.10 0.84
L23 2 0.36 0.02 - - -0.94
L24 2 0.71 0.18 0.20 0.40 0.53
L28 2 0.52 0.16 0.05 0.10 -0.15
L29 2 0.70 - - - 0.50
L33 2 0.61 0.24 0.04 0.09 0.20
L44 2 2.37 - - - 3.15
L48 2 0.47 0.09 0.07 0.15 -0.37
L52 2 1.05 0.07 (1) 0.04 0.20 1.38
L62 2 0.47 0.19 (1) 0.04 0.10 -0.37
L75 2 0.58 0.34 0.02 0.10 0.09
L78 2 0.83 0.15 (2) 0.03 0.30 0.87
L86 2 0.56 0.12 0.30 0.40 0.01
L87 2 0.31 0.10 0.01 0.10 -1.27
% Incorrect MU μLOD = 0.07 μLOQ = 0.17 % |zμR| ≥ 2.0
21% σLOD = 0.08 σLOQ = 0.11 6%
(c)
Laboratory Number
Group Value Uncertainty LOD m/m LOQ m/mz-score based on
µR = 0.57L46 4 0.63 0.15 0.10 0.40 0.27L55 4 0.43 0.30 0.10 0.10 -0.56L68 4 0.56 0.28 0.03 0.10 0.01L76 4 0.68 0.45 (2) 0.10 0.10 0.44L81 4 0.59 - 0.04 0.08 0.13L30 5 0.99 0.25 0.01 0.10 1.25L07 6 0.43 0.13 (1) 0.10 0.10 -0.56L10 6 0.39 0.08 0.01 0.10 -0.77L47 6 0.76 0.18 0.05 0.10 0.68L50 6 0.42 35.60 (3) 0.05 0.10 -0.61
% Incorrect MU μLOD = 0.06 μLOQ = 0.13 % |zμR| ≥ 2.0
33% σLOD = 0.04 σLOQ = 0.10 0%
EURL-CT-02/13 CTR Final
EU-RL GMFF: Comparative testing report 31/62
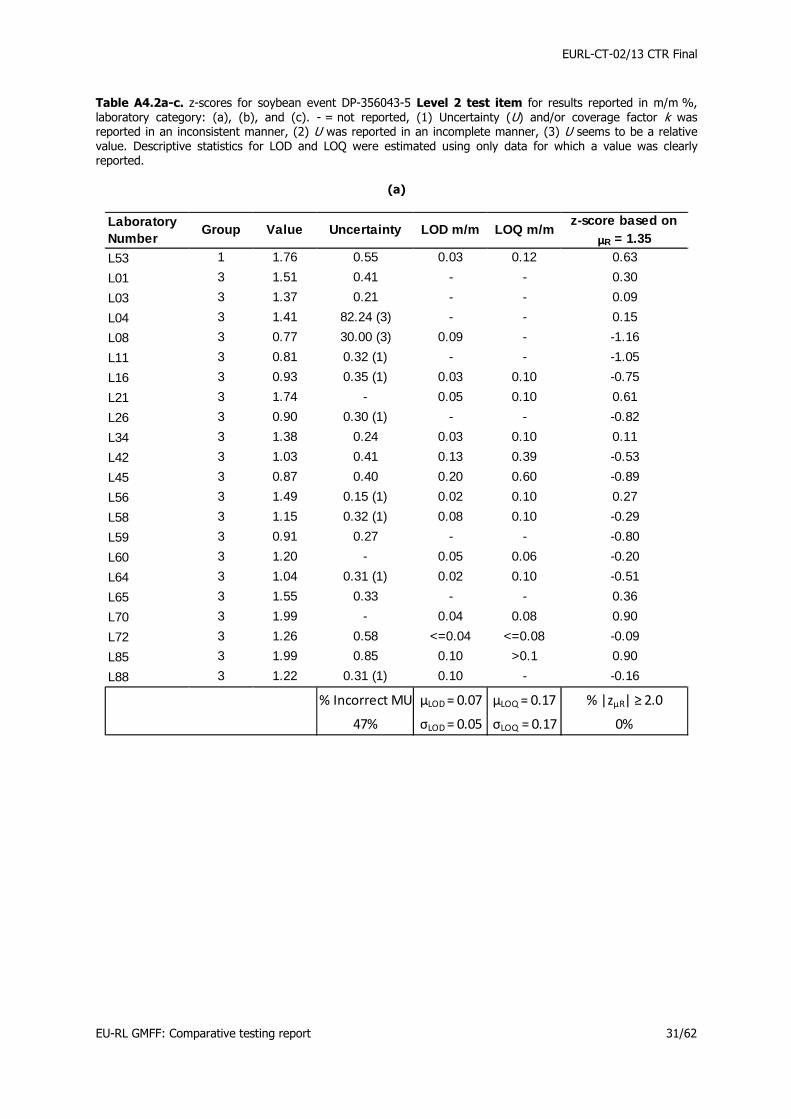
Table A4.2a-c. z-scores for soybean event DP-356043-5 Level 2 test item for results reported in m/m %, laboratory category: (a), (b), and (c). - = not reported, (1) Uncertainty (U) and/or coverage factor k was reported in an inconsistent manner, (2) U was reported in an incomplete manner, (3) U seems to be a relative value. Descriptive statistics for LOD and LOQ were estimated using only data for which a value was clearly reported.
(a)
Laboratory Number
Group Value Uncertainty LOD m/m LOQ m/mz-score based on
µR = 1.35
L53 1 1.76 0.55 0.03 0.12 0.63
L01 3 1.51 0.41 - - 0.30
L03 3 1.37 0.21 - - 0.09
L04 3 1.41 82.24 (3) - - 0.15
L08 3 0.77 30.00 (3) 0.09 - -1.16
L11 3 0.81 0.32 (1) - - -1.05
L16 3 0.93 0.35 (1) 0.03 0.10 -0.75
L21 3 1.74 - 0.05 0.10 0.61
L26 3 0.90 0.30 (1) - - -0.82
L34 3 1.38 0.24 0.03 0.10 0.11
L42 3 1.03 0.41 0.13 0.39 -0.53
L45 3 0.87 0.40 0.20 0.60 -0.89
L56 3 1.49 0.15 (1) 0.02 0.10 0.27
L58 3 1.15 0.32 (1) 0.08 0.10 -0.29
L59 3 0.91 0.27 - - -0.80
L60 3 1.20 - 0.05 0.06 -0.20
L64 3 1.04 0.31 (1) 0.02 0.10 -0.51
L65 3 1.55 0.33 - - 0.36
L70 3 1.99 - 0.04 0.08 0.90
L72 3 1.26 0.58 <=0.04 <=0.08 -0.09
L85 3 1.99 0.85 0.10 >0.1 0.90
L88 3 1.22 0.31 (1) 0.10 - -0.16
% Incorrect MU μLOD = 0.07 μLOQ = 0.17 % |zμR| ≥ 2.0
47% σLOD = 0.05 σLOQ = 0.17 0%

EURL-CT-02/13 CTR Final
EU-RL GMFF: Comparative testing report 32/62
(b)
Laboratory Number
Group Value Uncertainty LOD m/m LOQ m/mz-score based on
µR = 1.35L17 2 1.29 0.34 0.02 0.10 -0.04
L20 2 1.27 0.45 0.04 0.08 -0.07
L22 2 1.78 0.17 0.10 0.10 0.66
L23 2 1.18 0.52 - - -0.23
L24 2 1.37 0.07 0.20 0.40 0.09
L28 2 1.41 0.21 0.05 0.10 0.15
L29 2 1.30 - - - -0.02
L33 2 1.46 0.27 0.04 0.09 0.23
L44 2 3.32 - - - 2.02
L48 2 1.06 0.20 0.07 0.15 -0.46
L52 2 2.00 0.20 (1) 0.04 0.20 0.91
L62 2 1.38 0.57 (1) 0.04 0.10 0.11
L75 2 0.82 0.20 0.02 0.10 -1.02
L78 2 1.91 0.34 (2) 0.03 0.30 0.81
L86 2 1.70 0.22 0.30 0.40 0.56
L87 2 1.25 0.42 0.01 0.10 -0.11
% Incorrect MU μLOD = 0.07 μLOQ = 0.17 % |zμR| ≥ 2.0
21% σLOD = 0.08 σLOQ = 0.12 6%
(c)
Laboratory Number
Group Value Uncertainty LOD m/m LOQ m/mz-score based on
µR = 1.35L46 4 1.14 0.25 0.10 0.40 -0.31L55 4 1.82 1.53 0.10 0.10 0.71L68 4 1.00 0.50 0.03 0.10 -0.59L76 4 1.65 1.07 (2) 0.10 0.10 0.50L81 4 1.76 - 0.04 0.08 0.64L30 5 2.07 0.52 0.01 0.10 0.99L07 6 1.09 0.33 (1) 0.10 0.10 -0.40L10 6 0.84 0.10 0.01 0.10 -0.97L47 6 1.13 0.25 0.05 0.10 -0.33L50 6 1.22 35.60 (3) 0.05 0.10 -0.16
% Incorrect MU μLOD = 0.06 μLOQ = 0.13 % |zμR| ≥ 2.0
33% σLOD = 0.04 σLOQ = 0.10 0%
EURL-CT-02/13 CTR Final
EU-RL GMFF: Comparative testing report 33/62
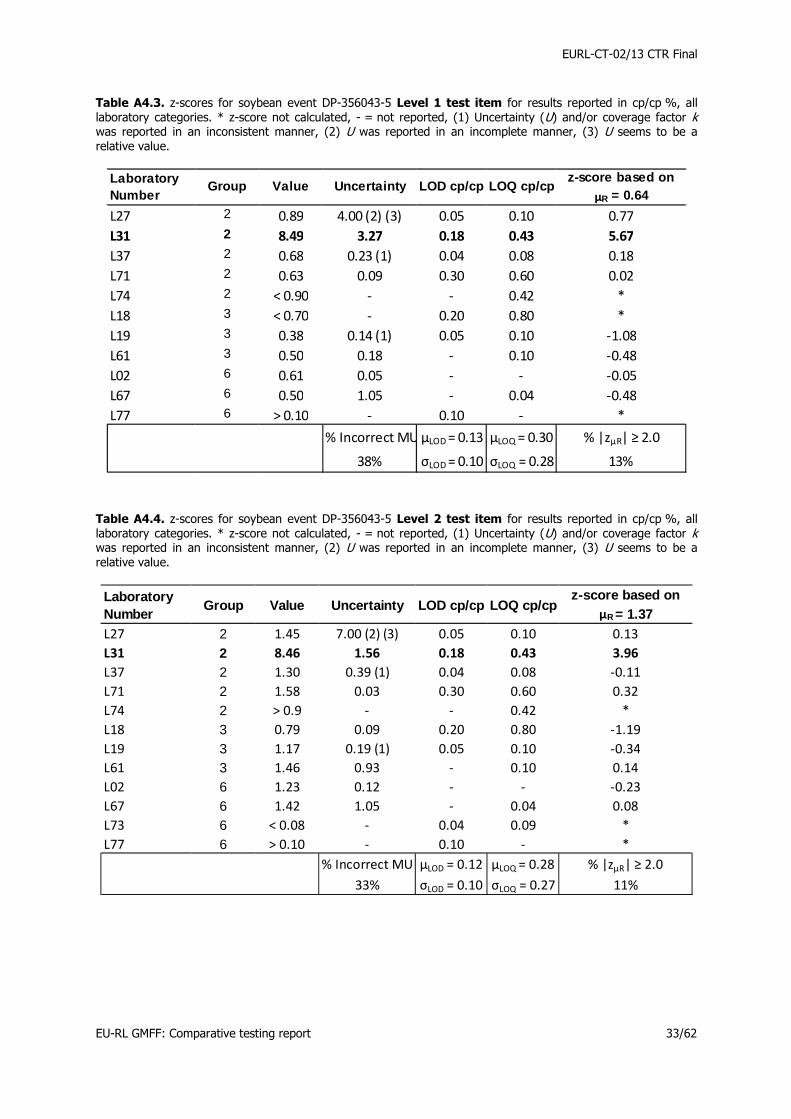
Table A4.3. z-scores for soybean event DP-356043-5 Level 1 test item for results reported in cp/cp %, all laboratory categories. * z-score not calculated, - = not reported, (1) Uncertainty (U) and/or coverage factor k was reported in an inconsistent manner, (2) U was reported in an incomplete manner, (3) U seems to be a relative value.
Laboratory Number
Group Value Uncertainty LOD cp/cp LOQ cp/cpz-score based on
µR = 0.64
L27 2 0.89 4.00 (2) (3) 0.05 0.10 0.77
L31 2 8.49 3.27 0.18 0.43 5.67
L37 2 0.68 0.23 (1) 0.04 0.08 0.18
L71 2 0.63 0.09 0.30 0.60 0.02
L74 2 < 0.90 - - 0.42 *
L18 3 < 0.70 - 0.20 0.80 *
L19 3 0.38 0.14 (1) 0.05 0.10 -1.08
L61 3 0.50 0.18 - 0.10 -0.48
L02 6 0.61 0.05 - - -0.05
L67 6 0.50 1.05 - 0.04 -0.48
L77 6 > 0.10 - 0.10 - *
% Incorrect MU μLOD = 0.13 μLOQ = 0.30 % |zμR| ≥ 2.0
38% σLOD = 0.10 σLOQ = 0.28 13%
Table A4.4. z-scores for soybean event DP-356043-5 Level 2 test item for results reported in cp/cp %, all laboratory categories. * z-score not calculated, - = not reported, (1) Uncertainty (U) and/or coverage factor k was reported in an inconsistent manner, (2) U was reported in an incomplete manner, (3) U seems to be a relative value.
Laboratory Number
Group Value Uncertainty LOD cp/cp LOQ cp/cpz-score based on
µR = 1.37L27 2 1.45 7.00 (2) (3) 0.05 0.10 0.13
L31 2 8.46 1.56 0.18 0.43 3.96
L37 2 1.30 0.39 (1) 0.04 0.08 -0.11
L71 2 1.58 0.03 0.30 0.60 0.32
L74 2 > 0.9 - - 0.42 *
L18 3 0.79 0.09 0.20 0.80 -1.19
L19 3 1.17 0.19 (1) 0.05 0.10 -0.34
L61 3 1.46 0.93 - 0.10 0.14
L02 6 1.23 0.12 - - -0.23
L67 6 1.42 1.05 - 0.04 0.08
L73 6 < 0.08 - 0.04 0.09 *
L77 6 > 0.10 - 0.10 - *
% Incorrect MU μLOD = 0.12 μLOQ = 0.28 % |zμR| ≥ 2.0
33% σLOD = 0.10 σLOQ = 0.27 11%

EURL-CT-02/13 CTR Final
EU-RL GMFF: Comparative testing report 34/62
Figure A4.1. z-scores for soybean event DP-356043-5 Level 1 test item on the basis of a robust mean of 0.57 m/m % (◊◊◊◊).

EURL-CT-02/13 CTR Final
EU-RL GMFF: Comparative testing report 35/62
Figure A4.2. z-scores for soybean event DP-356043-5 Level 2 test item on the basis of a robust mean of 1.35 m/m % (◊◊◊◊).

EURL-CT-02/13 CTR Final
EU-RL GMFF: Comparative testing report 36/62
Figure A4.3. z-scores for soybean event DP-356043-5 Level 1 test item on the basis of a robust mean of 0.64 cp/cp % (◊◊◊◊).
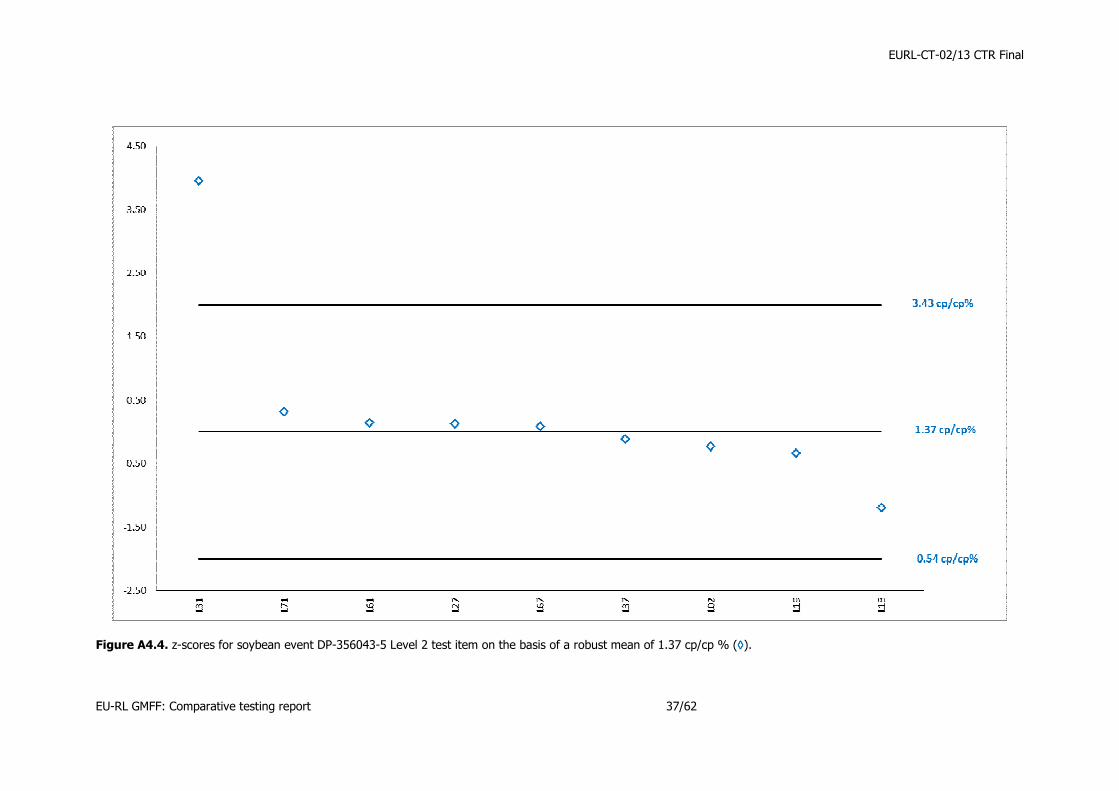
EURL-CT-02/13 CTR Final
EU-RL GMFF: Comparative testing report 37/62
Figure A4.4. z-scores for soybean event DP-356043-5 Level 2 test item on the basis of a robust mean of 1.37 cp/cp % (◊◊◊◊).

EURL-CT-02/13 CTR Final
EU-RL GMFF: Comparative testing report 38/62
Annex 5: Questionnaire data
Q1.1. Rice noodles Sample L1:
species identification
No. of laboratories per species
Maize Oilseed Rape Rice Soybean
Present 8 1 80 85
Absent 77 73 0 0
Not Tested 0 11 5 0
Q1.2. Rice noodles Sample L2: species identification
No. of laboratories per species
Maize Oilseed Rape Rice Soybean
Present 11 4 78 81
Absent 74 70 2 4
Not Tested 0 11 5 0
Q2. GM event(s)
identification
No. of laboratories per Sample
GM Event 1 GM Event 2 GM Event 3
Sample 1 Sample 2 Sample 1 Sample 2 Sample 1 Sample 2
DP-356043-5 62 63 0 0 0 0
p35s 5 5 2 2 0 0
Soybean Line GTS 40-3-2 2 2 0 0 0 0
MON810 1 1 0 0 0 0
NOS 0 0 1 1 0 0
3. Number of replicate DNA extractions from test materials:
No. of laboratories
a) 1 1
b) 2 59
c) 3 9
d) 4 10
e) Other 6
Other of which:
5 1
6 4
8 1
4. DNA extraction method: No. of laboratories
a) ISO/CEN 31
b) EU-RL 3
c) National reference method 6
d) International literature 2
e) In-house developed and optimised 8
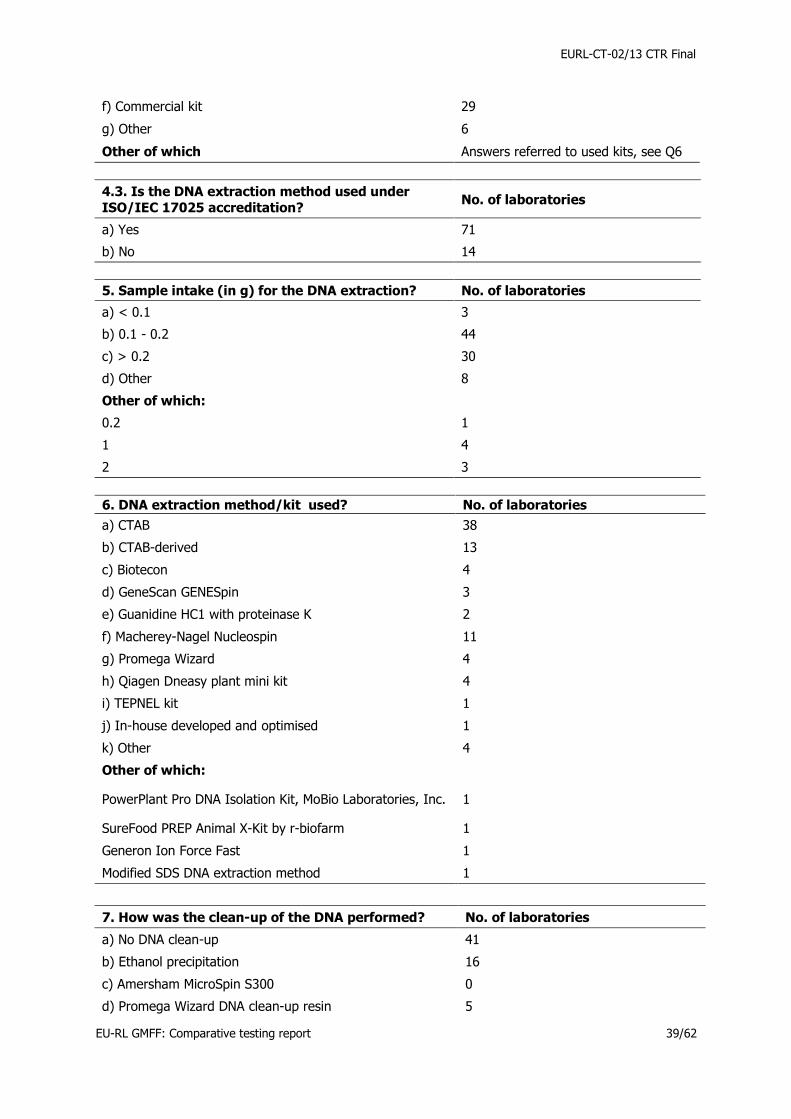
EURL-CT-02/13 CTR Final
EU-RL GMFF: Comparative testing report 39/62
f) Commercial kit 29
g) Other 6
Other of which Answers referred to used kits, see Q6
4.3. Is the DNA extraction method used under
ISO/IEC 17025 accreditation? No. of laboratories
a) Yes 71
b) No 14
5. Sample intake (in g) for the DNA extraction? No. of laboratories
a) < 0.1 3
b) 0.1 - 0.2 44
c) > 0.2 30
d) Other 8
Other of which:
0.2 1
1 4
2 3
6. DNA extraction method/kit used? No. of laboratories
a) CTAB 38
b) CTAB-derived 13
c) Biotecon 4
d) GeneScan GENESpin 3
e) Guanidine HC1 with proteinase K 2
f) Macherey-Nagel Nucleospin 11
g) Promega Wizard 4
h) Qiagen Dneasy plant mini kit 4
i) TEPNEL kit 1
j) In-house developed and optimised 1
k) Other 4
Other of which:
PowerPlant Pro DNA Isolation Kit, MoBio Laboratories, Inc. 1
SureFood PREP Animal X-Kit by r-biofarm 1
Generon Ion Force Fast 1
Modified SDS DNA extraction method 1
7. How was the clean-up of the DNA performed? No. of laboratories
a) No DNA clean-up 41
b) Ethanol precipitation 16
c) Amersham MicroSpin S300 0
d) Promega Wizard DNA clean-up resin 5

EURL-CT-02/13 CTR Final
EU-RL GMFF: Comparative testing report 40/62
e) Qiagen QIAQuick 11
f) Qiagen Genomic-Tip 20/G 1
g) Silica 7
h) Other 4
Other of which:
Maxwell 16 Nucleic Acid Extraction Kit (Promega) 1
As part of the CTAB method, the DNA is purified by isopropanol precipitation and washing with ethanol.
1
Invisorb DNA Cleanup 1
DNA Extractor Cleaning Columns Kit (eurofins) 1
8. How have you quantified the genomic DNA extracted?
No. of laboratories
a) Gel 2
b) UV spectrophotometer 64
c) Fluorometer 11
d) Other 3
e) Not applicable (i.e. DNA was not quantified) 5
Other of which:
Estimation is based on qPCR results. 1
Nanodrop 1
QPCR 1
9. DNA Dilution buffer No. of laboratories
a) TE (10 mM Tris-HC1, 1 mM EDTA) 18
b) TE 0.1X (10 mM Tris-HC1, 0.1 mM EDTA) 13
c) TE low (1 mM Tris, 0.01 mM EDTA) 2
d) Water 42
e) Other 10
Other of which
Buffer EB ,from Qiagen mericon food kit 1
0.5 X TE 1
TE 0,2x 1
TE (10 mM TrisHCl; 0,2 mM EDTA) 1
Elution Buffer Part# A 828D (Maxwell 16 FFS Nucleic Acid Extraction Kit / Promega)
1
0.2x TE (2 mM Tris-HCl, 0.2 mM EDTA) 1
PE (5 mM Tris HCl, pH 8.5); from Nucleospin plant II kit 1
BE buffer from QIAquick kit 1
Buffer EB 1
No dilution applied 1

EURL-CT-02/13 CTR Final
EU-RL GMFF: Comparative testing report 41/62
10. Screening methods used for GMO detection No. of laboratories
a) Reference method from EU-RL GMFF GMOMETHODS database
31
b) National reference method 17
c) ISO/CEN 27
d) In-house developed and optimised 8
e) National reference method 3
f) Pre-spotted plate 6
g) Other 22
Other of which:
CoSYPS methods - will included in the EU-RL GMFF database
1
Commercial kit 2
international literature 3
Screening table; BVL 1
SybrGreen Q PCR (CoSYPS method") 1
Pentaplex Screening PCR, GMOseek project 1
not used 1
Eur Food Res Technol (2008) 226(5):1221-1228; J. Agric. Food Chem (2009) 57(19):8913-8920; J AOAL Int (2002) 85(3): 646-653
1
§ 64 00.00-122; 00.00-124; 00.00-125; § 64 L 15.06-03; Forschungsprogramm „Ernaehrung/Nahrungsmittelsicherheit“ der Landesstiftung Baden-Württemberg (2007) Molekularbiologische Verfahren zum Nachweis von nicht-zugelassenen gentechnisch veränderten Pflanzen. Abschlussbericht. Projekt P-LS-E2/11.
1
Eurofins GMOScreen 35S/NOS/FMV IPC 1
Eurofins GeneScan 1
Real time PCR, see below 1
Reiting R., Grohmann L., Dietrich Maede D. Journal of Consumer Protection and Food Safety Vol.5 N°2, 185-188, 2010 ”Testing cascade for the detection of genetically modified rice by real-time PCR in food and its application for detection of an unauthorized rice line similar to KeFeng6
1
Debode et al. (2013) and Kuribara et al. (2002); Bayer Cropscience (2006)
1
10.2 Is the PCR screening method used under ISO/IEC 17025 accreditation?
No. of laboratories
a) Yes 70
b) No 15

EURL-CT-02/13 CTR Final
EU-RL GMFF: Comparative testing report 42/62
11. Principle of PCR detection used for screening? No. of laboratories
a) Gel 7
b) SYBR® Green 4
c) Taqman probe 69
d) Other 5
Other of which:
Gel, Taqman probe 1
Gel and SYBR Green and Taqman 1
not used 1
CryIAb/CryIAc-SYBR-Green; p35S/tNOS +bar+PLD+cruA - Taqman probe,lectin +ivr-gel
1
GEL, TAQMAN PROBE 1
12. Screening method used for GM detection: No. of laboratories
a) Multiplex PCR 23
b) Singleplex PCR 62
13. Elements / targets used for screening (P =
promoter, T = terminator): No. of laboratories
a) P35S 76
b) T-nos 74
c) Other 58
Other of which:
pFMV 5
bar 2
PAT, BAR 1
CTP2-CP4-EPSPS, bar, 35S-pat, CryIAb/Ac (SG), CaMV, 305423, 356043, CV127, MON87701, MON87708,
1
pFMV and P35S-BAR 1
NPTII、Bar 1
pat, cp4-epsps, adh, cruciferine, PLD, Lectine 1
Cry1Ab, pat/bar, EPSPS 1
pat, rActin intron bar, nptII, cry1Ac, cry1Ab/Ac 1
CP4EPSPS 1
Endogenous Genes 1
bar, FMV, ctp2-cp4-epsps, pat 1
pFMV, npt II, pat, bar, 1
CP4-EPSPS, NPTII, PAT, CP4CTP-EPEPS 1
CTP2 1
pat, bar, CTP2-CP4EPSPS, cry1ab/ac 1
Cry A(c)-T-Nos construct 1
Screening table; BVL 1
CPT2-CP4 EPSPS, Cry1Ab/Ac P-ubi-cry 1
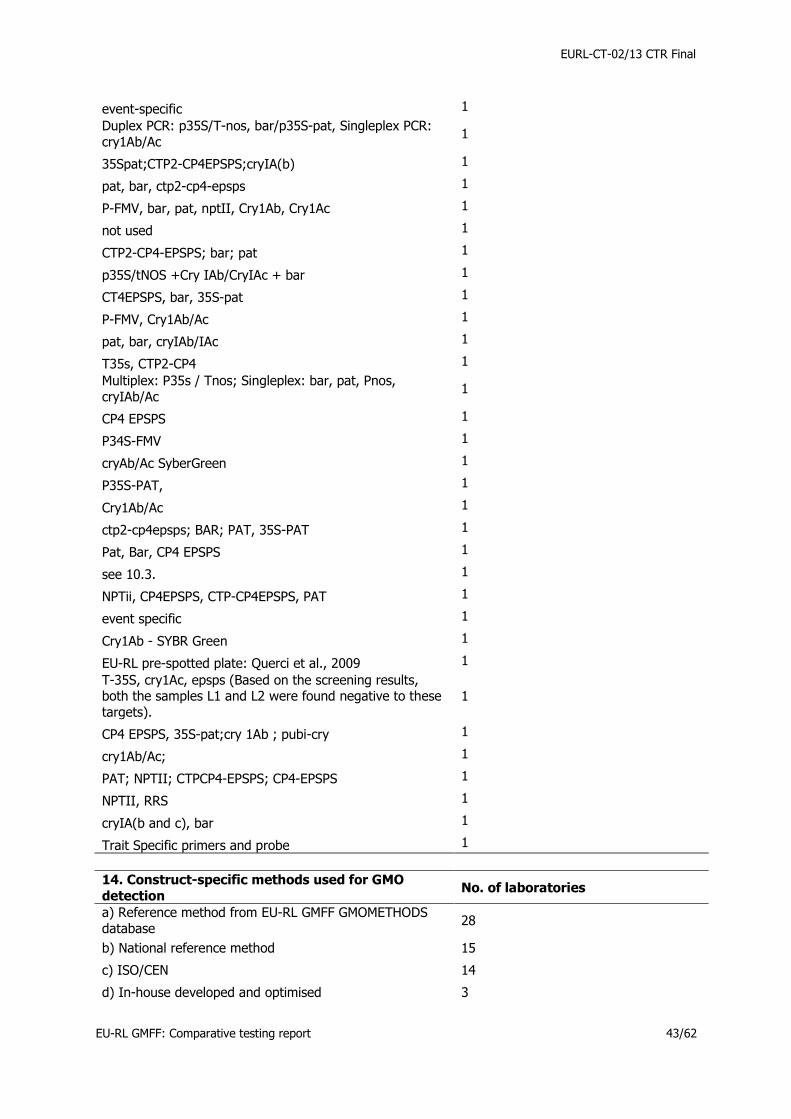
EURL-CT-02/13 CTR Final
EU-RL GMFF: Comparative testing report 43/62
event-specific 1
Duplex PCR: p35S/T-nos, bar/p35S-pat, Singleplex PCR: cry1Ab/Ac
1
35Spat;CTP2-CP4EPSPS;cryIA(b) 1
pat, bar, ctp2-cp4-epsps 1
P-FMV, bar, pat, nptII, Cry1Ab, Cry1Ac 1
not used 1
CTP2-CP4-EPSPS; bar; pat 1
p35S/tNOS +Cry IAb/CryIAc + bar 1
CT4EPSPS, bar, 35S-pat 1
P-FMV, Cry1Ab/Ac 1
pat, bar, cryIAb/IAc 1
T35s, CTP2-CP4 1
Multiplex: P35s / Tnos; Singleplex: bar, pat, Pnos, cryIAb/Ac
1
CP4 EPSPS 1
P34S-FMV 1
cryAb/Ac SyberGreen 1
P35S-PAT, 1
Cry1Ab/Ac 1
ctp2-cp4epsps; BAR; PAT, 35S-PAT 1
Pat, Bar, CP4 EPSPS 1
see 10.3. 1
NPTii, CP4EPSPS, CTP-CP4EPSPS, PAT 1
event specific 1
Cry1Ab - SYBR Green 1
EU-RL pre-spotted plate: Querci et al., 2009 1
T-35S, cry1Ac, epsps (Based on the screening results, both the samples L1 and L2 were found negative to these targets).
1
CP4 EPSPS, 35S-pat;cry 1Ab ; pubi-cry 1
cry1Ab/Ac; 1
PAT; NPTII; CTPCP4-EPSPS; CP4-EPSPS 1
NPTII, RRS 1
cryIA(b and c), bar 1
Trait Specific primers and probe 1
14. Construct-specific methods used for GMO
detection No. of laboratories
a) Reference method from EU-RL GMFF GMOMETHODS database
28
b) National reference method 15
c) ISO/CEN 14
d) In-house developed and optimised 3

EURL-CT-02/13 CTR Final
EU-RL GMFF: Comparative testing report 44/62
e) International literature 9
f) Other 30
Other of which:
Not applicable 1
None/Not Used/ Not Tested 12
Pre-Spotted Plate 1
see screening 1
CTP2-CP4EPSPS 1
Event specific 1
Screening table; BVL 1
not applicable 1
Methods Waiblinger ( Germany) - Screening table 1
CTP2-CP4EPSPS + Bar 1
35S/BAR 1
Eurofins GeneScan GMOQuant Roundup Ready soy 1
14.3. Real-time PCR quantification method used under ISO/IEC 17025 accreditation?
No. of laboratories
a) Yes 49
b) No 22
Missing 14
15. Principle of PCR used for construct-specific
detection No. of laboratories
a) Gel 7
b) SYBR ® Green 4
c) Taqman probe 55
d) Other 4
Missing 20
Other of which:
Not used 4
16. Construct-specific method: No. of laboratories
a) Multiplex PCR 8
b) Singleplex PCR 76
Missing 1
17. Please specify targets used for construct specific detection (P = promoter, T = terminator)
No. of laboratories
Not done/Not used 8
p35S 1
pSAMS : gm-hra gene 1
CTP2-CP4EPSPS 2
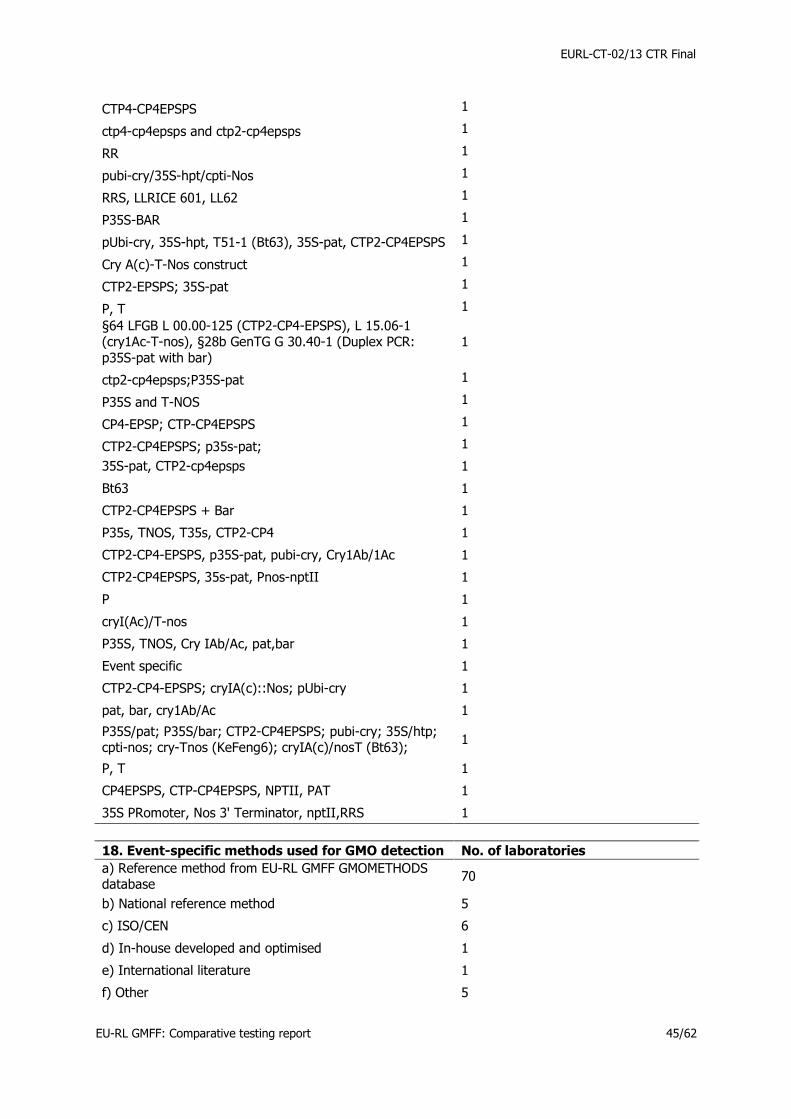
EURL-CT-02/13 CTR Final
EU-RL GMFF: Comparative testing report 45/62
CTP4-CP4EPSPS 1
ctp4-cp4epsps and ctp2-cp4epsps 1
RR 1
pubi-cry/35S-hpt/cpti-Nos 1
RRS, LLRICE 601, LL62 1
P35S-BAR 1
pUbi-cry, 35S-hpt, T51-1 (Bt63), 35S-pat, CTP2-CP4EPSPS 1
Cry A(c)-T-Nos construct 1
CTP2-EPSPS; 35S-pat 1
P, T 1
§64 LFGB L 00.00-125 (CTP2-CP4-EPSPS), L 15.06-1 (cry1Ac-T-nos), §28b GenTG G 30.40-1 (Duplex PCR: p35S-pat with bar)
1
ctp2-cp4epsps;P35S-pat 1
P35S and T-NOS 1
CP4-EPSP; CTP-CP4EPSPS 1
CTP2-CP4EPSPS; p35s-pat; 1
35S-pat, CTP2-cp4epsps 1
Bt63 1
CTP2-CP4EPSPS + Bar 1
P35s, TNOS, T35s, CTP2-CP4 1
CTP2-CP4-EPSPS, p35S-pat, pubi-cry, Cry1Ab/1Ac 1
CTP2-CP4EPSPS, 35s-pat, Pnos-nptII 1
P 1
cryI(Ac)/T-nos 1
P35S, TNOS, Cry IAb/Ac, pat,bar 1
Event specific 1
CTP2-CP4-EPSPS; cryIA(c)::Nos; pUbi-cry 1
pat, bar, cry1Ab/Ac 1
P35S/pat; P35S/bar; CTP2-CP4EPSPS; pubi-cry; 35S/htp; cpti-nos; cry-Tnos (KeFeng6); cryIA(c)/nosT (Bt63);
1
P, T 1
CP4EPSPS, CTP-CP4EPSPS, NPTII, PAT 1
35S PRomoter, Nos 3' Terminator, nptII,RRS 1
18. Event-specific methods used for GMO detection No. of laboratories
a) Reference method from EU-RL GMFF GMOMETHODS database
70
b) National reference method 5
c) ISO/CEN 6
d) In-house developed and optimised 1
e) International literature 1
f) Other 5

EURL-CT-02/13 CTR Final
EU-RL GMFF: Comparative testing report 46/62
Missing 4
Other of which:
Event-specific Pre-Spotted Plates 1
Event-specific method for Rice: LLRice601 (Bayer CropScience),
1
GMOIdent Event MON810 Corn GeneScan 1
no construct-specific methods used 1
AllSoy02-Kit (Microsynth, CH): GTS40-3-2; MON89788; A2704-12; A5547-127
1
18.3. Is the PCR event-specific method used under
ISO/IEC 17025 accreditation? No. of laboratories
a) Yes 54
b) No 23
Missing 8
19. Principle of PCR used for event-specific
detection No. of laboratories
a) Gel 6
b) SYBR ® Green 1
c) Taqman probe 74
d) Other 0
Missing 5
20. Event-specific method No. of laboratories
a) Multiplex PCR 5
b) Singleplex PCR 58
Missing 22
21. Digital PCR quantification method(s) No. of laboratories
a) In-house developed and optimised 5
b) International literature 0
c) National reference method(s) 5
d) Other 72
Missing 4
Other of which:
Not used/Not Tested/not applied/etc 28
21.3. Is the digital PCR quantification method used under ISO/IEC 17025 accreditation?
No. of laboratories
a) Yes 5
b) No 19
Missing 61
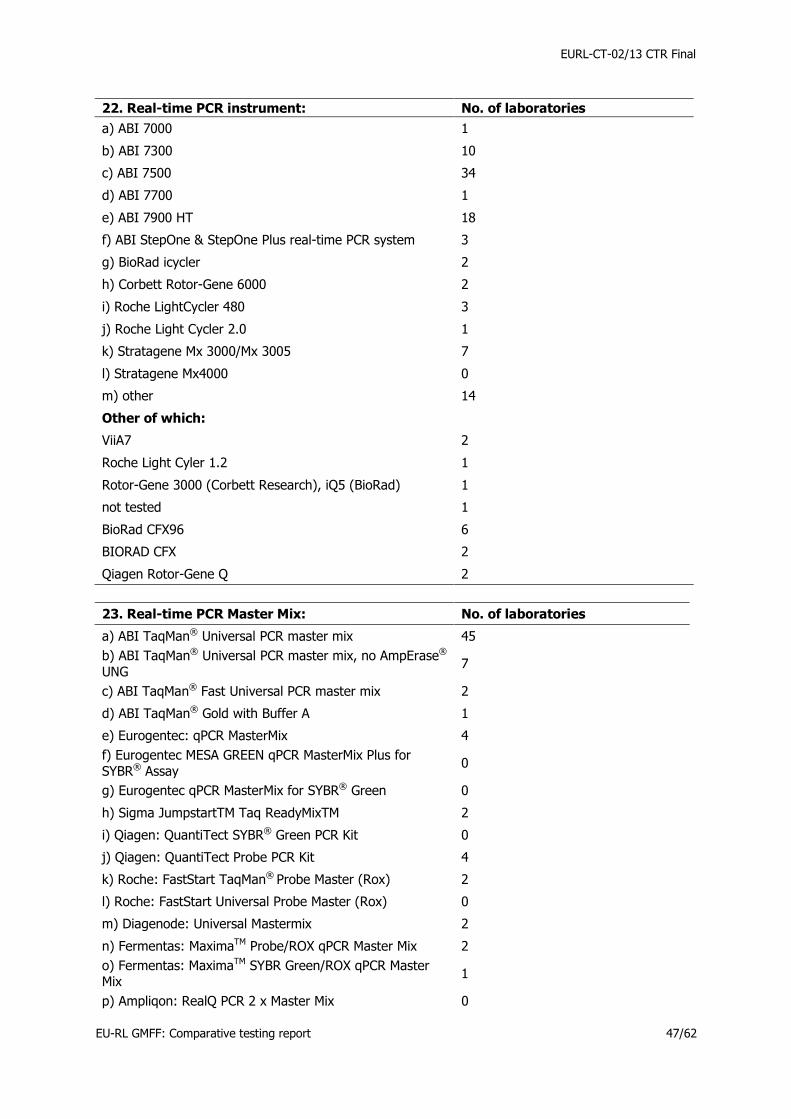
EURL-CT-02/13 CTR Final
EU-RL GMFF: Comparative testing report 47/62
22. Real-time PCR instrument: No. of laboratories
a) ABI 7000 1
b) ABI 7300 10
c) ABI 7500 34
d) ABI 7700 1
e) ABI 7900 HT 18
f) ABI StepOne & StepOne Plus real-time PCR system 3
g) BioRad icycler 2
h) Corbett Rotor-Gene 6000 2
i) Roche LightCycler 480 3
j) Roche Light Cycler 2.0 1
k) Stratagene Mx 3000/Mx 3005 7
l) Stratagene Mx4000 0
m) other 14
Other of which:
ViiA7 2
Roche Light Cyler 1.2 1
Rotor-Gene 3000 (Corbett Research), iQ5 (BioRad) 1
not tested 1
BioRad CFX96 6
BIORAD CFX 2
Qiagen Rotor-Gene Q 2
23. Real-time PCR Master Mix: No. of laboratories
a) ABI TaqMan® Universal PCR master mix 45
b) ABI TaqMan® Universal PCR master mix, no AmpErase®
UNG 7
c) ABI TaqMan® Fast Universal PCR master mix 2
d) ABI TaqMan® Gold with Buffer A 1
e) Eurogentec: qPCR MasterMix 4
f) Eurogentec MESA GREEN qPCR MasterMix Plus for SYBR® Assay
0
g) Eurogentec qPCR MasterMix for SYBR® Green 0
h) Sigma JumpstartTM Taq ReadyMixTM 2
i) Qiagen: QuantiTect SYBR® Green PCR Kit 0
j) Qiagen: QuantiTect Probe PCR Kit 4
k) Roche: FastStart TaqMan® Probe Master (Rox) 2
l) Roche: FastStart Universal Probe Master (Rox) 0
m) Diagenode: Universal Mastermix 2
n) Fermentas: MaximaTM Probe/ROX qPCR Master Mix 2
o) Fermentas: MaximaTM SYBR Green/ROX qPCR Master Mix
1
p) Ampliqon: RealQ PCR 2 x Master Mix 0
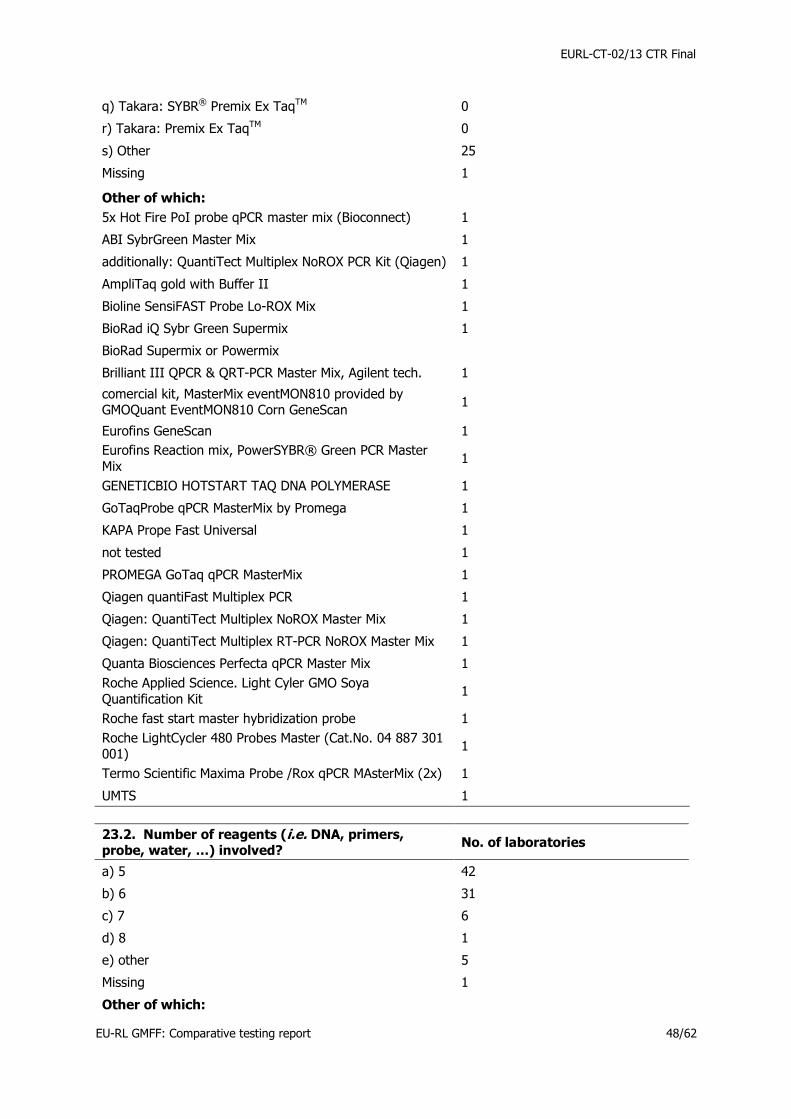
EURL-CT-02/13 CTR Final
EU-RL GMFF: Comparative testing report 48/62
q) Takara: SYBR® Premix Ex TaqTM 0
r) Takara: Premix Ex TaqTM 0
s) Other 25
Missing 1
Other of which:
5x Hot Fire PoI probe qPCR master mix (Bioconnect) 1
ABI SybrGreen Master Mix 1
additionally: QuantiTect Multiplex NoROX PCR Kit (Qiagen) 1
AmpliTaq gold with Buffer II 1
Bioline SensiFAST Probe Lo-ROX Mix 1
BioRad iQ Sybr Green Supermix 1
BioRad Supermix or Powermix
Brilliant III QPCR & QRT-PCR Master Mix, Agilent tech. 1
comercial kit, MasterMix eventMON810 provided by GMOQuant EventMON810 Corn GeneScan
1
Eurofins GeneScan 1
Eurofins Reaction mix, PowerSYBR® Green PCR Master Mix
1
GENETICBIO HOTSTART TAQ DNA POLYMERASE 1
GoTaqProbe qPCR MasterMix by Promega 1
KAPA Prope Fast Universal 1
not tested 1
PROMEGA GoTaq qPCR MasterMix 1
Qiagen quantiFast Multiplex PCR 1
Qiagen: QuantiTect Multiplex NoROX Master Mix 1
Qiagen: QuantiTect Multiplex RT-PCR NoROX Master Mix 1
Quanta Biosciences Perfecta qPCR Master Mix 1
Roche Applied Science. Light Cyler GMO Soya Quantification Kit
1
Roche fast start master hybridization probe 1
Roche LightCycler 480 Probes Master (Cat.No. 04 887 301 001)
1
Termo Scientific Maxima Probe /Rox qPCR MAsterMix (2x) 1
UMTS 1
23.2. Number of reagents (i.e. DNA, primers, probe, water, …) involved?
No. of laboratories
a) 5 42
b) 6 31
c) 7 6
d) 8 1
e) other 5
Missing 1
Other of which:
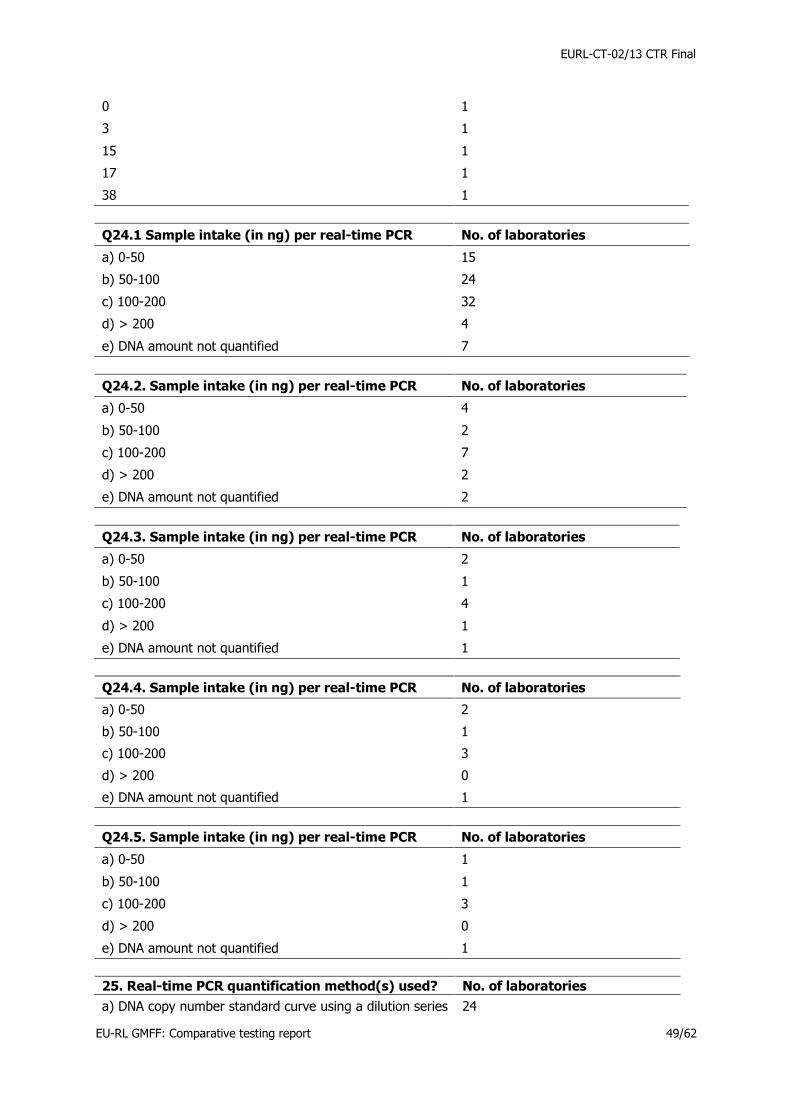
EURL-CT-02/13 CTR Final
EU-RL GMFF: Comparative testing report 49/62
0 1
3 1
15 1
17 1
38 1
Q24.1 Sample intake (in ng) per real-time PCR No. of laboratories
a) 0-50 15
b) 50-100 24
c) 100-200 32
d) > 200 4
e) DNA amount not quantified 7
Q24.2. Sample intake (in ng) per real-time PCR No. of laboratories
a) 0-50 4
b) 50-100 2
c) 100-200 7
d) > 200 2
e) DNA amount not quantified 2
Q24.3. Sample intake (in ng) per real-time PCR No. of laboratories
a) 0-50 2
b) 50-100 1
c) 100-200 4
d) > 200 1
e) DNA amount not quantified 1
Q24.4. Sample intake (in ng) per real-time PCR No. of laboratories
a) 0-50 2
b) 50-100 1
c) 100-200 3
d) > 200 0
e) DNA amount not quantified 1
Q24.5. Sample intake (in ng) per real-time PCR No. of laboratories
a) 0-50 1
b) 50-100 1
c) 100-200 3
d) > 200 0
e) DNA amount not quantified 1
25. Real-time PCR quantification method(s) used? No. of laboratories
a) DNA copy number standard curve using a dilution series 24
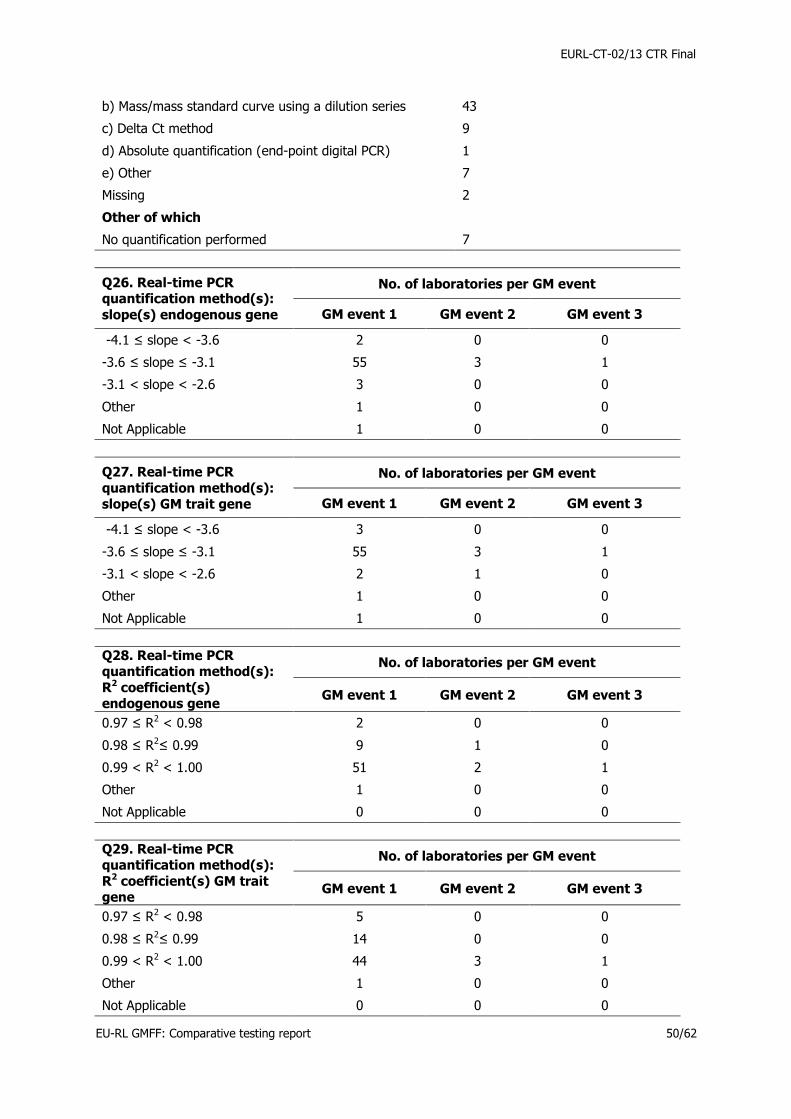
EURL-CT-02/13 CTR Final
EU-RL GMFF: Comparative testing report 50/62
b) Mass/mass standard curve using a dilution series 43
c) Delta Ct method 9
d) Absolute quantification (end-point digital PCR) 1
e) Other 7
Missing 2
Other of which
No quantification performed 7
Q26. Real-time PCR quantification method(s):
slope(s) endogenous gene
No. of laboratories per GM event
GM event 1 GM event 2 GM event 3
-4.1 ≤ slope < -3.6 2 0 0
-3.6 ≤ slope ≤ -3.1 55 3 1
-3.1 < slope < -2.6 3 0 0
Other 1 0 0
Not Applicable 1 0 0
Q27. Real-time PCR
quantification method(s): slope(s) GM trait gene
No. of laboratories per GM event
GM event 1 GM event 2 GM event 3
-4.1 ≤ slope < -3.6 3 0 0
-3.6 ≤ slope ≤ -3.1 55 3 1
-3.1 < slope < -2.6 2 1 0
Other 1 0 0
Not Applicable 1 0 0
Q28. Real-time PCR quantification method(s):
R2 coefficient(s) endogenous gene
No. of laboratories per GM event
GM event 1 GM event 2 GM event 3
0.97 ≤ R2 < 0.98 2 0 0
0.98 ≤ R2≤ 0.99 9 1 0
0.99 < R2 < 1.00 51 2 1
Other 1 0 0
Not Applicable 0 0 0
Q29. Real-time PCR quantification method(s):
R2 coefficient(s) GM trait gene
No. of laboratories per GM event
GM event 1 GM event 2 GM event 3
0.97 ≤ R2 < 0.98 5 0 0
0.98 ≤ R2≤ 0.99 14 0 0
0.99 < R2 < 1.00 44 3 1
Other 1 0 0
Not Applicable 0 0 0

EURL-CT-02/13 CTR Final
EU-RL GMFF: Comparative testing report 51/62
Q30. Real-time PCR
quantification method(s):
endogenous target DNA sequence(s)
No. of laboratories per GM event
GM event 1 GM event 2 GM event 3
Lectin 14 1 0
Lectin (74 bp) 29 0 0
Lectin (80 bp) 1 0 0
Lectin (81 bp) 5 0 0
Lectiin (102 bp) 2 0 0
Lectin (105 bp) 1 0 0
Lectin (118 bp) 3 0 0
SSIIb-3 1 0 0
CruA 1 0 0
TM013 1 0 0
nptII 1 1 0
HMG 1 0 0
HMG (79 bp) 1 0 0
invertase 1 1 0
sps (81 bp) 1 0 0
p35S 1 1 0
Q31. Real-time PCR
quantification method(s):
GM trait target DNA sequence(s)
No. of laboratories per GM event
GM event 1 GM event 2 GM event 3
DP356043 15 0 0
DP356043 (74 bp) 1 0 0
DP356043 (83 bp) 1 0 0
DP356043 (99 bp) 34 1 0
p35s 1 0 0
p35S, 82bp 2 1 0
specific for 1 0 0
RUR GTS 40-3-2 84 1 0 0
RR (83 bp) 1 0 0
MON810 1 0 0
Q32. Which reference material(s) was (were) used for calibration?
No. of laboratories
ERM 5
ERM-AD425 1
ERM-BF425 series 9
ERM-BF425a 1
ERM-BF425b 1

EURL-CT-02/13 CTR Final
EU-RL GMFF: Comparative testing report 52/62
ERM-BF425c 4
ERM-BF425d 38
ERM-BF410 series 1
ERM-BF410dk 1
ERM-BF410gk 2
Eurofins GeneScan 2
10% GTS 40-3-2 1
Single target 1
426d 1
biosmart exStGVO- 1
ERM-BF series 1
plasmid 1
EURL Plasmids 1
AOCS 034-B 1
EURL Stds from 1
AOCS 0906-B 1
Commercially 1
Q33. Which reference material(s) was (were) used for
quality control, e.g. bias control?? No. of laboratories
0.1% GTS 40-3-2 1
0.5% GTS 40-3-2 1
1% GTS 40-3-2 1
2% GTS 40-3-2 1
5% GTS 40-3-2 1
AOCS 0210-A 1
AOCS 0306-I 1
AOCS 0306-I2 1
AOCS 0306I4 (LL62) 1
AOCS 0311-A 1
AOCS 034-B 1
AOCS 0707B 1
AOCS 0707-B4 1
AOCS 0707C 1
AOCS 0707-C3 1
AOCS 0809-A 1
AOCS 0906B 3
AOCS 0911-C 1
AOCS 208 series 1
AOCS 306 SERIES 1
AOCS 707B 1

EURL-CT-02/13 CTR Final
EU-RL GMFF: Comparative testing report 53/62
AOCS 707-C AND 1
AOCS 804 series 1
Commercially 1
Control sample 3
CRL-40-3-2 1
CRL-A2704 1
CRL-DP356043 1
CRL-FG72 1
CRL-MON89788 1
CRM maize Bt 11; 1
CRM soya GTS40-3- 1
DNA potato 100% 1
356043 soya ERM- 2
ERM-BF series 1
ERM-BF410 series 3
ERM-BF410bk 2
ERM-BF410dk 1
ERM-BF410gk 2
ERM-BF411 1
ERM-BF412 1
ERM-BF412d 1
BF 413d 1
ERM-BF 414 series 1
ERM-BF415 1
ERM-BF425 serie 1
ERM AD425 1
ERM BF 425 3
ERM-BF425a 3
ERM BF 425b 16
ERM BF 425c 26
ERM BF 425d 11
426b 2
426c 2
EURL Plasmids 1
EURL Stds from 1
EURL-GMFF 2
FLUKA IRMM 1
GeneScan BTRICE PC 1
GT73/RT73 Canola 1
LL RICE 62 1
Maize NK603 ERM- 1

EURL-CT-02/13 CTR Final
EU-RL GMFF: Comparative testing report 54/62
Maize powder 1% 1
none 1
PENGL-00- 1
pENGL-00-04/07- 1
Rice Leaf DNA 100% 1
Roundup Ready 1
Single target 1
Soybean powder 1% 1
Sugar beet powder 1
Q34a. Practical LOD and LOQ (in %) of the GM content
determination in mass/mass or
DNA copy number ratio?
No. of laboratories - GM event 1
LOD (m/m)
LOQ (m/m)
LOD (cp/cp)
LOQ (cp/cp)
0.01 4 1
0.02 4
0.025 4
0.039 1
0.04 8 1
0.05 5 1
0.06 1 1
0.07 1
0.08 1 4
0.09 1 2 1
0.10 7 21 2 4
0.15 1
0.18 1 1
0.20 2 1 1
0.30 1 1 1
0.33 1
0.37 1
0.39 1
0.40 1
0.42 1
0.43 1
0.60 1 1
0.80 1
<=0.04 1
<=0.08 1
>0.10 1
L1 0.027; L2 0.030 1
L1 0.106; L2 0.121 1

EURL-CT-02/13 CTR Final
EU-RL GMFF: Comparative testing report 55/62
Not reported 43 47 77 74
Q34b. Practical LOD and LOQ (in %) of
the GM content determination in mass/mass or DNA copy number ratio?
No. of laboratories - GM event 2
LOD
(m/m)
LOQ
(m/m)
LOD
(cp/cp)
LOQ
(cp/cp)
0.005 1
0.20 1
0.29 1
0.58 1
0.60 1
Not reported 83 84 84 84
35.1. Does the uncertainty correspond to a
repeatability standard deviation? No. of laboratories
a) Yes 40
b) No 10
c) Not applicable 14
Not reported 21
35.2. Does the uncertainty correspond to a within-laboratory reproducibility standard
deviation?
No. of laboratories
a) Yes 25
b) No 24
c) Not applicable 12
Not reported 24
35.3. Does the uncertainty include a contribution
from the DNA extraction step? No. of laboratories
a) Yes 31
b) No 19
c) Not applicable 11
Not reported 24
35.5. Did you report an expanded uncertainty
including a coverage factor? No. of laboratories
a) Yes 48
b) No 4
c) Not applicable 12
Not reported 21

EURL-CT-02/13 CTR Final
EU-RL GMFF: Comparative testing report 56/62
35.6. If applicable, please specify the coverage
factor used (k = 1 for a 66.67% confidence level, k= 2 for a 95% confidence level, k = 3 for a 99%
confidence level):
No. of laboratories
a) k = 1 1
b) k = 2 46
c) k = 3 1
d) Other 5
Not reported 32
Other of which:
The coverage factor depend on the number of measurements (n=10 factor 2.262 and n=26 factor 2.060) for P=95% and f=n-1
1
2.78 1
Coverage factor dependent upon degrees of freedom and vary from 2.26 (9 d.f.) to 2.20 (11 d.f.)
1
k = 2.57 for sample L2, k = 2.78 for sample L1 1

EURL-CT-02/13 CTR Final
EU-RL GMFF: Comparative testing report 57/62
Annex 6: Invitation letter
EURL-CT-02/13 CTR Final
EU-RL GMFF: Comparative testing report 58/62

EURL-CT-02/13 CTR Final
EU-RL GMFF: Comparative testing report 59/62
Annex 7: Accompanying letter to shipment of samples

EURL-CT-02/13 CTR Final
EU-RL GMFF: Comparative testing report 60/62
EURL-CT-02/13 CTR Final
EU-RL GMFF: Comparative testing report 61/62
Annex 8: Confirmation of shipment
Dear Participant,
Your test parcels related to the eighth comparative testing round ILC-EURL-GMFF-CT-02/13 has left our premises today 15 April 2014 by TNT courier.
For your convenience, please find herewith the corresponding tracking number you could refer to in order to track the relevant materials on the Web:
25913 8945
The parcel with test items that you will receive should contain:
• Two plastic containers each containing approximately 10 g of test item; • An “acknowledgement of reception” form, that should be returned to the EU-RL GMFF as
scanned pdf by e-mail to [email protected]. • An accompanying letter. •
The accompanying letter contains your personal password for on-line submission of your results to the reporting website https://web.jrc.ec.europa.eu/ilcReportingWeb.
Your Lab Code (Lxx) is indicated in the accompanying letter as well in the “acknowledgement of reception” form in the upper right side of the page; please keep it for future uses in this CT round.
The deadline for submission of your results is 30 May 2014.
The questionnaire will be sent via separate e-mail.
Please contact only the functional mailbox [email protected] for any issue related to this comparative testing round.
Thank you for your collaboration.
Lorella Vidmar
On behalf of
The Comparative Testing staff
European Commission
DG Joint Research Centre
Institute for Health and Consumer Protection
Unit I.3 Molecular Biology and Genomics
TP 201 Via E. Fermi 2749
I-21027- Ispra (VA) Italy
Functional mailbox: [email protected]

EURL-CT-02/13 CTR Final
EU-RL GMFF: Comparative testing report 62/62
Annex 9: Acknowledgement of receipt

Europe Direct is a service to help you find answers to your questions about the European Union
Freephone number (*): 00 800 6 7 8 9 10 11
(*) Certain mobile telephone operators do not allow access to 00 800 numbers or these calls may be billed.
A great deal of additional information on the European Union is available on the Internet.
It can be accessed through the Europa server http://europa.eu.
How to obtain EU publications
Our publications are available from EU Bookshop (http://bookshop.europa.eu),
where you can place an order with the sales agent of your choice.
The Publications Office has a worldwide network of sales agents.
You can obtain their contact details by sending a fax to (352) 29 29-42758.
European Commission
EUR 26863 EN – Joint Research Centre – Institute for Health and Consumer Protection
Title: Comparative Testing Report on the Detection and Quantification of GM Events in Rice Noodles
Author(s): Niccolo Bassani, Adam Niedzwiecki, Angelo Collotta, Matteo Maretti, Wim Broothaerts, Marco Mazzara, Joachim
Kreysa
Luxembourg: Publications Office of the European Union
2014– 66 pp. – 21.0 x 29.7 cm
EUR – Scientific and Technical Research series – ISSN 1831-9424 (online)
ISBN 978-92-79-43165-4 (PDF)
doi: 10.2788/17942
ISBN 978-92-79-43165-4
doi: 10.2788/17942
JRC Mission
As the Commission’s
in-house science service,
the Joint Research Centre’s
mission is to provide EU
policies with independent,
evidence-based scientific
and technical support
throughout the whole
policy cycle.
Working in close
cooperation with policy
Directorates-General,
the JRC addresses key
societal challenges while
stimulating innovation
through developing
new methods, tools
and standards, and sharing
its know-how with
the Member States,
the scientific community
and international partners.
Serving society
Stimulating innovation
Supporting legislation
LB
-NA
-26
86
3-E
N-N