Embed Size (px)
Citation preview
1
No. 131
June 2016
Naohiro Kitano
Estimating China’s Foreign Aid II: 2014 Update
Comparative Study on Development Cooperation Strategies: Focusing on G20 Emerging Economies
Use and dissemination of this working paper is encouraged; however, the JICA Research Institute requests due acknowledgement and a copy of any publication for which this working paper has provided input. The views expressed in this paper are those of the author(s) and do not necessarily represent the official positions of either the JICA Research Institute or JICA. JICA Research Institute 10-5 Ichigaya Honmura-cho Shinjuku-ku Tokyo 162-8433 JAPAN TEL: +81-3-3269-3374 FAX: +81-3-3269-2054
1
Estimating China’s Foreign Aid II: 2014 Update
Naohiro Kitano*
Abstract This paper aims to present updated estimates of China's foreign aid between 2001 and 2014 as a proxy for China’s Official Development Assistance (ODA) as defined by the OECD-DAC, and to compare the results with the ODA of other DAC members. An estimation process is introduced which has been modified from the one proposed in the previous work (see Kitano and Harada 2014). China’s net foreign aid increased steadily from US$ 5.2 billion in 2012 to US$ 5.4 billion in 2013 (the previous estimates of US$ 5.7 billion and US$ 7.1 billion were downwardly revised) and unexpectedly dropped to US$ 4.9 billion in 2014. Since 2013, China has maintained its ranking at number 9. China’s bilateral foreign aid has been ranked at number 6, next to Japan and France, since 2012, while multilateral foreign aid has been relatively less significant. As a reference, it is estimated that net disbursements of preferential export buyer’s credits decreased from US$ 4.9 billion in 2012 to US$ 4.7 billion in 2013 (the previous estimate amounting to US$ 7.0 billion was downwardly revised), and increased again to US$ 6.1 billion in 2014. China’s foreign aid is expected to increase and catch up with the top five DAC members in the foreseeable future.
Keywords: China, foreign aid, development finance, ODA, concessional loans, OECD-DAC
* Director, JICA Research Institute, Japan International Cooperation Agency (JICA) ([email protected]) This paper is part of the JICA Research Institute’s research project, “Comparative Study on Development Cooperation Strategies: Focusing on G20 Emerging Economies.” I would particularly like to thank Yukinori Harada, my former colleague, for his significant contribution as co-author of the JICA-RI Working Paper No.78, upon which this paper was based. I would like to thank many researchers and practitioners for providing valuable suggestions and information. Those include Deborah Bräutigam, Christophe Bahuet, David Shambaugh, Richard Bush III, Nathaniel Ahrens, Erica Downs, Yukon Huang, Adrian Ng’asi, Yan Wang, Thomas Fues, Wonhyuk Lim, Roger Nord, Wenjie Chen, and Richard Manning. I express appreciation to Yasutami Shimomura, Jin Sato, Keiichi Tsunekawa, Akihiko Tanaka, Akio Hosono, and Hiroaki Shiga for their comments and advice. I also thank Sachiko Mitsumori, Yasuhiko Sato, and Aiko Oki for the support they gave me while I was completing this paper. I acknowledge that I am solely responsible for the interpretation of sources and for any errors in this paper. The views expressed in this paper do not necessarily reflect those of JICA.
2
1. Introduction
This paper aims to present updated estimates of China's foreign aid volumes between 2001 and
2014 as a proxy for China’s Official Development Assistance (ODA) defined by the
Development Assistance Committee (DAC) of the Organisation for Economic Co-operation
and Development (OECD), and to compare the results with the ODA of other DAC members. I
draw on budget data from the websites of 50 departments 1 and from other relevant
organizations within China, as well as from other relevant sources of information. The
estimation process I have chosen to use has been modified from the one proposed in the previous
work of Kitano and Harada 20142 so that I have been able to revise and update the previous
estimates for the period between 2001 and 2014.
The previous work showed that China’s net foreign aid has grown rapidly since 2004,
reaching US$ 7.1 billion in 2013. The share of bilateral aid is much larger than that of
multilateral aid. The results have presented a relatively realistic view of China’s foreign aid; its
ranking had been moderate, ranking below number 13 until 2008, before moving rapidly up to
number 6 in 2012. As a point of reference, the net disbursement of preferential export buyer’s
credits was estimated to have been US$ 7.0 billion in 2013.
What distinguishes this estimate from Chinese government’s official figures and other
estimates, is that as a practical definition of China’s foreign aid it first introduces the concept
of net and gross disbursements of foreign aid (net and gross foreign aid), in a way that is as
comparable as possible to that for the net and gross disbursements of ODA. Secondly, the
estimate includes multilateral aid within the total aid, and thirdly, disaggregated
1 In this paper, ‘departments’ refers to Ministries, Commissions, Administrations, Institutions, and Offices under the State Council. 2 Kitano and Harada, 2014, “Estimating China’s foreign aid 2001-2013,” JICA Research Institute (JICA-RI) Working Paper, No. 78, originated during the process of writing Kitano (2014). It was later published online in the Journal of International Development in March 2015 (Kitano and Harada 2015). In this paper, the terms “Kitano and Harada (2014),”“the previous work,” “the previous estimates,” “the previous scenario,” or “the previous paper,” all refer to Kitano and Harada (2014).
3
department-level budget data sets are used to estimate grants and interest-free loans as well as
multilateral aid.
The results of the previous work were presented on a number of occasions and a
number of comments and suggestions were offered;3 some examples of these are as follows:
An estimate of 0.072% as China’s net ODA/GNI ratio4 in 2012 may be too high; the expected
annual growth rate of China’s foreign aid in the previous scenario, which is 15%,5 is too high
and should be level with the GDP growth rate; it is important to capture the volume of
development finance and include not only foreign aid but also other official flows; the previous
work did not provide regional or sector analysis (Zhang, Gu, and Chen 2015).
I have incorporated some of those comments and suggestions into the present paper.
For example, in the previous work the annual rate of increase in gross disbursements of
concessional loans provided by the Export-Import Bank of China (China Eximbank) was
simply assumed based on the average annual rate of increase of 33% from 2006 to 2011. To
incorporate the abovementioned comments on net ODA/GNI ratio and the expected annual
growth rate of China’s foreign aid contained in the previous work, I have introduced a
3 The seminars during which feedback was offered include a seminar on “Estimating China’s Foreign Aid” co-hosted in Beijing by the Institute of International Development Cooperation of Chinese Academy of International Trade and Economic Cooperation (CAITEC) and the JICA China Office on November 26, 2014 (http://jica-ri.jica.go.jp/topic/post_159.html [all of the URLs in these footnotes were accessed on April 3, 2016.]); a roundtable hosted by the Center for Strategic and International Studies (CSIS) on February 3, 2015 (http://jica-ri.jica.go.jp/topic/post_176.html); a Joint Symposium by the German Development Institute (DIE) and the JICA Research Institute JICA-RI “Evolving Perspectives on the Post-2015 Agenda: The Role of Emerging Economies and OECD Countries” on March 19, 2015 (http://jica-ri.jica.go.jp/topic/post_141.html); an internal seminar at USAID on April 9, 2015; the 2015 Conference “Researching China’s Overseas Finance and Aid: What, Why, How, Where and How Much?” hosted by the China Africa Research Initiative (CARI) at Paul H. Nitze School of Advanced International Studies (SAIS), Johns Hoskins University on April 10, 2015 (http://www.sais-cari.org/event-details/2015/4/10/chinese-overseas-finance-conference-2015); “China's Overseas Development Policy in a World 'Beyond Aid'” hosted by the Asia Foundation in Bangkok on June 9-10, 2015 (https://asiafoundation.org/resources/pdfs/ChinasOverseasDevelopmentPolicyRoundTableReport2015FINAL.pdf); and many other seminars and briefings in Japan. 4 “Regarding the ranking in terms of net ODA/GNI ratio, China (0.07) is 29th in 2012,” Kitano and Harada, 2014, 11: footnote 27. 5 “If China’s net foreign aid continues to increase by 15% annually, it will exceed France’s current (2013) ODA level in 2017,” (Kitano and Harada 2014, 11)
4
modified process for estimating the gross disbursements of concessional loans in 2012, 2013,
and 2014. I found that there might be weak regularity within a cumulative amount of the
framework loan agreement (“the framework agreement”), the project loan agreement (“the
loan agreement”), and the gross disbursement of concessional loans:6 the cumulative amount
of the gross disbursements of concessional loans in a given year is similar to that of the loan
agreement signed two years ago, which is in turn similar to that of the framework agreement
from one year prior to that. This weak regularity has been used to estimate the gross
disbursements of concessional loans in this paper.
As a result of introducing this modified estimation process, it was found that China's
foreign aid volumes in 2012 and 2013 were significantly smaller than the previous estimates -
China’s ranking was number 10 in 2012 and number 9 in 2013, rather than number 6 as it was
estimated in the previous work. Furthermore, the estimate made in 2014 implied that China’s
foreign aid had decreased from 2013. If these results are close to accurate, the current estimates
carry significant weight.
The rest of this paper proceeds as follows: Section two will review recent official
documents and relevant literature. Section three will reiterate the definition of China’s foreign
aid as a proxy for ODA. Section four will show the estimation process I employed in this paper.
Section five will present the revised and updated estimates of China’s net and gross
disbursements of foreign aid (net and gross foreign aid) through the estimation process and
compare the results of this paper with the estimates given in the previous paper, the official
figure given by China, and the DAC’s estimates. Section six will compare the results with the
net and gross disbursements of ODA extended by DAC members. Section seven concludes the
paper.
6 In relation to concessional loans, China Eximbank signs a project loan agreement with the borrower based on the framework loan agreement signed between the Chinese government and the government of the borrowing country, (see http://english.eximbank.gov.cn/tm/en-TCN/index_640.html [accessed on June 14, 2016 ]).
5
2. Recent official documents and relevant literature
“The 2011 White Paper” on China’s foreign aid (Information Office of the State Council, 2011)
was published in 2011, and was then followed by “the 2014 White Paper” (Information Office
of the State Council, 2014) released in 2014. The 2014 White Paper stated that the aggregate
amount of China’s foreign aid from 2010 to 2012 was RMB 89.34 billion (US$ 13.7 billion).7
Even though the 2014 White Paper provided more information than the 2011 White Paper,8
there is still room for improvement; for example, the 2014 White Paper does not present the
annual amount of China’s foreign aid, the disaggregated amount by country and sector, or the
consolidated amount of all forms of assistance described in the document as being covered not
only by the foreign aid budget but also other budget items.9
In November 2014, the Ministry of Commerce (MOFCOM) released “Measures for
the Administration of Foreign Aid (For Trial Implementation).”10 According to MOFCOM,
this was the first comprehensive departmental regulation on the management of foreign
assistance.11 In this document, the term “foreign aid” refers to those activities which provide
economic, technical, material, human resources, and administrative support to recipient
7 Here the three year average for exchange rates of US$/RMB 6.5147 is used. This consists of a grant of RMB 32.32 billion (US$ 5.0 billion), interest-free loans RMB 7.26 billion (US$ 1.1 billion), and concessional loans RMB 49.76 billion (US$ 7.6 billion). With regard to regional distribution, Africa (51.8%) and Asia (30.5%) remain the two largest recipient regions. 8 The 2014 White Paper not only succeeded the 2011 White Paper’s framework but also included a description of the activities of other departments and non-governmental organizations, regional cooperation frameworks such as the Forum on China-Africa Cooperation (FOCAC), and support through the development assistance programs of multilateral organizations, such as the United Nations Development Programme (UNDP). 9 For example, as described in the 2014 White Paper, from 2010 to 2012, China contributed RMB 1.76 billion (US$ 0.3 billion) to development assistance programs initiated by various UN agencies. However, these contributions are categorized as budget items for international organizations, not as budget items for foreign aid. For more details, see Section 4. 10 As to UNDP China's unofficial translation not being proofread by MOFCOM, see http://www.cn.undp.org/content/china/en/home/library/south-south-cooperation/measures-for-the-administration-of-foreign-aid-.html (accessed March 21, 2016). 11 See MOFCOM’s media briefing on this regulation, http://english.mofcom.gov.cn/article/newsrelease/press/201412/20141200851923.shtml (accessed May 8, 2016.)
6
countries, supported by the Chinese government's “financial resources for foreign aid.”12 The
forms of foreign aid outlined in this document are similar to those in the 2011 and 2014 White
Papers; namely, grants, interest-free loans, and concessional loans. The regulations stipulate
that MOFCOM is, in conjunction with the relevant departments under the State Council,
responsible for formulating mid- to long-term foreign aid policy and country aid strategies,
which shall be implemented upon approval. MOFCOM is responsible for collecting, collating,
and preparing statistical material on foreign aid. The release of this document is a significant
step towards enhancing China’s institutionalization of aid mechanisms. However, due to the
definition of “foreign aid” mentioned above, MOFCOM was unable to consolidate other
relevant forms of assistance covered by other budget items, such as “international
organizations.” In the next section, the definition of foreign aid proposed in this paper will be
compared with MOFCOM’s official definition.
The DAC (OECD 2015) estimated China’s gross concessional flows for development
cooperation including bilateral cooperation and developmental funds channeled through
multilateral organizations. The former was estimated based on the budget data (the final
accounts of central-level public budget expenditure for foreign aid) from China’s Ministry of
Finance, while the latter was estimated based on information from those multilateral
organizations. My estimates have several differences with the DAC’s estimates: firstly, the net
disbursements of concessional loans have been included; secondly, as was the case for
multilateral foreign aid, budget data from the Chinese government rather than information
from multilateral organizations was used so that bilateral and multilateral foreign aid data
could be compiled in a coherent manner.
A number of relevant articles concerning China’s foreign aid have recently been
published. Some of the articles have tried to capture not only foreign aid but also other types of
12 These financial resources are categorized as budget items for foreign aid.
7
development finance. Using the previous work as one of her information sources, Snell (2015)
tried to estimate China’s inbound and outbound development finance, where foreign aid was
part of the total volume, and to evaluate the objectives and impact of these flows. Hwang,
Bräutigam, and Eom (2016) have constructed a commitment-based database of Chinese loans
in Africa between 2000 and 2014, granted mainly by China Eximbank, China Development
Bank (CDB), and Chinese contractors. The database shows that loan amounts increased
steadily over that period. The authors also found that China Eximbank’s annual commitment
amounts were smaller than those of the World Bank loans and they predicted that, in the near
future, the former will exceed the latter.
Pigato and Tang (2015) reviewed the latest information available on trade and foreign
direct investment (FDI) flows between China and Sub-Saharan Africa (SSA), as well as
Chinese loans to SSA. Bräutigam and Gallagher (2014) attempted to capture the volume of
“commodity-backed” or “resource-secured” loans in Africa and Latin America. With regard to
the concessionality of China’s foreign aid, Harada presented his findings that the lending terms
of China’s development finance are not as concessional as that of the DAC members.13
Several pieces of literature have focused on sectoral analyses in specific regions
(Bräutigam 2015; Gransow 2015). Researchers, such as Lin and Wang (2015), have discussed
China’s development finance within the context of the future direction of its development
cooperation, while Fues and Ye (2014) focused on the Post-2015 Agenda for Global
Development from the perspective of China and Europe and discussed the issues relating to
development finance.
In Kitano and Harada (2014), the authors pointed out that several recipient countries
categorize concessional loans and preferential export buyer's credits as ODA loans. From the 13 See panel 3B: Comparisons of the 2015 Conference: “Researching China’s Overseas Finance and Aid: What, Why, How, Where and How Much?” hosted by the China Africa Research Initiative (CARI) at Paul H. Nitze School of Advanced International Studies (SAIS), Johns Hoskins University on April 10, 2015. http://www.sais-cari.org/event-details/2015/4/10/chinese-overseas-finance-conference-2015 (accessed April 3, 2016).
8
perspective of the recipient countries, Kitano (2015) introduced three case studies, namely
Cambodia, Tajikistan, and Sri Lanka. Using Chinese development cooperation data reported by
eleven countries during the 2013 Global Partnership for Effective Development Cooperation
monitoring process, UNDP China (2015) studied the ways in which China’s development
cooperation data was managed within the respective countries.
3. Definition of China’s foreign aid
Following Kitano and Harada (2014), in this paper China’s foreign aid is defined as the net and
gross disbursements of foreign aid (net and gross foreign aid) consisting of: (1) grants and
interest-free loans14 managed by the Ministry of Commerce (MOFCOM); (2) grants managed
by other departments responsible for foreign aid; (3) scholarships provided by the Ministry of
Education to students from other developing countries; (4) the estimated amount of interest
subsidies on concessional loans which is deducted from the total amount of aid; (5) the net and
gross disbursements of concessional loans as bilateral foreign aid; and (6) multilateral foreign
aid, which is defined as the cumulative amount of expenditure by departments and other relevant
14 According to the 2011 and 2014 White Papers, interest-free loans which had a tenure of 20 years, including five years of use, a five year grace period, and a ten year repayment period, were canceled totaling approximately RMB 27 billion (US$ 4.3 billion, using the annual average exchange rate in 2012: 6.3123 RMB/US$) incurred by mature interest-free loans, which is about one-third of what China had committed. This implies that only part of the mature interest-free loans has been repaid by borrowing countries and that China most likely continues to cancel debts. While interest-free loans currently continue to be provided to other developing countries with relatively good economic conditions, the total volume is said to be relatively small. In a similar manner to grants, the disbursements of interest-free loans are 100% financed by central government expenditure. For the reasons mentioned above, and for the convenience of estimation, interest-free loans were treated as though they were grants. Thus, the amount of the abovementioned debt relief for interest-free loans was not included in the total amount of aid. So far there has not been any evidence that China Eximbank canceled debts incurred by mature concessional loans. There is only one exception - that the Chinese government announced in 2009 to convert China Eximbank’s concessional loans to Afghanistan amounting USD 75 million into a grant (see http://tr.china-embassy.org/chn/xwdt/t655748.htm [in Chinese]. Accessed May 21, 2016). In 2002, China made a commitment to provide foreign assistance to Afghanistan amounting to US$ 150 million for the next 5 years, half of which was grant and the rest of which was concessional loans (see http://af.mofcom.gov.cn/article/zxhz/201501/20150100879514.shtml [in Chinese]. Accessed May 21, 2016). However, this was not considered in the present estimations as the amount is limited.
9
organizations with a budget for international organizations, adjusted by the DAC-defined
coefficients for core contributions.
What distinguishes these estimates from MOFCOM’s official definition of foreign aid
is that the MOFCOM definition does not cover points (3), (4), (6) or part of (2) above. Further,
MOFCOM’s official figures are aggregated amounts and in the case of grant and interest-free
loans, they are most likely commitment-based. Additionally, in the case of concessional loans,
they are most likely to be framework agreement-based rather than disbursement-based.15
4. Process used for estimating China’s foreign aid
This section will outline the process I used to estimate China’s net and gross foreign aid from
2001 to 2014, which was based on the definition presented in the previous section.
Comprehensive spreadsheets were compiled in order to make the most of statistics and
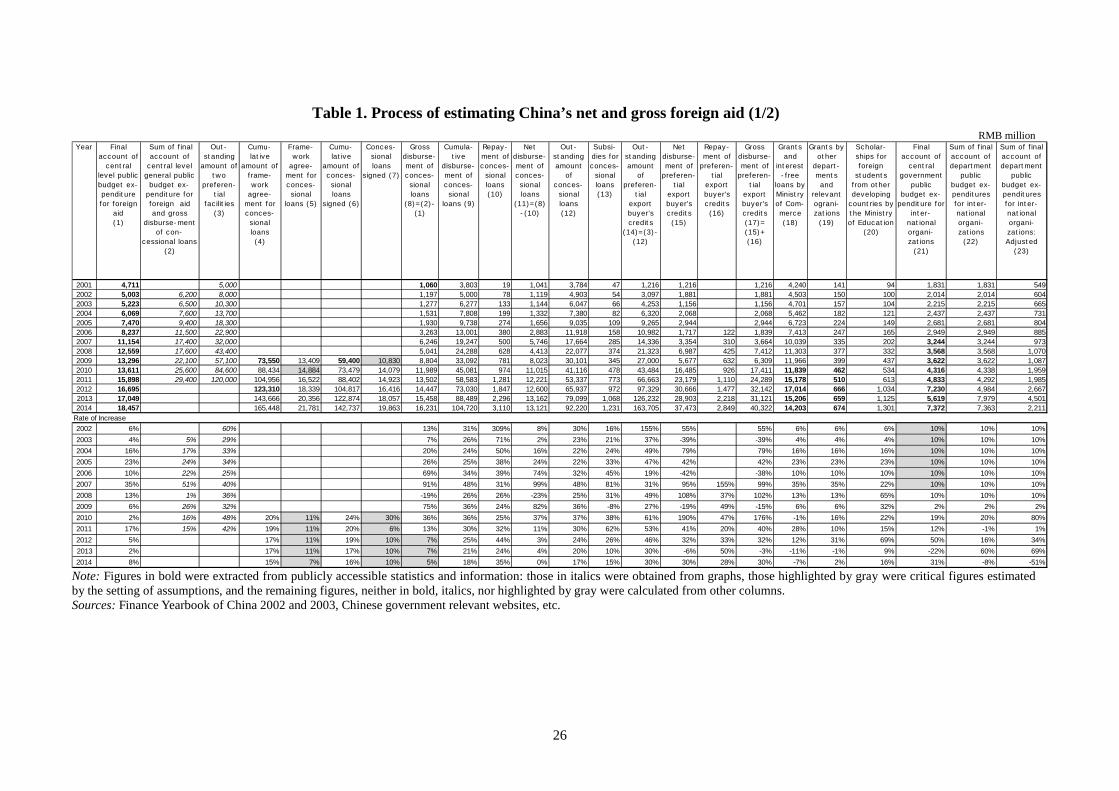
information from a large number of sources in a systematic way. Table 1 presents a detailed
summary of the estimation process. The figures in bold were extracted from publicly
accessible statistics and information, those in italics were obtained from graphs, those
highlighted in gray were critical figures estimated by the setting of assumptions, and the
remaining figures (neither in bold, italics, nor highlighted in gray) were calculated from other
columns. Figures from 2001 to 2011 and those from 2012 to 2014 were estimated using a
different process. As mentioned in section one, at various seminars comments were offered
15 As discussed in the previous work, Citing Chen (2010), Hu and Huang (2012) explained that by the end of 2009, the Chinese government had signed framework agreements for concessional loans totaling RMB 77 billion, and China Eximbank had signed concessional loans totaling RMB 59.4 billion, to support 325 projects in 76 countries. Since the cumulative amount of RMB 73.55 billion for concessional loans in 2009 mentioned in the 2011 White Paper is close to the abovementioned cumulative total of the signed framework agreements, I assume that the figure for concessional loans in the 2011 White Paper is framework agreement-based. The figure for concessional loans in the 2014 White Paper is also assumed to be framework agreement-based. As is also the case for grants and interest-free loans, the figures in the 2011 and 2014 White Papers are assumed to be commitment-based rather than disbursement-based. As I will discuss in Section four, disbursement-based figures for grant and interest-free loans come from the final accounts on public budget expenditure from relevant departments and other organizations, while those for concessional loans come from various sources.
10
on the net ODA/GNI ratio and the expected annual growth rate of China’s foreign aid as
discussed in the previous work; these comments have been incorporated into the current
estimation process. It was found that there might be weak regularity in terms of time lag
among cumulative amounts of the framework agreement, loan agreement, and gross
disbursement of concessional loans: the cumulative amount of gross disbursements of
concessional loans in a given year is similar to that of the loan agreements signed two years
ago, which is similar to that of the framework agreement from one year prior to that. This weak
regularity was then used to estimate the gross disbursements of concessional loans in 2012,
2013, and 2014, as follows:
Column (1), “Final account of central level public budget expenditure for foreign aid,”
was obtained from the Finance Yearbook of China for 2002 and 2003, and the website of the
Ministry of Finance.16 Column (2), “Sum of final account of central level public budget
expenditure for foreign aid and gross disbursement of concessional loans” was obtained from a
bar graph.17 Column (3), “Outstanding amount of two preferential facilities”18 by China
Eximbank was inferred from a line graph without scale.19 The figures for 2009 and 2012 in
Column (4), “Cumulative amount of framework agreement for concessional loans” are given
from the 2011 and 2014 White Papers. Then, I first estimated the figure for 2010 in Column (5),
“Framework agreement for concessional loans,” assuming the figure for 2010 in Column (18),
“Grants and interest-free loans by Ministry of Commerce” as the commitment-based amount of
grants and interest-free loans in 2010, and multiplying it by the ratio of the cumulative amount
16 See http://yss.mof.gov.cn/zhengwuxinxi/caizhengshuju/ [in Chinese] (accessed February 21, 2016). 17 This bar graph was uploaded as part of a presentation on the website of UN ESCAP Sub-regional Office for East and North-East Asia (SRO-ENEA). See http://www.unescap.org/sites/default/files/Session1_Li_China.pdf (accessed March 2 2016). 18 China Eximbank’s two preferential facilities consist of concessional loans and preferential export buyer’s credits. 19 This line graph was included in a presentation uploaded on the website of China International Contractors Association. See http://www.chinca.org/cms/html/2013im/col515/2013-12/03/20131203151208795226928_1.html [in Chinese] (accessed March 2, 2016).
11
of the framework agreement for concessional loans (RMB 49.76 billion) divided by the
cumulative amount of grants and interest-free loans by the Ministry of Commerce (RMB 39.58
billion) from 2010 to 2012, as stated in the 2014 White Paper.20 I then estimated figures for
2009, 2011, 2012, and 2013 using the inferred rate of increase between 2009 and 2013, which
was 11%.21 Regarding the figure for 2014, in order to incorporate one of the comments
mentioned in section one that the expected annual growth rate of China’s foreign aid in the
previous scenario, which was 15%, was too high and should be at the level of the GDP growth
rate, the annual rate of increase in 2014 was assumed to be 7%, which was the same range of
China’s GDP growth (7.3% in 2014). 22 The figure for 2009 contained in Column (6),
“Cumulative amount of concessional loans signed” was given as RMB 59.4 billion, based on
Hu and Huang (2012). I then inferred the figure for 2009 in Column (7), “Concessional loans
signed,” through multiplying the figure for 2009 in Column (6) by the ratio of the figure for
2009 in Column (5) divided by the figure for 2009 in Column (4). The figures from 2010 to
2014 in Column (7) were inferred by assuming the rates of increase to be set by 30%, 6%, 10%,
10% and 10% for 2010, 2011, 2012, 2013, and 2014 respectively, based on the weak regularity
mentioned above.
Figures from 2002 to 2011 in Column (8), “Gross disbursement of concessional loans”
were calculated by subtracting Column (1) from Column (2). Figures for 2001 came from the
China Eximbank 2001 Annual Report in which annual gross disbursements from concessional
loans from 1996 to 2001 were recorded. Figures from 2012 to 2014 were inferred by assuming
the rate of increase in Column (7) as 7%, 7%, and 5% for 2012, 2013, and 2014 respectively,
20 As discussed previously, this figure in the 2014 White Paper is most likely commitment-based rather than disbursement-based. 21 I estimated this rate at which the cumulative amount of the framework agreement for concessional loans from 2010 to 2012 in Column (5) nearly equal to the corresponding figure (RMB 49.76 billion) in the 2014 White Paper. 22 IMF (2016) World Economic Outlook Update https://www.imf.org/external/pubs/ft/weo/2016/update/01/pdf/0116.pdf (accessed March 11 2016).
12
based on the weak regularity mentioned above.23 Column (10), “Repayment of concessional
loans” was estimated using data in Column (8) by assuming that a condition of the loan was a 15
year repayment period with a 5 year grace period. Column (11), “Net disbursement of
concessional loans” was obtained by subtracting Column (10) from Column (8). Column (12),
“Outstanding amount of concessional loans” was calculated by adding this year’s figure in
Column (11) to the previous year’s figure in Column (12). Column (13), “Subsidies for
concessional loans,” were estimated by assuming that one third of the interest rate difference
between the lending rate of concessional loans and the RMB benchmark loan interest rate has
been subsidized by the government. 24 Figures from 2001 to 2011 in Column (14),
“Outstanding amount of preferential export buyer's credits” were calculated by subtracting
Column (12) from Column (3). Those from 2012 to 2014 were derived by subtracting the
outstanding amount of export buyer’s credits in each annual report of the China Eximbank
from the sum of the outstanding amount of export buyer’s credits and preferential export
buyer's credits. Figures in Column (15), “Net disbursement of preferential export buyer's
credits” were calculated by subtracting the previous year’s figure from the current year’s figure
in Column (14). Column (16), “Repayment of preferential export buyer's credits” was
estimated using data in Column (14), and assuming the loan conditions of a 15 year repayment
23 In Kitano and Harada (2014), the average annual rate of increase of gross disbursement of concessional loans from 2006 to 2011 (33%) was used to estimate the figures in 2012 and 2013. 24 According to the 2014 White Paper, the difference between the lending rate of concessional loans and the RMB benchmark loan interest rate (for loans with more than 5 years of repayment period). promulgated by the People’s Bank of China is to be subsidized by the government. Since this subsidy is an internal transfer, it must be deducted from total amount of foreign aid (Kobayashi and Shimomura 2013). “Audit results of budget implementation and other government revenue and expenditure of the Ministry of Commerce for the year 2012” issued by the National Audit Office disclosed aid data for Foreign concessional loans assistance and the interest subsidy which was RMB 0.99 billion while my estimate of the interest subsidy in 2012 was RMB 2.92 billion. (Available from http://www.audit.gov.cn/n1992130/n1992150/n1992500/n3296930.files/n3297153.pdf under http://www.audit.gov.cn/n1992130/n1992150/n1992500/3296930.html [in Chinese] [accessed March 5 2016]). Thus it is assumed that one third of the interest rate difference has been subsidized by the government. As for preferential export buyer’s credits, it is assumed that the interest rate difference has been entirely cross-subsidized.
13
period with a 5 year grace period. Column (17), “Gross disbursement of preferential export
buyer's credits” 25 was calculated by adding Column (15) and Column (16) together.
There are 11 departments and other relevant organizations26 that have the budget
sub-item, “Foreign aid (20203),” while 50 have the budget sub-item, “International
organizations (20204)” under the budget item, “Foreign affairs (202)” for at least one year
between 2010 to 2014.27 The figures in Column (18), “Grants and interest-free loans by the
Ministry of Commerce” between 2010 and 2014 were obtained from the final departmental
accounts on public budget expenditure from the Ministry of Commerce (MOFCOM). Figures
between 2001 and 2009 were derived through the assumption that 90% of the final account of
the central level public budget expenditure for foreign aid Column (1) was appropriated to and
implemented by MOFCOM (Grimm et al. 2011). Figures from 2010 to 2014 Column (19),
“Grants by other departments,” consist of the National Health and Family Planning Commission
(the former Ministry of Health), which has jurisdiction over the Chinese medical teams working
abroad, and several other departments.28 Figures from 2010 to 2014 were obtained from the
25 As for the positioning of Column (8), "Gross disbursement of concessional loans," Column (17), "Gross disbursement of preferential export buyer's credits," Column (12), "Outstanding amount of concessional loans," Column (14), "Outstanding amount of preferential export buyer's credits," and Column (3) "Outstanding amount of two preferential facilities" in China Eximbank’s account, share percentages of the gross disbursement of concessional loans and preferential export buyer’s credits in 2014, were a relatively small 2% and 4% respectively; even the percentages of outstanding amount were 5% and 9% respectively. (See Annex Table 1.) 26 Those departments and other relevant organizations are categorized as Ministries and Commissions, Special Organization, and Organizations directly under the State Council, Administrative Offices under the State Council, Institutions directly under the State Council, State Bureaus administered by Ministries or Commissions, Advisory and Coordinating Organs under the State Council, Departments of the Communist Party of China (CPC) Central Committee, Institutions directly under the CPC Central Committee, Subsidiaries of institutions directly under the CPC Central Committee, and Mass Organization Agencies under the administration of the authorized State Council departments. (For example, see http://www.china.org.cn/china/leadership/node_7178530.htm#a1, http://www.scopsr.gov.cn/zybw/ [in Chinese], http://www.lawinfochina.com/display.aspx?lib=law&id=5613&CGid=, etc. [accessed March 19, 2016]). Some of these sources do not disclose budget documents. 27 As for budget items, for example, see www.minhe.gov.cn/images/2015033115150590.xls [in Chinese] (accessed March 19, 2016). 28 Other relevant departments include the Ministry of Science and Technology, the National Development and Reform Commission (NDRC), the Ministry of Education (MOE), and the Ministry of Agriculture (MOA), the Ministry of Civil Affairs (MOCA), the State Oceanic Administration (SOA), and the State Administration of Cultural Heritage (SACH). Foreign aid budgets were also appropriated
14
foreign aid expenditure in the final accounts of the relevant departments. It was assumed that
from 2001 to 2009, grants for other departments were 3% of the final account of central level
public budget expenditure for foreign aid (See Annex Table 2).
Column (20), “Scholarships for foreign students from other developing countries by the
Ministry of Education,” was estimated based on the assumption that two-thirds of foreign
students receiving Chinese government scholarships are from other developing countries. Thus,
in the final accounts of the Ministry of Education from 2008 to 2014, two-thirds of the total
expenditure for scholarships for foreign students studying in China (budget second sub-item
(2050602)) was identified as foreign aid. The ratio of scholarships for foreign students from
other developing countries divided by the final account of central-level public budget
expenditure for foreign aid (Column (1)), which was 2% in 2008, was used to estimate the
figures from 2001 to 2007.
In relation to China’s multilateral foreign aid, the DAC defines multilateral ODA as
contributions to multilateral agencies active in the development on the DAC List of
ODA-eligible International Organizations.29 If an agency’s core-funded activities are only in
part development-related, the coefficients for core contributions are determined to assess the
share which corresponds to their development activities. The DAC (OECD 2015) estimated
China’s development-oriented contributions to and through multilateral organizations as a
three year average between 2011 and 2013 mainly based on the websites of multilateral
organizations. Referring to the DAC’s estimates, I attempted to estimate China’s multilateral
foreign aid based on China’s budget information.
to the All-China Women's Federation (ACWF) and the Red Cross Society of China (RCSC) (only in 2013) occasionally. These departments have released their budgets and final accounts including foreign aid expenditure on their websites. 29 See OECD (2013) and http://www.oecd.org/dac/stats/annex2.htm for the latest list (accessed March 16, 2016).
15
Column (21), “Final account of central government public budget expenditure for
international organizations”30 was obtained from the website of the Ministry of Finance and
covers figures from 2007 to 2014. I assumed that from 2001 to 2007, budget expenditure for
international organizations had increased annually by 10%, which is an actual average rate of
increase between 2008 and 2013, reached through back calculation from 2007. Column (22),
“Sum of final account of department public budget expenditure for international organizations”
shows the sum of the final account of public budget expenditure from 2010 to 2014 for 50
departments and other relevant organizations described above. It is assumed that the figures
from 2001 to 2009 are equal to those in Column (16). Based on Table 49.3 in OECD (2015), I
have selected 20 listed multilateral organizations31 and verified China’s annual contributions
from 2010 to 2014 based on publicly available documents such as the annual reports for each
organization. I have attempted to identify 12 out of the 50 departments within the Chinese
government which are responsible for the abovementioned multilateral organizations.32 Except
30 Budget sub-item, “International organizations (20204)” includes a second budget sub-item, “Membership dues to international organizations (2020401),” “Donations to international organizations (2020402),” "Peace-keeping operations (2020403)," “Capital increase and contribution to funds in international organizations (2020404),” and “Other expenditure to international organizations (2020405).” 31 The 20 listed multilateral organizations include United Nations regular budget and United Nations Department of Peacekeeping Operations (UNDPKO), the World Bank Group, the International Fund for Agricultural Development (IFAD), Asian Development Bank (ADB), the Global Environment Fund (GEF), The Inter-American Development Bank (IDB), the African Development Bank (AfDB), the United Nations Children's Fund (UNICEF), the United Nations Development Program (UNDP), the United Nations Industrial Development Organization (UNIDO), the United Nations Conference on Trade and Development (UNCTAD), the Food and Agriculture Organization (FAO), the World Food Program, the World Health Organization (WHO), the Global Fund to Fight AIDS, Tuberculosis and Malaria, the United Nations Educational, Scientific and Cultural Organization (UNESCO), the International Labour Organization (ILO), the United Nations Environment Program (UNEP), the United Nations Convention to Combat Desertification in Those Countries Experiencing Serious Drought and/or Desertification, Particularly in Africa (UNCCD), the International Atomic Energy Agency (IAEA), and the United Nations Office on Drugs and Crime (UNODC). 32 The 12 departments include the Ministry of Foreign Affairs (MOFA), the Ministry of Finance (MOF), the People's Bank of China (PBC), the Ministry of Commerce (MOFCOM), the Ministry of Agriculture (MOA), the National Health and Family Planning Commission (NHFPC), the Ministry of Human Resources and Social Security (MOHRSS), the Ministry of Education (MOE), the Ministry of Environmental Protection (MEP), the State Forestry Administration (SFA), Industry and Information Technology (MIIT), and the Ministry of Public Security (MPS).
16
for the Ministry of Public Security (MPS), these departments are among the top 12
departments in terms of budget expenditure amounts for 2014.
Next, using the publicly available documents from multilateral organizations, I
compared the sum of the annual contributions derived for each respective department with
each department’s final accounts of public budget expenditure for international organizations.
In some cases, the former was larger than the latter; this is possibly attributable to a lack of
budget figures for particular years. There were also cases where the former was smaller than
the latter because a department’s accounts may have included budget expenditure for other
international organizations which I have not been able to identify. Thus, I have checked each
year’s budget expenditure figures for each department and adjusted them where necessary.
Finally, I calculated the core contributions for each department using the coefficients in the
DAC List of ODA-eligible International Organizations. As for the other 38 departments, I
assume a coefficient for core contributions of 30%.33 The estimates from 2010 to 2014 are
shown in Column (23), “Sum of final account of department public budget expenditure for
international organizations: Adjusted” (For details, see Annex Table 3). The figures from 2001
to 2009 were estimated by using the figures in Column (22) and assuming a coefficient for
core contributions of 30%.
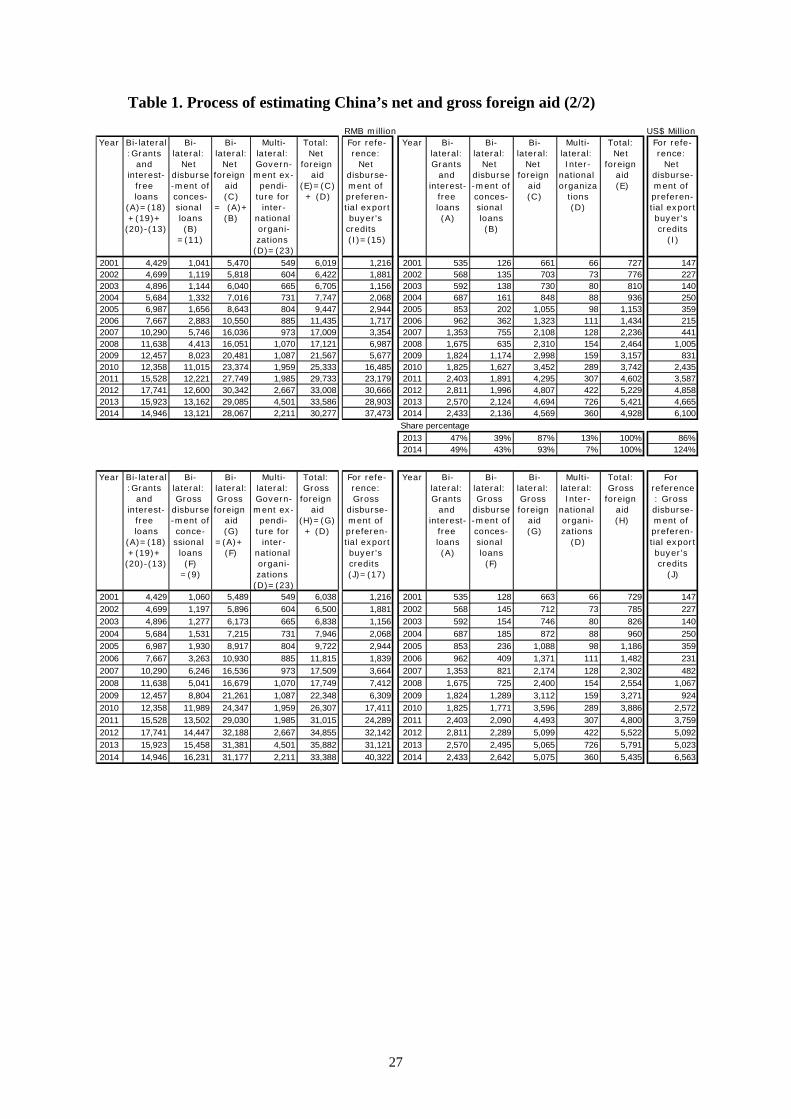
Based on the estimation process described above, Column (A), “Bilateral: Grants and
interest-free loans,” was derived by adding Columns (18), (19), and (20), and deducting Column
(13). Column (B), “Bilateral: Net disbursement of concessional loans,” is equal to Column (11).
Column (C), which is the sum of Columns (A) and (B), shows the bilateral net foreign aid, while
Column (D), “Multilateral: Government expenditure for international organizations” presents
the estimated amount of multilateral foreign aid which is equal to Column (23). Column (E),
33 Among the 38 departments and other organizations, the coefficient of the Civil Aviation Administration of China (CAAC) is assumed to be 0% since CAAC is responsible for the International Civil Aviation Organization (ICAO) which is not listed in the DAC List of ODA-eligible International Organizations.
17
“Total net foreign aid” equals the sum of Columns (C) and (D). Column (F), "Bilateral: Gross
disbursement of concessional loans” is equal to Column (9). Column (G), “Total gross foreign
aid,” which is the sum of Columns (A) and (F), shows the gross bilateral foreign aid and
Column (H), "Total: Gross foreign aid” equals the sum of Columns (G) and (D).
Finally, the net and gross disbursements of preferential export buyer's credits are listed
in Column (I) which is equal to Column (15) and in Column (J) which is equal to Column (17).
5. Results of the estimation
Figures 1 and 2, which are derived from Table 1, depict China’s estimated net and gross
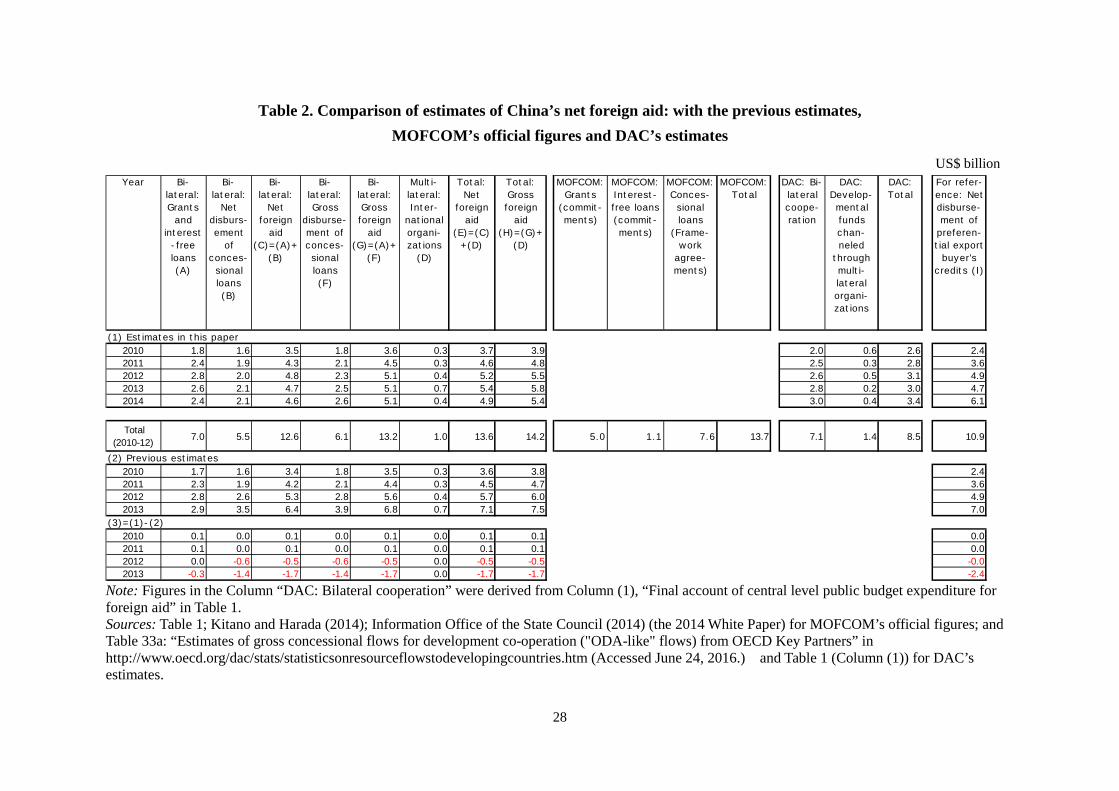
foreign aid in US$ terms. Table 2 shows the comparison of these estimates with the previous
estimates, MOFCOM’s official figure, and the DAC’s estimates. Net foreign aid is estimated to
have been US$ 5.2 billion in 2012, US$ 5.4 billion in 2013, and US$ 4.9 billion in 2014.
Compared with the previous estimates of Kitano and Harada (2014), figures were either
upwardly or downwardly revised from 2001 to 2013. In particular, the previous estimate of the
net foreign aid in 2012 and 2013 amounting to US$ 5.7 billion and US$ 7.1 billion was
downwardly revised to US$ 5.2 billion and US$ 5.7 billion respectively due to the fact that net
disbursements of concessional loans were significantly downwardly revised from US$ 2.6
billion to US$ 2.0 billion in 2012 and from US$ 3.5 billion to US$ 2.1 billion in 2013
respectively as a result of the introduction of the modified estimation process.
These results show several findings; first, it is rather surprising that net foreign aid has
increased steadily since 2001; however, it decreased in 2014 when compared with 2013.
Looking at the figures in detail, the grants and interest-free loans in bilateral foreign aid were
downwardly estimated for two consecutive years from 2012 to 2014. The “Audit results of
budget implementation and other government revenues and expenditures of the Ministry of
Commerce for the year 2014” issued by the National Audit Office (NAO) pointed out the
reasons why MOFCOM’s final account on public budget expenditure for foreign aid consisting
18
of grants and interest-free loans was smaller than the original public expenditure budget in
2014 were:34 that verification of feasibility studies of part of the projects at the project
approval stage were not sufficient, there were time differences between some of projects’
planned and actual disbursement schedules, and in some cases project budgets were released
late.35 The NAO audit report did not provide any further evidence on this issue. However,
there is some secondary evidence. For example, at the media briefing on “Measures for the
Administration of Foreign Aid (For Trial Implementation)" organized by MOFCOM,
MOFCOM officials emphasized the same point: the importance of management of the
approval stages of the project. 36 This suggests that some projects might perform
unsatisfactorily because of a lack of sufficient verification of the feasibility of studies in the
approval stages, which may have partly caused a downward trend in grants and interest-free
loans.
Second, the rate of increase in the gross disbursements of concessional loans dropped
from 75% in 2009 to 13% in 2011: it then continued to decrease to 5% in 2014. This can be
attributed to the change in the estimation process.37
Third, as for multilateral foreign aid, final accounts on public budget expenditure for
international organizations by the Ministry of Finance increased in 2013 and decreased
significantly in 2014 (see Annex Table 3). This was due to the fact that China had already
completed the capital increase for the World Bank’s 2010 shareholding realignment: Selective
Capital Increase (SCI) for the International Bank for Reconstruction and Development (IBRD)
34 This brought about a decrease in grants and interest-free loans in 2014. 35 See http://www.audit.gov.cn/n5/n25/c67488/part/31322.pdf [in Chinese] (accessed March 19, 2016). 36 See MOFCOM’s media briefing on this regulation at http://english.mofcom.gov.cn/article/newsrelease/press/201412/20141200851923.shtml (accessed May 8, 2016). 37 In the previous estimates, it was assumed that the annual rate of increase in gross disbursement of concessional loans was set at 33% for 2012 and 2013; this assumption was based on the fact that the average annual rate of increase from 2006 to 2011 was 33%.
19
– a reform of voting power.38
In 2014, the share of bilateral foreign aid is much larger, at 93%, than that of previous
year due to a 6 percentage point decrease in multilateral foreign aid. The proportion of
concessional loans to total foreign aid is 43%. The difference between net foreign aid (Figure
1) and gross foreign aid (Figure 2) is still minimal, since the repayment of concessional loans
was a relatively low 3% of outstanding loan amounts in 2014.
As a reference point, the net disbursements of preferential export buyer’s credits,
which some recipient countries treat as ODA, are estimated to have totaled US$ 4.9 billion in
2012, US$ 4.7 billion in 2013, and US$ 6.1 billion in 2014. The revised figure in 2013 was
substantially smaller than the previous estimate which was US$ 7.0 billion and was a decrease
from the previous year.39 The figure in 2014 exceeded the amount of total net foreign aid. If
this figure is combined as net concessional flows, the totals are estimated to have reached
US$ 11.0 billion in 2014.
The results above were then compared with MOFCOM’s aggregated official figure for
foreign aid from 2010 to 2012 in the 2014 White Paper (Information Office of the State
Council (2014)) and the DAC’s estimates40 (Table 2). Despite the fact that the definitions
differ between my estimates and MOFCOM’s official figures as described in Section two,
Column (G), “Bilateral gross foreign aid,” consisting of grants, interest-free loans, and gross
disbursements of concessional loans, could be compared with MOFCOM’s figures consisting
of commitment-based grants, interest-free loans, and the framework agreement-based
38 See http://www.mof.gov.cn/zhengwuxinxi/caizhengshuju/201507/t20150716_1330771.html and http://siteresources.worldbank.org/DEVCOMMINT/Documentation/22553921/DC2010-006(E)Voice.pdf (accessed March 19, 2016). 39 In Kitano and Harada (2014), the “Sum of outstanding amount of concessional loans and preferential export buyer’s credits” by China Eximbank from 2012 to 2013 was estimated based on an average annual rate of increase of 39% from 2006 to 2011. 40 See “Table 33a Estimates of gross concessional flows for development co-operation ("ODA-like" flows) from OECD Key Partners” in http://www.oecd.org/dac/stats/statisticsonresourceflowstodevelopingcountries.htm (Accessed June 24, 2016).
20
concessional loans: both are similar in magnitude in terms of aggregated figures from 2010 to
2012,41 accounting for US$ 13.2 billion and US$ 13.7 billion respectively. Next, my estimates
and the DAC’s estimates are compared. The major difference between the two is that the
DAC’s estimates do not include net or gross disbursements of concessional loans shown in
Column (A), “Bilateral: Net disbursement of concessional loans” or Column (F), “Bilateral:
Gross disbursement of concessional loans.” Thus, the figures in the column, “DAC: Total” are
smaller than the figures in Column (E), “Total: Net foreign aid” or Column (H), “Total: Gross
foreign aid.”
6. Comparison with selected DAC members
This section will compare the previously stated estimates of China’s foreign aid with the ODA
to DAC members. Table 3 shows the ranking in terms of net ODA and net foreign aid. In the
previous estimates, China was ranked at either number 16 or number 17 until 2006, then moved
up to number 14 in 2007 and to number 11 in 2011. China then sat at number 6 in both 2012 and
2013. However, the results of this paper suggest that China actually moved up to number 10 in
2012 and to number 9 in 2013. In 2014, China kept its ranking at number 9 just behind Norway,
Sweden, and the Netherlands. China’s net ODA/GNI ratio in 2012 was estimated as 0.066%
which is smaller than the previous estimate of 0.072%. The ratio then dropped to 0.060% in 2013
and 0.049% in 2014. With regards to the ranking, China was ranked at 29 in 2014.42
Figure 3 compares the trend of China’s net foreign aid to trends in net ODA provided by
a selected group of DAC members: France, Germany, Japan, the Netherlands, Norway, South
Korea, Sweden, the UK, and the US. China’s level of net foreign aid was similar to that of South
Korea, the second Asian member of the DAC, until 2005 when it increased sharply as China
41 To-date, MOFCOM has not disclosed the foreign aid volumes for 2013 and 2014. 42 See “Development aid in 2015 continues to grow despite costs for in-donor refugees” on the OECD website, https://www.oecd.org/dac/stats/ODA-2015-detailed-summary.pdf (accessed May 25, 2016).
21
began to catch up with high-ranking countries.
In terms of gross ODA shown in Figure 4, China’s gross foreign aid is almost equal to its
net foreign aid which was estimated to have decreased between 2013 and 2014, as shown in
Figure 3. Until 2013, Japan was second to the US but in 2014, it went down to 4th position.
Figures 5 and 6 further disaggregate these comparisons. Figure 5 compares China’s bilateral net
foreign aid with the ODA of selected DAC members, while Figure 6 compares multilateral net
foreign aid with ODA. In 2014, China’s bilateral net foreign aid was closer to the net ODA of
Japan and France, while its multilateral foreign aid was much smaller in comparison to the top
five DAC members, and was smaller than the level for South Korea in 2014.
7. Conclusion
This paper attempted to revise and update the estimates of China’s foreign aid from 2001 to
2014, and to compare the results with the ODA of DAC members based on the previous work.
The results have presented an unexpected view of China’s foreign aid. Net foreign aid is
estimated to have decreased from US$ 5.4 billion in 2013 to US$ 4.9 billion in 2014. My
estimates of 2012 and 2013 were significantly smaller than the previous estimates which were
US$ 5.7 billion and US$ 7.1 billion respectively. However, those figures need to be used with
considerable caution which may overestimate or underestimate the actual figures depending on
the rate of increase in gross disbursement of concessional loans.
Since 2013, China has been ranked at number 9, while in terms of net bilateral aid, its
ranking has been number 6, next to Japan and France, since 2012. Importantly, the net
disbursements of preferential export buyer’s credits are estimated to have totaled US$ 4.7 billion
in 2013 and US$ 6.1 billion in 2014. My estimate for 2013 was also significantly smaller than
the previous estimates which was US$ 7.1 billion and was a decrease from the previous year.
22
With the announcement of a number of new initiatives and commitments,43 the
Chinese government has recently engaged more proactively in international development. As
outlined in the 13th Five-Year Plan (2016-2020),44 the total amount of China’s aid is expected
to increase significantly and catch up with some of the top five DAC members in the foreseeable
future. It is therefore important for the international community to carefully examine the
magnitude of China’s foreign aid.
Lastly, I would like to outline a number of future research topics relating my work.
The first possible area of research is the disaggregation of China’s foreign aid by
regions/countries and sectors. The second area of research is to examine whether the paid in
capital to the AIIB, the disbursed amount from the AGTF,45 and other new commitments from
the Chinese Government, part of which are listed in footnote 43 could be counted as foreign
aid, and if so to estimate them annually. The third research topic is to estimate foreign aid
based on the DAC’s revised system for measuring development finance. At the DAC high level
43 For example, in March 2013, IDB and the People’s Bank of China (PBC) approved the establishment of the China Co-financing Fund for Latin America and the Caribbean (CCF), a facility with US$2 billion to support public and private sector projects in the region. In October 2013, China proposed the establishment of the Asian Infrastructure Investment Bank (AIIB). Almost at the same time, a concept of 21st Century Maritime Silk Road (later evolved into the Belt and Road Initiative or One Belt One Road) to promote maritime cooperation was offered. In April 2014, the AfDB approved the establishment of the Africa Growing Together Fund (AGTF) sponsored by PBC. The Silk Road Fund, with the first installment of US$ 10 billion, was established in December 2014 to provide investment and financing support for trade and economic cooperation and connectivity under the framework of the Belt and Road Initiative. In July 2015, China signed cooperation agreements with the OECD and joined the OECD Development Centre. China also signed an agreement with the World Bank to establish the first trust fund amounting to US$ 50 million to help reduce poverty. At the United Nations Sustainable Development Summit in September 2015, China announced the establishment of an assistance fund for South-South cooperation with an initial pledge of US$ 2 billion, and an international development knowledge center. At the same time, China announced that it would set up a China South-South Climate Cooperation Fund amounting US$ 3.1 billion to help developing countries tackle climate change. During the Johannesburg Summit of the Forum on China-Africa Cooperation (FOCAC) in December, 2016, China offered US$ 60 billion in funding, including US$ 5 billion worth of grant assistance and interest-free loans, and US$ 35 billion in preferential loans and export credits on more favorable terms. At the beginning of 2016, AIIB was declared open for business. 44 See http://ghs.ndrc.gov.cn/zttp/135ghbzgz/ [in Chinese] (accessed April 3, 2016). 45 In April 2014, the AfDB approved the establishment of the AGTF, a US$ 2 billion co-financing fund, sponsored by PBC. The resources from the AGTF are available for a period of ten years and can be used alongside the AfDB’s own resources to finance eligible sovereign (80%) and non-sovereign (20%) guaranteed projects in Africa. See http://www.afdb.org/fileadmin/uploads/afdb/Documents/Financial-Information/Investor (accessed April 3, 2016).
23
meeting (DAC-HLM) held in December 2014,46 DAC members agreed to modernize the
reporting of concessional loans by introducing a grant equivalent system.47 The Principles of
ODA modernization on Private Sector Instruments and the boundaries of ODA in the field of
peace and security were also agreed by DAC members at the DAC-HLM in February 2016.
The final research topic aims to estimate China’s development finance in accordance with the
definition of Total Official Support for Sustainable Development (TOSSD), which has been
under discussion in the international community.48
46 The DAC High Level Meeting Communiqué 16 December 2014, http://www.oecd.org/dac/OECD%20DAC%20HLM%20Communique.pdf (accessed April 3, 2016). 47 In this new reporting system, the ODA credit that is counted and reported will be higher for a grant than for a loan. Among loans which pass the tests for ODA scoring, more concessional loans, rather than less, will earn greater ODA credit. DAC members further decided to assess concessionality based on differentiated discount rates consisting of a base factor, which will be the IMF discount rate (currently 5%), and an adjustment factor of 1% for upper middle-income countries (UMICs), 2% for lower middle- income countries (LMICs) and 4% for the least developed countries (LDCs) and other low-income countries (LICs). To ensure that loans to LDCs and other LICs are provided on highly concessional terms, only loans with a grant element of at least 45% will be reportable as ODA. In order to be reportable as ODA, loans to LMICs need to have a grant element of at least 15%, and those to UMICs at least 10%. This will have a certain impact on China’s foreign aid especially to LDCs. 48 As for the ongoing discussion on TOSSD, see http://www.oecd.org/dac/financing-sustainable-development/tossd.htm (accessed April 25, 2016).
24
References
Bräutigam, Deborah. 2011. “Aid ‘with Chinese characteristics’: Chinese aid and development
finance meet the OECD-DAC regime.” Journal of International Development 23 (5): 752–64.
———. 2015. Will Africa Feed China?. Oxford University Press. Bräutigam, Deborah, and Kevin P. Gallagher. 2014. "Bartering Globalization: China's
Commodity-backed Finance in Africa and Latin America." Global Policy 5 (3): 346-52. Chen, Meng. 2010. “Zhongguo zhengfu qianshu yuanwai youhui daikuan 770 yi yuan
renminbi. [Chinese government signed concessional loans totally amounting to RMB 77 billion].” Guoji zaixian, Zhongguo guoji guangbo dianshi wangluotai [CRI (China Radio International) online in China International Broadcasting Network]. Accessed May 8, 2016. http://www.china.com.cn/news/txt/2010-08/13/content_20702843.html.
Export-Import Bank of China. 2012. The Export-Import Bank of China Annual Report 2011. ———. 2015. The Export-Import Bank of China Annual Report 2014. Fues, Thomas, and Jiang Ye. (eds.) 2014. United Nations Post-2015 Agenda for Global
Development: Perspectives from China and Europe. Bonn: Deutsches Institut für Entwicklungspolitik (DIE). Accessed April 2, 2016. https://www.die-gdi.de/uploads/media/Studies_84.pdf.
Gransow, Bettina. 2015. "Chinese Infrastructure Investment in Latin America—an Assessment of Strategies, Actors and Risks." Journal of Chinese Political Science 20 (3): 267-87.
Hu, Jianmei, and Meibo Huang. 2012. “Zhongguo zhengfu duiwai youhui daikuan de xianzhuang ji qianjing [The present situation of the Chinese government’s concessional loan and its perspective].” Guoji Luntan [International Forum] 14 (1): 49–54.
Hwang, Jyhjong , Deborah Bräutigam, and Janet Eom. 2016. How Chinese Money is Transforming Africa: It's Not What You Think. SAIS-CARI Policy Brief 11/2016. Washington, D.C.: SAIS China Africa Research Initiative (SAIS-CARI). Accessed May 8, 2016.
http://static1.squarespace.com/static/5652847de4b033f56d2bdc29/t/571a2daf20c64744b887cf7c/1461333522495/China+Africa+Loans+Briefing+Paper_SAIS+CARi.pdf.
Information Office of the State Council. 2011. China’s Foreign Aid. Beijing: Foreign Language Press.
———. 2014. China’s Foreign Aid (2014). Beijing: Foreign Language Press. International Monetary Fund. 2016. World Economic Outlook Update.
http://www.imf.org/external/pubs/ft/weo/2016/update/01/. Accessed June 2, 2016. Kitano, Naohiro. 2014. “China’s foreign aid at a transitional stage.” Asian Economic Policy
Review 9 (2): 301–17. Kitano, Naohiro, and Yukinori Harada. 2014. “Estimating China’s Foreign Aid 2001-2013.”
JICA-RI Working Paper No. 78. Tokyo: JICA Research Institute. Accessed March 29, 2016.
https://jica-ri.jica.go.jp/publication/assets/JICA-RI_WP_No.78_2014.pdf. ———. 2015. “Estimating China’s Foreign Aid 20010-2013.” Journal of International
Development (Published online in Wiley Online Libraryon-line). Accessed March 29, 2016. http://onlinelibrary.wiley.com/doi/10.1002/jid.3081/pdf.
Kitano, Naohiro. 2015. "Estimating China’s Foreign Aid." Presentation material presented at "China Foreign Aid Roundtable" hosted by the Asia Foundation in Bangkok on June 9, 2015. Accessed April 2, 2016. http://jica-ri.jica.go.jp/event/assets/20150609_presentation_kitano_01.pdf.
Kobayashi, Takaaki, and Yasutami Shimomura. 2013. “Aid volume in a historical perspective.” In A Study of China’s Foreign Aid edited by Shimomura, Yasutami and Hideo Ohashi . 46–57. Basingstoke: Palgrave Macmillan.
25
Lin, Justin Yifu, and Yan Wang. 2015. "China’s Contribution to Development Cooperation: Ideas, Opportunities and Finances." FERDI Working Paper No. P119. Paris: Fondation pour les Etudes et Recherches sur le Développement Internationa. Accessed April 2, 2016. http://www.ferdi.fr/sites/www.ferdi.fr/files/publication/fichiers/wp119_lin-wang_paper_for_ferdi_web_1.pdf.
Ministry of Commerce. 2014. “Duiwai yuanzhu guangli banfa (shixing). [Measures for Management of Foreign Aid (For Trial Implementation)].” Accessed March 29, 2016.
http://www.mofcom.gov.cn/article/b/c/201411/20141100799438.shtml. OECD. 2008. “OECD DAC Statistics: a brief introduction. Factsheet.” July. Paris: OECD.
Accessed May 29, 2014. http://www.oecd.org/dac/stats/43544160.pdf. ———. 2013. “Converged Statistical Reporting Directives for the Creditor Reporting System
(CRS) and the Annual DAC Questionnaire.” DCD/DAC(2013)15/FINAL. Paris: OECD. http://www.oecd.org/dac/stats/documentupload/DCD-DAC(2013)15-FINAL-ENG.pdf with “Addenda to the Converged Statistical Reporting Directives” Accessed April 2, 2016. http://www.oecd.org/dac/stats/addenda-converged-statistical-reporting-directives.htm.
———. 2014. “Development Finance: Modernising Official Development Assistance (ODA).” Paris: OECD. Accessed April 2, 2016. http://www.oecd.org/dac/externalfinancingfordevelopment/documentupload/ERG%20S1%20Jan%202014%20-%20Options%20for%20Modernising%20the%20ODA%20Measure%20DCD-DAC-2014-3-ENG.pdf.
———. 2015. Development Co-operation Report 2015: Ending Poverty. Paris: OECD. ———. 2016. “DAC High Level Meeting Communiqué.” Accessed April 2, 2016.
http://www.oecd.org/dac/DAC-HLM-Communique-2016.pdf. Pigato, Miria, and Wenxia Tang. 2015. "China and Africa: Expanding Economic Ties in an
Evolving Global Context." World Bank Group Working Paper. Washington, DC: World Bank. Accessed April 2, 2016. http://www.worldbank.org/content/dam/Worldbank/Event/Africa/Investing%20in%20Africa%20Forum/2015/investing-in-africa-forum-china-and-africa-expanding-economic-ties-in-an-evolving-global-context.pdf.
Snell, Sabrina. 2015. “China’s Development Finance: Outbound, Inbound, and Future Trends in Financial Statecraft." Staff Research Report. Wanshington, DC: U.S.-China Economic and Security Review Commission. Accessed March 29, 2016. http://origin.www.uscc.gov/sites/default/files/Research/China%E2%80%99s%20Development%20Finance.pdf.
UNDP China. 2015. Demand-Driven Data: How Partner Countries are Gathering Chinese Development Cooperation Information. Beijing: UNDP China. Accessed April 2, 2016. http://www.aidtransparency.net/wp-content/uploads/2015/11/Paper-9-Demand-Driven-Data-How-Partner-Countries-are-Gathering-Chinese-Development-Cooperation-Information.pdf.
Zhang, Yanbing, Jing Gu, and Yunnan Chen. 2015. China’s Engagement in International Development Cooperation: The State of the Debates. IDS Evidence Report No. 116. IDS Evidence Report Brighton: Institute of Development Studies. Accessed April 2, 2016.
http://opendocs.ids.ac.uk/opendocs/bitstream/handle/123456789/5838/ER116_ChinasEngagementinInternationalDevelopmentCooperationTheStateoftheDebate.pdf.
26
Table 1. Process of estimating China’s net and gross foreign aid (1/2)
RMB million
Note: Figures in bold were extracted from publicly accessible statistics and information: those in italics were obtained from graphs, those highlighted by gray were critical figures estimated by the setting of assumptions, and the remaining figures, neither in bold, italics, nor highlighted by gray were calculated from other columns. Sources: Finance Yearbook of China 2002 and 2003, Chinese government relevant websites, etc.
Year Finalaccount of
centrallevel publicbudget ex-penditurefor foreign
aid(1)
Sum of finalaccount of
central levelgeneral publicbudget ex-
penditure forforeign aidand gross
disburse-mentof con-
cessional loans(2)
Out-standing
amount oftwo
preferen-tial
facilities(3)
Cumu-lative
amount offrame-work
agree-ment forconces-sionalloans(4)
Frame-work
agree-ment forconces-sional
loans (5)
Cumu-lative
amount ofconces-sionalloans
signed (6)
Conces-sionalloans
signed (7)
Grossdisburse-ment ofconces-sionalloans
(8)=(2)-(1)
Cumula-tive
disburse-ment ofconces-sional
loans (9)
Repay-ment ofconces-sionalloans(10)
Netdisburse-ment ofconces-sionalloans
(11)=(8)-(10)
Out-standingamount
ofconces-sionalloans(12)
Subsi-dies forconces-sionalloans(13)
Out-standingamount
ofpreferen-
tialexportbuyer'scredits
(14)=(3)-(12)
Netdisburse-ment of
preferen-tial
exportbuyer'scredits(15)
Repay-ment of
preferen-tial
exportbuyer'scredits(16)
Grossdisburse-ment of
preferen-tial
exportbuyer'scredits(17)=(15)+(16)
Grantsand
interest-free
loans byMinistryof Com-merce(18)
Grants byother
depart-mentsand
relevantograni-zations(19)
Scholar-ships forforeign
studentsfrom otherdeveloping
countries bythe Ministryof Education
(20)
Finalaccount of
centralgovernment
publicbudget ex-
penditure forinter-
nationalorgani-zations
(21)
Sum of finalaccount ofdepartment
publicbudget ex-pendituresfor inter-nationalorgani-zations(22)
Sum of finalaccount ofdepartment
publicbudget ex-pendituresfor inter-nationalorgani-zations:Adjusted
(23)
2001 4,711 5,000 1,060 3,803 19 1,041 3,784 47 1,216 1,216 1,216 4,240 141 94 1,831 1,831 5492002 5,003 6,200 8,000 1,197 5,000 78 1,119 4,903 54 3,097 1,881 1,881 4,503 150 100 2,014 2,014 6042003 5,223 6,500 10,300 1,277 6,277 133 1,144 6,047 66 4,253 1,156 1,156 4,701 157 104 2,215 2,215 6652004 6,069 7,600 13,700 1,531 7,808 199 1,332 7,380 82 6,320 2,068 2,068 5,462 182 121 2,437 2,437 7312005 7,470 9,400 18,300 1,930 9,738 274 1,656 9,035 109 9,265 2,944 2,944 6,723 224 149 2,681 2,681 8042006 8,237 11,500 22,900 3,263 13,001 380 2,883 11,918 158 10,982 1,717 122 1,839 7,413 247 165 2,949 2,949 8852007 11,154 17,400 32,000 6,246 19,247 500 5,746 17,664 285 14,336 3,354 310 3,664 10,039 335 202 3,244 3,244 9732008 12,559 17,600 43,400 5,041 24,288 628 4,413 22,077 374 21,323 6,987 425 7,412 11,303 377 332 3,568 3,568 1,0702009 13,296 22,100 57,100 73,550 13,409 59,400 10,830 8,804 33,092 781 8,023 30,101 345 27,000 5,677 632 6,309 11,966 399 437 3,622 3,622 1,0872010 13,611 25,600 84,600 88,434 14,884 73,479 14,079 11,989 45,081 974 11,015 41,116 478 43,484 16,485 926 17,411 11,839 462 534 4,316 4,338 1,9592011 15,898 29,400 120,000 104,956 16,522 88,402 14,923 13,502 58,583 1,281 12,221 53,337 773 66,663 23,179 1,110 24,289 15,178 510 613 4,833 4,292 1,9852012 16,695 123,310 18,339 104,817 16,416 14,447 73,030 1,847 12,600 65,937 972 97,329 30,666 1,477 32,142 17,014 666 1,034 7,230 4,984 2,6672013 17,049 143,666 20,356 122,874 18,057 15,458 88,489 2,296 13,162 79,099 1,068 126,232 28,903 2,218 31,121 15,206 659 1,125 5,619 7,979 4,5012014 18,457 165,448 21,781 142,737 19,863 16,231 104,720 3,110 13,121 92,220 1,231 163,705 37,473 2,849 40,322 14,203 674 1,301 7,372 7,363 2,211
Rate of Increase2002 6% 60% 13% 31% 309% 8% 30% 16% 155% 55% 55% 6% 6% 6% 10% 10% 10%2003 4% 5% 29% 7% 26% 71% 2% 23% 21% 37% -39% -39% 4% 4% 4% 10% 10% 10%2004 16% 17% 33% 20% 24% 50% 16% 22% 24% 49% 79% 79% 16% 16% 16% 10% 10% 10%2005 23% 24% 34% 26% 25% 38% 24% 22% 33% 47% 42% 42% 23% 23% 23% 10% 10% 10%2006 10% 22% 25% 69% 34% 39% 74% 32% 45% 19% -42% -38% 10% 10% 10% 10% 10% 10%2007 35% 51% 40% 91% 48% 31% 99% 48% 81% 31% 95% 155% 99% 35% 35% 22% 10% 10% 10%2008 13% 1% 36% -19% 26% 26% -23% 25% 31% 49% 108% 37% 102% 13% 13% 65% 10% 10% 10%2009 6% 26% 32% 75% 36% 24% 82% 36% -8% 27% -19% 49% -15% 6% 6% 32% 2% 2% 2%2010 2% 16% 48% 20% 11% 24% 30% 36% 36% 25% 37% 37% 38% 61% 190% 47% 176% -1% 16% 22% 19% 20% 80%2011 17% 15% 42% 19% 11% 20% 6% 13% 30% 32% 11% 30% 62% 53% 41% 20% 40% 28% 10% 15% 12% -1% 1%2012 5% 17% 11% 19% 10% 7% 25% 44% 3% 24% 26% 46% 32% 33% 32% 12% 31% 69% 50% 16% 34%2013 2% 17% 11% 17% 10% 7% 21% 24% 4% 20% 10% 30% -6% 50% -3% -11% -1% 9% -22% 60% 69%2014 8% 15% 7% 16% 10% 5% 18% 35% 0% 17% 15% 30% 30% 28% 30% -7% 2% 16% 31% -8% -51%
27
Table 1. Process of estimating China’s net and gross foreign aid (2/2) RMB million US$ Million
Year Bi-lateral :Grants
and interest-
free loans
(A)=(18)+(19)+
(20)-(13)
Bi-lateral:
Net disburse-ment of conces-sional loans (B)
=(11)
Bi-lateral:
Net foreign
aid(C)
= (A)+ (B)
Multi-lateral: Govern-ment ex-
pendi-ture for
inter-national organi-zations
(D)=(23)
Total: Net
foreign aid
(E)=(C)+ (D)
For refe-rence:
Net disburse-ment of preferen-tial export buyer's
credits (I)=(15)
Year Bi-lateral: Grants
and interest-
free loans(A)
Bi-lateral:
Net disburse-ment of conces-sional loans(B)
Bi-lateral:
Net foreign
aid(C)
Multi-lateral: Inter-
national organiza
tions(D)
Total: Net
foreign aid(E)
For refe-rence:
Net disburse-ment of preferen-tial export buyer's credits
(I)
2001 4,429 1,041 5,470 549 6,019 1,216 2001 535 126 661 66 727 1472002 4,699 1,119 5,818 604 6,422 1,881 2002 568 135 703 73 776 2272003 4,896 1,144 6,040 665 6,705 1,156 2003 592 138 730 80 810 1402004 5,684 1,332 7,016 731 7,747 2,068 2004 687 161 848 88 936 2502005 6,987 1,656 8,643 804 9,447 2,944 2005 853 202 1,055 98 1,153 3592006 7,667 2,883 10,550 885 11,435 1,717 2006 962 362 1,323 111 1,434 2152007 10,290 5,746 16,036 973 17,009 3,354 2007 1,353 755 2,108 128 2,236 4412008 11,638 4,413 16,051 1,070 17,121 6,987 2008 1,675 635 2,310 154 2,464 1,0052009 12,457 8,023 20,481 1,087 21,567 5,677 2009 1,824 1,174 2,998 159 3,157 8312010 12,358 11,015 23,374 1,959 25,333 16,485 2010 1,825 1,627 3,452 289 3,742 2,4352011 15,528 12,221 27,749 1,985 29,733 23,179 2011 2,403 1,891 4,295 307 4,602 3,5872012 17,741 12,600 30,342 2,667 33,008 30,666 2012 2,811 1,996 4,807 422 5,229 4,8582013 15,923 13,162 29,085 4,501 33,586 28,903 2013 2,570 2,124 4,694 726 5,421 4,6652014 14,946 13,121 28,067 2,211 30,277 37,473 2014 2,433 2,136 4,569 360 4,928 6,100
Share percentage2013 47% 39% 87% 13% 100% 86%2014 49% 43% 93% 7% 100% 124%
Year Bi-lateral :Grants
and interest-
free loans
(A)=(18)+(19)+
(20)-(13)
Bi-lateral: Gross
disburse-ment of conce-ssional loans(F)
=(9)
Bi-lateral: Gross
foreign aid(G)
=(A)+ (F)
Multi-lateral: Govern-ment ex-
pendi-ture for
inter-national organi-zations
(D)=(23)
Total: Gross
foreign aid
(H)=(G)+ (D)
For refe-rence: Gross
disburse-ment of preferen-tial export buyer's credits (J)=(17)
Year Bi-lateral: Grants
and interest-
free loans(A)
Bi-lateral: Gross
disburse-ment of conces-sional loans(F)
Bi-lateral: Gross foreign
aid(G)
Multi-lateral: Inter-
national organi-zations
(D)
Total: Gross
foreign aid(H)
For reference: Gross disburse-ment of preferen-tial export buyer's credits
(J)
2001 4,429 1,060 5,489 549 6,038 1,216 2001 535 128 663 66 729 1472002 4,699 1,197 5,896 604 6,500 1,881 2002 568 145 712 73 785 2272003 4,896 1,277 6,173 665 6,838 1,156 2003 592 154 746 80 826 1402004 5,684 1,531 7,215 731 7,946 2,068 2004 687 185 872 88 960 2502005 6,987 1,930 8,917 804 9,722 2,944 2005 853 236 1,088 98 1,186 3592006 7,667 3,263 10,930 885 11,815 1,839 2006 962 409 1,371 111 1,482 2312007 10,290 6,246 16,536 973 17,509 3,664 2007 1,353 821 2,174 128 2,302 4822008 11,638 5,041 16,679 1,070 17,749 7,412 2008 1,675 725 2,400 154 2,554 1,0672009 12,457 8,804 21,261 1,087 22,348 6,309 2009 1,824 1,289 3,112 159 3,271 9242010 12,358 11,989 24,347 1,959 26,307 17,411 2010 1,825 1,771 3,596 289 3,886 2,5722011 15,528 13,502 29,030 1,985 31,015 24,289 2011 2,403 2,090 4,493 307 4,800 3,7592012 17,741 14,447 32,188 2,667 34,855 32,142 2012 2,811 2,289 5,099 422 5,522 5,0922013 15,923 15,458 31,381 4,501 35,882 31,121 2013 2,570 2,495 5,065 726 5,791 5,0232014 14,946 16,231 31,177 2,211 33,388 40,322 2014 2,433 2,642 5,075 360 5,435 6,563
28
Table 2. Comparison of estimates of China’s net foreign aid: with the previous estimates, MOFCOM’s official figures and DAC’s estimates
US$ billion
Note: Figures in the Column “DAC: Bilateral cooperation” were derived from Column (1), “Final account of central level public budget expenditure for foreign aid” in Table 1. Sources: Table 1; Kitano and Harada (2014); Information Office of the State Council (2014) (the 2014 White Paper) for MOFCOM’s official figures; and Table 33a: “Estimates of gross concessional flows for development co-operation ("ODA-like" flows) from OECD Key Partners” in http://www.oecd.org/dac/stats/statisticsonresourceflowstodevelopingcountries.htm (Accessed June 24, 2016.) and Table 1 (Column (1)) for DAC’s estimates.
Year Bi-lateral:Grants
andinterest-freeloans(A)
Bi-lateral:
Netdisburs-ement
ofconces-sionalloans(B)
Bi-lateral:
Netforeign
aid(C)=(A)+
(B)
Bi-lateral:Gross
disburse-ment ofconces-sionalloans(F)
Bi-lateral:Grossforeign
aid(G)=(A)+
(F)
Multi-lateral:Inter-
nationalorgani-zations
(D)
Total:Net
foreignaid
(E)=(C)+(D)
Total:Grossforeign
aid(H)=(G)+
(D)
MOFCOM:Grants
(commit-ments)
MOFCOM:Interest-free loans(commit-ments)
MOFCOM:Conces-sionalloans
(Frame-work
agree-ments)
MOFCOM:Total
DAC: Bi-lateralcoope-ration
DAC:Develop-mentalfundschan-neled
throughmulti-lateralorgani-zations
DAC:Total
For refer-ence: Netdisburse-ment of
preferen-tial export
buyer'scredits (I)
(1) Estimates in this paper2010 1.8 1.6 3.5 1.8 3.6 0.3 3.7 3.9 2.0 0.6 2.6 2.42011 2.4 1.9 4.3 2.1 4.5 0.3 4.6 4.8 2.5 0.3 2.8 3.62012 2.8 2.0 4.8 2.3 5.1 0.4 5.2 5.5 2.6 0.5 3.1 4.92013 2.6 2.1 4.7 2.5 5.1 0.7 5.4 5.8 2.8 0.2 3.0 4.72014 2.4 2.1 4.6 2.6 5.1 0.4 4.9 5.4 3.0 0.4 3.4 6.1
Total(2010-12) 7.0 5.5 12.6 6.1 13.2 1.0 13.6 14.2 5.0 1.1 7.6 13.7 7.1 1.4 8.5 10.9
(2) Previous estimates2010 1.7 1.6 3.4 1.8 3.5 0.3 3.6 3.8 2.42011 2.3 1.9 4.2 2.1 4.4 0.3 4.5 4.7 3.62012 2.8 2.6 5.3 2.8 5.6 0.4 5.7 6.0 4.92013 2.9 3.5 6.4 3.9 6.8 0.7 7.1 7.5 7.0
(3)=(1)-(2)2010 0.1 0.0 0.1 0.0 0.1 0.0 0.1 0.1 0.02011 0.1 0.0 0.1 0.0 0.1 0.0 0.1 0.1 0.02012 0.0 -0.6 -0.5 -0.6 -0.5 0.0 -0.5 -0.5 -0.02013 -0.3 -1.4 -1.7 -1.4 -1.7 0.0 -1.7 -1.7 -2.4
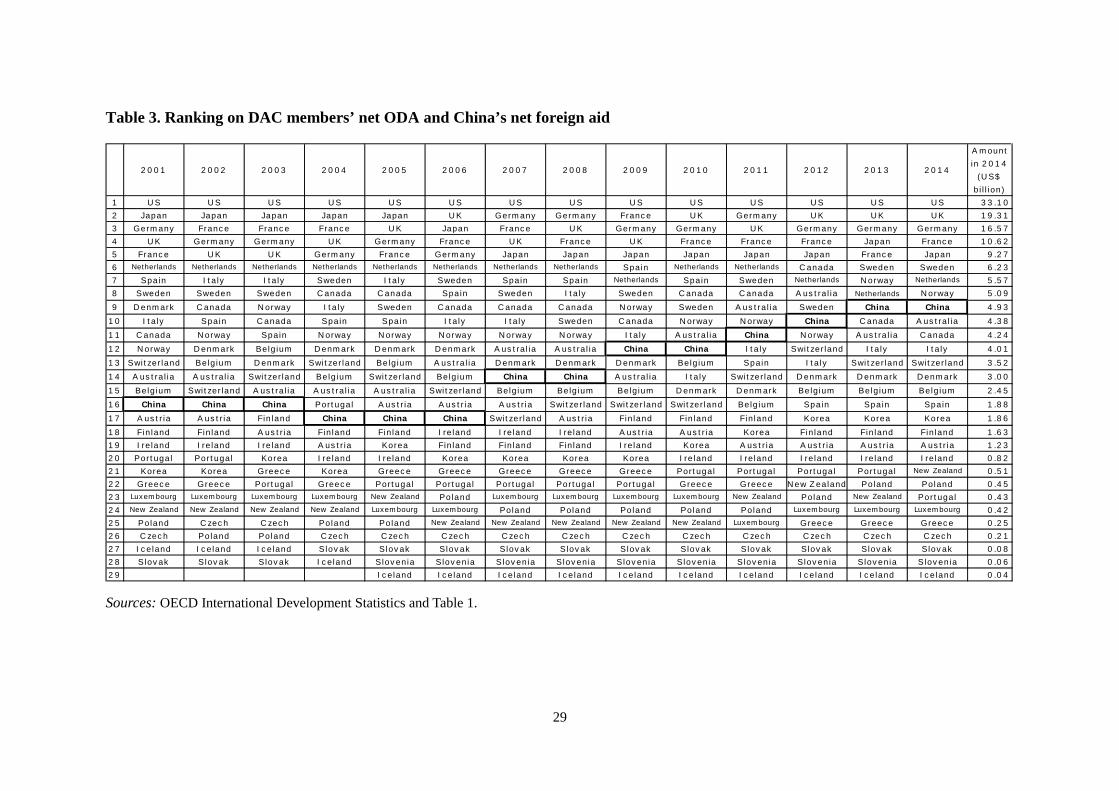
29
Table 3. Ranking on DAC members’ net ODA and China’s net foreign aid
Sources: OECD International Development Statistics and Table 1.
2001 2002 2003 2004 2005 2006 2007 2008 2009 2010 2011 2012 2013 2014
A mountin 2014
(US$billion)
1 US US US US US US US US US US US US US US 33.102 Japan Japan Japan Japan Japan UK Germany Germany France UK Germany UK UK UK 19.313 Germany France France France UK Japan France UK Germany Germany UK Germany Germany Germany 16.574 UK Germany Germany UK Germany France UK France UK France France France Japan France 10.625 France UK UK Germany France Germany Japan Japan Japan Japan Japan Japan France Japan 9.276 Netherlands Netherlands Netherlands Netherlands Netherlands Netherlands Netherlands Netherlands Spain Netherlands Netherlands C anada Sweden Sweden 6.237 Spain I taly I taly Sweden Italy Sweden Spain Spain Netherlands Spain Sweden Netherlands Norway Netherlands 5 .578 Sweden Sweden Sweden C anada C anada Spain Sweden Italy Sweden C anada C anada A ustralia Netherlands Norway 5.099 Denmark C anada Norway Italy Sweden C anada C anada C anada Norway Sweden A ustralia Sweden China China 4.93
10 Italy Spain C anada Spain Spain I taly I taly Sweden C anada Norway Norway China C anada A ustralia 4 .3811 C anada Norway Spain Norway Norway Norway Norway Norway Italy A us tralia China Norway A ustralia C anada 4.2412 Norway Denmark Belgium Denmark Denmark Denmark A us tralia A us tralia China China I taly Switzerland Italy I taly 4 .0113 Switzerland Belgium Denmark Switzerland Belgium A ustralia Denmark Denmark Denmark Belgium Spain I taly Switzerland Switzerland 3.5214 A ustralia A us tralia Switzerland Belgium Switzerland Belgium China China A ustralia I taly Switzerland Denmark Denmark Denmark 3.0015 Belgium Switzerland A ustralia A us tralia A us tralia Switzerland Belgium Belgium Belgium Denmark Denmark Belgium Belgium Belgium 2.4516 China China China Portugal A us tria A us tria A us tria Switzerland Switzerland Switzerland Belgium Spain Spain Spain 1.8817 A ustria A us tria Finland China China China Switzerland A ustria Finland Finland Finland Korea Korea Korea 1.8618 Finland Finland A ustria Finland Finland Ireland Ireland Ireland A ustria A us tria Korea Finland Finland Finland 1.6319 Ireland Ireland Ireland A ustria Korea Finland Finland Finland Ireland Korea A ustria A us tria A us tria A us tria 1 .2320 Portugal P ortugal Korea Ireland Ireland Korea Korea Korea Korea Ireland Ireland Ireland Ireland Ireland 0.8221 Korea Korea Greece Korea Greece Greece Greece Greece Greece Portugal P ortugal P ortugal P ortugal New Zealand 0.5122 Greece Greece Portugal Greece Portugal P ortugal P ortugal P ortugal P ortugal Greece Greece New Zealand Poland Poland 0.4523 Luxembourg Luxembourg Luxembourg Luxembourg New Zealand Poland Luxembourg Luxembourg Luxembourg Luxembourg New Zealand Poland New Zealand Portugal 0 .4324 New Zealand New Zealand New Zealand New Zealand Luxembourg Luxembourg Poland Poland Poland Poland Poland Luxembourg Luxembourg Luxembourg 0 .4225 Poland C zech C zech Poland Poland New Zealand New Zealand New Zealand New Zealand New Zealand Luxembourg Greece Greece Greece 0.2526 C zech Poland Poland C zech C zech C zech C zech C zech C zech C zech C zech C zech C zech C zech 0.2127 Iceland Iceland Iceland Slovak Slovak Slovak Slovak Slovak Slovak Slovak Slovak Slovak Slovak Slovak 0.0828 Slovak Slovak Slovak Iceland Slovenia Slovenia Slovenia Slovenia Slovenia Slovenia Slovenia Slovenia Slovenia Slovenia 0 .0629 Iceland Iceland Iceland Iceland Iceland Iceland Iceland Iceland Iceland Iceland 0.04
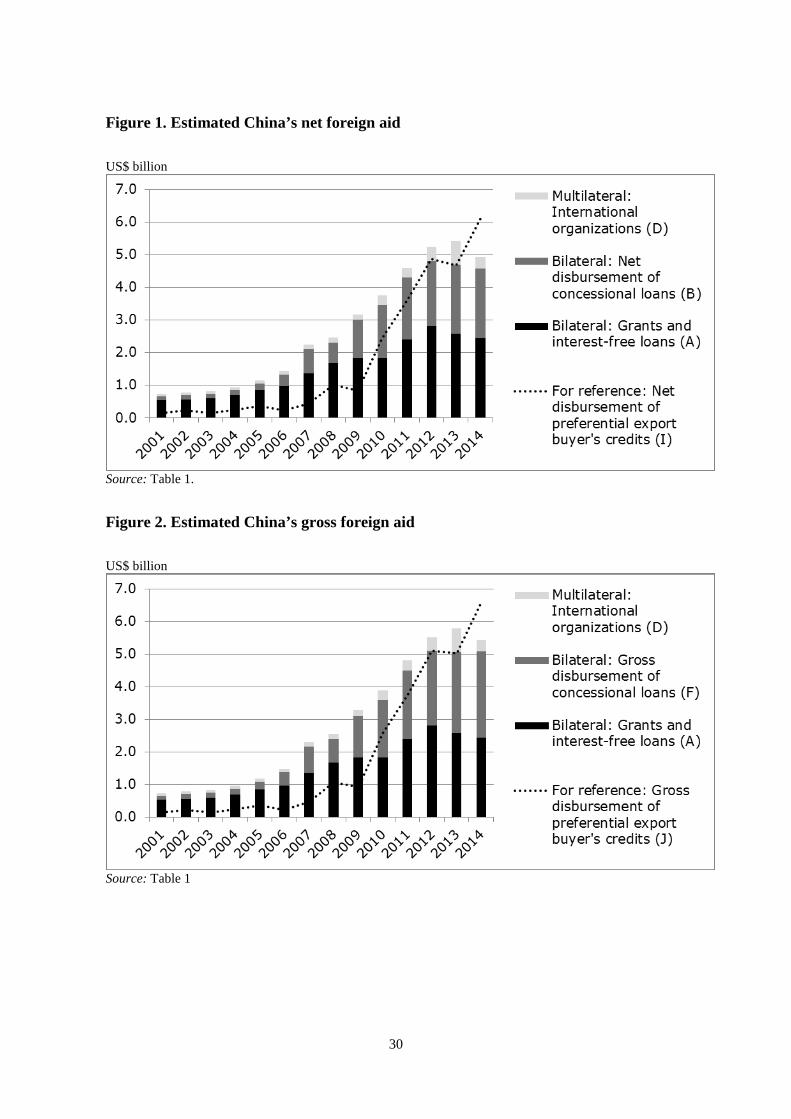
30
Figure 1. Estimated China’s net foreign aid
US$ billion
Source: Table 1.
Figure 2. Estimated China’s gross foreign aid
US$ billion
Source: Table 1
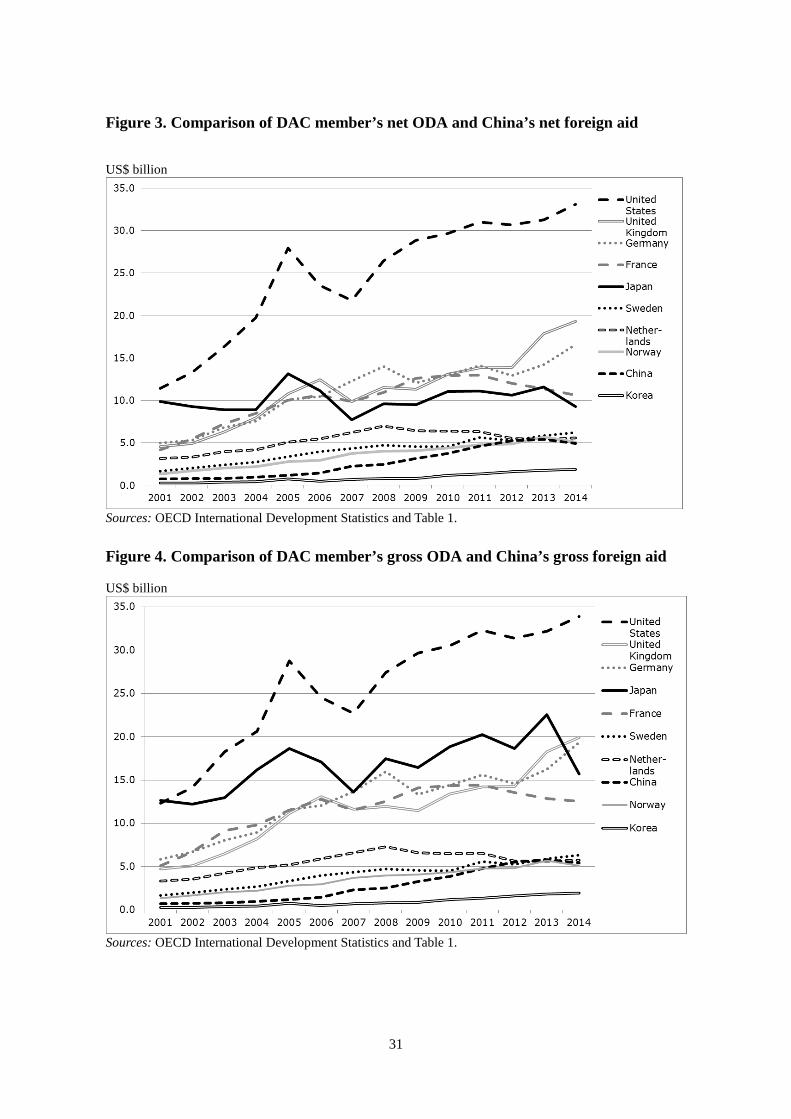
31
Figure 3. Comparison of DAC member’s net ODA and China’s net foreign aid
US$ billion
Sources: OECD International Development Statistics and Table 1.
Figure 4. Comparison of DAC member’s gross ODA and China’s gross foreign aid
US$ billion
Sources: OECD International Development Statistics and Table 1.
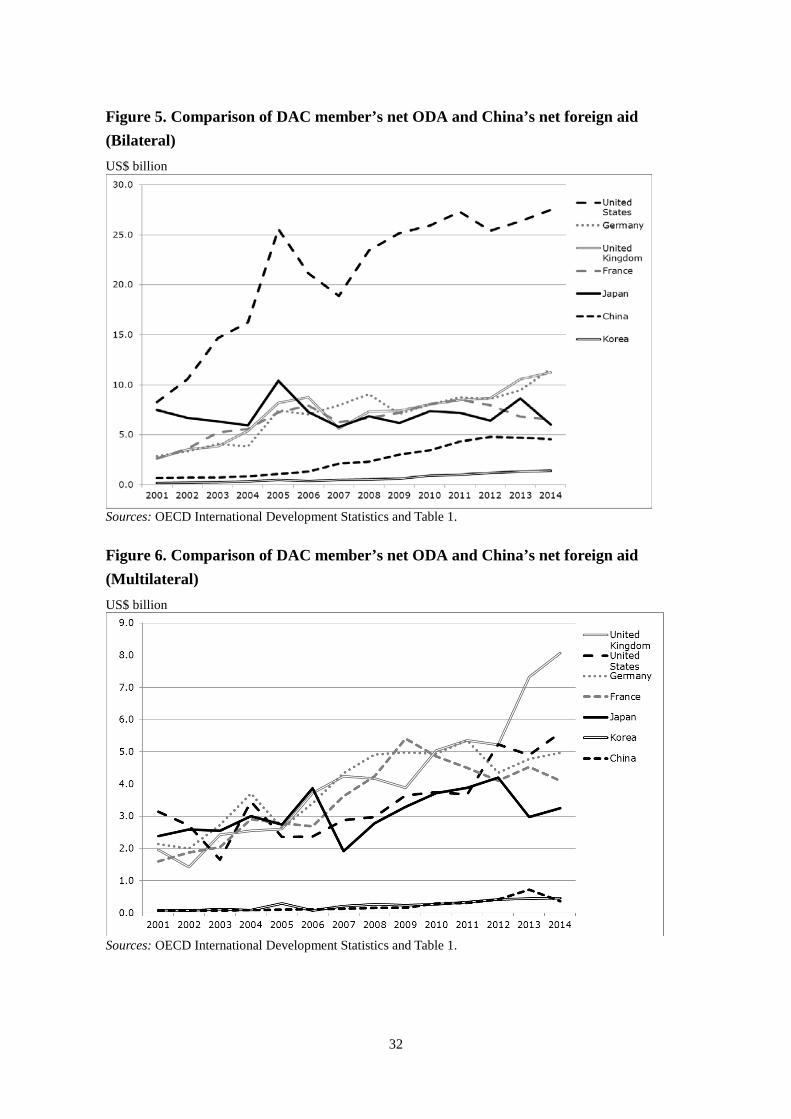
32
Figure 5. Comparison of DAC member’s net ODA and China’s net foreign aid (Bilateral) US$ billion
Sources: OECD International Development Statistics and Table 1. Figure 6. Comparison of DAC member’s net ODA and China’s net foreign aid (Multilateral) US$ billion
Sources: OECD International Development Statistics and Table 1.
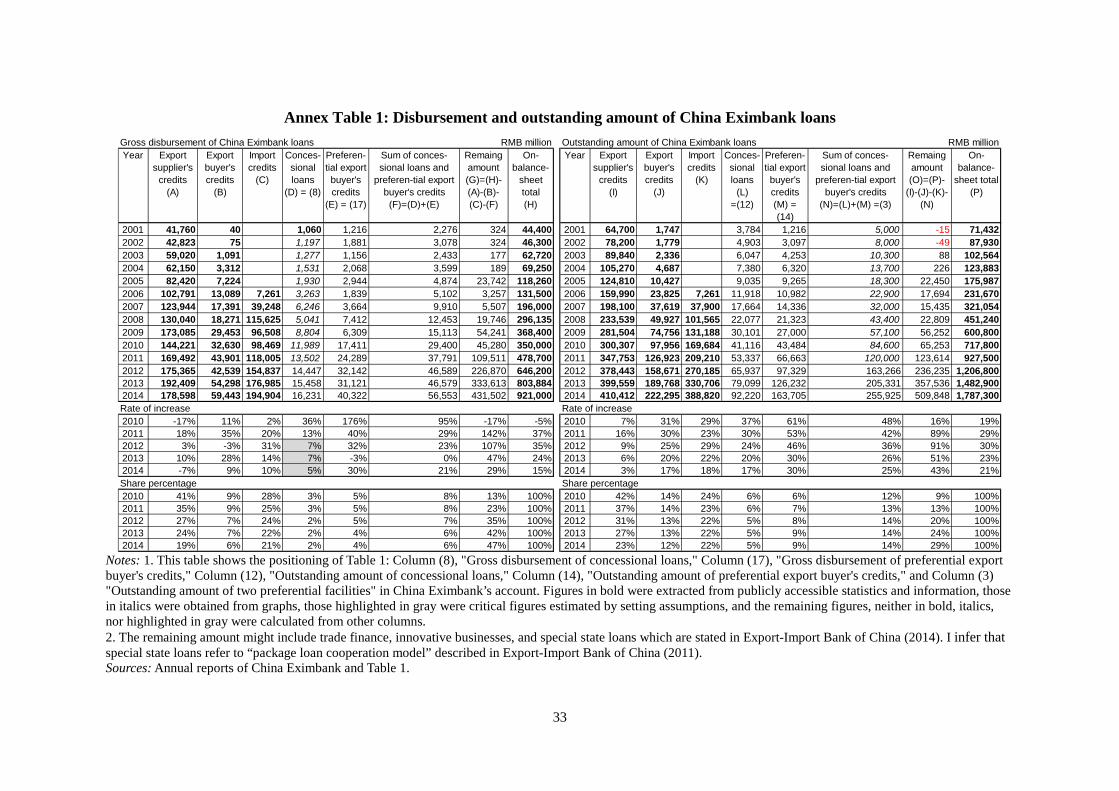
33
Annex Table 1: Disbursement and outstanding amount of China Eximbank loans
Notes: 1. This table shows the positioning of Table 1: Column (8), "Gross disbursement of concessional loans," Column (17), "Gross disbursement of preferential export buyer's credits," Column (12), "Outstanding amount of concessional loans," Column (14), "Outstanding amount of preferential export buyer's credits," and Column (3) "Outstanding amount of two preferential facilities" in China Eximbank’s account. Figures in bold were extracted from publicly accessible statistics and information, those in italics were obtained from graphs, those highlighted in gray were critical figures estimated by setting assumptions, and the remaining figures, neither in bold, italics, nor highlighted in gray were calculated from other columns. 2. The remaining amount might include trade finance, innovative businesses, and special state loans which are stated in Export-Import Bank of China (2014). I infer that special state loans refer to “package loan cooperation model” described in Export-Import Bank of China (2011). Sources: Annual reports of China Eximbank and Table 1.
Gross disbursement of China Eximbank loans RMB million Outstanding amount of China Eximbank loans RMB millionYear Export
supplier'scredits
(A)
Exportbuyer'scredits
(B)
Importcredits
(C)
Conces-sionalloans
(D) = (8)
Preferen-tial exportbuyer'scredits
(E) = (17)
Sum of conces-sional loans and
preferen-tial exportbuyer's credits
(F)=(D)+(E)
Remaingamount(G)=(H)-(A)-(B)-(C)-(F)
On-balance-
sheettotal(H)
Year Exportsupplier's
credits(I)
Exportbuyer'scredits
(J)
Importcredits
(K)
Conces-sionalloans
(L)=(12)
Preferen-tial exportbuyer'scredits(M) =(14)
Sum of conces-sional loans and
preferen-tial exportbuyer's credits
(N)=(L)+(M) =(3)
Remaingamount(O)=(P)-
(I)-(J)-(K)-(N)
On-balance-
sheet total(P)
2001 41,760 40 1,060 1,216 2,276 324 44,400 2001 64,700 1,747 3,784 1,216 5,000 -15 71,4322002 42,823 75 1,197 1,881 3,078 324 46,300 2002 78,200 1,779 4,903 3,097 8,000 -49 87,9302003 59,020 1,091 1,277 1,156 2,433 177 62,720 2003 89,840 2,336 6,047 4,253 10,300 88 102,5642004 62,150 3,312 1,531 2,068 3,599 189 69,250 2004 105,270 4,687 7,380 6,320 13,700 226 123,8832005 82,420 7,224 1,930 2,944 4,874 23,742 118,260 2005 124,810 10,427 9,035 9,265 18,300 22,450 175,9872006 102,791 13,089 7,261 3,263 1,839 5,102 3,257 131,500 2006 159,990 23,825 7,261 11,918 10,982 22,900 17,694 231,6702007 123,944 17,391 39,248 6,246 3,664 9,910 5,507 196,000 2007 198,100 37,619 37,900 17,664 14,336 32,000 15,435 321,0542008 130,040 18,271 115,625 5,041 7,412 12,453 19,746 296,135 2008 233,539 49,927 101,565 22,077 21,323 43,400 22,809 451,2402009 173,085 29,453 96,508 8,804 6,309 15,113 54,241 368,400 2009 281,504 74,756 131,188 30,101 27,000 57,100 56,252 600,8002010 144,221 32,630 98,469 11,989 17,411 29,400 45,280 350,000 2010 300,307 97,956 169,684 41,116 43,484 84,600 65,253 717,8002011 169,492 43,901 118,005 13,502 24,289 37,791 109,511 478,700 2011 347,753 126,923 209,210 53,337 66,663 120,000 123,614 927,5002012 175,365 42,539 154,837 14,447 32,142 46,589 226,870 646,200 2012 378,443 158,671 270,185 65,937 97,329 163,266 236,235 1,206,8002013 192,409 54,298 176,985 15,458 31,121 46,579 333,613 803,884 2013 399,559 189,768 330,706 79,099 126,232 205,331 357,536 1,482,9002014 178,598 59,443 194,904 16,231 40,322 56,553 431,502 921,000 2014 410,412 222,295 388,820 92,220 163,705 255,925 509,848 1,787,300Rate of increase Rate of increase2010 -17% 11% 2% 36% 176% 95% -17% -5% 2010 7% 31% 29% 37% 61% 48% 16% 19%2011 18% 35% 20% 13% 40% 29% 142% 37% 2011 16% 30% 23% 30% 53% 42% 89% 29%2012 3% -3% 31% 7% 32% 23% 107% 35% 2012 9% 25% 29% 24% 46% 36% 91% 30%2013 10% 28% 14% 7% -3% 0% 47% 24% 2013 6% 20% 22% 20% 30% 26% 51% 23%2014 -7% 9% 10% 5% 30% 21% 29% 15% 2014 3% 17% 18% 17% 30% 25% 43% 21%Share percentage Share percentage2010 41% 9% 28% 3% 5% 8% 13% 100% 2010 42% 14% 24% 6% 6% 12% 9% 100%2011 35% 9% 25% 3% 5% 8% 23% 100% 2011 37% 14% 23% 6% 7% 13% 13% 100%2012 27% 7% 24% 2% 5% 7% 35% 100% 2012 31% 13% 22% 5% 8% 14% 20% 100%2013 24% 7% 22% 2% 4% 6% 42% 100% 2013 27% 13% 22% 5% 9% 14% 24% 100%2014 19% 6% 21% 2% 4% 6% 47% 100% 2014 23% 12% 22% 5% 9% 14% 29% 100%
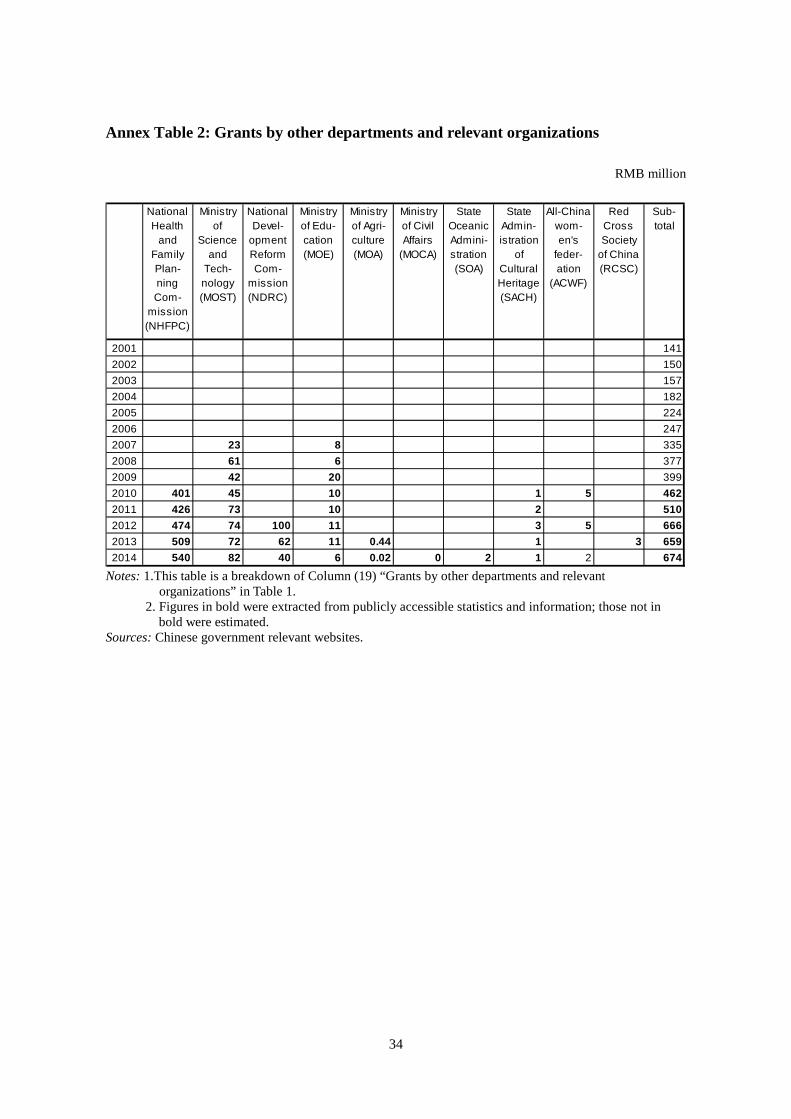
34
Annex Table 2: Grants by other departments and relevant organizations
RMB million
Notes: 1.This table is a breakdown of Column (19) “Grants by other departments and relevant
organizations” in Table 1. 2. Figures in bold were extracted from publicly accessible statistics and information; those not in
bold were estimated. Sources: Chinese government relevant websites.
NationalHealth
andFamilyPlan-ningCom-
mission(NHFPC)
Ministryof
Scienceand
Tech-nology(MOST)
NationalDevel-
opmentReformCom-
mission(NDRC)
Ministryof Edu-cation(MOE)
Ministryof Agri-culture(MOA)
Ministryof CivilAffairs
(MOCA)
StateOceanicAdmini-stration(SOA)
StateAdmin-istration
ofCulturalHeritage(SACH)
All-Chinawom-en's
feder-ation
(ACWF)
RedCrossSociety
of China(RCSC)
Sub-total
2001 1412002 1502003 1572004 1822005 2242006 2472007 23 8 3352008 61 6 3772009 42 20 3992010 401 45 10 1 5 4622011 426 73 10 2 5102012 474 74 100 11 3 5 6662013 509 72 62 11 0.44 1 3 6592014 540 82 40 6 0.02 0 2 1 2 674
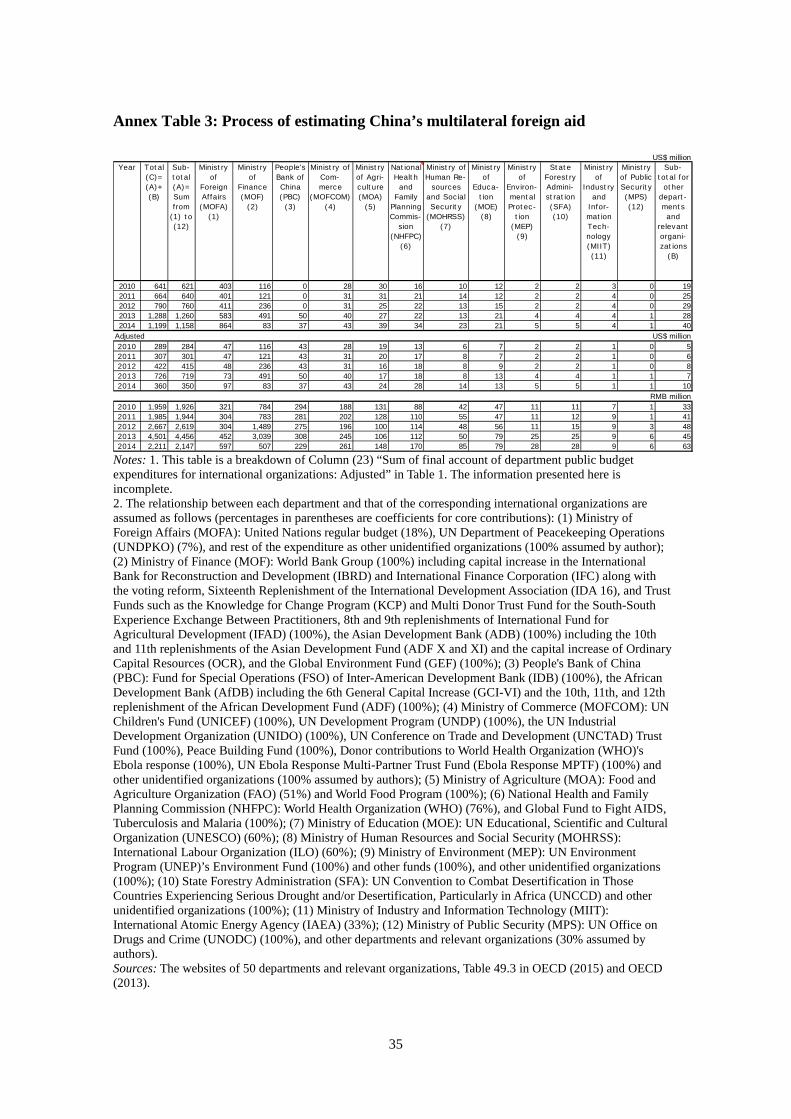
35
Annex Table 3: Process of estimating China’s multilateral foreign aid
Notes: 1. This table is a breakdown of Column (23) “Sum of final account of department public budget expenditures for international organizations: Adjusted” in Table 1. The information presented here is incomplete. 2. The relationship between each department and that of the corresponding international organizations are assumed as follows (percentages in parentheses are coefficients for core contributions): (1) Ministry of Foreign Affairs (MOFA): United Nations regular budget (18%), UN Department of Peacekeeping Operations (UNDPKO) (7%), and rest of the expenditure as other unidentified organizations (100% assumed by author); (2) Ministry of Finance (MOF): World Bank Group (100%) including capital increase in the International Bank for Reconstruction and Development (IBRD) and International Finance Corporation (IFC) along with the voting reform, Sixteenth Replenishment of the International Development Association (IDA 16), and Trust Funds such as the Knowledge for Change Program (KCP) and Multi Donor Trust Fund for the South-South Experience Exchange Between Practitioners, 8th and 9th replenishments of International Fund for Agricultural Development (IFAD) (100%), the Asian Development Bank (ADB) (100%) including the 10th and 11th replenishments of the Asian Development Fund (ADF X and XI) and the capital increase of Ordinary Capital Resources (OCR), and the Global Environment Fund (GEF) (100%); (3) People's Bank of China (PBC): Fund for Special Operations (FSO) of Inter-American Development Bank (IDB) (100%), the African Development Bank (AfDB) including the 6th General Capital Increase (GCI-VI) and the 10th, 11th, and 12th replenishment of the African Development Fund (ADF) (100%); (4) Ministry of Commerce (MOFCOM): UN Children's Fund (UNICEF) (100%), UN Development Program (UNDP) (100%), the UN Industrial Development Organization (UNIDO) (100%), UN Conference on Trade and Development (UNCTAD) Trust Fund (100%), Peace Building Fund (100%), Donor contributions to World Health Organization (WHO)'s Ebola response (100%), UN Ebola Response Multi-Partner Trust Fund (Ebola Response MPTF) (100%) and other unidentified organizations (100% assumed by authors); (5) Ministry of Agriculture (MOA): Food and Agriculture Organization (FAO) (51%) and World Food Program (100%); (6) National Health and Family Planning Commission (NHFPC): World Health Organization (WHO) (76%), and Global Fund to Fight AIDS, Tuberculosis and Malaria (100%); (7) Ministry of Education (MOE): UN Educational, Scientific and Cultural Organization (UNESCO) (60%); (8) Ministry of Human Resources and Social Security (MOHRSS): International Labour Organization (ILO) (60%); (9) Ministry of Environment (MEP): UN Environment Program (UNEP)’s Environment Fund (100%) and other funds (100%), and other unidentified organizations (100%); (10) State Forestry Administration (SFA): UN Convention to Combat Desertification in Those Countries Experiencing Serious Drought and/or Desertification, Particularly in Africa (UNCCD) and other unidentified organizations (100%); (11) Ministry of Industry and Information Technology (MIIT): International Atomic Energy Agency (IAEA) (33%); (12) Ministry of Public Security (MPS): UN Office on Drugs and Crime (UNODC) (100%), and other departments and relevant organizations (30% assumed by authors). Sources: The websites of 50 departments and relevant organizations, Table 49.3 in OECD (2015) and OECD (2013).
US$ millionYear Total
(C)=(A)+(B)
Sub-total(A)=Sumfrom
(1) to(12)
Ministryof
ForeignAffairs(MOFA)
(1)
Ministryof
Finance(MOF)
(2)
People'sBank ofChina(PBC)(3)
Ministry ofCom-merce
(MOFCOM)(4)
Ministryof Agri-culture(MOA)
(5)
NationalHealthand
FamilyPlanningCommis-
sion(NHFPC)
(6)
Ministry ofHuman Re-
sourcesand SocialSecurity
(MOHRSS)(7)
Ministryof
Educa-tion
(MOE)(8)
Ministryof
Environ-mentalProtec-
tion(MEP)
(9)
StateForestryAdmini-stration(SFA)(10)
Ministryof
Industryand
Infor-mationTech-nology(MIIT)(11)
Ministryof PublicSecurity(MPS)(12)
Sub-total for
otherdepart-mentsand
relevantorgani-zations
(B)
2010 641 621 403 116 0 28 30 16 10 12 2 2 3 0 192011 664 640 401 121 0 31 31 21 14 12 2 2 4 0 252012 790 760 411 236 0 31 25 22 13 15 2 2 4 0 292013 1,288 1,260 583 491 50 40 27 22 13 21 4 4 4 1 282014 1,199 1,158 864 83 37 43 39 34 23 21 5 5 4 1 40
Adjusted US$ million2010 289 284 47 116 43 28 19 13 6 7 2 2 1 0 52011 307 301 47 121 43 31 20 17 8 7 2 2 1 0 62012 422 415 48 236 43 31 16 18 8 9 2 2 1 0 82013 726 719 73 491 50 40 17 18 8 13 4 4 1 1 72014 360 350 97 83 37 43 24 28 14 13 5 5 1 1 10
RMB million2010 1,959 1,926 321 784 294 188 131 88 42 47 11 11 7 1 332011 1,985 1,944 304 783 281 202 128 110 55 47 11 12 9 1 412012 2,667 2,619 304 1,489 275 196 100 114 48 56 11 15 9 3 482013 4,501 4,456 452 3,039 308 245 106 112 50 79 25 25 9 6 452014 2,211 2,147 597 507 229 261 148 170 85 79 28 28 9 6 63
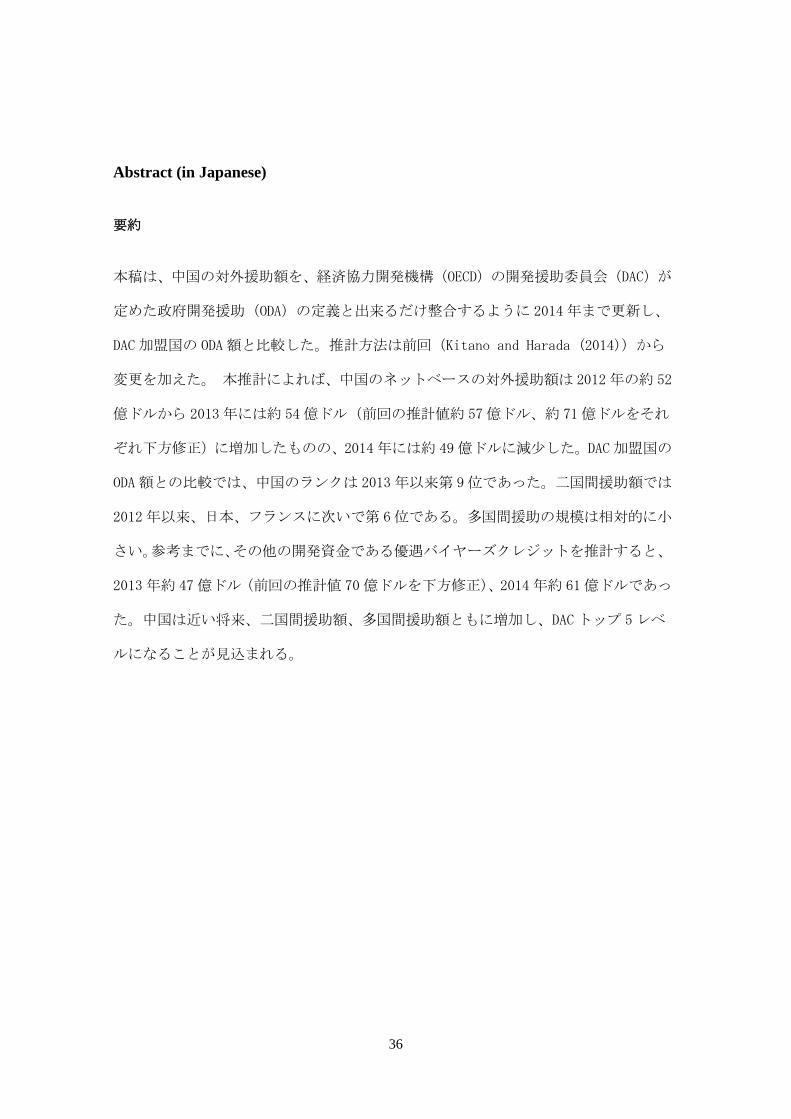
36
Abstract (in Japanese)
要約
本稿は、中国の対外援助額を、経済協力開発機構(OECD)の開発援助委員会(DAC)が
定めた政府開発援助(ODA)の定義と出来るだけ整合するように 2014 年まで更新し、
DAC 加盟国の ODA額と比較した。推計方法は前回(Kitano and Harada (2014))から
変更を加えた。 本推計によれば、中国のネットベースの対外援助額は 2012年の約 52
億ドルから 2013年には約 54億ドル(前回の推計値約 57億ドル、約 71億ドルをそれ
ぞれ下方修正)に増加したものの、2014年には約 49億ドルに減少した。DAC 加盟国の
ODA 額との比較では、中国のランクは 2013年以来第 9位であった。二国間援助額では
2012 年以来、日本、フランスに次いで第 6位である。多国間援助の規模は相対的に小
さい。参考までに、その他の開発資金である優遇バイヤーズクレジットを推計すると、
2013 年約 47億ドル(前回の推計値 70億ドルを下方修正)、2014年約 61億ドルであっ
た。中国は近い将来、二国間援助額、多国間援助額ともに増加し、DACトップ 5レベ
ルになることが見込まれる。
Working Papers from the same research project
“Comparative Study on Development Cooperation Strategies: Focusing on G20 Emerging Economies”
JICA-RI Working Paper No. 78
Estimating China's Foreign Aid 2001 - 2013
Naohiro Kitano and Yukinori Harada
JICA-RI Working Paper No. 82
Management of the International Development Aid System and the Creation of Political
Space for China: The Case of Tanzania
Mitsuaki Furukawa
JICA-RI Working Paper No. 87
The Benefits of Unification Failure:
Re-examining the Evolution of Economic Cooperation in Japan
Jin Sato
JICA-RI Working Paper No. 88
Chains of Knowledge Creation and Emerging Donors
Yasutami Shimomura and Wang Ping
JICA-RI Working Paper No. 106
Convergence of Aid Models in Emerging Donors? Learning Processes, Norms and
Identities, and Recipients
Hisahiro Kondoh
JICA-RI Working Paper No. 125
India’s Unique Role in the Enhancement of Democratic Governance
as a Model of Constitutional Democracy
Hiroaki Shiga
JICA-RI Working Paper No. 126
Potential and Challenges for Emerging Development Partners:
The Case of Indonesia
Akio Hosono