Embed Size (px)
Citation preview

The Pacific Journal of Science and Technology –22– http://www.akamaiuniversity.us/PJST.htm Volume 19. Number 1. May 2018 (Spring)
Comparative Study of Various Methods for Designing and Proportioning Normal Concrete Mixture
Ibe K. Ejiogu, M.Sc.*1; Prof. Paul A. Mamza2; Prof. Peter O. Nkeonye3;
and Prof. Aliyu S. Yaro4
1Directorate of Research and Development, Nigeria Institute of Leather and Science Technology
(NILEST), Samaru, Zaria, Kaduna State. Nigeria. 2Department of Chemistry, Ahmadu Bello University (ABU), Samaru, Zaria, Kaduna State. Nigeria.
3Department of Polymer and Textile Engineering, ABU, Samaru, Zaria, Kaduna State. Nigeria.
4Department of Materials and Metallurgical Engineering, ABU, Samaru, Zaria, Kaduna State. Nigeria.
E-mail: [email protected]*
ABSTRACT The American Concrete Institute 211-92 mix design proportioning method (ACI method) for normal concrete was compared with two other counterparts which included the British DOE Mix design proportioning method (DOE method) and the Indian Standard mix design proportioning method - IS 10262-82 (IS method) in order to evaluate the method that gave the best workability, cost efficiency, and met the targeted mean compressive strength (TMCS) within 28 days curing. The quality of the materials used for the proportioning of the fresh concrete was adequately evaluated using ASTM standards to ensure good quality control and integrity. 75 concrete samples were cast using 100X100X100 metallic cubic molds and the compressive strength for 7, 14, 21, and 28 days were obtained after the cubes were cured in water. The following comparative study was done; compressive strength vs. water cement ratio, compressive strength vs. cement content, compressive strength vs. workability, compressive strength vs. aggregate cement ratio, compressive strength vs. fine aggregate content, compressive strength vs. coarse aggregate content and cost analysis. The ACI method and IS methods were easier to proportion compared to the DOE method which was cumbersome. The compressive strength of the ACI method and IS methods met the TMCS but the DOE method did not meet the TMCS for the M15, M20, M25, M30, and M40 grades of concrete. The ACI method was more cost-effective than the IS method. The ACI method was cheaper than the IS method by;
14.94%, 12.18%, 12.55%, 12.93% and 4.10% for the M15, M20, M25, M30 and M40 concrete grades respectively. The ACI method was thus, recommended as first choice proportioning method for the group studied. (Keywords: ACI method, aggregate cement ratio, DOE
method, IS method, normal concrete)
INTRODUCTION The process of selecting and properly characterizing the materials for a concrete and determining their amounts within the concrete with the intention of achieving the desired targeted strength and properties of the concrete produced is called proportioning of concrete mixture (J.K. Chandra, et al., 2011). Concrete mix design and proportioning have undergone a lot of modifications over the years because concrete is one of the most utilized material in the world today. Concrete is utilized in the construction of infrastructures to meet the development needs in the 21
st Century (Hover,
1998). In order to keep up with this trend, various countries and nations have developed their own standards in proportioning concrete mixture in order to achieve the following: good workability of the concrete mixture, durability, high strength, best appearance, and most importantly cost efficiency (utilization of the least amount of materials to produce maximum compressive strength and desired properties). These characteristics can only be achieved with the careful selection of the appropriate design and proportioning of the concrete mixture.

The Pacific Journal of Science and Technology –23– http://www.akamaiuniversity.us/PJST.htm Volume 19. Number 1. May 2018 (Spring)
Various Methods of Proportioning Concrete Various methods are utilized to proportion concrete, however, some are more pronounced than others. In general, the method to be adopted is aimed at utilizing the least amount of concrete paste to obtain the desired qualities of concrete listed above. Some of the various proportioning methods include American Concrete Institute 211-92 (ACI Method), British DOE method (DOE method), Fineness Modulus Method, Maximum Density Method, Surface Area Method, India Standard-10262-82 method (IS method) etc. (M.S. Shettty, 1982). In all these proportioning methods for normal concrete mentioned the author(s) are interested in the following: - ACI Method, DOE Method, and IS method. These mix design proportioning methods are based on charts and graphs mathematically correlated together. Though they apply the same concept, there are a lot of differences between these three mix design proportioning methods for designing concrete mixtures. The three different proportioning methods differ from each other in terms of the quantities of materials required to produce the concrete. Criteria for Selecting a Mix Proportion Before the work can begin, the grade of the cement to be utilized will have to be specified as this will have a profound effect on the strength of the concrete to be produced. (Kazeem .K. etal, 2014), Aggregate Characteristics The aggregates normally utilized for the production of concrete are fine and coarse aggregates. The characteristics of these aggregates go a long way to determine the strength of the concrete. Some of the characteristics of the aggregates to be evaluated include: gradation, maximum size, nominal maximum size, absorption, specific gravity, bulk density, percent voids, percent moisture content, and mechanical properties. The aggregates properties have an effect on the properties of the concrete. Thus, a lot needs to be done to ensure that the aggregates meet required standards so as not to compromise the integrity of the concrete (Aitcin, 1991).
Water Cement Ratio Water cement ratio is usually used synonymously with water cementitious ratio, but the two are not the same. Water cement ratio (w/c), is the ratio of water to cement while water cementitious ratio is the ratio of water to cement and any other cementitious material that may be included in the concrete mixture (some of these cementitious materials include fly ash, silica fume, natural pozzolans, slag, etc. Cement ratio plays a critical role in the strength of concrete, for a normal concrete used in construction with adequately graded and sound aggregate the strength is inversely related to the water-cement ratio of the mix (Abram, 1918). Consolidation and Workability of Concrete: - Workability of cement is the ability of cement to be placed, consolidated, and finished. To determine the workability of cement, a slump test is usually carried out. For the specific design mix proportion adopted for study, defined slumps for the desired workability of the cement has been represented on tables and graphs. The desired values can be picked form the graphs to formulate the mix proportions and trial batches tested to see if they meet desired results. Environmental Conditions The environment the concrete may be exposed to will also affect the mix proportion to adopt. These conditions may include; mild, moderate or severe exposure to freezing and deicing agents. These conditions will determine the air content to be adopted and this will affect the mix proportion to be adopted. The amount of air required to provide adequate freeze-thaw resistance which depends on the maximum aggregate size and the degree of exposure. Mortar content of concrete normally decreases with increase in maximum Aggregate size reducing the air content and producing a higher strength concrete (Jalal Afsar, 2012).

The Pacific Journal of Science and Technology –24– http://www.akamaiuniversity.us/PJST.htm Volume 19. Number 1. May 2018 (Spring)
Utilization of Admixture Admixtures may be defined as materials, other than the main components of concrete (cement, water, aggregates) introduced into the concrete mixture before, immediately or after mixing (M.S. Shetty, 1982), e.g. plasticizers, retarders, pozzolans, etc. However, additives are materials added at the time of grinding the cement in the clinker at the cement factory (e.g., gypsum, triethanolamine (TEA), ethylene glycol, oleic acid, and dodecyl-benzene sulfonate). The work of S.P. Mishra and K.C. Jeevendra (2012) showed that ACI and IS methods of proportioning concrete mixture gave higher compressive strength and met the targeted mean compressive strength (TMCS) at 28 day cure, but the DOE method of mix design did not meet the TMCS for the various grades of concrete due to lower cement content, higher water content, higher aggregate cement ratio and higher water -cement ratio compared to the other two methods. The work of David Darwin, et al. (1997) evaluated the effect of water cement ratio, on the strength of the concrete for different cure days, and established that the strength of concrete increased as the water cement ratio reduced. K. Baskaran and K. Gopinath (2013), studied the applicability of ACI and DOE mix design methods on paving blocks and showed that the paving blocks cast using ACI mix proportions have compressive strengths that are higher than the compressive strength requirements of Sri-Lankan standard for paving blocks. In addition, the paving blocks produced using the DOE mix design method met the compressive strength that met the requirements of classes 2, 3, and 4 roads. Justification of the Study The goal of this study is the selection of a workable, effective, and efficient mix design for proportioning normal concrete that will give maximum targeted strength at the best price.
MATERIALS AND METHODS Materials Cement (cmt): - Ordinary Portland Lime Stone Cement Grade 42.5, Type–1, was used in the mix proportion for this study. The chemical and
physical properties of the cement are shown in Tables 1 and 2, respectively.
Table 1: Chemical Properties of the Cement.
Table 2: Physical Properties of the Cement.
Properties OPC
Specific gravity 3.15
Bulk Density 1452Kg/m3
Initial Setting Time 35mins
Final Setting Time 300mins
Soundness (%) 0.18
Fineness 223m3/Kg
3 days Compressive Strength (MPa) 25.00
7 days Compressive Strength (MPa) 33.00
14days Compressive Strength (MPa) 38.80
21 days Compressive Strength(MPa) 42.00
28Days Compressive Strength((MPa) 45.00
Fine Aggregates (FA): - The fine aggregate was natural river sand obtained from Ahmadu Bello University (ABU) Dam, in Zaria, Kaduna State in Nigeria. A sample of the fine aggregates was collected and sieved with 5mm sieve size to remove deleterious materials in accordance with ASTM C 33, which limits the permissible amounts of deleterious substances found in the fine aggregate. The fine aggregates were kept at ambient temperature in the laboratory and were utilized under surface saturated conditions. Samples were kept and collected in accordance with ASTM D 75-03. The maximum size, nominal maximum size, and fineness modulus were 5mm, 4.75mm, and 3.14, respectively. The particle size analysis of the fine aggregate is shown in Table 3.
Constituents % Weight
lime 60.20
Silica 20.4
Iron Oxide 3.48
Sulfite 2.32
Magnesium Oxide 1.49
Loss On Ignition 0.75
Lime Saturation Factor 0.92
Insoluble Residue 0.36
Compounds on Gelation of cement using Bogue Equation
Tricalcium silicate 50.20
Dicalcium Silicate 21.50
Tri calcium aluminate 9.22
Tetra calcium aluminoferrite 10.89
The Pacific Journal of Science and Technology –25– http://www.akamaiuniversity.us/PJST.htm Volume 19. Number 1. May 2018 (Spring)
Table 3: Gradation of Fine Aggregate. Mass FA=2Kg
Mass Retained
% Mass Retained
% Mass Passed
Cumulative % Retained
Sieve size (mm)
10.00 0 0 100 0
5.00 0 0 100 0
4.75 80 4 96 4
2.35 278 14 82 18
1.18 537 27 55 45
600 438 22 33 67
300 318 16 17 83
150 259 13 4 96
Pan 79 4 - -
Total 1989 100
314 Fineness Modulus=314/100=3.14
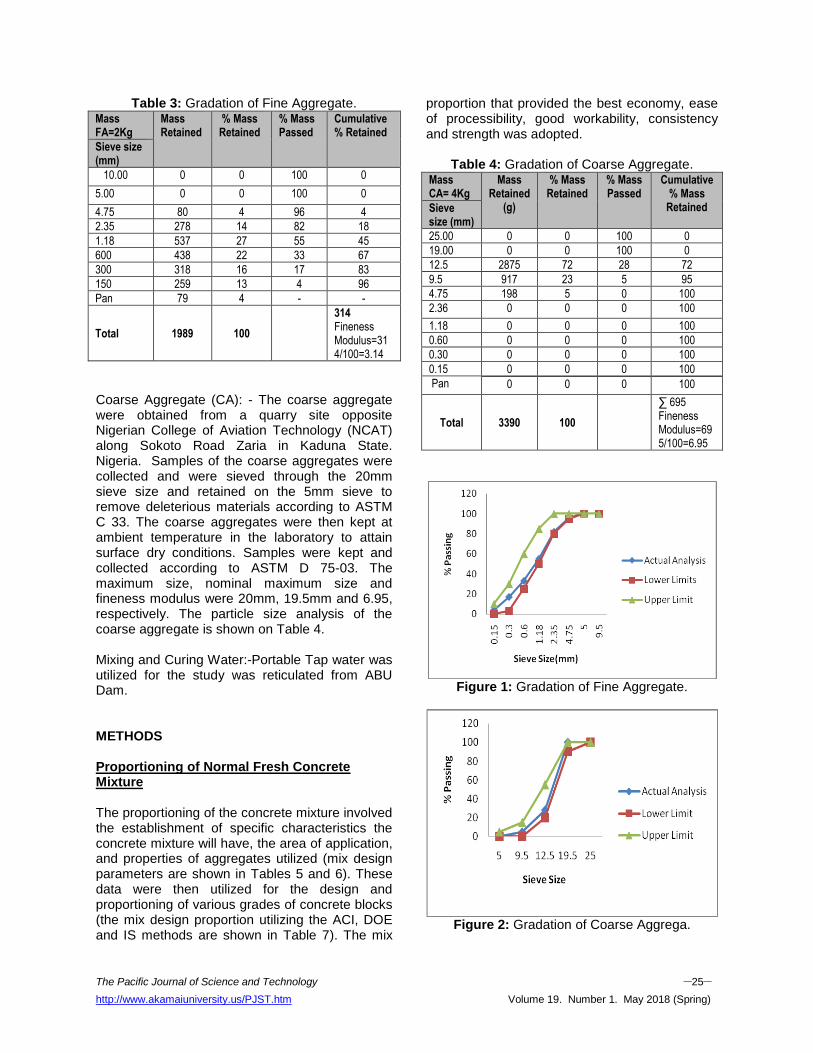
Coarse Aggregate (CA): - The coarse aggregate were obtained from a quarry site opposite Nigerian College of Aviation Technology (NCAT) along Sokoto Road Zaria in Kaduna State. Nigeria. Samples of the coarse aggregates were collected and were sieved through the 20mm sieve size and retained on the 5mm sieve to remove deleterious materials according to ASTM C 33. The coarse aggregates were then kept at ambient temperature in the laboratory to attain surface dry conditions. Samples were kept and collected according to ASTM D 75-03. The maximum size, nominal maximum size and fineness modulus were 20mm, 19.5mm and 6.95, respectively. The particle size analysis of the coarse aggregate is shown on Table 4. Mixing and Curing Water:-Portable Tap water was utilized for the study was reticulated from ABU Dam. METHODS Proportioning of Normal Fresh Concrete Mixture The proportioning of the concrete mixture involved the establishment of specific characteristics the concrete mixture will have, the area of application, and properties of aggregates utilized (mix design parameters are shown in Tables 5 and 6). These data were then utilized for the design and proportioning of various grades of concrete blocks (the mix design proportion utilizing the ACI, DOE and IS methods are shown in Table 7). The mix
proportion that provided the best economy, ease of processibility, good workability, consistency and strength was adopted.
Table 4: Gradation of Coarse Aggregate. Mass CA= 4Kg
Mass Retained
(g)
% Mass Retained
% Mass Passed
Cumulative % Mass
Retained Sieve size (mm)
25.00 0 0 100 0
19.00 0 0 100 0
12.5 2875 72 28 72
9.5 917 23 5 95
4.75 198 5 0 100
2.36 0 0 0 100
1.18 0 0 0 100
0.60 0 0 0 100
0.30 0 0 0 100
0.15 0 0 0 100
Pan 0 0 0 100
Total 3390 100
∑ 695 Fineness Modulus=695/100=6.95
Figure 1: Gradation of Fine Aggregate.
Figure 2: Gradation of Coarse Aggrega.

The Pacific Journal of Science and Technology –26– http://www.akamaiuniversity.us/PJST.htm Volume 19. Number 1. May 2018 (Spring)
Casting and curing of test Specimen: - casting was done using the 100X100X100 metallic mould and cured under water for 7, 14, 21 and 28 days.
Table 5: Concrete Mix Design Properties. S/N
Properties Values
1 Targeted Compressive Strength
M15,M20, M25 M30, M35, M40 MPa at 28days
2 Type of Cement ASTM Type 1
3 Specific Gravity of Cement
3.15
4 Maximum Size of Aggregate
20mm
5 Nominal Maximum Size of Coarse aggregate
19mm
6 Workability 25-75mm
7 Exposure Mild
8 Degree of Quality Control Good
9 Type of coarse Aggregate Crushed Limestone
Table 6: Physical Properties of Aggregates
1. Specific gravity Fine aggregate Coarse aggregate
2.65 2.52
2. Loose Bulk density Fine Aggregate Coarse Aggregate
1630kg/m3 1.542Kg/m3
3. Compacted bulk density Fine aggregate Coarse aggregate
1750Kg/m3 1647Kg/m3
4. Water absorption Fine Aggregate Coarse aggregate
1.10% 1.20%
5. Fineness modulus Fine Aggregate Coarse Aggregate
3.14 6.95
6. Percent Free surface moisture Fine Aggregate Coarse Aggregate
1.10% 1.10%
7. Workability Desired 25-75mm slump
8 Air content(moderate exposure) 3.5%
9. Chemical admixture utilized Non
Table 7: The ACI, DOE and IS Methods of Mix Design Proportions for Various Grades of Concrete.
S/N Method Grade Of Concrete
Targeted Mean compressive Strength (TMCS) (MPa) at 28 Days
W/C Cement (CMT) Content (kg/m3)
Water Content (Kg/m3)
FA Content (Kg/m3)
CA Content (Kg/m3)
TAC (Kg/m3)
TAC/CMT
1
ACI Method
M15 22.00 0.64 262.50 162.36 763.08 1085.80 1848.88 7.04
M20 27.00 0.54 311.11 162.71 721.35 1085.80 1807.15 5.81
M25 33.50 0.42 400.00 163.39 632.45 1085.80 1718.25 4.30
M30 38.50 0.40 420.00 163.54 627.93 1085.80 1713.53 4.07
M40 45.00 0.30 560.00 164.65 502.04 1085.80 1587.84 2.80
2
British Doe Method
M15 23.00 0.83 253.00 204.04 810.70 1190.89 2001.59 7.91
M20 28.25 0.73 287.67 205.31 756.73 1209.11 1965.84 6.83
M25 33.69 0.62 338.71 205.81 698.15 1215.49 1913.64 5.65
M30 38.00 0.56 375.00 205.52 646.68 1229.55 1876.23 5.00
M40 50.00 0.44 477.27 206.47 539.30 1232.25 1771.55 3.71
3
IS Method
M15 20.78 0.50 383.32 187.79 566.00 1180.60 1746.60 4.56
M20 26.60 0.48 399.17 187.82 563.31 1170.71 1734.02 4.34
M25 31.60 0.38 504.21 188.01 533.02 1112.63 1645.65 3.26
M30 36.60 0.36 532.22 188.06 515.18 1096.89 1612.07 3.03
M40 48.25 0.34 563.22 188.12 514.05 1079.21 1593.26 2.83 KEY: FA= Fine Aggregate, CA= Coarse Aggregate, TAC= Total Aggregate Content., TMCS= Targeted Mean Compressive Strength @ 28days cure, TMCS here specifically means the compressive strength the particular grade of concrete is supposed to attain within 28 day cure in water. Emphasis was placed on 28days because it is expected that the concrete will achieve its maximum strength within 28days, unless otherwise stated or the author(s) are interested in longer days depending on the nature of the study( some author(s) can go as high as 96-150days).
The Pacific Journal of Science and Technology –27– http://www.akamaiuniversity.us/PJST.htm Volume 19. Number 1. May 2018 (Spring)
RESULTS AND DISCUSSIONS
Table 8: Results for Compressive Strength for Various Grades of Concrete at Different Cure Days.
S/N Method Concrete Grade
TMCS (MPA) at 28 Days
W/C Slump (mm)
7 Days Compres
-sive strength
14Days Compres-
sive strength)
21 Days Compres-
sive Strength
28 Days Compres-
sive strength
Ave Density of Five cubes
Sample (Kg/m3)
1
ACI Method
M15 22.00 0.64 33 15.62 18.04 21.56 22.11 2273.74
M20 27.00 0.54 30 19.71 22.41 25.38 28.19 2280.97
M25 33.50 0.42 38 24.79 28.48 31.16 35.47 2281.64
M30 38.50 0.40 40 26.95 33.88 37.73 38.84 2297.07
M40 45.00 0.30 45 33.75 38.70 43.65 46.13 2408.63
2.
British Doe Method
M15 23.00 0.83 40 11.96 14.26 16.56 20.00 2458.82
M20 28.25 0.73 45 17.80 21.47 24.01 26.27 2458.16
M25 33.69 0.62 43 20.00 25.00 26.00 29.00 2456.75
M30 38.00 0.56 45 23.00 25.84 29.64 32.30 2455.29
M40 50.00 0.44 50 29.00 32.50 39.00 42.50 2456.48
3
IS Method
M15 20.78 0.50 30 14.55 17.03 20.16 20.96 2231.71
M20 26.60 0.48 35 18.72 22.61 26.07 27.88 2321.01
M25 31.60 0.38 38 22.75 26.86 31.13 33.12 2337.87
M30 36.60 0.36 42 27.45 31.12 34.04 37.12 2335.35
M40 48.25 0.34 35 36.67 39.57 44.87 48.30 2337.60 Note: The water content indicated in the results were obtained by considering moisture content and absorption of the aggregates. Water content obtained in result= Water Content (SSD condition) – [(F.Acr /1.02X0.09) – (C.Acr /1.011X – 0.001)] Where F.Acr and C.Acr are Fine aggregate content and Coarse aggregate contents displayed in table 4.0 above. Workability/slump fell within the recommended values for the mix design utilized in Table 6 for all the proportion methods and grades of concrete.
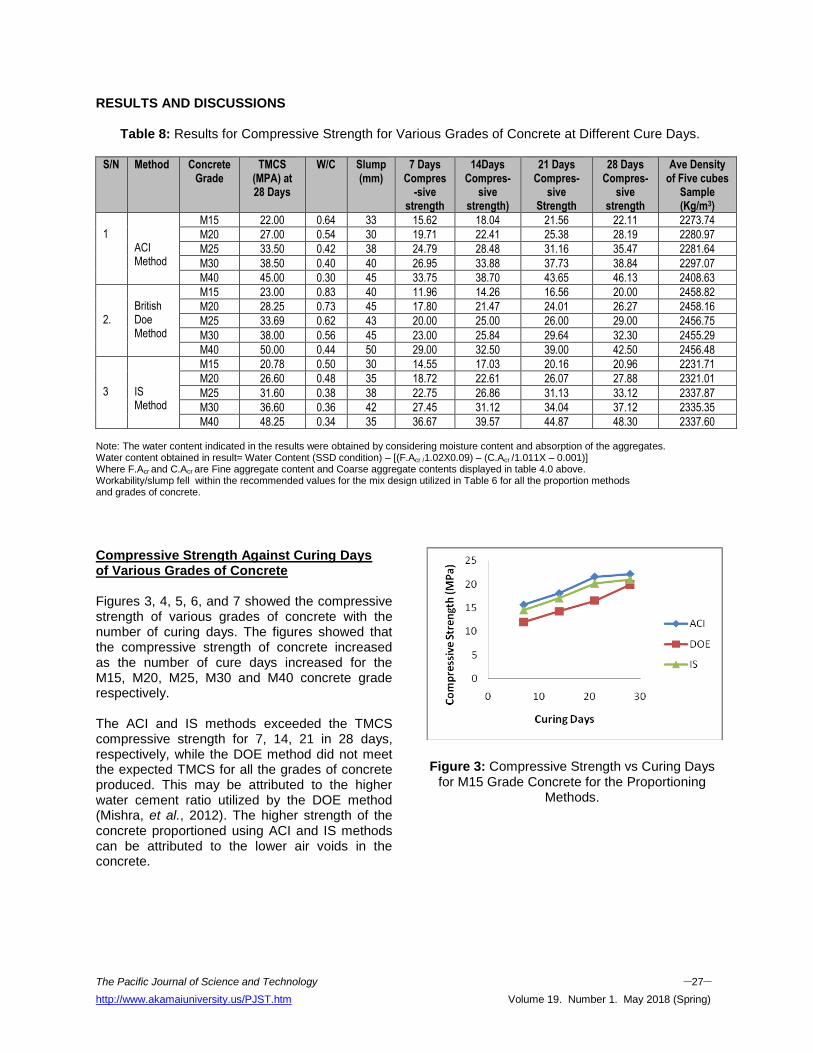
Compressive Strength Against Curing Days of Various Grades of Concrete Figures 3, 4, 5, 6, and 7 showed the compressive strength of various grades of concrete with the number of curing days. The figures showed that the compressive strength of concrete increased as the number of cure days increased for the M15, M20, M25, M30 and M40 concrete grade respectively. The ACI and IS methods exceeded the TMCS compressive strength for 7, 14, 21 in 28 days, respectively, while the DOE method did not meet the expected TMCS for all the grades of concrete produced. This may be attributed to the higher water cement ratio utilized by the DOE method (Mishra, et al., 2012). The higher strength of the concrete proportioned using ACI and IS methods can be attributed to the lower air voids in the concrete.
Figure 3: Compressive Strength vs Curing Days
for M15 Grade Concrete for the Proportioning Methods.
The Pacific Journal of Science and Technology –28– http://www.akamaiuniversity.us/PJST.htm Volume 19. Number 1. May 2018 (Spring)
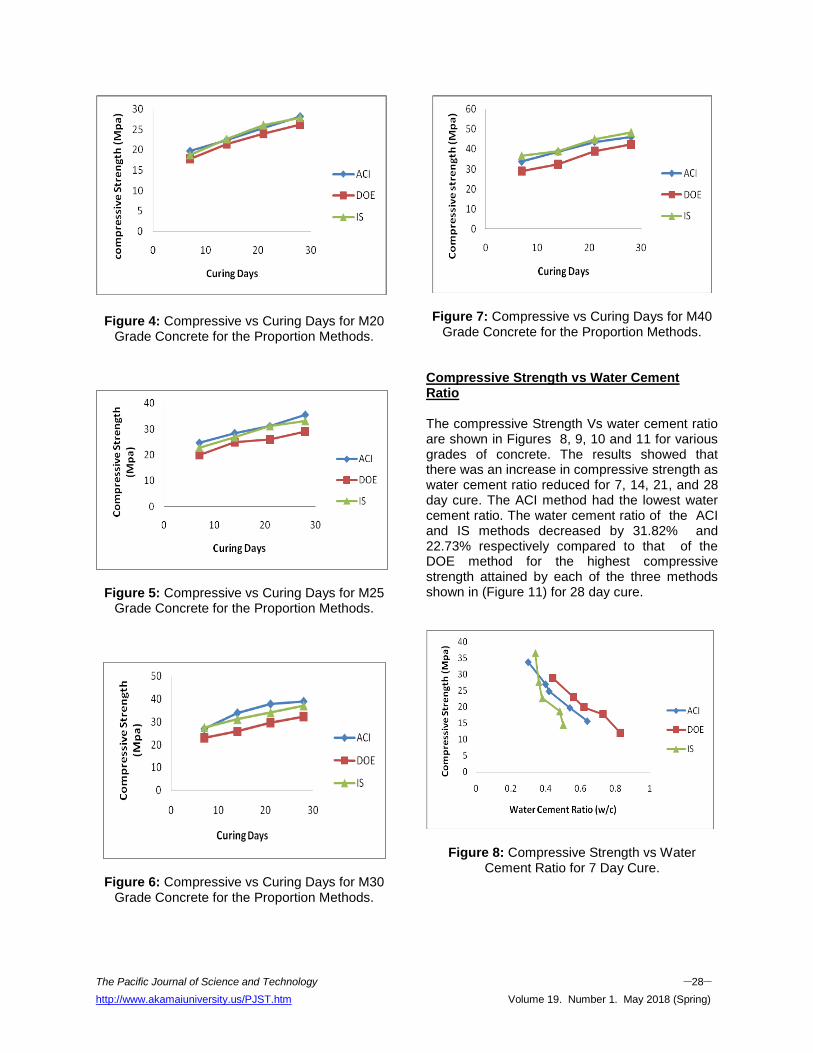
Figure 4: Compressive vs Curing Days for M20 Grade Concrete for the Proportion Methods.
Figure 5: Compressive vs Curing Days for M25 Grade Concrete for the Proportion Methods.
Figure 6: Compressive vs Curing Days for M30 Grade Concrete for the Proportion Methods.
Figure 7: Compressive vs Curing Days for M40
Grade Concrete for the Proportion Methods. Compressive Strength vs Water Cement Ratio The compressive Strength Vs water cement ratio are shown in Figures 8, 9, 10 and 11 for various grades of concrete. The results showed that there was an increase in compressive strength as water cement ratio reduced for 7, 14, 21, and 28 day cure. The ACI method had the lowest water cement ratio. The water cement ratio of the ACI and IS methods decreased by 31.82% and 22.73% respectively compared to that of the DOE method for the highest compressive strength attained by each of the three methods shown in (Figure 11) for 28 day cure.
Figure 8: Compressive Strength vs Water Cement Ratio for 7 Day Cure.

The Pacific Journal of Science and Technology –29– http://www.akamaiuniversity.us/PJST.htm Volume 19. Number 1. May 2018 (Spring)
Figure 9: Compressive Strength vs Water Cement Ratio for 14 Day Cure.
Figure 10: Compressive Strength vs Water Cement Ratio for 21 Day Cure.
Figure 11: Compressive Strength vs Water Cement Ratio for 28 Day Cure.
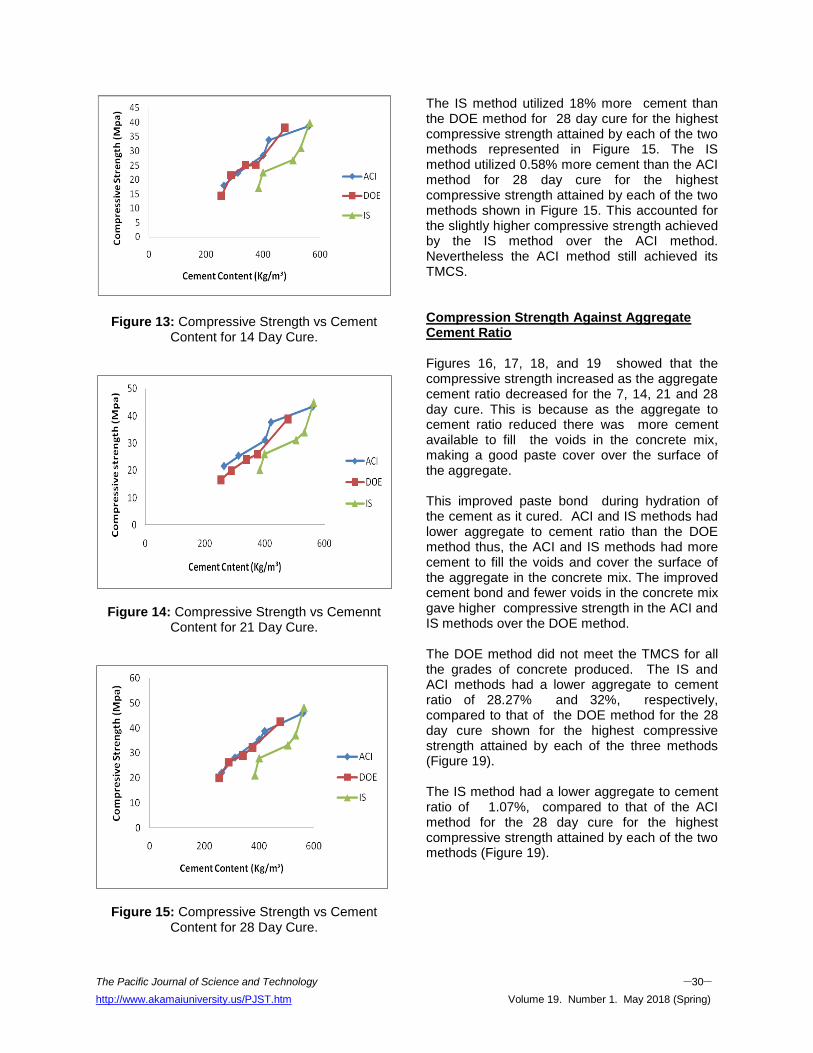
Similarly the water cement ratio of the ACI method is lower by 11.8% compared to that of the IS method for 28 day cure for the highest compressive strength attained by each of the two methods (Figure 11). The higher compressive strength exhibited by the ACI and IS methods can be attributed to the lower air voids in the concrete, which reduced when the water content reduced. (M. Shetty,1982). Compressive Strength Against Cement Content Figures 12, 13, 14, 15 showed that higher cement content meant increased compressive strength because the binding strength of mortar in the fresh concrete increased. The ACI method and The IS methods utilized more cement than the DOE method. The ACI and IS methods met the TMCS for all the grades of concrete while the DOE method failed to meet the TMCS. The IS method utilized the highest cement content, as a result, achieved the highest compressive strength for all the cure days. The ACI method utilized 17.33% more cement than the DOE method for 28 day cure for the highest compressive strength attained by each of the two methods shown in Figure 15.
Figure 12: Compressive Strength vs Cement Content for 7 Day Cure.
The Pacific Journal of Science and Technology –30– http://www.akamaiuniversity.us/PJST.htm Volume 19. Number 1. May 2018 (Spring)
Figure 13: Compressive Strength vs Cement Content for 14 Day Cure.
Figure 14: Compressive Strength vs Cemennt Content for 21 Day Cure.
Figure 15: Compressive Strength vs Cement Content for 28 Day Cure.
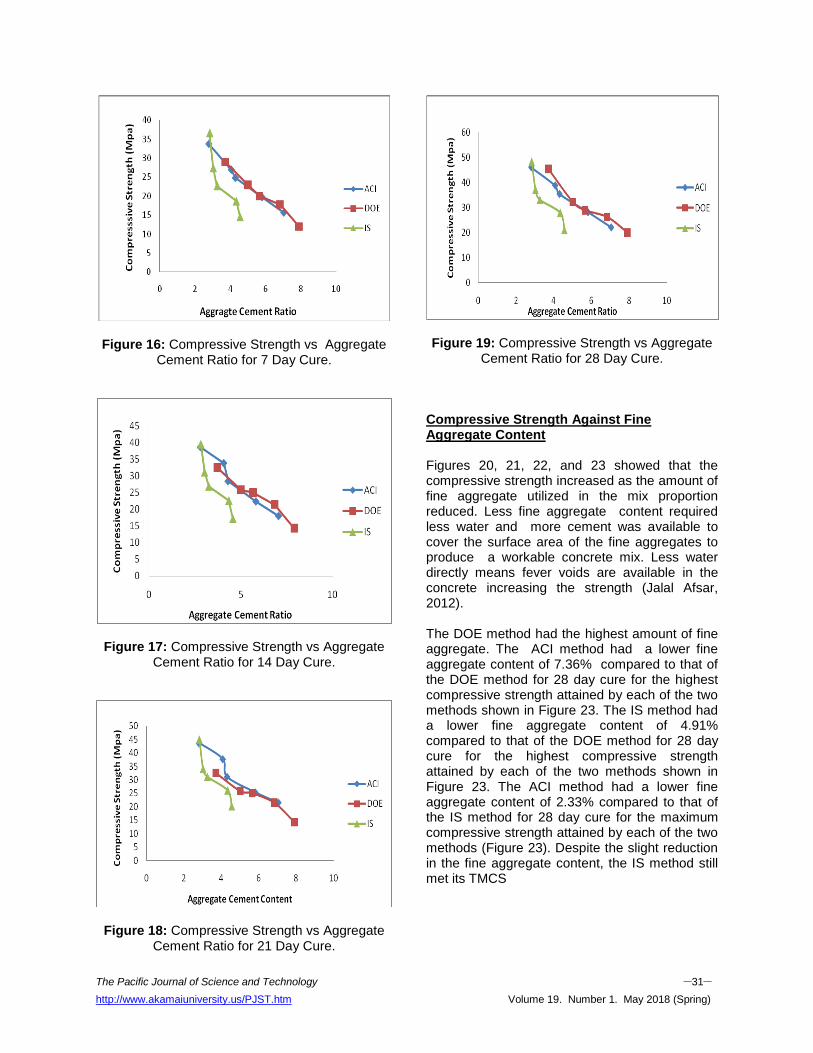
The IS method utilized 18% more cement than the DOE method for 28 day cure for the highest compressive strength attained by each of the two methods represented in Figure 15. The IS method utilized 0.58% more cement than the ACI method for 28 day cure for the highest compressive strength attained by each of the two methods shown in Figure 15. This accounted for the slightly higher compressive strength achieved by the IS method over the ACI method. Nevertheless the ACI method still achieved its TMCS. Compression Strength Against Aggregate Cement Ratio Figures 16, 17, 18, and 19 showed that the compressive strength increased as the aggregate cement ratio decreased for the 7, 14, 21 and 28 day cure. This is because as the aggregate to cement ratio reduced there was more cement available to fill the voids in the concrete mix, making a good paste cover over the surface of the aggregate. This improved paste bond during hydration of the cement as it cured. ACI and IS methods had lower aggregate to cement ratio than the DOE method thus, the ACI and IS methods had more cement to fill the voids and cover the surface of the aggregate in the concrete mix. The improved cement bond and fewer voids in the concrete mix gave higher compressive strength in the ACI and IS methods over the DOE method. The DOE method did not meet the TMCS for all the grades of concrete produced. The IS and ACI methods had a lower aggregate to cement ratio of 28.27% and 32%, respectively, compared to that of the DOE method for the 28 day cure shown for the highest compressive strength attained by each of the three methods (Figure 19). The IS method had a lower aggregate to cement ratio of 1.07%, compared to that of the ACI method for the 28 day cure for the highest compressive strength attained by each of the two methods (Figure 19).
The Pacific Journal of Science and Technology –31– http://www.akamaiuniversity.us/PJST.htm Volume 19. Number 1. May 2018 (Spring)
Figure 16: Compressive Strength vs Aggregate Cement Ratio for 7 Day Cure.
Figure 17: Compressive Strength vs Aggregate Cement Ratio for 14 Day Cure.
Figure 18: Compressive Strength vs Aggregate Cement Ratio for 21 Day Cure.
Figure 19: Compressive Strength vs Aggregate
Cement Ratio for 28 Day Cure.
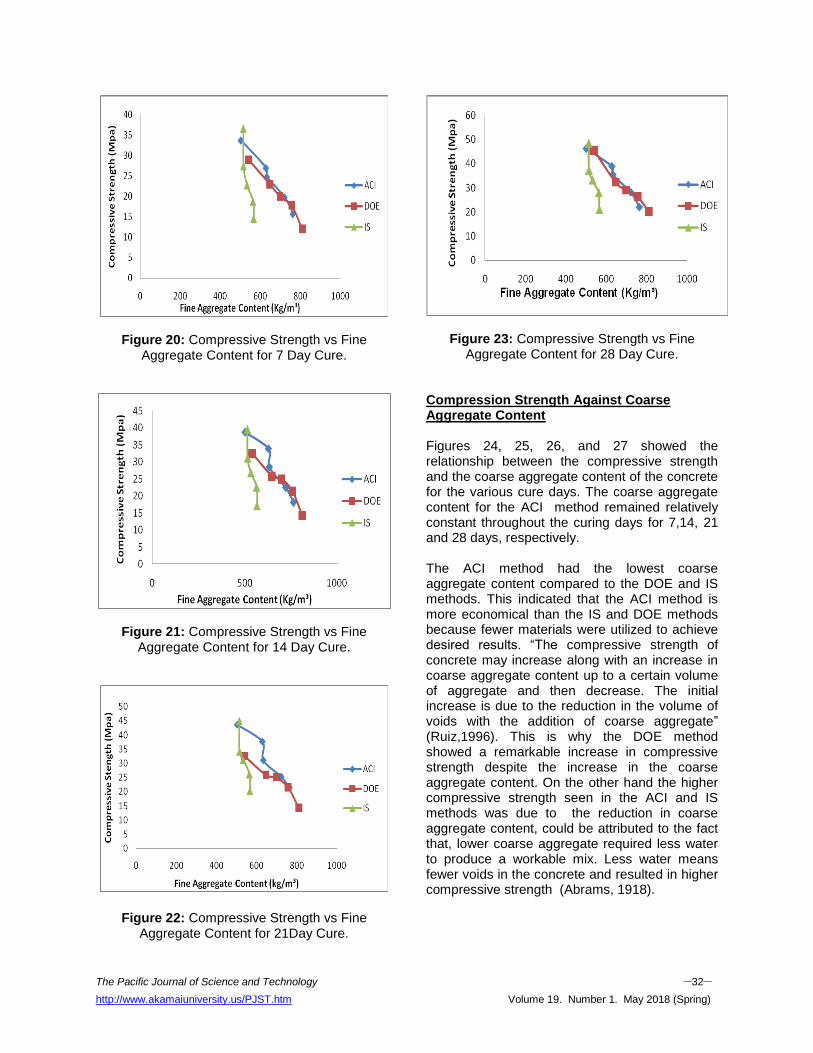
Compressive Strength Against Fine Aggregate Content Figures 20, 21, 22, and 23 showed that the compressive strength increased as the amount of fine aggregate utilized in the mix proportion reduced. Less fine aggregate content required less water and more cement was available to cover the surface area of the fine aggregates to produce a workable concrete mix. Less water directly means fever voids are available in the concrete increasing the strength (Jalal Afsar, 2012). The DOE method had the highest amount of fine aggregate. The ACI method had a lower fine aggregate content of 7.36% compared to that of the DOE method for 28 day cure for the highest compressive strength attained by each of the two methods shown in Figure 23. The IS method had a lower fine aggregate content of 4.91% compared to that of the DOE method for 28 day cure for the highest compressive strength attained by each of the two methods shown in Figure 23. The ACI method had a lower fine aggregate content of 2.33% compared to that of the IS method for 28 day cure for the maximum compressive strength attained by each of the two methods (Figure 23). Despite the slight reduction in the fine aggregate content, the IS method still met its TMCS
The Pacific Journal of Science and Technology –32– http://www.akamaiuniversity.us/PJST.htm Volume 19. Number 1. May 2018 (Spring)
Figure 20: Compressive Strength vs Fine Aggregate Content for 7 Day Cure.
Figure 21: Compressive Strength vs Fine Aggregate Content for 14 Day Cure.
Figure 22: Compressive Strength vs Fine Aggregate Content for 21Day Cure.
Figure 23: Compressive Strength vs Fine Aggregate Content for 28 Day Cure.
Compression Strength Against Coarse Aggregate Content Figures 24, 25, 26, and 27 showed the relationship between the compressive strength and the coarse aggregate content of the concrete for the various cure days. The coarse aggregate content for the ACI method remained relatively constant throughout the curing days for 7,14, 21 and 28 days, respectively. The ACI method had the lowest coarse aggregate content compared to the DOE and IS methods. This indicated that the ACI method is more economical than the IS and DOE methods because fewer materials were utilized to achieve desired results. “The compressive strength of concrete may increase along with an increase in coarse aggregate content up to a certain volume of aggregate and then decrease. The initial increase is due to the reduction in the volume of voids with the addition of coarse aggregate” (Ruiz,1996). This is why the DOE method showed a remarkable increase in compressive strength despite the increase in the coarse aggregate content. On the other hand the higher compressive strength seen in the ACI and IS methods was due to the reduction in coarse aggregate content, could be attributed to the fact that, lower coarse aggregate required less water to produce a workable mix. Less water means fewer voids in the concrete and resulted in higher compressive strength (Abrams, 1918).

The Pacific Journal of Science and Technology –33– http://www.akamaiuniversity.us/PJST.htm Volume 19. Number 1. May 2018 (Spring)
Figure 24: Compressive Strength vs Coarse Aggregate Content for 7 Day Cure.
Figure 25: Compressive Strength vs Coarse Aggregate Content for 14 Day Cure.
Figure 26: Compressive Strength vs Coarse Aggregate Content for 21 Day Cure.
Figure 27: Compressive Strength vs Coarse Aggregate Content for 28 Day Cure.
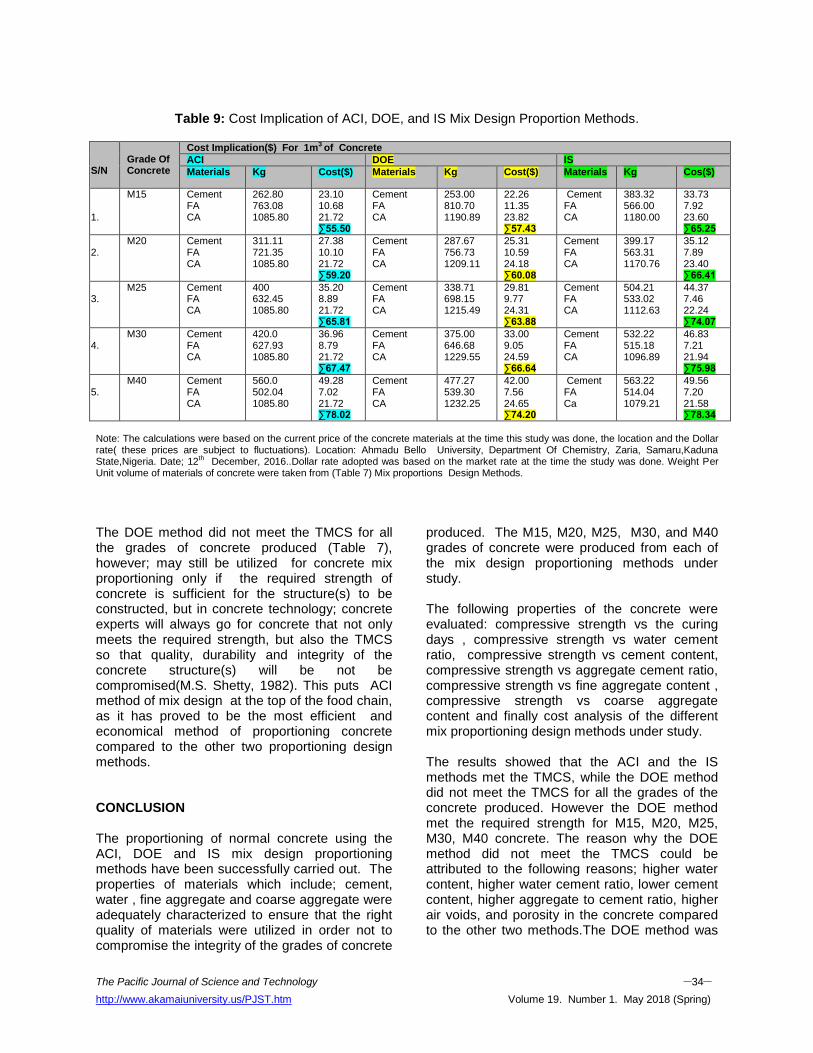
Cost Evaluation of the Different Mix Proportions 50kg of cement cost N2,200 (OPC 43Grade) 1kg of cement will cost N44.00 ($0.088) 50Kg of Fine Aggregate Cost N350 1Kg of Fine Aggregate will cost N7.00($0.014) 50Kg of Coarse Aggregate N500 1Kg of Coarse Aggregate will cost N10($0.02) The prices of the various mix design are represented in Table 9. It showed that the most expensive mix method was the IS method because it utilized the highest cement content in the concrete mix for all the grades of concrete produced. The cost of the ACI method was cheaper than that of the IS method for the M15, M20, M25, M30, and M40 concrete grade by 14.94%, 12.18%, 12.55%, 12.93%, and 4.10%, respectively. The ACI method proved to be the most economical method compared to the IS method, since it met the TMCS with lower cost. The ACI method of mix design was cheaper than the DOE method for the M15 and M20 grades of concrete by 3.36% and 1.46%, respectively. Subsequently the ACI method became slightly more expensive than the DOE method for the M25, M30, and M40 grades of concrete by 2.93%, 1.25%, and 5.14%, respectively.
The Pacific Journal of Science and Technology –34– http://www.akamaiuniversity.us/PJST.htm Volume 19. Number 1. May 2018 (Spring)
Table 9: Cost Implication of ACI, DOE, and IS Mix Design Proportion Methods.
S/N
Grade Of Concrete
Cost Implication($) For 1m3 of Concrete
ACI DOE IS
Materials Kg Cost($) Materials Kg Cost($) Materials Kg Cos($)
1.
M15 Cement FA CA
262.80 763.08 1085.80
23.10 10.68 21.72 ∑55.50
Cement FA CA
253.00 810.70 1190.89
22.26 11.35 23.82 ∑57.43
Cement FA CA
383.32 566.00 1180.00
33.73 7.92 23.60 ∑65.25
2.
M20 Cement FA CA
311.11 721.35 1085.80
27.38 10.10 21.72 ∑59.20
Cement FA CA
287.67 756.73 1209.11
25.31 10.59 24.18 ∑60.08
Cement FA CA
399.17 563.31 1170.76
35.12 7.89 23.40 ∑66.41
3.
M25 Cement FA CA
400 632.45 1085.80
35.20 8.89 21.72 ∑65.81
Cement FA CA
338.71 698.15 1215.49
29.81 9.77 24.31 ∑63.88
Cement FA CA
504.21 533.02 1112.63
44.37 7.46 22.24 ∑74.07
4.
M30 Cement FA CA
420.0 627.93 1085.80
36.96 8.79 21.72 ∑67.47
Cement FA CA
375.00 646.68 1229.55
33.00 9.05 24.59 ∑66.64
Cement FA CA
532.22 515.18 1096.89
46.83 7.21 21.94 ∑75.98
5.
M40 Cement FA CA
560.0 502.04 1085.80
49.28 7.02 21.72 ∑78.02
Cement FA CA
477.27 539.30 1232.25
42.00 7.56 24.65 ∑74.20
Cement FA Ca
563.22 514.04 1079.21
49.56 7.20 21.58 ∑78.34
Note: The calculations were based on the current price of the concrete materials at the time this study was done, the location and the Dollar rate( these prices are subject to fluctuations). Location: Ahmadu Bello University, Department Of Chemistry, Zaria, Samaru,Kaduna State,Nigeria. Date; 12th December, 2016..Dollar rate adopted was based on the market rate at the time the study was done. Weight Per Unit volume of materials of concrete were taken from (Table 7) Mix proportions Design Methods.
The DOE method did not meet the TMCS for all the grades of concrete produced (Table 7), however; may still be utilized for concrete mix proportioning only if the required strength of concrete is sufficient for the structure(s) to be constructed, but in concrete technology; concrete experts will always go for concrete that not only meets the required strength, but also the TMCS so that quality, durability and integrity of the concrete structure(s) will be not be compromised(M.S. Shetty, 1982). This puts ACI method of mix design at the top of the food chain, as it has proved to be the most efficient and economical method of proportioning concrete compared to the other two proportioning design methods. CONCLUSION The proportioning of normal concrete using the ACI, DOE and IS mix design proportioning methods have been successfully carried out. The properties of materials which include; cement, water , fine aggregate and coarse aggregate were adequately characterized to ensure that the right quality of materials were utilized in order not to compromise the integrity of the grades of concrete
produced. The M15, M20, M25, M30, and M40 grades of concrete were produced from each of the mix design proportioning methods under study. The following properties of the concrete were evaluated: compressive strength vs the curing days , compressive strength vs water cement ratio, compressive strength vs cement content, compressive strength vs aggregate cement ratio, compressive strength vs fine aggregate content , compressive strength vs coarse aggregate content and finally cost analysis of the different mix proportioning design methods under study. The results showed that the ACI and the IS methods met the TMCS, while the DOE method did not meet the TMCS for all the grades of the concrete produced. However the DOE method met the required strength for M15, M20, M25, M30, M40 concrete. The reason why the DOE method did not meet the TMCS could be attributed to the following reasons; higher water content, higher water cement ratio, lower cement content, higher aggregate to cement ratio, higher air voids, and porosity in the concrete compared to the other two methods.The DOE method was

The Pacific Journal of Science and Technology –35– http://www.akamaiuniversity.us/PJST.htm Volume 19. Number 1. May 2018 (Spring)
cumbersome to proportion compared to the other two methods. The cost implications for the different mix proportions showed that the most expensive mix design proportioning method was the IS method, due to the high cement content utilized for the concrete mixture. However the ACI method proved to be the most economical method of proportioning the concrete compared to the other two methods because it met the TMCS for the M15, M20, M25, M30, and M40 grade of concrete at the least cost, despite the fact that the DOE method looked to be a little cheaper for subsequent higher grades of concrete (e.g., M25, M30 and M40). This seemingly marginally lower cost of the DOE method for these grades of concrete was invalidated by the fact that in concrete design; it is expected that the concrete will not only meet the required strength but will also meet and exceed the TMCS. The method must also be cost-effective, maintain safety and, the integrity of the concrete structure(s) in case of any unforeseen circumstances (Shetty, 1982). Having carried out all the tests and analysis enumerated above, it was clear that the ACI method was the most efficient method of proportioning concrete compared to the other two methods. It was easy to design and aportion without the use of admixtures and it met the required TMCS at the least cost. The authors thus, recommend that the ACI proportioning mix desisn method is adopted for proportioning concrete. ACKNOWLEDGMENT
The author
*1 wishes to appreciate his father and
mother (Dr. and Mrs. S.A. Ejiogu) for their continued support and prayers. REFERENCES 1. Abrams, D.A. 1918. Design of Concrete Mixture.
Structural Material Research Laboratory, Lewis Institute: Chicago, IL.
2. ACI. 2002. ACI 211.1-91. Standard practice for selecting proportions for Normal-Heavy weight and mass concrete. ACI: Farmington Hills, MI.
3. ACI. 1998. ACI 211.2-98, Standard Practice for Selecting Proportions for Structural Lightweight Concrete. ACI: Farmington Hills, MI.
4. Afsar, J. 2012. “Effect of Aggregates On Strength Of Concrete,” March 16, 2012. http://www.engineeringintro.com/concrete/concrete-strength/effect-of-aggregates-on-strength-of-concrete/
5. Agius, J. 2013. “HND in Construction UNIT 2 Notes”. http://www.pebblepad.co.uk/personal/viewasset.aspx?oid=113809&type=webfolio&pageoid=176670
6. Ahmed, Z., R. Agarwal, and S. Choudhury. 2012. “Concrete Mix Design: A Deeper Look into IS 10262-1982”. Proc. of Int. Conf. on Structural and Civil Engineering.
7. Alves, M.F., R.A. Cremonini, and D.C.C. Dal
Molin. 2004. “A Comparison of Mix Proportioning Methods for High-Strength Concrete, Cement and Concrete Composites. 26:613–621.
8. ASTM. 2017. ASTM C 150, Standard Specification for Portland Cement. ASTM
International: West Conshohocken, PA.
9. ASTM. 2016. ASTM C 1602/C 1602M-04 - Standard Specification for Mixing Water Used in the Production of Hydraulic Cement Concrete. ASTM International: West Conshohocken, PA
10. ASTM. 2016. ASTM C 33/C33M-16e1, Standard Specification for ConcreteAggregate. ASTM International: West Conshohocken, PA
11. Baskaran, K. and K. Gopinatn. 2013. “Study on Applicability of ACI and DoE Mix Design Methods for Paving Blocks”. Annual Transactions of IESL. The Institution of Engineers: Sri Lanka.
12. Benz, D.P., P. Lura, and J.W. Roberts. 2015. “Mixture Proportioning for Internal Curing”. Concrete International, February 2015.
13. Bhattaacharjee. 2016. “Mix Design of Concrete British (DoE) Method”. Department of Civil Engineering, Delhi, India. http://web.iitd.ac.in/~bishwa/LEC_PDF_774/LEC11.pdf
14. Blogspot. 2011. “Concrete Mixed Design Method (BS Method)”. http://advancedcivilengineering.blogspot.com/2011/10/concrete-mixed-design-method-bs-method.html
15. Darwin, D., S. Barham, R. Kozul, and S. Luan. 2001. “Fracture Energy of High-Strength Concrete”. ACI Materials Journal. 98(5):410-417.
16. Kozul, R. and D. Darwin. 1997. “Effects of Aggregate Type, Size, and Content on Concrete Strength and Fracture Energy”. Structural Engineering and Engineering Materials. SM Report No. 43, University of Kansas Centre for Research: Lawrence, KS.
The Pacific Journal of Science and Technology –36– http://www.akamaiuniversity.us/PJST.htm Volume 19. Number 1. May 2018 (Spring)
17. Mishra, S.P. and C. Jeevendra Kumar. 2012.
“Comparison of IS,BS and ACI Methods of Concrete Mix Design and Proposing Function Based Design”. International Journal of Concrete and Structure (IJCSEIERD). 2(1):20-56.
18. Nataraja, M.C. and L. Das. 2010. “Concrete Mix Proportioning as per IS 10262:2009: Comparison with IS 10262:1982 and ACI 211-91”. The Indian Concrete Journal. September 2010.
19. Price-Arulraj, G. and C.M. Sruthi Rajan. 2013. “A
Comparison between the Old and New Indian Codes for Concrete Design Mixture”. International Journal of Engineering and Sciences (IJES). May 20, 2013. 2:40-49.
20. Shetty, M.S. 1982. Concrete Technology Theory and Practice. S Chand & Co Ltd.: New Delhi, India.
ABOUT THE AUTHORS Engr. Ejiogu, Ibe Kevin, is a Senior Research Officer in the Nigeria Institute of Leather and Science Technology, Zaria. Kaduna State. He holds a Master’s Degree in Polymer Science and Engineering Technology from Federal University of Technology Owerri (FUTO). He is currently undergoing his Ph.D. studies in polymer science and technology in Ahmadu Bello University Zaria (ABU), Kaduna State, Nigeria. Prof. Mamza, A. Paul, lectures in the Department of Chemistry in ABU. He has an M.Sc. and Ph.D. in Polymer Science and Technology. He is the currently the National President and also a Fellow of The Polymer Institute of Nigeria (PIN). His research interests include polymer science and composite technology. Prof. Nkeonye, O. Peter, is an academic Don in the Department of Polymer and Textile Engineering (DPTE), in ABU. He is a fellow in PIN and he is currently on sabbatical in FUTO in DPTE. Prof. Yaro, S. Aliyu, lecturers in the Department of Metallurgical and Materials Engineering in ABU. He is currently the Shell Professorial Chair in the Department of Mechanical Engineering. He has research interests in polymer composites and alloys.
SUGGESTED CITATION Ejiogu, I.K., P.A. Mamza, P.O. Nkeonye, and A.S. Yaro. 2018. “Comparative Study of Various Methods for Designing and Proportioning Normal Concrete Mixture”. Pacific Journal of Science and Technology. 19(1):22-36.
Pacific Journal of Science and Technology