Embed Size (px)
Citation preview

1
Original Papers
Comparative Study of the Electrochemical Sensors Based on Enzyme
Immobilized into Polyelectrolyte Microcapsules and into Chitozan Gel
Yulia V. PLEKHANOVA,*† Sergei A. TIKHONENKO,** Alexey V. DUBROVSKY,**
Alexander L. KIM,**,*** Egor V. MUSIN,**,*** Gou-Jen WANG,**** Iren E.
KUZNETSOVA,***** Vladimir V. KOLESOV,***** and Anatoly N. RESHETILOV*†,*****
* PSCBR RAS G.K. Skryabin Institute of Biochemistry and Physiology of Microorganisms,
Russian Academy of Sciences, Prospect Nauki 5, Pushchino, Moscow Region 142290, Russia
** FSBIS Institute of Theoretical and Experimental Biophysics, Russian Academy of Sciences,
Institutskaya st. 3, Pushchino, Moscow Region 142290, Russia
*** Lomonosov Moscow State University, Leninskie Gory, Moscow 119991, Russia
**** Department of Mechanical Engineering, National Chung-Hsing University, Taichung 402,
Taiwan
***** A. Kotelnikov Institute of Radio Engineering and Electronics, Russian Academy of Sciences,
Mokhovaya st. 11-7, Moscow 125009, Russia
† To whom correspondence should be addressed.
E-mail: [email protected], [email protected]
Analytical SciencesAdvance Publication by J-STAGEReceived April 14, 2019; Accepted May 23, 2019; Published online on May 31, 2019DOI: 10.2116/analsci.19P131

2
Abstract
The characteristics of the electrochemical biosensor based on a Prussian-blue screen-printed
electrode containing glucose oxidase incorporated into polyelectrolyte microcapsules (PMC) are
considered. PMC with the embedded enzyme were formed using sodium polystyrene sulfonate
and poly(allylamine hydrochloride). The characteristics were compared with those of the enzyme
immobilized in chitosan gel. We assessed the dependences of biosensor signals on composition
of the buffer solution, on glucose concentration; the operational and long-term stabilities. The
enzyme immobilized in PMC proved more sensitive to buffer molarity at a maximum within 35–
40 mM. The apparent Michaelis constants were 1.5 and 4.1 mM at the immobilization in,
respectively, chitosan and PMC. The developed biosensors were used to assay commercial juices.
The biosensors’ data on glucose contents were shown to have a high correlation with the standard
spectrophotometric assay (0.92–0.95%), which implies a possible application of the fabricated
biosensors in foodstuff analysis.
Keywords: Electrochemical biosensor, screen-printed electrode, glucose oxidase, polyelectrolyte
microcapsules, chitosan, glucose.
Analytical SciencesAdvance Publication by J-STAGEReceived April 14, 2019; Accepted May 23, 2019; Published online on May 31, 2019DOI: 10.2116/analsci.19P131

3
Introduction
Development of biosensors and biofuel cells is associated with the search for and
development of methods for immobilization of the biocatalyst on the electrode surface, so that
the biocatalyst is active for as long as possible. For this reason, the search for novel biocompatible
materials to create electrodes, the use of new polymers to bind the biocatalyst on the electrode
surface is topical.
Activity of enzymes can be preserved at a high level by encapsulation. The enzymes are
immobilized in capsules from various materials, such as liposomes1, polymers2, sol-gels3,
hydrogels4, etc. The layer-by-layer coating of oppositely charged polyelectrolytes for
immobilization of enzymes5–7 enables their use as microcontainers and microreactors in various
industries, for example, food8, cosmetic9, pharmaceutical10. Earlier, for urease and lactate
dehydrogenase, it has been shown that immobilization of enzymes in polyelectrolyte
microcapsules (PMC) makes it possible to maintain enzyme activity at a high level for several
months and also protects encapsulated enzymes from proteinase K11; encapsulated catalase is
protected by PMC from the action of microorganisms and protease12. Enzymes immobilized in
polyelectrolyte capsules can be used to create biosensors, e.g., for potentiometric assays of urea13–
15 or acetylcholine16, optical (fluorescent) determination of glucose.17
The catalytic properties of glucose oxidase (GOx) have been well investigated. At the same
time, immobilization of the enzyme in polyelectrolyte capsules may change its structure and, as
a consequence, its catalytic activity. In work18 the binding of a number of negatively charged
polyelectrolytes to lactate dehydrogenase and glutamate dehydrogenase has been shown to break
down the tertiary and partially secondary structure of the enzymes and, in this way, to totally
inactivate their activity. In study20, the use of polyelectrolytes of opposite chirality has also led to
change the activity of immobilized horseradish peroxidase and GOx.
Analytical SciencesAdvance Publication by J-STAGEReceived April 14, 2019; Accepted May 23, 2019; Published online on May 31, 2019DOI: 10.2116/analsci.19P131

4
One of the methods to control the catalytic activity of the enzyme in biosensors is the
determination of hydrogen peroxide released during the oxidation of the substrate. An
electrocatalyst of hydrogen peroxide reduction is iron hexacyanoferrate (Prussian blue), which is
used to modify the measurement electrodes.20,21 The possibility of selective determination of
hydrogen peroxide by its reduction reaction in the presence of oxygen on electrodes with iron
hexacyanoferrate at a zero potential and pH close to neutral has been demonstrated in work.22
The aim of this work was to compare the characteristics of the glucose biosensor prepared
using two techniques of immobilization of the enzyme glucose oxidase on the surface of a
Prussian-blue screen-printed electrode – encapsulation of the enzyme in polyelectrolyte layers or
in chitosan gel. Immobilization into chitosan for comparison was chosen because, due to the
attractive properties of chitosan (biocompatibility, biodegradability and ease of use), this
technique is often used to develop biosensors.23,24
Experimental
Reagents
The following reagents were used: dibasic trihydrate potassium phosphate, sodium
hydroxide, sodium chloride, glucose, acetic acid (Diakon, Russia); iron(III) chloride, potassium
chloride, calcium chloride, sodium carbonate (Khimmed, Russia); hydrochloric acid, hydrogen
peroxide (30% solution), sodium carbonate (Reakhim, Russia); chitosan (low molecular weight),
potassium hexacyanoferrate(III), sodium polystyrene sulfonate (PSS, 70 kDa), poly(allylamine
hydrochloride) (PAH, 70 kDa), ethylenediaminetetraacetic acid (EDTA), 4-aminoantipyrine,
phenol, glucose oxidase (EC 1.1.3.4) from Aspergillus niger (activity, 185000 U/g), horseradish
peroxidase (1.11.1.7) (activity, 1 kU/g) (Sigma-Aldrich, USA).
Analytical SciencesAdvance Publication by J-STAGEReceived April 14, 2019; Accepted May 23, 2019; Published online on May 31, 2019DOI: 10.2116/analsci.19P131

5
Formation of a Prussian blue-based chemical sensor
Screen-printed three-contact electrodes (Color Electronics, Moscow, Russia) were used as
working electrodes. Prussian blue was precipitated on the electrode surface from the reaction
mixture containing 0.1 M FeCl3 and 0.1 M K3[Fe(CN)6] in the background electrolyte (0.1 M KCl,
0.1 M HCl). The electrode was activated (a potentiodynamic treatment of the Prussian blue
electrode in a cyclic mode in the background electrolyte within the range of potentials from – 0.05
up to 0.35 V) in accordance with the method described in work.22
Fabrication of polyelectrolyte microcapsules with incorporated glucose oxidase
Formation of composite CaCO3–protein microspherolites. An equal volume of a sodium
carbonate solution (0.33 M) was added to a 0.33-M calcium chloride solution containing 3 mg/ml
GOx and intensively stirred on a magnetic mixer. The mixing was continued for 30 s, after which
the suspension was kept up to the complete sedimentation of formed particles.25 Maturation of
microspherolites was monitored by a light microscope. Then the supernatant was decanted, the
sediment was washed with water and used to produce PMC. The particles formed were 5±1 μm
in size.
Preparation of PMC. Polyelectrolyte microcapsules were produced by alternate adsorption
of oppositely charged polyelectrolytes on disperse microparticles (nuclei) followed by the
dissolution of the nuclei. Alternate adsorption of PAH and PSS on the surfaces of CaCO3
microspherolites was carried out in polyelectrolyte solutions (2 mg/ml) containing 0.5-M NaCl.
Each adsorption step was followed by a triple washing of fabricated capsules with a 0.5-M NaCl
solution, which was required to discard non-adsorbed polymer molecules. Particles were
separated from the supernatant by centrifugation. After a required number of layers was deposited,
carbonate nuclei were dissolved in a 0.2-M solution of EDTA for 12 h. Produced capsules were
washed three times with water to remove nuclei’ decomposition products. Capsules contained 6
Analytical SciencesAdvance Publication by J-STAGEReceived April 14, 2019; Accepted May 23, 2019; Published online on May 31, 2019DOI: 10.2116/analsci.19P131

6
polyelectrolyte layers. The concentration of protein in a capsule was 0.66 ng/capsule. The
suspension of capsules at a concentration of 3×10⁹ particles/ml was stored in bidistilled water at
a temperature of 4С. Formation of polyelectrolyte capsules around the enzyme is shown
schematically in Fig. 1.
Formation of the glucose biosensors
1) Polyelectrolyte capsules in the amount of 5 μl with incorporated GOx were applied onto
the surface of a Prussian blue working electrode and dried at room temperature for 30 min. The
enzyme concentration on the electrode surface was 139 μg/cm2.
2) A mixture of GOx (6 mg/ml) and chitosan (2% solution in 1% acetic acid26) at a volume
ratio of 1:1 was prepared; 5 μl of the mixture was applied onto the surface of a Prussian blue
working electrode and air-dried for 30 min at room temperature. The concentration of the enzyme
on the electrode surface was 211 μg/cm2.
Between measurements, the biosensors were stored at a temperature of 4ºС in the dark. The
measurements were carried out at a temperature of 20ºС in a 1-ml cuvette at constant stirring in a
sodium–potassium–phosphate buffer solution. The molarity, pH, content of sodium chloride in
the buffer were varied. The measurements were performed on an EmStat 3 potentiostat (PalmSens,
Netherlands) at a constant zero potential fed to the working electrode relative to the reference
electrode (Ag/AgCl). The measured parameter was the amplitude of the signal; it was assessed
by the difference between the initial and final levels before and after the introduction of glucose.
As real samples to determine the concentration of glucose, we used beverages diluted
tenfold with a buffer solution to a concentration required for the assay: 1) Global Village
reconstituted clarified apple juice, Yuzhnaya Sokovaya Kompaniya, Russia; 2) Fruto-Nyanya
reconstituted clarified apple juice, Progress Ltd, Russia; 3) Fruktovyi Sad orange pulp nectar,
Lebedyansky Ltd, Russia; 4) Fruktovyi Sad multifruit pulp nectar, Lebedyansky Ltd, Russia; 5)
Analytical SciencesAdvance Publication by J-STAGEReceived April 14, 2019; Accepted May 23, 2019; Published online on May 31, 2019DOI: 10.2116/analsci.19P131
7
Home-made wine, 2-year-aged, Izabella grape; 6) Aloe-Fresh non-alcoholic non-carbonated
pasteurized beverage, Velta-Penza Ltd, Russia; 7) El Kurador Sangria sugary wine drink, Hauser
Weinimport GmbH, Germany.
Spectrophotometric assay of glucose
The assay is based on the photometric determination of a compound coloured during the
oxidation of chromogenic substrates.27 Oxidation of glucose by air oxygen in the presence of
glucose oxidase produces hydrogen peroxide. Hydrogen peroxide oxidizes the chromogenic
substrate (4-aminoantipyrine) in the presence of phenol and peroxidase (catalyst) to produce a
coloured compound, quinoneimine. The coloration intensity of this compound is directly
proportional to the concentration of glucose in the sample. Measurements were carried out using
a Specord m40 spectrophotometer at a wavelength of 500 nm.
Results and Discussion
Dependence of biosensor signals on buffer solution
The optimal pH for glucose oxidase to function is pH 5.6.28 The maximal amplitudes of
biosensor responses during the immobilization of the enzyme in chitosan gel were observed
within the range of pH 6.0–7.0; during the immobilization in PMC, pH 5.5–6.0 (Fig. 2 (A)). An
insignificant shift of the optimum to the alkaline region and a broadening of the optimal pH range
is, most probably, due to conditions created by the immobilization of the enzyme.
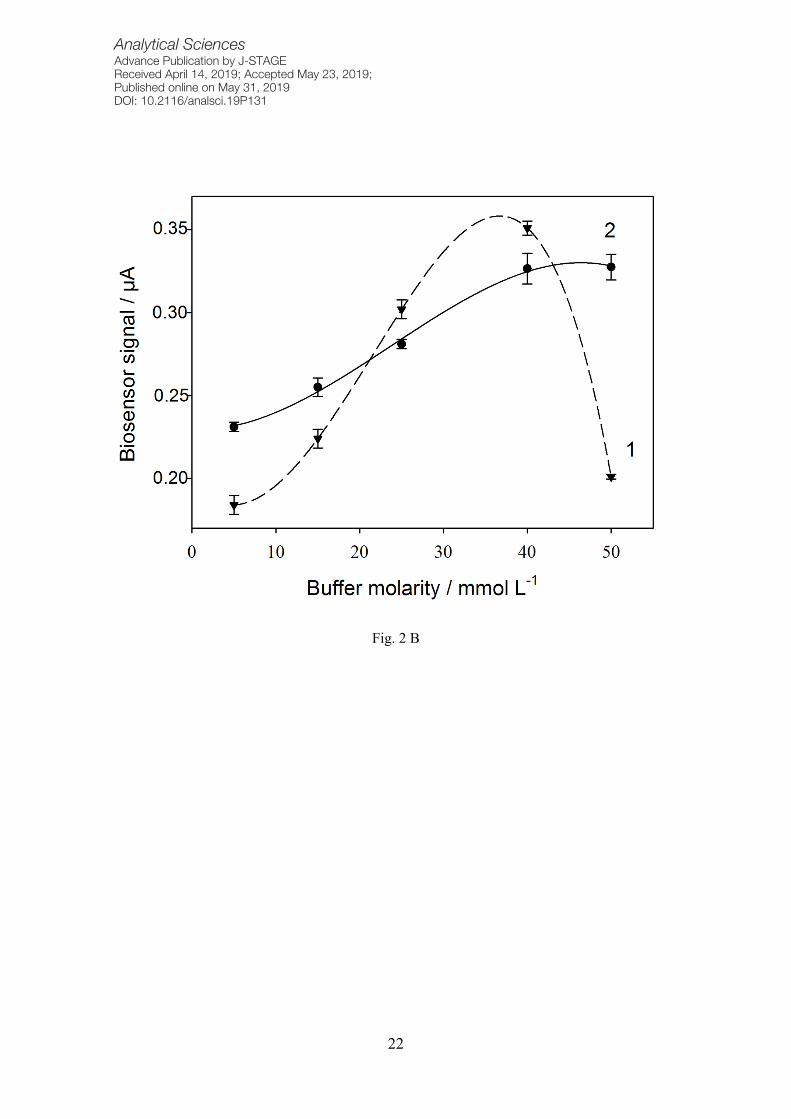
The catalytic activity of the immobilized enzyme was also affected by the molarity of the
buffer solution (Fig. 2 (B)). Within the investigated range of its changes for the enzyme
immobilized in chitosan, biosensor signals are seen to grow monotonically; the signal amplitudes
reach the greatest values at 40–50 mM of the buffer solution. At the same time, for the
Analytical SciencesAdvance Publication by J-STAGEReceived April 14, 2019; Accepted May 23, 2019; Published online on May 31, 2019DOI: 10.2116/analsci.19P131

8
encapsulated enzyme the amplitude depends on the value of molarity in a bell-shaped way; the
maximum in this case is observed at a buffer solution concentration of 30–40 mM.
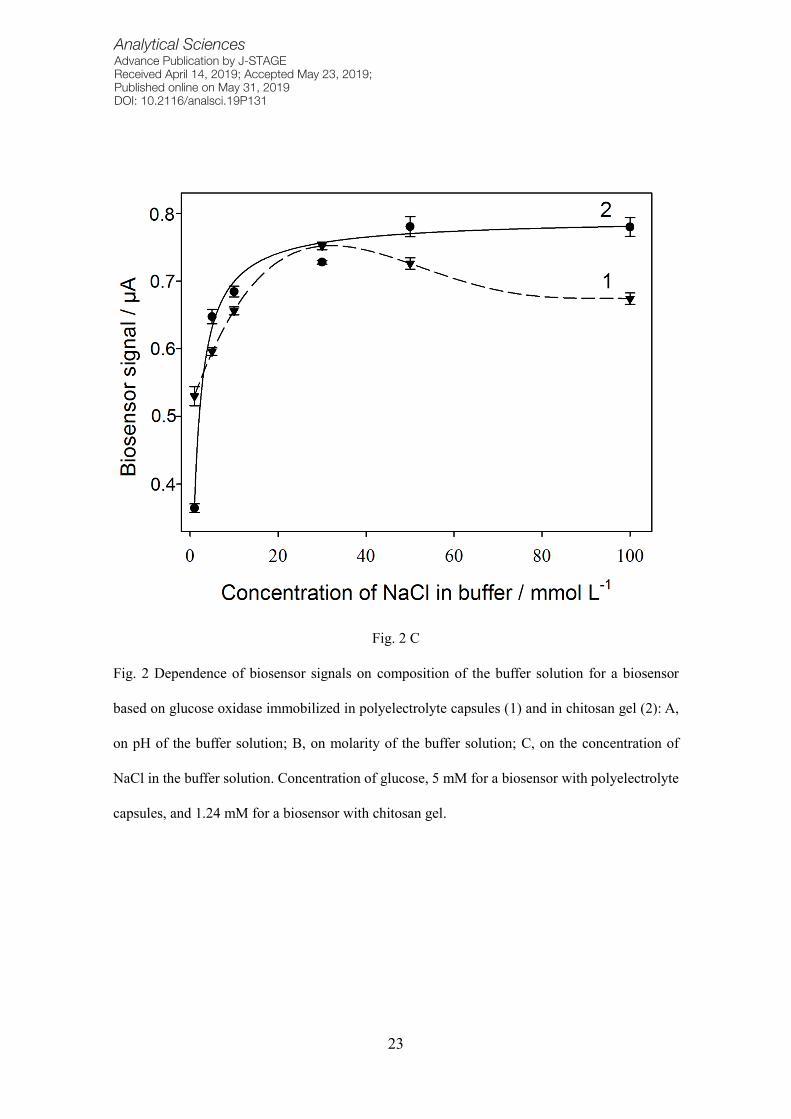
A high ionic strength of a solution (greater than 100 mM) affects negatively the stability of
polyelectrolyte complexes29 but increases its conductance by facilitating the transfer of protons
onto the electrode. This is reflected on the generation of biosensor and biofuel cell signals30;
addition of sodium chloride leads to decrease the internal resistance of the system and to increase
power.31 Figure 2 (C) plots dependences of biosensor signals on NaCl concentrations in the buffer.
An increase of NaCl concentration increases the signal, whereas for the encapsulated enzyme at
a NaCl concentration of 25 mM and higher the signal decreases. The observed dependence can
be partially explained by the data of Fig. 2 (B): at a buffer solution molarity rise the dependence
of the signal amplitude passes through a maximum; as the concentration of sodium chloride is
increased, we observe in fact a non-monotonic dependence, which also passes through a
maximum. Thus, it can be summed up that high concentrations of sodium chloride (greater than
80 mM) have a negative effect on the activity of the enzyme, which leads to decrease biosensor
signals; an increase of the concentration beyond 30 mM has a negative effect on the activity of
the enzyme in the capsule. As seen from the comparison of Figs 2 (B) and 2 (C), potassium ions
render a more negative effect (the buffer molarity increases due to both potassium and sodium
ions), whereas an increase in the concentration of sodium ions (Fig. 2 (C)) beyond the level of 30
mM leads to a drop in the level of biosensor signals by ~10% (and in the case of a joint increase
of the concentrations of potassium ions and sodium ions beyond the level of 30 mM the drop is
~44%).
Calibration dependences of biosensor signals on glucose concentration
Dependences of biosensor signals on glucose concentration are plotted in Fig. 3. Major
characteristics of the investigated biosensors are given in Table 1. The ranges of glucose
Analytical SciencesAdvance Publication by J-STAGEReceived April 14, 2019; Accepted May 23, 2019; Published online on May 31, 2019DOI: 10.2116/analsci.19P131

9
determination using the encapsulated enzyme differ from those for the enzyme immobilized in
chitosan gel. Thus, the lower and upper detection limits are higher, and the linear range is broader,
in the case of the encapsulated enzyme. The sensitivity coefficient, however, is higher when using
chitosan for immobilization (1.17 vs 0.12 μA/mM). Works6,32 have shown that the layer-by-layer
application of oppositely charged polyelectrolytes does not prevent the penetration of low-
molecular compounds into the interior of the capsule. Glucose is a low-molecular compound, so
the change of enzyme activity can be due only to immobilization. As is known, the Michaelis
constant shows the extent of affinity of substrate and enzyme33: the lower the value of the constant,
the higher the affinity of the enzyme to substrate is. Thus, immobilization of the enzyme in PMC
leads to decrease the affinity of the enzyme to substrate (Table 1).
The reproducibility of the results of measurements by biosensors was assessed based on
the statistical treatment of a sampling of 15 measurements for a glucose concentration of 1
mM. The variation coefficient for the biosensor with the encapsulated enzyme was 4.5%;
the mean value of the signal and the standard deviation were 151.31 ± 6.88 nA. For a
biosensor with GOx immobilized in a chitosan gel, the variation coefficient was 4.6%; the
mean value of the signal and the standard deviation 587.37 ± 27.08 nA.
Assessment of long-term stability
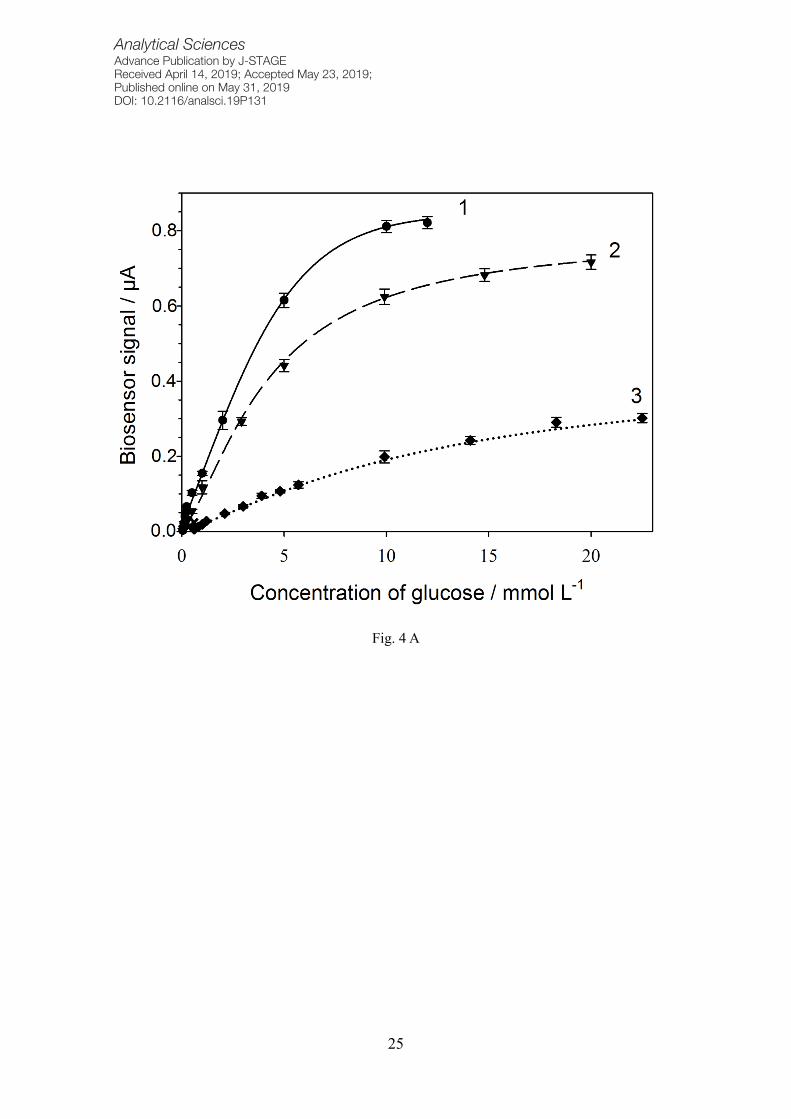
For GOx incorporated into polyelectrolyte capsules, the signal was ~75% of the initial level
after 5 months of storage of the biosensor between measurements at 4С; after 8 months, 20%
(Fig. 4 (A)). For GOx immobilized in chitosan gel, the biosensor signal was 43% of the initial
level after 2 months; 13%, after 1 year (Fig. 4 (B)). Table 2 shows changes in the major parameters
of the biosensors in storage.
For capsules with the enzyme stored in bidistilled water at 4С for 11 months followed by
their immobilization on the electrode the biosensor signal was about 50% of the initial level (data
Analytical SciencesAdvance Publication by J-STAGEReceived April 14, 2019; Accepted May 23, 2019; Published online on May 31, 2019DOI: 10.2116/analsci.19P131

10
not shown). Therefore, the activity of the enzyme decreases slower for capsules with the enzyme
stored in solution than those immobilized on the electrode, the biosensor being stored dry at 4С.
Thus, encapsulation contributes to preserving the activity of the enzyme, including as a biosensor
component, at a sufficiently high level for a long time, which is consistent with data for other
enzymes, e.g., for urease.11,15
Both methods of immobilizing GOx on the surface of a screen-printed electrode may find
use in the development of biosensors. The simplicity of immobilizing the enzyme in chitosan gel
and small time required to form a biosensor enable speeding up and simplifying the assay based
on this immobilization technique; at the same time, immobilization in polyelectrolyte capsules
makes it possible to increase the lifetime of the biosensor and to maintain the activity of the
enzyme on the initial level.
Effects of real-sample components on biosensor signals
When assaying real samples, it is required to take into account the effects of their major
components. Thus, biosensor signals in glucose assays of wine beverages can be affected by
ethanol contents. We investigated biosensor signals for the introduction of glucose in buffers with
ethanol contents within the range of 0.1–2.0 M. At the introduction of glucose at a concentration
of 1.0 and 5.0 mM, the signal of the biosensor did not change; the variation coefficient did not
exceed 5%. Thus, the content of ethanol in a sample within the concentration range of 0.1–2.0 M
(0.5–9.2%) shall not affect the biosensor signal or introduce additional measuring error. Therefore,
the developed biosensor can be used to measure glucose contents in products that contain alcohol
up to 9.2%.
The content of acid in juices should not exceed 3 g/l; in nectars, 5 g/l. We investigated the
effect of citric acid within the concentration range of 0.06–0.9 mM on biosensor signals during
the introduction of glucose at a concentration of 5 mM. The occurrence of citric acid did not
Analytical SciencesAdvance Publication by J-STAGEReceived April 14, 2019; Accepted May 23, 2019; Published online on May 31, 2019DOI: 10.2116/analsci.19P131

11
change the biosensor signal; therefore, its presence in samples up to a concentration of 31 mM (6
g/l) shall not affect the glucose assay.
Use of the biosensors for assays of glucose in beverages
Monitoring of the level of sugar in foodstuffs is a necessary procedure for assessing the
quality of product. The sugar contained in juices consists mainly of glucose, fructose and sucrose.
Glucose increases the sugar level in the blood and stimulates the secretion of insulin faster than
other sugars.34 Therefore, its content in foodstuffs is an important parameter, especially for
diabetic patients. The developed biosensors were tested on real samples of juice and alcoholic
beverages (Table 3). The results of measurements were compared with the data of the standard
glucose assay of samples by spectrophotometry. The correlation coefficient of the data between
measurements made by the biosensor with GOx immobilized in chitosan gel and by the standard
technique is 0.95. The correlation coefficient of the data between measurements made by the
biosensor with GOx immobilized in polyelectrolyte capsules and by the standard method is 0.92.
The correlation coefficient of the data between measurements made by two types of biosensors is
0.88. The correlation data are shown in Fig. 5. Thus, the developed biosensor is capable of
determining the glucose content in complex matrices comprising both other sugars and
compounds of other classes, which is indicative of the specificity of the biosensor.
Conclusions
Thus, we showed that the activity of the enzyme in capsules depended on the molarity and
sodium chloride concentration in the buffer solution; the presence of potassium ions had a greater
effect on the decrease of the signal than sodium ions. The sensitivity coefficient of the biosensor
based on GOx immobilized in chitosan gel was by an order of magnitude higher than that of the
Analytical SciencesAdvance Publication by J-STAGEReceived April 14, 2019; Accepted May 23, 2019; Published online on May 31, 2019DOI: 10.2116/analsci.19P131

12
biosensor based on GOx immobilized in polyelectrolyte capsules (1.17 and 0.12 μA/mM,
respectively). However, the linear range of glucose determination for the biosensor based on PMC
is broader (0.10–5.50 mM and 0.05–0.60 mM, respectively). In work35, its authors used quartz
sensors also to study GOx-containing polyelectrolyte capsules. Application of natural
polyelectrolytes, alginate and chitosan, led to swelling of films and, correspondingly, to a change
of the reaction to glucose, as it can be incorporated into produced polyelectrolyte complexes.
They showed that, by varying the film crosslinking time, pH, extent of alginate acetylation, the
sensitivity of capsules to glucose can be controlled. We showed that the use of PMC based on
sodium polystyrene sulfonate and poly(allylamine hydrochloride) to immobilize the enzyme
enables increasing the lifetime of the biosensor for at least up to half a year (the apparent
Michaelis constant of 4.1 mM did not practically change over 5 months of storage). We have
shown earlier36 that a modification of polyelectrolyte capsules with the enzyme by carbon
nanotubes enables increasing the biosensor signal, sensitivity, glucose-detection lower limit. At
the same time, many studies point to a toxicity of nanomaterials.37,38 In the present work, we
increase the amount of capsules on the biosensor surface from 17.5✕104 (used in work36) up to
15✕106 and, thus, succeed in changing biosensor’s main parameters, sensitivity (which changes
from 0.05 μА/mM up to 0.12 μА/mM) and detection range (which changes from 1.0–25.0 mM to
0.1–10.0 мМ), as well as in decreasing the glucose detection limit (from 1.0 mM down to 0.1
mM) without using nanotubes. Although the sensitivity of the biosensor with nanotubes is still
higher (0.30 μA/mM) and the glucose detection lower limit is lower (0.05 mM), the biosensors
presented in this work can find practical application. The biosensors we developed were used to
assay glucose in real samples of juice; the obtained data were shown to have a high correlation
with the data by the standard spectrophotometric glucose assay. Strong retention of
polyelectrolyte capsules with the enzyme on the surface of a graphite electrode enables producing
a multiple use biosensor, which makes it economically viable and competitive with other glucose
Analytical SciencesAdvance Publication by J-STAGEReceived April 14, 2019; Accepted May 23, 2019; Published online on May 31, 2019DOI: 10.2116/analsci.19P131

13
assay techniques.
Acknowledgements
The authors acknowledge Victor Selivanov for providing language help.
The work was supported by a Russian Science Foundation grant No 18-49-08005.
References
1. J.M. Rodriguez-Nogales, and A. Delgadillo, J. Mol. Catalysis B: Enzym., 2005,
33(1–2), 15.
2. A. Ramanavicius, A. Kausaite, and A. Ramanavicien, Sens. Actuators B, 2005,
111–112, 532.
3. A.C. Pierre, J. Biocatal. Biotransform., 2004, 22(3), 145.
4. X. Zhu, Y. Ma, C. Zhao, Z. Lin, L. Zhang, R. Chen, and W. Yang, Langmuir,
2014, 30(50), 15229.
5. M.J. McShane, Methods Mol. Biol., 2011, 679, 147.
6. K. Etsuo, Bioseparation, 1998, 7, 241.
7. S. Yabuki, Anal. Sci., 2011, 27, 695.
8. M.Â. Cerqueira, A.C. Pinheiro, O.L. Ramos, H. Silva, A.I. Bourbon, and A.A.
Vicente, in “Micro and Nano Technologies, Emerging Nanotechnologies in Food
Science”, ed. R. Busquets, 2017, Elsevier, 11.
9. A. Munin and F. Edwards-Lévy, Pharmaceutics, 2011, 3(4), 793.
10. A. Larrañaga, M. Lomora, J.R. Sarasua, C.G. Palivan, and A. Pandit, Progr. Mat.
Sci., 2017, 90, 325.
Analytical SciencesAdvance Publication by J-STAGEReceived April 14, 2019; Accepted May 23, 2019; Published online on May 31, 2019DOI: 10.2116/analsci.19P131

14
11. B.I. Sukhorukov, S.A. Tikhonenko, E.A. Saburova, A.V. Dubrovsky, Yu.N.
Dybovskaya, and L.I. Shabarchina, Biophysics, 2007, 52(6), 575.
12. F. Caruso, D. Trau, H. Mohwald, and R. Renneberg, Langmuir, 2000, 16(4), 1485.
13. V.I. Ternovsky, Yu.V. Chernokhvostov, M.G. Fomkina, and M.M. Montrel,
Biofizika, 2007, 52(5), 825.
14. M.M. Montrel, A.I. Petrov, V.I. Ternovsky, and M.G. Fomkina, RF Patent, 2008,
2333231.
15. A.N. Reshetilov, Yu.V. Plekhanova, S.A. Tikhonenko, and A.V. Dubrovskii, J.
Anal. Chem., 2015, 70(11), 1368.
16. L.O. Yagodina, and Yu.V. Chernokhvostov, Vestn. Kazan Technological
University, 2013, 16(1), 117.
17. L.I. Kazakova, N.P. Sirota, T.V. Sirota, and L.I. Shabarchina, Rus. J. Phys. Chem.
A, 2017, 91(9), 1828.
18. E.A. Saburova, B.I. Sukhorukov, M.E. Bobreshova, and L.I. Elphimova,
Biochemistry (Moscow), 2000, 65(8), 976.
19. C. Ding, H. Sun, J. Ren, and X. Qu, Analyt. Chim. Acta, 2017, 952, 88.
20. P.A. Fiorito, C.M.A. Brett, and S.I.C. de Torresi, Talanta, 2006, 69, 403.
21. J. Li, J.D. Qiu, J.J. Xu, H.Y. Chen, and X.H. Xia, Adv. Functional Mat., 2007, 17,
1574.
22. A.A. Karyakin, O.V. Gitelmacher, and E.E. Karyakina, Anal. Lett., 1994, 27(15),
2861.
23. A. Baranwal, A. Kumar, A. Priyadharshini, G.S. Oggu, I. Bhatnagar, A.
Srivastava, and P. Chandra, Int. J. Biol. Macromol., 2018, 110, 110.
24. M. Hasanzadeh, N. Shadjou, and M. de la Guardia, Trends Anal. Chem., 2018,
102, 210.
Analytical SciencesAdvance Publication by J-STAGEReceived April 14, 2019; Accepted May 23, 2019; Published online on May 31, 2019DOI: 10.2116/analsci.19P131
15
25. A.I. Petrov, D.V. Volodkin, and G.B. Sukhorukov, Biotechnol. Prog., 2005,
21(3), 918.
26. X. Wang, H. Gu, F. Yin, and Y. Tu, Biosens. Bioelectronics, 2009, 24(5), 1527.
27. D. Barham, and P. Trinder, Analyst, 1972, 97, 142.
28. A.P. Nechayev, S.E. Traubenberg, and A.A. Kochetkova, “Food Chemistry”, 4th
edn, 2007, GIORD Publishers, St.-Petersburg, RF, 640.
29. S.A. Tikhonenko, E.A. Saburova, E.N. Durdenko, and B.I. Sukhorukov, Russian
J. Phys. Chem. A, 2009, 83(10), 1781.
30. J.-Y. Nam, H.-W. Kim, K.-H. Lim, H.-S. Shin, and B.E. Logan, Biosens.
Bioelectronics, 2010, 25, 1155.
31. O. Lefebvre, Z. Tan, S. Kharkwal, and H.Y. Ng, Bioresource Technol., 2012, 112,
336.
32. M.J. McShane, Methods Mol. Biol., 2011, 679, 147.
33. A. Fersht, “Enzyme Structure and Mechanism”, Reading, San Francisco, 1977,
371.
34. B.M. Lee and T.M.S. Wolever, Eur. J. Clin. Nutrition, 1998, 52, 924.
35. S. Belbekhouche, S. Charaabi, L. Picton, D. Le Cerf, and B. Carbonnier,
Carbohydrate Polym., 2018, 184, 144.
36. A. Reshetilov, Y. Plekhanova, S. Tarasov, S. Tikhonenko, A. Dubrovsky, A. Kim, V.
Kashin, A. Machulin, G.-J. Wang, V. Kolesov and I. Kuznetsova, Membranes, 2019, 9,
53, doi:10.3390/membranes9040053
37. R. Madannejad, N. Shoaie, F. Jahanpeyma, M.H. Darvishi, M. Azimzadeh and H. Javadi,
Chemico-Biological Interactions, 2019, doi: https://doi.org/10.1016/j.cbi.2019.04.036
38. L. Yang, X.-B. Luo and S.-L. Luo, “Assessment on Toxicity of Nanomaterials”, ed. X.
Luo and F. Deng, 2019, Chap. 9, Elsevier Inc., 273.
Analytical SciencesAdvance Publication by J-STAGEReceived April 14, 2019; Accepted May 23, 2019; Published online on May 31, 2019DOI: 10.2116/analsci.19P131

16
Table 1 Characteristics of the fabricated glucose biosensors
Parameter In polyelectrolyte capsules In chitosan gel Values of parameters of the calibration
dependence Vmax = 1.069;
h = 1.223; KM = 4.071
Vmax = 1.398; h = 1.176; KM = 1.517
Linear detection range, mM 0.10–5.50 0.05–0.60 Regression equation for the linear
segment y = 0.1184x + 0.0456 y = 1.1749x – 0.0032
Sensitivity coefficient, μA/mM 0.12 1.17 Minimum detection limit, mM 0.10 0.05 Detection range, mM 0.10–10.00 0.05–5.00
An equation describing the calibration dependences: . Correlation coefficient for
calibration dependences and for regression equation for the linear segment of R2 is 0.99.
max
h
h h
M
V SV
K S=
+
Analytical SciencesAdvance Publication by J-STAGEReceived April 14, 2019; Accepted May 23, 2019; Published online on May 31, 2019DOI: 10.2116/analsci.19P131

17
Table 2 Changes in major parameters of the calibration curve in storage of the enzyme biosensor
Parameter Immobilization in polyelectrolyte capsules Immobilization in chitosan gel
Day 1 After 5
months After 8
months Day 1 After 2 months
Vmax, μА 1.069 0.775 0.445 1.398 0.491 KM, мМ 4.071 4.142 12.641 1.517 1.166 Enzyme activity, % 100 75 20 100 43 Minimum detection
limit, mM 0.10 0.16 0.80 0.05 0.10
Detection range,
mM 0.10–10.00 0.16–15.00 0.80–18.00 0.05–5.00 0.10–4.00
Analytical SciencesAdvance Publication by J-STAGEReceived April 14, 2019; Accepted May 23, 2019; Published online on May 31, 2019DOI: 10.2116/analsci.19P131

18
Table 3 Results of measurements of real samples
Technique Immobilization in
polyelectrolyte capsules Immobilization in chitosan
gel Spectrophotometry, λ = 500 nm
Sample Biosensor
readings,
a SD, mM
Measure-
ment
error, %
Biosensor
readings,
a SD, mM
Measure-
ment
error, %
Standard method
readings,
a SD, mM
Measure-
ment error,
%
1 129.00±1.87 1.5 142.18±0.35 0.2 136.95±2.56 1.9 2 136.24±5.10 3.7 167.43±6.67 4.0 147.51±5.83 4.0 3 156.04±6.10 3.9 192.41±3.00 1.6 149.46±6.43 4.3 4 180.01±1.44 0.8 171.00±4.52 2.6 159.88±11.00 6.9 5 204.20±11.33 5.5 198.67±3.44 1.7 178.38±1.03 0.6 6 37.20±1.96 5.3 24.22±0.94 3.9 28.82±2.05 7.1 7 306.94±15.62 5.1 216.16±8.45 4.0 192.25±12.4 6.5
a, The mean value of measurements performed in 3–5 repeats; SD, standard deviation. Samples
are described in Experimental.
Analytical SciencesAdvance Publication by J-STAGEReceived April 14, 2019; Accepted May 23, 2019; Published online on May 31, 2019DOI: 10.2116/analsci.19P131

19
Figure Captions
Fig. 1 Scheme of fabricating polyelectrolyte microcapsules with the enzyme.
Fig. 2 Dependence of biosensor signals on composition of the buffer solution for a biosensor
based on glucose oxidase immobilized in polyelectrolyte capsules (1) and in chitosan gel (2): A,
on pH of the buffer solution; B, on molarity of the buffer solution; C, on the concentration of
NaCl in the buffer solution. Concentration of glucose, 5 mM for a biosensor with polyelectrolyte
capsules, and 1.24 mM for a biosensor with chitosan gel.
Fig. 3 Dependence of biosensor signals on the concentration of glucose for a biosensor based
on glucose oxidase immobilized in polyelectrolyte capsules (1) and in chitosan gel (2). Inset, the
initial linear-range segments of the concentration dependences.
Fig. 4 Long-term stability of the glucose biosensors: A, glucose oxidase immobilized in
polyelectrolyte capsules (1, The first 24 h of biosensor formation; 2, in 5 months; 3, in 8 months);
B, glucose oxidase immobilized in chitosan gel (1, The first 24 h of biosensor formation; 2, in 2
months; 3, in 12 months).
Fig. 5 Graphical correlation of data produced by various glucose assays of real samples: A,
spectrophotometric assay, glucose oxidase immobilized in chitosan gel; B, spectrophotometric
and biosensor assays, glucose oxidase immobilized in polyelectrolyte microcapsules; C, two types
of biosensors.
Analytical SciencesAdvance Publication by J-STAGEReceived April 14, 2019; Accepted May 23, 2019; Published online on May 31, 2019DOI: 10.2116/analsci.19P131

20
Fig. 1 Scheme of fabricating polyelectrolyte microcapsules with the enzyme.
Analytical SciencesAdvance Publication by J-STAGEReceived April 14, 2019; Accepted May 23, 2019; Published online on May 31, 2019DOI: 10.2116/analsci.19P131

21
Fig. 2 A
Analytical SciencesAdvance Publication by J-STAGEReceived April 14, 2019; Accepted May 23, 2019; Published online on May 31, 2019DOI: 10.2116/analsci.19P131
22
Fig. 2 B
Analytical SciencesAdvance Publication by J-STAGEReceived April 14, 2019; Accepted May 23, 2019; Published online on May 31, 2019DOI: 10.2116/analsci.19P131
23
Fig. 2 C
Fig. 2 Dependence of biosensor signals on composition of the buffer solution for a biosensor
based on glucose oxidase immobilized in polyelectrolyte capsules (1) and in chitosan gel (2): A,
on pH of the buffer solution; B, on molarity of the buffer solution; C, on the concentration of
NaCl in the buffer solution. Concentration of glucose, 5 mM for a biosensor with polyelectrolyte
capsules, and 1.24 mM for a biosensor with chitosan gel.
Analytical SciencesAdvance Publication by J-STAGEReceived April 14, 2019; Accepted May 23, 2019; Published online on May 31, 2019DOI: 10.2116/analsci.19P131

24
Fig. 3 Dependence of biosensor signals on the concentration of glucose for a biosensor based on
glucose oxidase immobilized in polyelectrolyte capsules (1) and in chitosan gel (2). Inset, the
initial linear-range segments of the concentration dependences.
Analytical SciencesAdvance Publication by J-STAGEReceived April 14, 2019; Accepted May 23, 2019; Published online on May 31, 2019DOI: 10.2116/analsci.19P131
25
Fig. 4 A
Analytical SciencesAdvance Publication by J-STAGEReceived April 14, 2019; Accepted May 23, 2019; Published online on May 31, 2019DOI: 10.2116/analsci.19P131

26
Fig. 4 B
Fig. 4 Long-term stability of the glucose biosensors: A, glucose oxidase immobilized in
polyelectrolyte capsules (1, The first 24 h of biosensor formation; 2, in 5 months; 3, in 8 months);
B, glucose oxidase immobilized in chitosan gel (1, The first 24 h of biosensor formation; 2, in 2
months; 3, in 12 months).
Analytical SciencesAdvance Publication by J-STAGEReceived April 14, 2019; Accepted May 23, 2019; Published online on May 31, 2019DOI: 10.2116/analsci.19P131

27
Fig. 5 A
Analytical SciencesAdvance Publication by J-STAGEReceived April 14, 2019; Accepted May 23, 2019; Published online on May 31, 2019DOI: 10.2116/analsci.19P131

28
Fig. 5 B
Analytical SciencesAdvance Publication by J-STAGEReceived April 14, 2019; Accepted May 23, 2019; Published online on May 31, 2019DOI: 10.2116/analsci.19P131

29
Fig. 5 C
Fig. 5 Graphical correlation of data produced by various glucose assays of real samples: A,
spectrophotometric assay, glucose oxidase immobilized in chitosan gel; B, spectrophotometric
and biosensor assays, glucose oxidase immobilized in polyelectrolyte capsules; C, two types of
biosensors.
Analytical SciencesAdvance Publication by J-STAGEReceived April 14, 2019; Accepted May 23, 2019; Published online on May 31, 2019DOI: 10.2116/analsci.19P131

30
Graphical Index
Analytical SciencesAdvance Publication by J-STAGEReceived April 14, 2019; Accepted May 23, 2019; Published online on May 31, 2019DOI: 10.2116/analsci.19P131