Embed Size (px)
Citation preview

Comparative Study of Data Reported tothe OECD Creditor Reporting System (CRS)and to the Aid Management Platform (AMP)
Rudolphe PetrasOctober 2009

Comparative Study of Data Reported to the OECD Creditor Reporting System (CRS)
and to the Aid Management Platform (AMP)
Rudolphe Petras
October 2009

COMPARATIVE STUDY OF DATA REPORTED TO THE CRS AND THE AMP - © DEVELOPMENT GATEWAY 2009
DEVELOPMENT GATEWAY
Development Gateway is an international nonprofit organization dedicated to enabling change in developing nations through information technology. It envisions a world in which the digital revolution serves people everywhere—creating opportunities through increased access to critical information; greater reliance on local capabilities; and more effective, better coordinated international aid.
ORGANISATION FOR ECONOMIC CO-OPERATION AND DEVELOPMENT
The OECD is a unique forum where the governments of 30 democracies work together to address the economic, social and environmental challenges of globalisation. The OECD is also at the forefront of efforts to understand and to help governments respond to new developments and concerns, such as corporate governance, the information economy and the challenges of an ageing population. The Organisation provides a setting where governments can compare policy experiences, seek answers to common problems, identify good practice and work to co-ordinate domestic and international policies. The OECD member countries are: Australia, Austria, Belgium, Canada, the Czech Republic, Denmark, Finland, France, Germany, Greece, Hungary, Iceland, Ireland, Italy, Japan, Korea, Luxembourg, Mexico, the Netherlands, New Zealand, Norway, Poland, Portugal, the Slovak Republic, Spain, Sweden, Switzerland, Turkey, the United Kingdom and the United States. The Commission of the European Communities takes part in the work of the OECD.
The opinions expressed and arguments employed herein do not necessarily reflect the official views of the Organisation for Economic Co-operation and Development or of the governments of its member countries, or those of the Development Gateway or its Board of Directors and partners.
Also available in French under the title:
Étude comparative des données notifiées au Système de Notification des Pays Créanciers (SNPC) de l’OCDE et à la Plateforme de Gestion de l’Aide (PGA)
2

COMPARATIVE STUDY OF DATA REPORTED TO THE CRS AND THE AMP - © DEVELOPMENT GATEWAY 2009
_____________________________________ Foreword This paper analyses the differences in Official Development Assistance (ODA) data recorded in the OECD’s Creditor Reporting System (CRS) versus aid data captured at the country level in Burkina Faso and Malawi. The CRS contains ODA statistics reported by the members of the OECD’s Development Assistance Committee (DAC) and some multilateral organisations. It has been tracking this information since 1967, making it the most comprehensive global database on development assistance. It is the authoritative source of information for statistical analysis of international aid flows and cross-country comparisons due to its rigorous data validation procedures and historical coverage. More recently, a large number of developing countries—including Burkina Faso and Malawi—have implemented national aid information management systems in order to collect and use aid data at the local level. These systems are intended to support governments in monitoring aid flows, preparing annual budgets, improving aid coordination, and other objectives. The analysis reveals that overall aid flows captured in the CRS relative to country systems are of the same order of magnitude, and have a comparable breakdown on key characteristics (aid by donor and sector). However, compared to the CRS, the two country systems examined contain more up-to-date information, which is critical for government budgeting and planning. They also categorize some information in different ways to comply with government reporting requirements, such as using a national sector classification scheme that corresponds to budget categories, and following the government fiscal year rather than the calendar year. Information is more detailed at the project and transaction level, including details on the project implementing agency and disbursement dates, and more precise exchange rates than are used in the CRS. In short, the analysis suggests that the CRS and local aid information management systems have distinct and important roles, and that understanding the purpose and limitations of each is key for users of aid information. _____________________________________
The author thanks Brian Hammond, Aasmund Andersen, Ranil Dassanayake, Stephen Davenport, Guillaume Delalande and Emily Kallaur (Development Gateway), Yasmin Ahmad, Fredrik Ericsson, Valérie Gaveau, Simon Scott and Suzanne Steensen (OECD), Amadou Diallo (Ministry of Economics and Finance of Burkina Faso), and Stan Nkhata (Ministry of Finance of Malawi) for their input and comments, and Djamila Kerim and Anna Diouf (Development Gateway) for the translation into French.
3

COMPARATIVE STUDY OF DATA REPORTED TO THE CRS AND THE AMP - © DEVELOPMENT GATEWAY 2009
Table of Contents
I. INTRODUCTION ........................................................................ ……….. 6
II. BACKGROUND, INSTITUTIONALIZATION AND DATA COLLECTION 8
III. METHODOLOGY AND DEFINITIONS .............................................. 10
Accuracy of information ................................................................................ 10 Volume and Periodicity of Data .................................................................... 11
IV. DATA ANALYSIS .................................................................................... 12
A. Burkina Faso ............................................................................................ 13 1. Breakdown by donor .............................................................................. 13 2. Breakdown by sector ............................................................................ 17 3. Financial instruments / Types of aid ..................................................... 18 4. AMP data collection: Differences from the CRS ................................. 19 5. Conclusions ............................................................................................ 20
B. Malawi ..................................................................................................... 21 1. Breakdown by donor ............................................................................. 22 2. Breakdown by sector ............................................................................ 24 3. Financial instruments / Types of aid ..................................................... 25 4. AMP data collection: Differences from the CRS ................................. 26 5. Conclusions ........................................................................................... 28
V. MAIN MESSAGES FROM THE DATA ANALYSIS ........................... 30
VI. WAY FORWARD .................................................................................... 34
4

COMPARATIVE STUDY OF DATA REPORTED TO THE CRS AND THE AMP - © DEVELOPMENT GATEWAY 2009
Acronyms and Abbreviations
AfDB African Development Bank AfDF African Development Fund AIMS Aid Information Management System AMP Aid Management Platform
BADEA Arab Bank for Economic Development in Africa
CPA Country Programmable Assistance CRS Creditor Reporting System
DAC Development Assistance Committee (OECD) DCAS Development Cooperation Analysis System
FY Fiscal year
IFAD International Fund for Agricultural Development IMF International Monetary Fund
KfW Kreditanstalt für Wiederaufbau (Germany)
MEF Ministry of Economics and Finance (Burkina Faso) MGDS Malawi Growth and Development Strategy MOF Ministry of Finance (Malawi)
NGO Non-governmental organisation
ODA Official development assistance OECD Organisation for Economic Co-operation and Development OPEC Organization of the Petroleum Exporting Countries
PRSP Poverty Reduction Strategy Paper
SWAp Sector-wide approach
UK United Kingdom UN United Nations UNDP United Nations Development Programme
5

COMPARATIVE STUDY OF DATA REPORTED TO THE CRS AND THE AMP - © DEVELOPMENT GATEWAY 2009
I. INTRODUCTION
According to the OECD’s Development Assistance Committee (DAC), its Creditor Reporting System (CRS) has been capturing over 90% of members’ bilateral Official Development Assistance disbursements since 2000, and close to 100% since 2003. CRS data are publicly accessible, based on standard definitions and widely used by donors and researchers. They reflect the official data provided and validated by the OECD/DAC members. The CRS also provides metadata specifying the original data sources to explain and reinforce the credibility of the information. In recent years, a number of developing country governments have begun to implement their own domestic aid tracking systems, generally known under the generic name of Aid Information Management Systems (AIMS).1 AIMS, being more recent than the CRS, have in general captured relatively limited time series data as a result. Nevertheless, they are increasingly popular with developing country governments as more and more seek to improve management of the aid they receive. Currently, at least 50 countries worldwide are using such systems to some degree. The two major systems on the market are the Aid Management Platform (AMP) developed by Development Gateway, and the Development Assistance Database (DAD) developed by Synergy International Systems. A number of countries have also developed “home-grown” systems. Countries cite a variety of objectives when implementing AIMS, including strengthening national ownership of the aid management process, supporting the preparation of the national budget, improving coordination among government entities and donor agencies, and facilitating closer alignment of aid with national strategic objectives. The growing popularity of these systems suggests a demand for a somewhat different dataset than that captured in the CRS. In practical terms, countries express a need for up-to-date information, including projections of future aid flows, for the preparation of annual budgets, investment programs, and medium-term expenditure frameworks. Countries may require detailed information at the project level and at the financial transaction level that can help them monitor donor disbursements and project implementation on a real-time basis. In some countries, there may be donor agencies that are active locally but do not report to the CRS, prompting a need for broader coverage of aid data. For example, there are bilateral donors that are not OECD members, and private and global funds which also do not report to the CRS. This paper compares data collected through the CRS with data collected locally through AMP in two countries—Burkina Faso and Malawi—in order to advance our understanding of the characteristics and limitations of aid data collected through the two systems. We examine to what extent these datasets do actually vary, and whether the data captured locally meet the
1 See Role of Aid Information Management Systems in Implementing the Paris Declaration on Aid Effectiveness at the Country Level, Room Document 6, DAC Working Party on Aid Effectiveness, 8th Meeting, 5-7 July 2006. http://www.devaid.org/index.cfm?module=Library&page=Document&DocumentID=5920
6

COMPARATIVE STUDY OF DATA REPORTED TO THE CRS AND THE AMP - © DEVELOPMENT GATEWAY 2009
criteria for a useful country-level dataset as outlined in the previous paragraph. The paper provides some background on the CRS and AMP (section II), followed by a description of the methodology used by the two systems (section III). The paper turns to analysis of the data in AMP in Burkina Faso and Malawi (section IV), then summarizes the key findings (section V) and ends with thoughts on the way forward (section VI).
7

COMPARATIVE STUDY OF DATA REPORTED TO THE CRS AND THE AMP - © DEVELOPMENT GATEWAY 2009
II. BACKGROUND, INSTITUTIONALIZATION AND DATA COLLECTION
Creditor Reporting System
The twenty-three members of the DAC2 submit their data on individual aid activities to the CRS where they are verified by OECD staff. The CRS data reflect DAC members’ official statistics on aid flows to developing countries. Multilateral agencies report to the DAC on a voluntary basis. The largest agencies provide data at an activity level on a commitment basis, while disbursements are reported aggregated by recipient to the DAC aggregate database. Some agencies’ sector classification cannot be easily mapped to DAC classification (e.g. the World Bank), so data quality may be an issue. Definitions used in the CRS are discussed and agreed unanimously by DAC members, and are regularly adapted to respond to the needs of DAC members and to political changes in the provision of Official Development Assistance. CRS data are thus comparable between countries, and they are recognized internationally as the most reliable and complete source of information on aid flows. Validated CRS data are made public by the OECD DAC Secretariat and are freely available on the OECD website.3
Aid Management Platform
The Aid Management Platform (AMP) was created in 2005 in response to the Rome Declaration on Aid Harmonisation, and then adapted in 2007 to address the challenges outlined in the Paris Declaration on Aid Effectiveness. It is the result of collaboration between Development Gateway and the OECD, as well as UNDP, the World Bank, and the governments of Ethiopia and India. To date, AMP is in use or currently being implemented in 15 countries, most of which are in Sub-Saharan Africa.4 AMP is implemented at the national level and the system is hosted and managed by the government. The institution that manages AMP varies by country, depending on the organization of public institutions and the division of responsibilities among them in terms of aid coordination and management. Usually AMP is managed by an Aid Coordination Unit (or similar department), which is often located in the Ministry of Finance or in the Ministry of Planning, although in some cases it falls under the President’s or Prime Minister’s Office. AMP is Web-based and thus, at the government’s discretion, can be made available via the government’s Intranet (if applicable) or via the Internet. In general, central ministries involved in aid management, line ministries that benefit from external assistance, and donor
2 Australia, Austria, Belgium, Canada, Denmark, Finland, France, Germany, Greece, Ireland, Italy, Japan, Luxembourg, the Netherlands, New Zealand, Norway, Portugal, Spain, Sweden, Switzerland, the United Kingdom, the United States and the European Commission. 3 www.oecd.org/dac/stats/idsonline 4 The following countries have implemented AMP: Burkina Faso, Burundi, the Democratic Republic of Congo, Ethiopia, Liberia, Madagascar, Malawi, Niger, Senegal, and Tanzania. Implementations are expected in Haiti, Laos, Nepal, Uganda and Togo.
8

COMPARATIVE STUDY OF DATA REPORTED TO THE CRS AND THE AMP - © DEVELOPMENT GATEWAY 2009
agencies are potential AMP users. However, system accessibility depends on the technical and political environment in each country, and generally access is gradually expanded from the core user group to a larger number of institutions over time. The main objectives of AMP—and of any AIMS—are slightly different in each country, depending on the mandate of the institution that hosts the system, and on other factors such as the country’s level of dependence on external aid, the number of development partners, and the quality and accessibility of pre-existing information systems. Some countries implement an AIMS primarily to increase aid transparency and enable better coordination within government, and between government and donor agencies. Part of the motivation may be to attract additional aid and new donors. Others are focused on improving development planning and aid programming, and still others prioritize strengthening accountability and better reflecting aid in the national budget. Data collection and management in AMP is the responsibility of the government managing the system, in some cases with technical support from donors. In most countries data management relies on a double-validation (government-donor) process. Data come from different sources (central ministries, line ministries, donors, and implementing agencies), and in some countries, the data reporting process is a well-structured and agreed upon process between government and donors. In some countries, data are entered in the system only by government staff, while in other countries donors enter part of the information online. The key outputs of AIMS are reports that account for aid flows in relation to the national budget and plans. Most countries aim to produce an official ODA Annual Report based on data contained in their AMP.
9

COMPARATIVE STUDY OF DATA REPORTED TO THE CRS AND THE AMP - © DEVELOPMENT GATEWAY 2009
III. METHODOLOGY AND DEFINITIONS
Since the CRS is managed as a centralised system, it enforces a standardised set of definitions governing aid statistics. These definitions are detailed in the Reporting Directives for the Creditor Reporting System.5 This has two powerful implications for the use of aid statistics. First, it ensures a statistical comparability that has obvious benefits for analysis and empirical research. Second, the standard definitions impose an analytical rigour to dialogue among donor governments; due to the stringent definitions applied, when different donors talk about aid, they are using the same terminology. This is important not only in terms of what constitutes aid, but also in terms of its purpose. The CRS Reporting Directives outline the statistical definition of ODA and also the official definitions of sectors and objectives. Since a large proportion of aid to developing countries remains project- or sector-oriented, the standardisation of sectoral classifications contributes to a common understanding of what socioeconomic areas aid is meant to support. This framework is reinforced by a standardised list of objectives to which aid flows can be assigned. Since AMP was designed with the support of the OECD, it uses OECD/DAC methodology to the extent possible: the DAC definitions of commitments, disbursements, grants, loans, and other data items are the system defaults, and these clear and precise definitions are generally accepted by AMP users. When implementing AMP, most countries choose to use their own national sector classification scheme, based on national needs and priorities, and linked to the institutional setup of the government (e.g. in Malawi). Some countries link to the international Classification of the Functions of Government.6 However, some countries (in particular post-conflict countries) do not have an agreed national classification scheme and prefer to use OECD definitions. Other countries, such as Burkina Faso, have decided to use two classifications—the national one for internal needs, and the OECD classification for reporting to donors.
Accuracy of information
The CRS statistical reporting requirements are stringent but they ensure that accurate and comparable measurements of donor outflows can be derived. Country-level databases are less likely to be quite as precise in their representations of aid according to their own definitions, since few have such a stringent process of data validation, and the need for timely data is often pursued at the expense of accuracy. As mentioned above, countries frequently rely on a double-validation process (government-donors) to attempt to ensure data quality in local systems.
5 Reporting Directives for the Creditor Reporting System, September 2007, OECD: www.oecd.org/dataoecd/16/53/1948102.pdf. 6 Known as COFOG; see: http://unstats.un.org/unsd/cr/registry/regcst.asp?Cl=4&Lg=1.
10

COMPARATIVE STUDY OF DATA REPORTED TO THE CRS AND THE AMP - © DEVELOPMENT GATEWAY 2009
Volume and Periodicity of Data
The OECD CRS information has been recorded, in one form or another, since 1967, and is relatively complete in terms of bilateral aid commitments since 1995. Even taking into account changes in definitions, this time series information far outstrips any other database on aid flows that currently exist. Certainly, no comprehensive national database on aid flows captures information for a period of more than 10 years. In the case of AMP implementations, which have all taken place in the last few years, governments have decided to prioritise capturing the portfolio of ongoing activities in the system. This is because the primary objective is to enable real-time aid management and information sharing rather than historical comparisons and statistical analysis. However, some countries plan to enter historical data in the future in order to enable longitudinal analysis.
11

COMPARATIVE STUDY OF DATA REPORTED TO THE CRS AND THE AMP - © DEVELOPMENT GATEWAY 2009
IV. DATA ANALYSIS
This paper focuses on data from 2007, because this is the latest year for which data are complete in the CRS, and because, as explained above, AMP captures only a limited amount of historical data so far. In the case of Malawi, AMP data from the 2008 fiscal year (1 July 2007 – 30 June 2008) have been used because data prior to July 2007 are not considered complete. Since CRS data are collected on a calendar year basis, and it is not possible to disaggregate them by specific dates, the CRS data used correspond to calendar year 2007. Therefore a direct comparison between AMP and CRS is not fully possible for Malawi. This is not an issue for Burkina Faso which uses the calendar year for its fiscal year. The analysis focuses on disbursements because they are more relevant to beneficiary countries than multi-year commitments for the purposes of budget preparation and execution, and also in terms of relating public investment with development progress. Most reports built by governments using AMP data focus on disbursements. A major difference between the CRS and AMP is that the latter records information at the project level, while the CRS records information at the annual transaction level (i.e. the individual commitment or disbursement). This means that a unique project in AMP can correspond to several transactions in the CRS. This reflects the different purposes of the two systems: transaction-level data is appropriate for statistical analysis, while governments seek to monitor projects in their entirety, as a logical unit. In addition, there are some cases in the CRS where donors aggregate their reporting for several projects into a single transaction (e.g. technical cooperation, or small transactions below a certain volume threshold). It is therefore difficult to compare the number of transactions in the CRS with the number of projects in AMP. Moreover, since donor headquarters often report transactions to CRS under different names than those used at the country level, it is difficult to map the CRS transactions to the projects in AMP. In addition to ODA data, Country Programmable Assistance (CPA) data produced by the OECD have been used when possible, because they are much closer to capturing aid flows relevant to decision-making at the country level and hence provide a good approximation of the overall flows expected to appear in an AIMS (the following 2 country cases will demonstrate that CPA aid flows are close to the flows recorded in the AIMS of those countries). CPA is calculated by OECD in the following manner:7 “CPA is defined through exclusion. By subtracting from total gross ODA aid that is: (i) unpredictable by nature (humanitarian aid and debt relief); (ii) entails no cross-border flows (administrative costs, imputed student costs, promotion of development awareness, and research and refugees in donor countries); (iii) does not form part of co-operation agreements between governments
7 See 2009 DAC Report on Aid Predictability, OECD. http://www.oecd.org/dataoecd/46/19/43161677.pdf
12

COMPARATIVE STUDY OF DATA REPORTED TO THE CRS AND THE AMP - © DEVELOPMENT GATEWAY 2009
(food aid and aid from local governments); or (iv) is not country programmable by the donor (core funding of NGOs)”. CPA is not calculated from the CRS database, but mostly from the DAC database on aggregate financial flows, the other major OECD database on aid flows.8 The DAC database collects aggregated rather than transaction-level data, and covers more donor institutions than the CRS. Consequently, in some cases, CPA figures can be larger than the ODA measured in the CRS database. CPA is not currently broken down by sector, but the OECD/DAC is working on compiling this calculation and it should be available soon.
A. Burkina Faso In Burkina Faso, AMP is hosted by the Direction Générale de la Coopération (DG-COOP) of the Ministry of Economics and Finance (MEF). AMP was installed in 2008 and replaced the Development Cooperation Analysis System (DCAS), created by UNDP in 1991, which had become obsolete. AMP was used for the preparation of the annual Development Cooperation Report published in December 2008, which presented official 2007 data from the Government of Burkina Faso on aid flows received by the country.9 AMP Burkina Faso is not currently available on the Web, but the MEF intends to provide access to donors and the public by the end of 2010. On-budget ODA data are collected directly from different government departments by the MEF, and completed and compared with data collected annually from local donors. A data request is sent to donors in February/March, and responses arrive between June and September. To avoid double-counting, data are then compiled in AMP by MEF staff, and sent back to local donor offices for final validation in October. The MEF also collects planned disbursement data (three-year projections) from donors at the project level. In addition to ODA, AMP Burkina Faso has begun recording Treasury counterpart funds for aid-financed activities (but not activities fully financed by the Treasury). This analysis first looks at the breakdown of data in the CRS vs. AMP according to donor, sector, and financial instrument; it then evaluates the differences in the types of data collected at the local level compared to the CRS.
1. Breakdown by donor
Table 1 shows total ODA disbursements by donor in 2007 from the CRS and AMP, as well as CPA disbursements extracted from the DAC aggregate database for the same year. The table suggests the following conclusions:
• Overall, ODA measured in AMP and CPA is of the same order of magnitude, and has roughly the same bilateral/multilateral breakdown (40% / 60%).
• Total ODA as measured by the CRS is smaller than CPA and ODA recorded in AMP because the CRS is missing disbursement data from a number of donors (World Bank,
13
8 The calculation of CPA actually uses a few elements of the CRS database that are not identified separately in the DAC database on aggregate flows. 9 Rapport sur la Coopération pour le Développement 2007, Burkina Faso, décembre 2008.

COMPARATIVE STUDY OF DATA REPORTED TO THE CRS AND THE AMP - © DEVELOPMENT GATEWAY 2009
African Development Bank, the International Fund for Agricultural Development - IFAD, Arab Agencies, Arab countries, China Taipei).
• Bilateral donors that do not have offices at the country level are accounted for in the CRS and in CPA but not in AMP. Aid from these donors may have been channelled through another donor—such as a UN agency—so may actually be recorded in AMP but under another donor. In total, these types of aid flows represent no more than 2% of bilateral ODA.
• With three exceptions, ODA from individual DAC countries as reported to the CRS is larger than ODA reported to AMP by those countries. For some donors, ODA in AMP represents less than half of ODA reported in the CRS. Even using CPA to remove ODA that is clearly not programmable in the country, it seems that a significant share of ODA disbursements reported to the OECD does not show in the local system. In particular, for France, the main bilateral donor to Burkina Faso, aid reported to AMP represents only 46% of ODA reported to the CRS and 58% of CPA calculated by the OECD. Box 1 attempts to explain this discrepancy.
• For the United States, the difference between the ODA in the CRS (USD21.8 million) and CPA (USD2.5 million) comes mainly from food aid (USD16.6 million in 2007), as CPA does not include this type of transaction. The USD12.9 million recorded in AMP corresponds to one project on basic education that was reported in 2006 in the CRS.
• Only one of the top ten bilateral donors to Burkina Faso, China Taipei, reports to AMP and not to the OECD. However, some Arab countries that do not report detailed project information to the CRS are also significant donors to Burkina Faso.
• Levels of disbursements from the major multilateral donors (European Commission, World Bank and African Development Bank) collected by the OECD and locally are comparable. However, the CRS does not receive disbursement data from the World Bank, the African Development Bank and IFAD (it should be noted that commitment and disbursement data are reported by these institutions to the DAC aggregate database, but at present only commitment data on an activity level to the CRS) . Amounts shown in the CPA column come from the DAC database, which is based on aggregate numbers and thus cannot provide information at the project level.10 To the extent that countries need to be able to track actual disbursements against pledges at a project level, and monitor the undisbursed balance for a project, the lack of disbursement data is a very significant limitation of the CRS data at the local level (particularly since the World Bank is the second largest donor to Burkina Faso).
• ODA data from some smaller multilateral agencies, such as sub-regional development banks, are collected at the local level but not by the OECD.
• Amounts reported by UN agencies are larger in AMP than in the CRS (for both ODA and CPA), probably because these agencies execute many projects financed by other donors, and the government does not (and does not really need to) make the distinction between these projects and those financed by core funds from UN agencies. This also explains in part why bilateral ODA is greater in CRS than in AMP: some UN-executed bilateral ODA may have been counted under UN instead of
10 The OECD-DAC maintains two aid databases: DAC aggregates and CRS. See: www.oecd.org/dac/stats/data
14

COMPARATIVE STUDY OF DATA REPORTED TO THE CRS AND THE AMP - © DEVELOPMENT GATEWAY 2009
under the bilateral financer in AMP. For example, this is the case for Luxembourg: once activities implemented by UN agencies are deducted, the ODA figure from the CRS is of the same order as the ODA recorded in AMP.
• AMP tracks some information coming from NGOs, which is considered ODA by the Government of Burkina Faso. It is not clear whether this aid is really ODA according to the OECD definition (if funds come from the NGOs’ core budget, they are considered private flows and therefore not ODA). However, the amount of these flows—USD21.5 million—is relatively small and does not have a significant impact on the analysis.
• At the transaction level, to the extent that it is possible to map CRS data and AMP projects, financial figures do not always match precisely. This is due to a number of factors:
o Differences in exchange rate calculations. While the CRS uses an annual average exchange rate to convert amounts reported in national currencies to US dollars, AMP tracks actual exchange rates on a monthly basis and allows users the option of entering an exact exchange rate for a specific transaction. From an aid management standpoint at the country level, this is critical for reconciling AMP data with information in other systems such as financial management systems, coordinating with the Central Bank, and ensuring that planning and budget execution are based on more precise figures. This also helps when producing financial reports denominated in the national currency or the currency used in the project agreement signed with the donor.
o Some aid is provided in kind (e.g. consultants paid directly by the donor) and so will not be recorded in AMP.
o Timing, if data are recorded by the donor as disbursed in one year and by the recipient in a different year (e.g. the example of the US education project above).
15

COMPARATIVE STUDY OF DATA REPORTED TO THE CRS AND THE AMP - © DEVELOPMENT GATEWAY 2009
Table 1. Gross ODA disbursements to Burkina Faso in 2007 - USD million
CRS CPA AMP Austria 4.7 4.1 4.4 Belgium 14.4 8.6 5.4 Canada 15.3 14.5 18.4 Denmark 40.8 40.7 44.0 Finland 0.7 0.6 France 129.9 104.1 60.5 Germany 39.9 38.9 26.4 Greece 0.1 Italy 2.6 2.0 2.9 Ireland 1.1 0.0 Japan 20.4 17.5 11.5 Luxembourg 14.3 12.4 6.6 Netherlands 65.7 61.6 61.0 Norway 0.3 0.2 Spain 4.4 1.6 Sweden 21.1 19.7 16.5 Switzerland 20.3 18.0 18.1 United States 21.8 2.5 12.9 TOTAL BILATERAL DAC 417.7 347.1 288.6 Arab Countries 16.7 13.9 China Taipei 14.8 Other bilateral 1.9 TOTAL BILATERAL 417.7 365.7 317.3 European Commission 204.4 193.6 203.5 African Development Bank 63.6 58.3 Global Fund (GFATM) 9.3 9.3 IDA (World Bank) 170.7 171.7 United Nations 19.3 34.3 49.6 Arab Agencies 36.4 33.5 Other multilateral 1.8 6.5 TOTAL MULTILATERAL 233.0 509.8 523.0 International NGOs 21.5 TOTAL 650.7 875.5 861.9
16

COMPARATIVE STUDY OF DATA REPORTED TO THE CRS AND THE AMP - © DEVELOPMENT GATEWAY 2009
Box 1. Comparison between ODA reporting by France to CRS and AMP
Since France is the largest bilateral donor to Burkina Faso, discrepancies between CRS and AMP data deserve a closer look. CRS data show that France disbursed USD129.9 million to Burkina Faso in 2007, while data collected locally show only USD60.5 million, i.e. a difference of almost USD70 million. The government of Burkina Faso indicated that one part of the aid reported at the local level by France (and Canada) was not recorded in AMP because it was executed directly by the donor agencies’ headquarters for the benefit of some institutions or organizations (universities, NGOs, scholarships, or other structures) outside of Burkina Faso. This type of aid is indeed unknown to the government and to local donor offices. Since its nature, volume, duration and conditions are unknown to the government, it is not counted as ODA received. This provides an explanation for the differences between numbers in the CRS and in AMP. In addition, a detailed look at the data reported in both systems indicates that:
• Seventy-five transactions (including disbursements) were reported by France to the CRS for 2007, while according to the local AMP database there were 27 ongoing activities funded by France in 2007. Of these 27 activities, 18 can be matched to CRS transactions.
• When looking at individual projects, actual disbursement figures do not match in the two databases. This may be due to differences of timing.
• Looking at the largest disbursements reported to the CRS and not to AMP – thus a priori unknown to the MEF – we see that:
o One project, “Agricultural research” (no additional detail provided), accounts for USD18 million; it could be direct support to an agricultural research institute, not transiting through the central government, and thus not recorded in AMP, as explained above;
o Debt forgiveness accounts for USD16.7 million (two transactions in the CRS); o Imputed costs to students represent USD8.2 million ; o One “unspecified” transaction accounts for USD5.6 million; o One transaction for “multisector aid” represents USD4.0 million; o Administrative costs account for USD1.3 million; and o Support to local NGOs for USD0.9 million.
None of these transactions (with the possible exceptions of the agricultural research, unspecified and multisector aid items) are meant to be reported in AMP as they cannot be considered country programmable assistance. The discrepancy between the databases is thus not as significant as it at first appears.
• There are many smaller transactions (in total less than USD1.5 million) reported to the CRS that are not tracked in AMP. They may be activities implemented in the decentralised cooperation framework (for which the central government has difficulty collecting information).
• Information on projects in AMP is much more detailed, in particular regarding project objectives and descriptions, and regarding individual disbursement transactions (while the CRS generally provides one annual transaction per activity).
2. Breakdown by sector
17
Chart 1 shows the breakdown of ODA by sector in the CRS and in AMP. AMP Burkina Faso uses the OECD CRS sector classification scheme, so the comparison is relatively straightforward. It is interesting because it compares the “donor perspective” with the
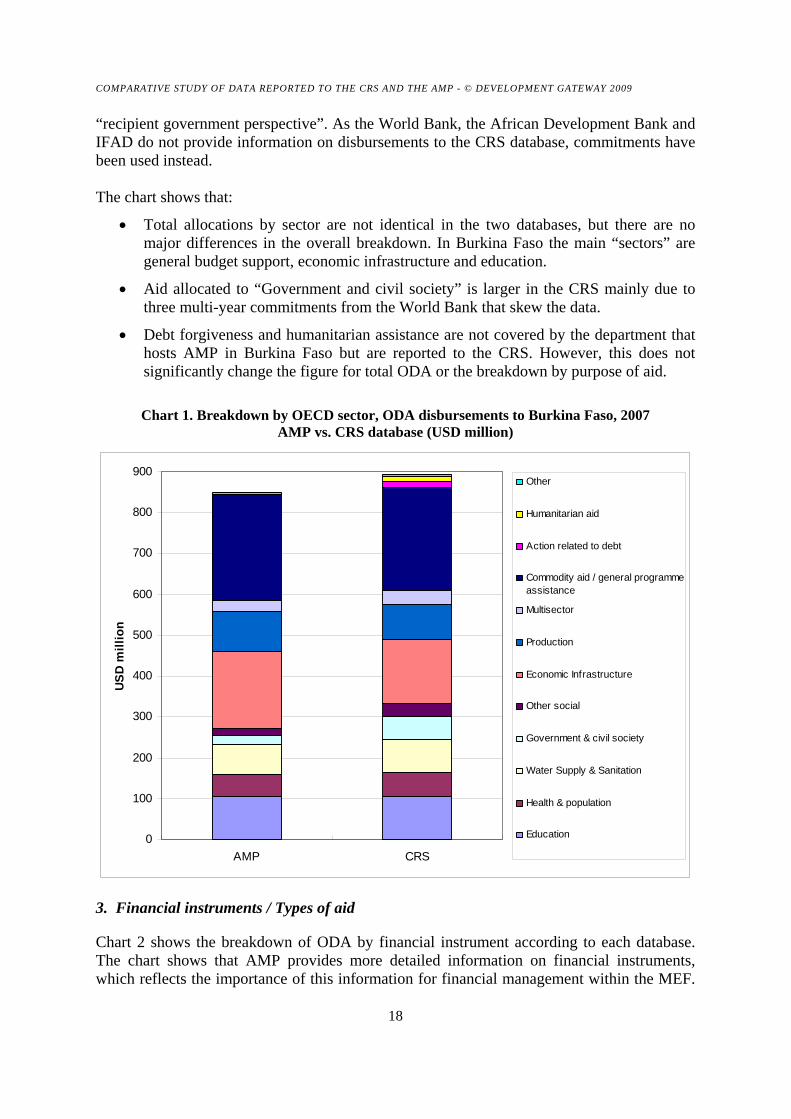
COMPARATIVE STUDY OF DATA REPORTED TO THE CRS AND THE AMP - © DEVELOPMENT GATEWAY 2009 “recipient government perspective”. As the World Bank, the African Development Bank and IFAD do not provide information on disbursements to the CRS database, commitments have been used instead. The chart shows that:
• Total allocations by sector are not identical in the two databases, but there are no major differences in the overall breakdown. In Burkina Faso the main “sectors” are general budget support, economic infrastructure and education.
• Aid allocated to “Government and civil society” is larger in the CRS mainly due to three multi-year commitments from the World Bank that skew the data.
• Debt forgiveness and humanitarian assistance are not covered by the department that hosts AMP in Burkina Faso but are reported to the CRS. However, this does not significantly change the figure for total ODA or the breakdown by purpose of aid.
Chart 1. Breakdown by OECD sector, ODA disbursements to Burkina Faso, 2007
AMP vs. CRS database (USD million)
0
100
200
300
400
500
600
700
800
900
AMP CRS
USD
mill
ion
Other
Humanitarian aid
Action related to debt
Commodity aid / general programmeassistance
Multisector
Production
Economic Infrastructure
Other social
Government & civil society
Water Supply & Sanitation
Health & population
Education
3. Financial instruments / Types of aid
Chart 2 shows the breakdown of ODA by financial instrument according to each database. The chart shows that AMP provides more detailed information on financial instruments, which reflects the importance of this information for financial management within the MEF.
18

COMPARATIVE STUDY OF DATA REPORTED TO THE CRS AND THE AMP - © DEVELOPMENT GATEWAY 2009
While both databases estimate that 70% of ODA was provided in the form of project support, data collected through AMP provides a disaggregated description, and reveals that 45% of aid was provided in the form of grants for direct project support, 20% was provided as loans for direct project support, 8% as basket funds (mostly grants, but also some loans), 20% as grants for budget support, and 6% as loans for budget support (from the African Development Bank - AfDB and World Bank, which do not report disbursements to the CRS). As mentioned above, the lack of disbursement data in the CRS from many multilateral agencies does not allow for a solid analysis of the grant vs. loan breakdown in Burkina Faso. Actually, among the top ten loan providers in Burkina Faso,11 only France reports its loan disbursements to the CRS. However, as noted in section 2 above, AMP Burkina Faso does not capture debt forgiveness data. In the CRS, the “Other” category mainly represents donors’ administrative costs.
Chart 2. Breakdown of ODA disbursements by Financial Instrument
0%
20%
40%
60%
80%
100%
AMP CRS
Other
Debt
Emergency food aid
Budget support -loansBudget support -grantsBasket funds
Project aid - loans
Project aid - grants
4. AMP data collection: Differences from the CRS
In addition to the major breakdowns discussed above, including aid by donor, sector, and financial instrument, there are other types of data that are collected at the local level. This information is important for aid management, particularly in the context of the global aid effectiveness agenda. Thus far, the government has captured the following information which is not available in the CRS:
• Government ownership of aid activities: To facilitate dialogue between the government and its partners, projects are classified under 3 categories in AMP:
o Category A: Project under direct control of the government
19
11 World Bank, African Development Bank, some sub-regional banks and Arab banks/funds. See Rapport sur la Coopération pour le Développement 2007 – Burkina Faso, page 57.

COMPARATIVE STUDY OF DATA REPORTED TO THE CRS AND THE AMP - © DEVELOPMENT GATEWAY 2009
o Category B: Project managed by an autonomous executing agency under the control of the government
o Category C: Project managed by an autonomous executing agency
Thus far, 131 projects have been categorized according to these criteria; 30% of these projects fall under Category A, 30% under Category B, and 40% under Category C. This kind of information is important in light of the Paris Declaration’s emphasis on strengthening country ownership of aid management and minimizing the use of parallel project implementation units.
• Alignment with national strategies: All projects reported locally can be assigned to one or more sections and sub-sections of the national Poverty Reduction Strategy (PRS), documented in the Poverty Reduction Strategy Paper (PRSP).12 This allows the government and its partners to monitor how projects financed by external aid support the national agenda, and measure the level of commitments and disbursements for each section or sub-section of the PRSP. The Government of Burkina Faso plans to present a breakdown of ODA by PRSP domain (and a breakdown by MDG objective) in its Annual Report on 2008 aid flows.
• Regions: Information on the region of implementation of aid activities is key for aid management and coordination. Information on the exact regional breakdown of funding is difficult to obtain in Burkina Faso, but at a minimum the government and its partners are interested in knowing in which region(s) projects were implemented. To date, for 114 activities implemented at the regional level, users have entered the beneficiary region for 80 activities in AMP. This type of information should allow for analysis of aid allocations relative to development outcomes at the regional level, in order to answer questions about the distribution of funds vs. the areas of greatest need.
• Counterpart funds: The government has begun recording counterpart funding from its Treasury for aid-financed projects. This embeds aid management more tightly in general financial management and allows the MEF to track entire projects, rather than only the externally-financed components.
In Burkina Faso, AMP was implemented in mid-2008, with the initial objective of enabling the government to produce its ODA annual report in December. Therefore the top priority was to collect basic information (donors, disbursements, sectors, types of flows, and financial instruments). In the near future the government intends to take advantage of the potential to capture much richer information at the local level.
5. Conclusions
The Burkina Faso case shows that through a locally-managed system and local data collection process the government has captured a reliable and complete picture of aid flows to the country. Overall ODA figures, and breakdowns by donor, sector and financial instrument, provide results that are in line with the figures available from the OECD. However, at the project level, AMP provides more refined information than the CRS. The inclusion of data from non-DAC donors and project disbursement data from major donors
12 Document Stratégique de Réduction de la Pauvreté.
20

COMPARATIVE STUDY OF DATA REPORTED TO THE CRS AND THE AMP - © DEVELOPMENT GATEWAY 2009
such as the World Bank, which do not report this information to the OECD, is key to enabling a complete picture of aid flows. Other classifications such as the ownership of the project (whether it is implemented by government or not), more detailed information on financial instruments, and more precise exchange rates are also important for aid management. The inclusion of information on government counterpart funds signals a closer integration of aid management with general financial management than would be possible using global aggregate data. It should however be noted that the current process of data collection for AMP Burkina Faso is built on the previous process of collecting data annually for the DCAS. In addition, the DCAS was managed by a single user, who was in charge of entering all data and producing predefined reports. The migration to AMP implied the training of many users (25 to date) from different directorates. Some work remains for the Government of Burkina Faso to fully leverage the new system, for example by collecting project data more regularly (e.g. quarterly), by collecting more complete forward-looking data, by using the system as a daily aid management tool, and by producing reports using more country-specific information (related to national strategies, regions, channel of delivery, Paris indicators, etc.). The government also intends to provide access to donors, probably at the end of 2010. As stated in the preface of the 2007 Annual Report on Development Cooperation in Burkina Faso, the “possibilities for the use of AMP are numerous and the government will work to develop these options, taking into account the needs of aid data users, by reinforcing the capacity of the team in charge of the preparation of the report, and of all actors”. Donors to Burkina Faso should in parallel improve the quality and timeliness of the data they provide to the Government by providing (at a minimum) quarterly data on actual disbursements and more reliable information on their future spending plans at the project level. A follow-up to the present study in one or two years would be a useful exercise to better understand whether these objectives have been achieved.
B. Malawi
In Malawi, AMP is hosted by the Ministry of Finance (MOF). The system was implemented in 2008 and replaced an MS Excel spreadsheet that had become unmanageable over time, and did not allow reports to be created easily. Disbursement data are collected on a monthly basis and entered into AMP by Ministry of Finance staff. At the end of the fiscal year, the Ministry runs a report for each donor (in the original currency) and the donor is asked to validate the figures. When this is completed, the annual report is produced. The MOF also produces a mid-year report in January, which reviews the aid portfolio for the July-December period. AMP Malawi is accessible online to registered users. Data are not fully comparable between the CRS and AMP, because AMP is based on the government’s 2008 fiscal year (1 July 2007 – 30 June 2008), which it uses for all official reporting, while CRS uses the calendar year. AMP Malawi thus far includes all projects that were ongoing in FY2008; in addition, the system includes annual historical data, where possible, for FY2005, FY2006 and FY2007.
21

COMPARATIVE STUDY OF DATA REPORTED TO THE CRS AND THE AMP - © DEVELOPMENT GATEWAY 2009 1. Breakdown by donor
Table 2 shows total ODA disbursements by donor from the CRS (for 2007) and from AMP (for the government’s FY2008), and also shows CPA disbursements for 2007. The table suggests the following conclusions:
• Debt forgiveness to Malawi was very significant in 2007, especially from Japan and Austria, which explains most of the large discrepancy between ODA reported to the CRS vs. CPA and AMP.
22

COMPARATIVE STUDY OF DATA REPORTED TO THE CRS AND THE AMP - © DEVELOPMENT GATEWAY 2009
Table 2. ODA Disbursements – USD million
CRS CPA AMP
2007 2007 FY
2008 Australia 2.2 2.2 Austria 22.9 0.1 Belgium 3.3 0.1 Canada 14.3 14.3 9.3 Denmark 2.4 2.0 Finland 0.9 0.9 France 2.1 0.5 Germany 24.4 23.4 15.6 Greece 0.4 0.2 Ireland 9.7 2.9 Italy 1.5 1.5 Japan 221.8 26.1 14.6 Luxembourg 0.1 0.1 Netherlands 6.8 6.8 New Zealand 0.1 0.1 Norway 54.8 54.2 68.9 Spain 0.5 0.8 Sweden 20.4 18.4 Switzerland 0.1 0.0 United Kingdom 133.7 126.7 145.5 United States 79.0 50.2 57.0 TOTAL DAC 601.3 331.4 310.9 Iceland 4.4 Arab Donors 6.9 Korea 0.1 TOTAL BILATERAL 601.3 342.9 310.9 EU institutions 77.0 68.0 70.7 IDA (World Bank) 77.4 60.3 AfDF 30.1 17.9 Global Fund 79.4 79.4 UNITED NATIONS 23.4 44.0 64.3 OPEC Fund 2.8 BADEA 4.3 IMF 10.2 Nordic Dev. Fund 1.2 TOTAL MULTILATERAL 179.7 317.3 213.2 TOTAL 781.0 660.1 524.1
• AMP Malawi does not include donors that are not present in the country (15 DAC Members that report data to the OECD are thus not included in AMP). In 2007 this represented around 12% of total bilateral ODA (14% of CPA). Some donors not recorded in AMP are relatively significant, and the lack of data on their assistance is explained as follows:
23
COMPARATIVE STUDY OF DATA REPORTED TO THE CRS AND THE AMP - © DEVELOPMENT GATEWAY 2009
o Some activities funded by donors are actually implemented either by UN agencies (and thus are reported in AMP as UN projects) or by NGOs (and thus are probably not in AMP).
o Ireland only recently opened an Embassy in Malawi and therefore will provide ODA data to the government in the future.
o Most of the Netherlands’ ODA reported to the CRS is actually support to basic education that is executed and reported by the UK to the Malawian Government. This is why ODA from the UK is larger in AMP than in the OECD databases.
o The case of Sweden is interesting—Norway executes and reports most Swedish ODA to Malawi, which consists of SWAp support in the health sector. This is why ODA from Norway is larger in AMP than in the OECD databases. In addition, Sweden reported many small transactions to the CRS (for a total of USD1.5 million) corresponding to support to NGOs that do not appear in AMP Malawi.
• NGO data are captured in AMP if they are funded in-country by a donor that reports to AMP. NGO activities funded by other donors are not currently included in AMP Malawi in most cases.
• Both CPA and AMP estimate total bilateral aid at more than USD300 million, and multilateral aid provided by the major agencies (World Bank, EC, UN and AfDB) at slightly more than USD200 million.
• Disbursements from the Global Fund to Fight AIDS, Tuberculosis and Malaria are recorded in AMP, but in FY2009, which is why they do not appear in Table 2. Disbursements from the OPEC Fund, the IMF and some other small multilateral agencies are not recorded at the local level.
2. Breakdown by sector
Chart 3 shows the breakdown by sector of ODA in the CRS and in AMP. As Malawi uses a national sector classification scheme rather than that of the OECD, and since there are fewer sectors in the local scheme, this comparison uses the national sector scheme after a simple mapping. The local scheme is central to Malawi’s financial management and budget preparation processes, and it is therefore key for the government to track aid flows in a consistent manner. Differences between the databases are difficult to reconcile, as the CRS and AMP use a different calendar base and a different classification. Debt forgiveness has been excluded from the chart. Since the World Bank and the African Development Bank do not provide information on disbursements to the CRS database, commitments have been used instead.
• AMP shows a larger share for water and sanitation because the AfDB and the World Bank (which do not report disbursements to the CRS) are large donors in this sector.
• The large share of aid in the Economic Governance sector is explained by the fact that it includes general budget support, which is quite significant in Malawi.
24

COMPARATIVE STUDY OF DATA REPORTED TO THE CRS AND THE AMP - © DEVELOPMENT GATEWAY 2009
Chart 3. Breakdown by sector in Malawi – AMP/CRS comparison (USD million)
0
100
200
300
400
500
600
AMP CRS
US
D m
illio
n
Vulnerability, Disaster and RiskManagementEconomic Governance
Integrated Rural Development
Environment, Lands and NaturalResourcesTrade, Industry, Private sector &TourismAgriculture
Economic infrastructures
Public Administration, Gender andother socialDemocratic Governance
Water, Sanitation and Irrigation
Health
Education
3. Financial instruments / Types of aid
The analysis of breakdown between grants and loans is not meaningful because the level of loans is relatively low in Malawi (6% of ODA disbursements in FY2008 according to AMP), and because the World Bank and AfDB, which represent most of the loans to Malawi, do not report disbursements to the CRS database. Analysis by financing instrument is more interesting. The categories alone show the difference in perspective between government’s and donors’ reporting. The local database makes a distinction between direct project support and sector support, but also breaks it down into support to different sectors (e.g. AIDS as distinct from Health). Chart 4 shows that 34% of aid to Malawi was delivered in concordance with programme-based approaches (General Budget Support, Sector Support and Subsidy Support). This is an important metric in the Paris Declaration but this type of analysis is currently not possible through the CRS. The figure is compatible with the 2008 OECD Survey on Aid Effectiveness, which estimated that 42% of ODA to Malawi was disbursed within programme-based approaches.13 The Survey included high shares for Sweden that do not report to AMP and for the Global Fund for which disbursements have been recorded in AMP under FY2009.
25 13 OECD 2008 Survey on Monitoring the Paris Declaration, Chapter on Malawi, page 14: www.oecd.org/dataoecd/25/30/42299351.pdf

COMPARATIVE STUDY OF DATA REPORTED TO THE CRS AND THE AMP - © DEVELOPMENT GATEWAY 2009
Chart 4. Breakdown by financing instrument in AMP and CRS (USD million)
0
100
200
300
400
500
600
AMP
USD
mill
ion
Subsidy Support
Sector Support -NACSector Support -Health SWAPFood SecuritySupportDirect ProjectSupportGeneral Budgetsupport
0
100
200
300
400
500
600
CRS
US
D m
illio
n
Emergency aid
Food SecuritySupport
Direct ProjectSupport
General Budgetsupport
Note: NAC = National AIDS Commission.
4. AMP data collection: Differences from the CRS
In addition to the aspects discussed above, the government collects other information on aid flows at the local level which is pertinent for aid management and coordination:
• Up-to-date and planned information: One of the main reasons that countries create a local database is to get up-to-date information for daily aid management, budgeting, and expenditure planning. In Malawi, the government collects disbursement data from donors every month, and produces a scorecard that rates donors according to the quality and timeliness of their responses to the data collection requests. This has worked well to date, and as a result, by February 2009 data in AMP Malawi were complete for the 2008 calendar year. It also has complete data on disbursements with only a two-month delay (relative to a time lag of one year or more in the CRS). In addition, the government collects forward-looking information at the project level with a horizon of three years. However most donors do not provide projections beyond one year. Therefore AMP currently contains projections through FY2011, but not for all projects.
• Implementing agency and delegated cooperation: For governments, knowing the institution that is actually implementing a project on a daily basis is critical—this is the institution that government counterparts need to communicate with regarding project expenditures and outputs (Boxes 2 and 3).
• Aid projections: AMP includes levels of planned disbursements for FY2009, FY2010 and FY2011 at USD762 million, USD588 million and USD349 million, respectively. These numbers can be compared to planned CPA shown in Table D1 of the OECD Survey on predictability,14 which estimates CPA for 2009, 2010 and 2011 (calendar years) at USD743 million, USD808 million and USD851 million, respectively. Only 2009 data are of the same order in AMP and in the CPA estimates. This is due to the fact that: a) some local donors are unable to provide disbursement plans for all
14 2009 DAC Report on Aid Predictability, Survey on donors’ forward spending plans for 2009-2011: http://www.oecd.org/dataoecd/46/19/43161677.pdf
26

COMPARATIVE STUDY OF DATA REPORTED TO THE CRS AND THE AMP - © DEVELOPMENT GATEWAY 2009
projects 3 years in advance; and b) for donors who could not provide forward-looking information, the OECD created some estimates based on historical trends (in the case of Malawi this corresponded to 17% of 2009 flows). For project management purposes, forward-looking information at the project level is important to the government. But it also needs detailed projections of aid from each donor (not just a single aggregate for all donors) for budgeting and financial management purposes.
Box 2. Channel of delivery vs. implementing agency
The CRS has recently added a field called “Channel of delivery” to capture information on the organizations that actually implement aid projects. Where several levels of implementation are involved, only the first level is reported to the CRS as channel of delivery. By contrast, the AMP includes several related fields for this purpose. Since an activity can be managed by different agencies at different levels, knowing who is responsible for which aspect is key for aid management. The Government of Malawi chose to have two fields: “executing agency” and “implementing agency”. Staff entering data in AMP select values for each from a predefined pick list. Analysis of these fields in both databases reveals that:
• In the CRS, of 942 transactions reported for Malawi in 2007, 445 did not have any information on the channel of delivery, and 194 were classified under generic groups, such as “Public sector” or “National NGO”.
• In the AMP database, of 632 ongoing activities in FY2008, 373 have been assigned a specific implementing agency, which shows the significance of this type of information at the local level.
• A detailed analysis in AMP shows that 46 activities are being implemented by the Ministry of Health, 35 by the Ministry of Finance, 25 by the Ministry of Education, and 24 by the Ministry of Agriculture. A similar analysis in the CRS uncovers only 4 activities that are channelled through the Ministry of Health, 18 through the Ministry of Finance, 1 through the Ministry of Education, and none through the Ministry of Agriculture.
• Partner Agencies can be found in both databases as the channel of delivery (CRS) or implementing agency (AMP). UNDP was the most common implementing agency in AMP (9 activities), while according to the CRS, KfW was the donor agency that implemented the most activities (15).
• Fiscal calendar: It is crucial for the Malawian Government to receive information and to create reports in conformance with the local fiscal calendar, and thus the budget cycle. Therefore, donors provide data on actual and planned disbursements to the government according to the Malawi Fiscal Year calendar.
• PRSP: In Malawi, the Malawi Growth and Development Strategy (MGDS) is the second generation PRSP. Each project in AMP is assigned to one main MGDS theme: Social Development, Social Protection, Infrastructure, Good Governance and Sustainable Economic Growth (or “Other” if none applies, or “General” if many apply). AMP then allows the Government to produce financial reports per MGDS theme. It is important to note that the MGDS themes are different from the national sectors, and that an automatic mapping between the sector classifications and the MGDS themes would not provide the same results as the current manual process (and would therefore not be useful). Reporting on aid flows by MGDS theme enables analysis of the alignment of aid with national development objectives, as advocated by the Paris Declaration.
27

COMPARATIVE STUDY OF DATA REPORTED TO THE CRS AND THE AMP - © DEVELOPMENT GATEWAY 2009
• On-/Off-Budget: AMP also tracks whether activities are on- or off-budget, so that the government can measure the share of on-budget ODA per donor, sector, year, and other characteristics. This breakdown is emphasized in the government’s annual ODA report and is also important in the context of the Paris Declaration. The MOF reported to the OECD Survey on Aid Effectiveness that 64% of ODA disbursed by donors in 2007 was on-budget.
Box 3. Delegated Cooperation15
In the CRS, the only way to identify delegated cooperation is to screen the project title and description in detail, or to perform a keyword search with “delegated” or with the names of other partners. However, text searches in the CRS will only yield meaningful results in so far as donors have reported elaborate project descriptions. There is thus, at present, no guarantee that the information can be fully extracted. The OECD is currently improving the field “Channel of delivery” so that in the future it will be easier to isolate and identify delegated cooperation. In AMP, it is possible to specify whether a project has been implemented as delegated cooperation, and to specify the delegated partner in the implementing agency field. For developing countries, information on the agency that executes the activity—i.e. the organization that is in contact with the government for project negotiation, monitoring and evaluation—is more important than information on the primary source of funding. This is, for example, why governments record more aid from UN agencies and NGOs than does the OECD,
5. Conclusions
The case of Malawi shows that ODA data are collected and used at the local level for a specific purpose: getting frequent, up-to-date and planned information on disbursements from the largest active donors, at the expense of total coverage. Indeed, the database does not include data from donors that do not have an office in Malawi, whose aid represents about 10% of the total. Most data missing in AMP (which are included in CPA) represent aid executed by local and international NGOs that are not accountable to the Government of Malawi and thus do not report to it. As is to be expected, the government does not record non-CPA data in AMP, reinforcing the point that CPA is the more useful basis for comparison than total ODA. One key issue is the lack of coverage of NGOs’ activities, particularly in sectors where NGOs are relatively significant (at least in terms of numbers of activities). Better information on these funding flows and projects would be helpful for aid management and coordination. The MOF is currently working on solutions to improve coverage of NGOs. By concentrating on the main sources of aid among the relatively small number of donors in country, and taking advantage of some donors’ efforts in terms of aid delegation and provision of data, the government has been able to obtain regular and up-to-date data aligned with its fiscal calendar. This is an impressive achievement, and it is likely that very few other developing country governments have managed to collect data from donors on a monthly basis. Collection of disbursement data from large donors such as the World Bank, which do not report this information to the CRS, is very important for day-to-day aid tracking by the MOF. Projections of future aid flows are a particular area of emphasis for the MOF, which
15 Definition of delegated cooperation: When a donor acts with authority on behalf of one or more other donors of an activity (country programme, sector programme or project) (OECD).
28

COMPARATIVE STUDY OF DATA REPORTED TO THE CRS AND THE AMP - © DEVELOPMENT GATEWAY 2009
tracks donors’ compliance with government data requests because this information is so critical for its budgeting and planning exercises. Use of the local sector classification scheme, enabling linkages between aid management and budget preparation and tracking, demonstrates the utility of a country system, as does the additional information captured in AMP (aid by MGDS theme, on- vs. off- budget aid, and other characteristics). Recording the implementing agency is also central to project management.
29

COMPARATIVE STUDY OF DATA REPORTED TO THE CRS AND THE AMP - © DEVELOPMENT GATEWAY 2009
V. MAIN MESSAGES FROM THE DATA ANALYSIS
The examples of Burkina Faso and Malawi show that, despite some discrepancies, aggregate data collected locally and data collected through the CRS are broadly comparable. The overall level of CPA aid reported by donors to the OECD is of the same order of magnitude as the level of external aid that governments record in their local systems, and the analysis by donor or by sector does not reveal enormous differences in terms of the breakdown. The analysis does not cover an extended time period because the local systems have been implemented recently while the CRS has existed for many years. Unlike AMP, the CRS allows for comparisons over a period of more than 40 years. In addition, data in different AMPs are less homogenous and comparable than the OECD data, and in terms of total coverage, the OECD databases are more comprehensive, as they cover all types of ODA, including aid that does not transit through central governments (in particular ODA executed by NGOs). Moreover, unlike national sources, OECD statistics capture aid from most bilateral donors that do not have an on-the-ground presence in the country. Thus for international and historical comparisons, the CRS should remain the primary source of information on aid flows. The only real downside to CRS data, in terms of bilateral donor coverage, concerns data from emerging non-OECD donors. Regarding multilateral aid, however, the coverage of the CRS is incomplete. While information on multilateral commitments is satisfactory, information on actual disbursements at the project level from some major agencies (such as the World Bank) is lacking, which is problematic for any analysis, not to mention for local aid coordination. Governments are much more interested in actual disbursements than multi-annual commitments that show an irregular—and sometimes overstated—picture of aid received in the country. The use of disbursement data is also key to relating external aid with the budget. In addition, there are some sub-regional multilateral institutions that may report locally to governments but not to the CRS. Unlike CRS, local databases such as AMP were not designed for international/cross-country comparisons over time. Although they use common definitions and classifications, they are managed by different institutions, with different mandates and objectives, and different levels of capacity. The two cases studies examined here illustrate this problem, as the two databases have different purposes, different coverage, different sector classifications and different calendars (and different languages). It would therefore be very difficult to aggregate data from AMP Burkina Faso and Malawi, which are clearly intended to serve the local needs of the respective governments and their partners. It should also be noted that AMP has been implemented very recently in these two countries; historical coverage to meet local needs will improve as time series are built up in the coming years.
30

COMPARATIVE STUDY OF DATA REPORTED TO THE CRS AND THE AMP - © DEVELOPMENT GATEWAY 2009
On the other side, data collection at the local level enables analysis that is not possible through the CRS, such as evaluating the degree of alignment of aid to national strategies and the breakdown of projects by sub-national region; finding detailed information on people, institutions and organizations involved in project execution; assessing the financial breakdown according to the national fiscal calendar; and distinguishing between on- and off-budget assistance. All of these dimensions are key for aid management by governments. In addition, local databases have often been created in large part to help governments capture up-to-date information on aid flows, which is critical for budgeting and planning. In Malawi’s AMP, for example, 2008 data have been available and complete since February 2009. In the CRS, these data will not be available until January 2010, making it impossible for the government to use the CRS for monitoring donor disbursements and preparing the budget. In addition, governments collect aid projections at the project level according to the national fiscal calendar to feed into the budgetary process. This means that even if the CRS provided annual information on planned disbursements, because the CRS collects aggregate figures according to the Gregorian calendar year, these figures could not be used by governments that follow a different fiscal calendar. The OECD however does collect aggregate figures for donors’ future spending intentions. At present confidentiality concerns mean that the data are not broken down by donor, but they can provide an overall indication of future trends in development aid flows to countries.16 The Accra Agenda for Action (AAA) calls on donors to provide “regular and timely information on their rolling three- to five-year forward expenditure and/or implementation plans, with at least indicative resource allocations”. Currencies and exchange rates are another important issue. Donor agreements are signed in a variety of currencies—some in the national currency, some in the donor currency, and some using a composite currency (such as Unit of Account [UA] or Special Drawing Rights [SDR]). It is key for governments and local partners to monitor the project using the same currency used in the agreement, in order to know the exact balance of undisbursed funds, and at the same time to be able to produce aggregate reports in different currencies. The CRS uses annual average exchange rates, and provides data in USD only, which makes these data difficult to use for daily aid management. Other potential benefits offered by local systems, although they are not yet being consistently used in the countries studied, include:
• Counterpart and domestic funds: It is possible to capture information on counterpart funding for aid-financed projects, as well as domestically-financed investment projects, in an AIMS. In order to fully assess the effects of aid flows, it is important to compare these flows with other financial flows in the country. In particular, external aid should be analysed alongside domestic financing. In Burkina Faso, for example, the MEF has begun collecting data on the government counterpart funds for aid-financed projects, and in some other countries governments try to include all investment projects in their AIMS (whether funded by donors, or through the treasury
31
16 See the annual DAC report on Aid Predictability at www.oecd.org/dac/scalingup.
COMPARATIVE STUDY OF DATA REPORTED TO THE CRS AND THE AMP - © DEVELOPMENT GATEWAY 2009
or through domestic and foreign private investment) to improve overall macroeconomic management.
• Monitoring and Evaluation indicators: Many countries are currently improving their systems to monitor the qualitative progress of projects. In many cases this information is stored in a number of different systems, and collected by different departments than those which monitor the financial aspects of the project. However there are compelling reasons to link information on financial inputs with qualitative outputs, e.g. to perform value for money analysis.
• National plan indicators: The impact of aid-financed investment can be measured not only by project-specific indicators, but also against national-level indicators, in particular in countries where a large share of aid is channelled through sector or general budget support. As for monitoring and evaluation indicators, data on investment and outputs at the national and sector level are often stored in different systems and by different institutions, but there is an increasing interest in better linking them.
• Aid Effectiveness Indicators: AMP tracks indicators from the Paris Declaration on Aid Effectiveness at the project level, and enables most of these indicators to be aggregated automatically into national scores. Most AMPs were implemented too late to be used for the most recent OECD Paris Survey on Aid Effectiveness (done in early 2008), but now that they are beginning to contain solid data, some countries intend to use the system for the next round of the OECD Survey in 2011. For example, Burundi has begun to use AMP to calculate interim Paris indicators for 2008 aid flows, and monitor the changes since the last OECD Survey on 2007 aid flows.
• Tracking of expenditures: Both CRS and AMP track commitments and disbursements. At the local level, there is strong interest in tracking actual expenditures as well, i.e. funds actually spent by the implementer of the project. In some cases there are large discrepancies between donor disbursements and project expenditures, for a number of different reasons. At this stage, very few AIMS track expenditures comprehensively, and it is difficult to collect these data because information is dispersed, but demand for this information is clear because it represents the actual use of aid more so than donor disbursement data. This is also the way to relate budget execution to aid management and planning.
• Aid from NGOs: Government departments in charge of aid coordination are highly interested in better understanding what NGOs are doing in their country. In some countries, NGOs are so numerous that it is not possible even to know how many there are and their main areas of intervention. Detailed reports on NGO activities barely exist, for different reasons, of which three are often mentioned: many NGOs are reluctant to provide information to the central government or to coordinate with official donors; the cost of collecting information from small organizations spread around the country is high; and the government department in charge of NGO-related affairs is distinct from the one in charge of aid coordination (often NGO-related policies are managed by the Ministry of the Interior, or Territorial Affairs, while aid coordination is either in the Ministry of Finance or in the Ministry of Planning). Despite this, there is a perception that aid from NGOs is very significant, and needs to be tracked to inform planning. The solution to this issue is not technical but rather
32
COMPARATIVE STUDY OF DATA REPORTED TO THE CRS AND THE AMP - © DEVELOPMENT GATEWAY 2009
institutional. For example Burkina Faso recently decided to create an NGO Directorate within the Directorate General for Cooperation of the MEF, alongside the three existing Directorates for Bilateral Cooperation, Multilateral Cooperation and Aid Effectiveness. Once some agreements with NGOs have been made, AIMS can help track NGO-provided assistance as well as official assistance, and if the system is accessible online, NGOs could provide some information directly into the system. This would of course require a strong methodology and verification process in order to avoid double-counting vis-à-vis aid from official donors that is executed by NGOs.
33

COMPARATIVE STUDY OF DATA REPORTED TO THE CRS AND THE AMP - © DEVELOPMENT GATEWAY 2009
VI. WAY FORWARD
The implementation of an AIMS and the associated data collection process clearly necessitates additional work for the government and its partners, especially in the early stages of setting up the system and populating it with data. Governments that plan to implement a local database on aid flows should be well aware of these costs. At the same time, if the system is supported by a solid institutional setup, it can reduce the number of duplicate and overlapping data collection efforts often seen in countries (i.e. by different central ministries, by sector ministries or sector joint groups; by donors; or even by groups of donors such as the European Union that are attempting to coordinate among themselves, or for surveys such as the OECD Survey on Aid Effectiveness). In general many governments and their partners seem to think it is worth the effort to create a reliable local database that can serve many purposes. A local database that is managed and used only by donors, with little ownership from the government and no linkage with the budget, would probably not add much value relative to the CRS except to the extent that it captures more timely (and ideally forward-looking) information. A major limitation of the CRS data at the country level—whether it is to be used by the government or by civil society to hold governments and donors to account—is the time lag in the release of data. A local system that collects up-to-date and projected aid flows would still be valuable if the data collection process is sustainable. However, to be really useful and meaningful the local database must go further. It should be able to accommodate the government’s needs related to daily aid management, and allow the production of sector and national reports on aid flows, in conformance with the specific needs of the country and its partners. It must thus integrate features that are not in the CRS database, such as storing multiple currencies and exchange rates; managing information according to the local fiscal calendar; including detailed information on project execution; incorporating planned information; linking aid to national strategies and national sector classifications; and allowing a breakdown and analysis by region of the beneficiary country. In addition the AIMS should be able to link with other key government systems, in particular with budget management and monitoring and evaluation systems, and thus be fully integrated into the development planning processes of the country. Governments recognize this need, and many of them—including Burkina Faso and Malawi—store some information related to the budget in their AIMS (such as whether projects are on- or off-budget, the budget code, the budget chapter, the ministry officially responsible for the project, etc.). They also capture some information related to monitoring and evaluation (project indicators, sectoral and national indicators, Paris indicators), with the aim of linking their AIMS with other systems
34

COMPARATIVE STUDY OF DATA REPORTED TO THE CRS AND THE AMP - © DEVELOPMENT GATEWAY 2009
in the future. Some governments are even developing linkages with their budget management system as they implement an AIMS.17 Another significant value-added of a local AIMS relative to the CRS concerns the timeliness of information, which is key for policy making. As demonstrated with the Malawi case, it is possible for a government to obtain, at the project level, monthly data on donors’ actual disbursements, and also, for some donors, relatively reliable data on planned disbursements for the next three years. Of course there is a risk associated with current data in terms of accuracy, at least for the most recent months of data, but this is not a problem as long as the purpose of the system is clearly defined. It is much better to have some forward-looking data for planning purposes than no real-time information at all. Efforts recently undertaken by some donors to provide forward-looking information on their aid levels should be continued and extended if possible to all donors, so that foreign assistance can be included in a realistic way in medium-term government planning.
35
17 The Government of Senegal is currently implementing AMP (locally known as the Plateforme de Gestion des Financements Extérieurs) with linkages to its budget management system (SIGFIP).

COMPARATIVE STUDY OF DATA REPORTED TO THE CRS AND THE AMP - © DEVELOPMENT GATEWAY 2009
36
Contacts:
Mr. Rudolphe Petras Ms. Yasmin Ahmad Development Gateway
Foundation OECD
Development Co-operation [email protected] [email protected]