Embed Size (px)
Citation preview

Journal of Atmospheric and Solar-Terrestrial Physics 119 (2014) 63–70
Contents lists available at ScienceDirect
Journal of Atmospheric and Solar-Terrestrial Physics
http://d1364-68
n CorrChina. T
E-m
journal homepage: www.elsevier.com/locate/jastp
Comparative studies on ionospheric climatological features of NmF2among the Arctic and Antarctic stations
Sheng Xu a,b,n, Bei-Chen Zhang b, Rui-Yuan Liu b, Li-Xin Guo a, Ye-Wen Wu c
a School of Science, Xidian University, Xi'an 710071, Chinab SOA Key Laboratory for Polar Science, Polar Research Institute of China, Shanghai 200136, Chinac Institute of Space Weather, Nanjing University of Information Science and Technology, Nanjing 210044, China
a r t i c l e i n f o
Article history:Received 11 April 2014Received in revised form26 June 2014Accepted 26 June 2014Available online 9 July 2014
Keywords:Polar regionIonosphereNmF2
x.doi.org/10.1016/j.jastp.2014.06.01626/& 2014 Elsevier Ltd. All rights reserved.
esponding author at: School of Science, Xidel.: þ86 21 58715494.ail address: [email protected] (S. Xu).
a b s t r a c t
Climatological features of the maximum electron density of the ionospheric F2 region (NmF2) areinvestigated and compared among the Arctic and Antarctic stations using long-term observations fromthe dynasonde measurements at Tromso, the EISCAT Svalbard Radar (ESR) measurements at Long-yearbyen, and the digisonde DPS-4 measurements at Zhongshan, Antarctica. The NmF2 data are sorted asmonthly medians of NmF2 for each hour, month, and solar activity. Results are presented as follows:(1) On the diurnal variability, the maximum value of NmF2 mainly occurs at local noon at the aurorallatitude station Tromso, but at magnetic noon at the cusp latitude station Longyearbyen and betweenlocal noon and magnetic noon at Zhongshan, indicating the importance of soft particle precipitation andionospheric convection in the cusp region. (2) In addition to the daytime peak, there is another peak justbefore magnetic midnight at Longyearbyen in winter during solar maximum years, which is attributed tothe cross-polar transport of EUV ionization from day side to night side. (3) An enhancement of NmF2 isdetected at magnetic midnight in winter at Tromso. It may be caused by the nighttime substorms. (4) Onthe seasonal variability, there are semi-annual anomaly at Tromso and normal variability at bothLongyearbyen and Zhongshan during solar minimum years. (5) During solar maximum years there isalways semi-annual anomaly for all three stations. The well-known winter anomaly is evident at bothTromso and Zhongshan, but does not exist at Longyearbyen. These anomalies are mainly due to thedifferences in photoionization and chemical compositions between the three stations.
& 2014 Elsevier Ltd. All rights reserved.
1. Introduction
The formation of the ionosphere is primarily due to theionization of the upper atmosphere by solar X-ray and extremeultraviolet (EUV) radiations. The high-latitude ionosphere isknown to be controlled by solar EUV, magnetospheric precipita-tion and convection drivers, as well as the thermospheric factors.The ionosphere is subjected to diurnal, seasonal, solar cycle, andspatial variations (Rishbeth and Garriott, 1969). The climatologicalfeatures of ionospheric electron density are of basic importance inunderstanding and forecasting space weather.
According to the prediction of Chapman theory (Appleton andNaismith, 1935), the ionospheric electron density should be con-trolled by the solar zenith angle. So it should be the greatest insummer, and least in winter. However, the F2 layer behaves some“anomalous” features departure from the Chapman theory at
ian University, Xi'an 710071,
times. Many typical “anomalies” have been found in the F2 layer,such as winter anomaly (at middle and low latitudes, the daytimeNmF2 are greater in winter than in summer), semiannual anomaly(greater NmF2 at equinox than at solstice), etc. (Liu et al., 2009; Maet al., 2003; Torr and Torr, 1973; Yonezawa, 1971). These anomalieswere first found to occur in middle and low latitudes (less than60°). These phenomena are also discovered at some high-latitudestations with the extension of the study to the global ionosphere(Baron et al., 1983; Cai et al., 2007; Farmer et al., 1990).
In both hemispheres, there are funnel-shaped areas with nearzero magnetic field magnitude but dense plasma at the daysidemagnetopause, which are called the polar cusps or clefts. Theionopause and magnetopause are directly connected by magneticfield lines in these regions. Thus particles from the solar wind andmagnetosphere can arrive in near-Earth geospace without crossinggeomagnetic field lines. Generally, the cusp regions lie around778° MLAT, with about 5° extension in latitude. Ionosphere canbe affected by particle precipitation, convection electric field andfield-aligned currents, etc. Due to the similarity of the magneticfield structures in both hemispheres, behaviors in the ionosphereof each hemisphere may be driven by the same physical

Table 1List of the stations from which ionospheric data were obtained.
TRO ZHS LYB
Years analyzed 1994–2005 1995–2006 1998–2010Geographic coordinate 69.6°N, 19.2°E 69.4°S, 76.4°E 78.2°N, 16.0°ECorrected geomagneticcoordinate
66.7°N, 102.2°E 74.7°S, 96.9°E 75.4°N, 110.7°E
LT UTþ1.3 (h) UTþ5 (h) UTþ1 (h)MLT UTþ2.7 (h) UTþ1.75 (h) UTþ3 (h)
S. Xu et al. / Journal of Atmospheric and Solar-Terrestrial Physics 119 (2014) 63–7064
mechanism. The interaction between solar wind and magneto-sphere is asymmetric between the north and south poles, theinterrelated dynamic, energetic, and chemical processes have beenbelieved to be responsible for the complex morphology of thehigh-latitude F region (Brinton et al., 1978; Feldstein and Starkov,1967; Heppner, 1977; Zhang et al., 2013). In quiet condition,Zhongshan (ZHS) and Longyearbyen (LYB) are located in thevicinity of the cusp region during the daytime and within thepolar cap during the nighttime, coming across auroral zone twice aday in the morning and evening sectors, respectively. However,Tromso (TRO) lies in the auroral oval for most of the time on thenight side. Zhongshan has almost the same geomagnetic latitudewith Longyearbyen and almost the same geographic latitude withTromso, but in different hemispheres (Table 1). Comparativestudies of NmF2 among the three stations would further help usto understand relative importance of each process acting onionospheric F2 layer in the polar region, especially in the auroraloval and polar cusp/cap regions. Ionospheric features at singlepoint for these three stations are obtained in literatures (Cai et al.,2007; Farmer et al., 1990; He and Zhang, 2011; He et al., 2000; Liuand Yang, 2011; Xu et al., 2006). Except for the aforementionedanomalies, there is also a magnetic noon anomaly (the diurnalmaximum NmF2 occurs at magnetic noon instead of local noon)existing at Zhongshan and Longyearbyen. Shen et al. (2003)highlighted the effect of magnetospheric particle precipitation onionization enhancements around magnetic noon, based on iono-sonde data around solar minimum at Zhongshan Station. Zhu et al.(2008) pointed out the importance of Tongue-of-Ionization (TOI)in the formation of maximum of wintertime NmF2 at Zhongshanand Longyearbyen. Moen et al. (2008) reported that the two peaksof wintertime NmF2 in diurnal variation during solar maximumyears are consistent with cross-polar transport of solar EUVionized plasma.
Although lots of studies have been carried out on the polarionosphere using ground-based measurement, they mainly fo-cused on single station/hemisphere or a short period of time. Inthis paper, climatological features of NmF2 are investigated andcompared among the three stations.
Fig. 1. The monthly mean F10.7 during 1994–2010.
2. Data sources and processing methods
The ionospheric data are obtained from long-term observationsof the dynasonde measurements at Tromso, the EISCAT SvalbardRadar (ESR) measurements at Longyearbyen, and the digisondeDPS-4 measurements at Zhongshan, Antarctica. Locations of threestations are given in Table 1. At Tromso and Zhongshan, theionosondes provide ionograms via transmitting radio pulses withfrequency coverage of 1.0–30 MHZ and receiving echoes reflectedby various layers of the ionosphere. The ionospheric F-regioncritical frequencies (foF2) are calculated after processing iono-grams. The time resolution of ionosonde data is 1 h from January1994 to November 2002 but 15 min from December 2002 toDecember 2005 at Tromso. At Zhongshan, the time resolution is
1 h. And foF2 can be converted to NmF2 by
=NmF21
80.6(foF2) (1)
2
where the unit for NmF2 is electrons/m3, and that for foF2 is Hz.The ESR at Longyearbyen consists of two parabolic dish
antennas, a 32-m fully steerable dish and a 42-m dish with fixeddirection along the magnetic field line. And ESR provides altitudeprofiles of electron density (Ne). Since the operation time of ESR islimited, the data usually have different temporal and spatialresolutions. To get as many available data as possible, the electrondensity profiles adopted are not only from the 42 m antenna butalso from the 32 m antenna with elevation angle larger than 75°.In order to get the value of NmF2 in each profile, the range ofaltitude is limited to 180–500 km. If the number of the altitude-Nedata sets is less than ten in this altitude range in one profile, thisprofile is regarded as incomplete and is abandoned. Then five-point moving averages of Ne are calculated to replace the originaldata and the maximum value is selected as the value of NmF2 ineach profile.
In the present study, data within the thirty minutes on eachside of the UT hour are used to calculate the NmF2 values of thecurrent UT hour for the three stations. Monthly medians of hourlyNmF2 are used to represent average behavior of the ionosphere.There are at the most 288 (24 UT times 12 months) monthlymedian values of NmF2 each year. (In some years, the number ofmonthly median values may be less than 288, because there is noobservation in some months.)
3. Results
In order to group the NmF2 data in solar minimum andmaximum activities, Fig. 1 shows the monthly mean values ofsolar 10.7 cm radio flux (F10.7) during 1994–2010. Note that 2000–2002 is around the solar maximum, whereas 1995–1997 is solarminimum as well as 2007–2009. Contour diagrams of monthlymedian of NmF2 are plotted in Fig. 2 to illustrate the data coverageof the three stations. To reflect the variation features more clearly,the logarithm to base 10 of monthly median NmF2 is plotted.There is no observation in blank areas, especially at Longyearbyendue to the discontinuous operation of ESR radar. Because the timecoverage at Longyearbyen does not overlap that at the other twostations, data of NmF2 at Longyearbyen during the period from Jan2007 to Dec 2010 are moved to the left side of the red vertical solid

Fig. 2. Contour diagrams of monthly median of NmF2 at Tromso (a), Zhongshan (b) and Longyearbyen (c).
Table 2Distribution of the peak time of daytime NmF2 at three stations.
Winter Summer Equinoxes Summation
TRO andLYB
November–February
May–August March, April,September,October
ZHS May–August November–February
March, April,September,October
TRO09 UT(MN)
20 (41.67%) 3 (6.38%) 23 (16.43%)
10 UT 2 (4.44%) 17 (35.42%) 9 (19.15%) 28 (20.00%)11 UT(LN)
43 (95.56%) 11 (22.91%) 35 (74.47%) 89 (63.57%)
ZHS07 UT(LN)
1 (2.08%) 6 (12.77%) 2 (4.17%) 9 (6.29%)
08 UT 5 (10.42%) 17 (36.17%) 3 (6.25%) 25 (17.48%)09 UT 28 (58.33%) 21 (44.68%) 31 (64.58%) 80 (55.95%)10 UT(MN)
14 (29.17%) 3 (6.38%) 12 (25.00%) 29 (20.28%)
LYB09 UT(MN)
17 (43.59%) 20 (76.92%) 23 (60.53%) 60(58.25%)
10 UT 6 (15.38%) 3 (11.54%) 6 (15.79%) 15 (14.56%)11 UT(LN)
16 (41.03%) 3 (11.54%) 9 (23.68%) 28 (27.19%)
S. Xu et al. / Journal of Atmospheric and Solar-Terrestrial Physics 119 (2014) 63–70 65
line as shown in panel (c) of Fig. 2 to coincide data coverage withthe same solar activity level as the other two stations. Climatolo-gical features of NmF2 at three stations are investigated, includingdiurnal variation (Section 3.1) and annual variation (Section 3.2).Analysis of the features of NmF2 around both solar minimum andsolar maximum is carried out in Sections 3.3 and 3.4, respectively.
3.1. Diurnal variations of NmF2
From Fig. 2 we can see that there is generally only one peak indiurnal variation of NmF2 at all three stations in most of the time.The maximum value of NmF2 occurs mainly around the local noon(LN) or magnetic noon (MN), that is about 09–11 UT at Tromso andLongyearbyen, and 07–10 UT at Zhongshan. The peak time ofdaytime NmF2 at the three stations is found out and binnedaccording to three different seasons, which is listed in Table 2.Besides the daytime peak at local noon in winter (the seasonsmentioned in this paper are the local seasons of each hemisphere)at Tromso, there is another peak around magnetic midnight. Thisstructure is similar to the winter-like behavior at Norilsk (Ratovskyet al., 2013). Two peaks are also found in winter at Longyearbyen,but the peak time at solar maximum is not consistent with that atsolar minimum. The two peaks detected in three stations will beanalyzed and discussed in Sections 3.3 and 3.4.
In summer, the diurnal variation of NmF2 is relatively smoothat Tromso. The peak seems not obvious (Fig. 2). But from Table 2we can see that the peak time mainly occurs at magnetic noon(9UT) in summer. In other seasons, an obvious peak is detectedand the daytime peak mainly occurs at local noon (11 UT), about90% in winter and 73% in equinoxes. At Zhongshan, the daytimepeak mainly occurs at 08–09 UT in summer, close to local noon,and 09–10 UT in winter, close to magnetic noon. Distribution ofthe peak time of daytime NmF2 variations during solar minimumand solar maximum years at Zhongshan is listed in Table 3. It isobviously that the daytime peak occurs about one hour later atsolar maximum than solar minimum in the same seasons, i.e.,closer to magnetic noon. At Longyearbyen, however, the maximumvalue of NmF2 mainly occurs at magnetic noon. The magneticnoon anomaly phenomenon is obvious. Also, another peak is
found before magnetic midnight (18–21 UT) in winter at solarmaximum. Only in winter at solar minimum, there is no peakfound at both local noon and magnetic noon. A decrease of NmF2is even found at local noon.
3.2. Annual variations of NmF2
Annual variations of daytime peak value of monthly medianNmF2 at three stations are shown in Fig. 3. (Data of NmF2 atLongyearbyen during the period from Janurary 2007 to December2010 are also moved to the left side of the red vertical solid line as

Table 3Distribution of the peak time of daytime NmF2 during solar minimum (1995–1997) and solar maximum (2000–2002) years at Zhongshan.
ZHS Winter Summer Equinoxes
Solar minimum Solar maximum Solar minimum Solar maximum Solar minimum Solar maximum
07 UT(LN) 3 (27.27%) 1 (8.33%) 1 (8.33%)08 UT 4 (33.33%) 6 (54.55%) 4 (33.33%) 9 (75.00%) 7 (58.33%)09 UT 8 (66.67%) 6 (50.00%) 2 (18.18%) 8 (66.67%) 1 (8.33%) 4 (33.33%)10 UT(MN) 6 (50.00%) 1 (8.33%)
Fig. 3. Annual variations of daytime peak value of monthly median NmF2 at Tromso (a), Zhongshan (b) and Longyearbyen (c).
Fig. 4. Diurnal variations of monthly medians of NmF2 in different seasons at Tromso (a), Zhongshan (b) and Longyearbyen (c) in solar minimum year (TRO and ZHS: 1996,LYB: 2007).
S. Xu et al. / Journal of Atmospheric and Solar-Terrestrial Physics 119 (2014) 63–7066
shown in panel (c) of Fig. 3). From Figs. 2 and 3 we can see thatsemiannual anomaly is found during solar minimum years exceptthe year 1996 at Tromso. The daytime NmF2 tends to be thegreatest at equinoxes, least in winter and intermediate in summer.While in 1996 when the solar activity is the lowest (Fig. 1), NmF2is the greatest in summer and least in winter, showing normalvariability. During solar maximum years, however, both semiann-ual anomaly and winter anomaly are found. There are also two
peaks in annual variations. But the peaks are close to winter,appearing at about one or two months before and behind thewinter solstice, and the minimum NmF2 occurs in summer. Theannual variations of NmF2 at Zhongshan and Longyearbyen arealmost the same at solar minimum. NmF2 is the greatest insummer and least in winter, showing normal variability. At solarmaximum, NmF2 is the greatest at equinoxes at both stations.While NmF2 is lower in summer than in winter at solar maximum

S. Xu et al. / Journal of Atmospheric and Solar-Terrestrial Physics 119 (2014) 63–70 67
at Zhongshan, not the same as that at Longyearbyen. Besides thesemiannual anomaly, a weak (weaker than Tromso) winter anom-aly is also detected at Zhongshan. At Longyearbyen, there is nowinter anomaly. In general, the diurnal and annual variations ofNmF2 at Tromso are close to that at Norilsk which has almost thesame geographic latitude but lower geomagnetic latitude(Ratovsky et al., 2013). But there are great differences in theclimatological features between Zhongshan and Norilsk.
3.3. Diurnal variations of NmF2 at solar minimum
Fig. 4 shows diurnal variations of monthly medians of NmF2 indifferent seasons over the three stations in solar minimum year.Considering that the time coverage of observations at the threestations is not consistent, we select data in 1996 representing thesolar minimum at both Tromso and Zhongshan, and data in 2007at Longyearbyen. Observations over four months (March, June,September and December) are selected to analyze the features ofNmF2 in the four seasons. There is a smooth diurnal variation insummer at Tromso with little changes. NmF2 reaches a wide (intime) peak during 07–14 UT. While in other seasons, the peakappears at 11 UT (about 12 LT). The minimum values of NmF2appear not on the nightside but at 07 UT and 16 UT in winter.NmF2 begins to increase at 20 UT and reaches a secondary-peak at22 UT. While at Zhongshan, the maximum NmF2 around summeris at 08 UT (close to local noon). In equinoxes and winter, the peaktime is at about 09 UT (close to magnetic noon). And there is aslight increase at about 15 UT in winter. At Longyearbyen, thevariation of NmF2 is smooth covering almost all the daytime insummer and equinoxes. A slight peak is found at 09 UT (12 MLT).In winter, however, there are two peaks at 05 UT and 16 UT,respectively.
3.4. Diurnal variations of NmF2 at solar maximum
Fig. 5 shows diurnal variations of monthly medians of NmF2 indifferent seasons over the three stations in solar maximum year.Data in 2002 are chosen at Tromso and Zhongshan, and data fromJune 2001 to March 2002 at Longyearbyen are used for analysis atsolar maximum. Like that at solar minimum, the diurnal variationis smooth in summer at Tromso. And the maximum value of NmF2is at 09 UT (12 MLT). The peaks are at around 11 UT (12 LT) in otherseasons. A slight increase is found during 21–01 UT in winter. AtZhongshan, the maximum NmF2 occurs at 08 UT in summer,09 UT in winter and between 08 and 09 UT in equinoxes. AtLongyearbyen, little change is found in diurnal variations ofNmF2 in summer except for the peak at 06 UT. The peak ofdaytime NmF2 appears at around 09 UT in other seasons. While
Fig. 5. Diurnal variations of monthly medians of NmF2 in different seasons at Tromso (aLYB: June 2001–March 2002).
NmF2 reaches a prominent peak at 18 UT, even larger than that onthe dayside in winter. Also there is a slight increase in the sametime period in equinoxes.
The dayside NmF2 tends to be the greatest at equinoxes inannual variations at all three stations, indicating the semiannualanomaly. Different from that at Longyearbyen, NmF2 is the least insummer and intermediate in winter at Tromso and Zhongshan.Compared with Tromso, NmF2 at Zhongshan is only a little higherin winter than that in summer. Thus not only the semiannualanomaly but also the winter anomaly are detected at both Tromsoand Zhongshan, although the winter anomaly at Zhongshan is notso distinct. There is no winter anomaly at Longyearbyen. On thenightside, however, NmF2 is the greatest in summer and least inwinter at all the three stations.
4. Discussion
Fig. 6 shows approximate locations of the three stations relativeto the high-latitude ionization hole, the main trough, plasmaconvections and the quiet time auroral oval. It can be seen thatthe effect of plasma convection is not noticeable at Tromso. As aresult, photoionization tends to be the dominant source of F2 layerionization and daytime NmF2 are mainly subject to the sun zenithangle. Thus NmF2 mainly reaches a peak at local noon at Tromso.At Zhongshan, the photoionization is almost the same intensity asthat at Tromso because of the similar geographic latitude. ButNmF2 is affected by plasma convection as well as soft particleprecipitation in the cusp region around magnetic noon. In sum-mer, the photoionization is the strongest and the peak time ofNmF2 is close to the local noon. In winter, the proportion ofphotoionization is lower than that in summer owing to the factthat the sun zenith angle is larger than 90°. This leads to a peaktime close to magnetic noon. With Longyearbyen being located atthe similar geomagnetic latitude with Zhongshan, NmF2 at Long-yearbyen is affected by plasma convection and soft particleprecipitation in the cusp region as well. But the geographiclatitude is largely (about 9°) higher than the other two stations.Plasma caused by photoionization is relatively weaker. Thereforethe maximum value of daytime NmF2 mainly occurs at magneticnoon.
Theories have been proposed for the anomalies in ionosphere.The widely accepted mechanism is the chemical explanationsuggested by Rishbeth and Setty (1961). Chemical compositions(such as the atomic oxygen to molecular nitrogen ratio R[O/N2])play an important role in variations of daytime NmF2. Thenoontime R[O/N2] at 300 km in different seasons (the sameseasons but different months in each hemisphere) over the three
), Zhongshan (b) and Longyearbyen (c) in solar maximum year (TRO and ZHS: 2002,

Fig. 6. Approximate locations (from 0 UT to 21 UT with an interval of three UThours) of the three stations relative to the high-latitude ionization hole, the maintrough, plasma convections and the quiet time auroral oval (Brinton et al., 1978;Heppner, 1977; Feldstein and Starkov, 1967). The asterisk is Tromso, the black pointis Longyearbyen, and the solid pentacle is Zhongshan.
Fig. 7. The noontime (local noon at Tromso and magnetic noon at Longyearbyenand Zhongshan) atomic oxygen to molecular nitrogen ratio R[O/N2] at 300 km indifferent seasons over the three stations at solar maximum. Numbers in brackets ofthe x axis indicate the months of Zhongshan. Neutral parameters are provided bythe MSISE00 model.
S. Xu et al. / Journal of Atmospheric and Solar-Terrestrial Physics 119 (2014) 63–7068
stations at solar maximum are plotted in Fig. 7. Parameters ofneutral atmosphere are provided by the NRLMSIS00 model (Piconeet al., 2002). The parameters used to run the MSIS00 are asfollows: 300 km in altitude, 11 UT (12 LT) at Tromso, 09 UT(12 MLT) at Longyearbyen and 10 UT (12 MLT) at Zhongshan. Apis chosen 8 for geomagnetically quiet conditions. The days of yearfor the model run are 15th of each month. And F107 is set to 200as well as F107A. Compared with Zhongshan, there is a similarintensity of photoionization controlled by the solar zenith angle atTromso because of the similar geographic latitude (about 69°). Thecurves of R[O/N2] almost have the same tendency between the twostations in summer and equinoxes. While the wintertime R[O/N2]is largely higher at Tromso, result in a lower rate of molecularrecombination. This leads to the fact that the wintertime NmF2 at
Tromso is higher than that at Zhongshan. At Longyearbyen,however, the photoionization is limited in winter. AlthoughR[O/N2] is as high as that at Tromso, electron density is still verylow without the most important ionization source. As a result,there is a more apparent winter anomaly at Tromso than Zhong-shan and no winter anomaly at Longyearbyen.
As shown in Fig. 2c and Fig. 5c, there is a prominent peakbefore MLT midnight in winter at solar maximum at Longyear-byen. One possible reason could be that during the substormexpansion phase, the auroral oval extends poleward, and theionization enhancements caused by particle precipitation mayexpand towards Svalbard and be observed by the ESR. If that werethe case, the peak should be more apparent at solar minimumbecause of lower background electron density. However, there isno such kind of trend as seen in Fig. 4c. The peak time in winter atsolar minimum is not consistent with that at solar maximum.Moreover, Zhongshan Station, which is of the same geomagneticlatitude in the other hemisphere, there is no enhancement inNmF2 at the same MLT hours no matter at solar maximum orminimum. Therefore the pre-midnight NmF2 enhancement maybe closely related to the cross-polar transport process, which isconsistent with Moenet et al. (2008). During winter, the plasmaconvection moves into and out of sunlight. The interaction of theplasma convection and the terminator line plays a major role inthe plasma density structure at F-region altitudes. The plasmaconvection is close to its maximum excursion towards the daysideand the plasma moves antisunward over the polar cap to form aTOI at 18 UT in the Northern Hemisphere (Fuller-Rowell et al.,1988). When Longyearbyen is located in this area of the polar caparound 18 UT, the high density plasma is observed by ESR. It ismost probably that the daytime peak is subjected to the anti-sunward convection and the nighttime peak is subjected to theplasma transported from the dayside at Longyearbyen. Because ofthe opposite departure of geomagnetic axis from geographic axisin the Southern Hemisphere, the TOI structure appears abouttwelve hours different from the Northern Hemisphere. Thus thereis no peak observed during the same UT hours at Zhongshan.
There exist annual and seasonal variations in the source ofconvecting plasma originated from lower latitudes. At solar mini-mum, the convecting plasma is largely weaker than that at solarmaximum, especially in winter. In winter at Longyearbyen, it is tooweak to arouse an enhancement of NmF2. Moreover, photoioniza-tion is almost zero because of the higher geographic latitude.According to large statistical studies on the global distribution ofauroral occurrence/emissions in the Northern Hemisphere (Huet al., 2010), the two peaks observed by ESR in winter at solarminimum (Fig. 4c) may be due to auroral particle precipitationwhen Longyearbyen comes across auroral zone.
From Fig. 4c we can see that there is even a minimum value ofwintertime NmF2 around magnetic noon at Longyearbyen at solarminimum. It proves that the contribution of soft-particle precipi-tation in the cusp should be small. In other seasons, however,there is an enhancement of NmF2 at magnetic noon. Consideringthe fact that variations of soft-particle precipitation in the cuspregion are mainly controlled by interaction of the solar wind withthe magnetosphere, we propose that transport process may play amore important role than soft-particle precipitation at solarminimum at Longyearbyen, especially on the dayside.
The convecting plasma is largely weaker at solar minimumthan at solar maximum. As a result, the contribution of photo-ionization to the polar ionosphere is less at solar minimum.Responding to that, different behaviors of ionosphere are observedin both hemispheres for different solar activities. At Zhongshan,the peak time of diurnal variation is more close to local noon atsolar minimum, about one hour earlier than that at solar max-imum in the same seasons. At Longyearbyen, although NmF2 has
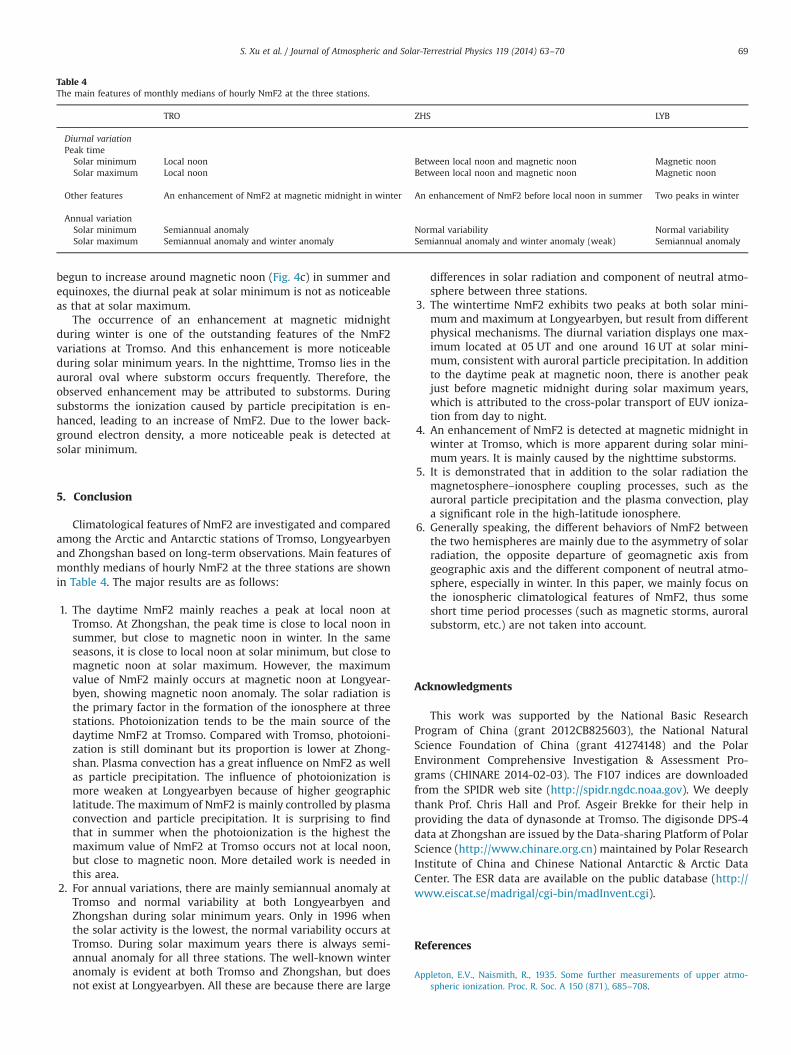
Table 4The main features of monthly medians of hourly NmF2 at the three stations.
TRO ZHS LYB
Diurnal variationPeak time
Solar minimum Local noon Between local noon and magnetic noon Magnetic noonSolar maximum Local noon Between local noon and magnetic noon Magnetic noon
Other features An enhancement of NmF2 at magnetic midnight in winter An enhancement of NmF2 before local noon in summer Two peaks in winter
Annual variationSolar minimum Semiannual anomaly Normal variability Normal variabilitySolar maximum Semiannual anomaly and winter anomaly Semiannual anomaly and winter anomaly (weak) Semiannual anomaly
S. Xu et al. / Journal of Atmospheric and Solar-Terrestrial Physics 119 (2014) 63–70 69
begun to increase around magnetic noon (Fig. 4c) in summer andequinoxes, the diurnal peak at solar minimum is not as noticeableas that at solar maximum.
The occurrence of an enhancement at magnetic midnightduring winter is one of the outstanding features of the NmF2variations at Tromso. And this enhancement is more noticeableduring solar minimum years. In the nighttime, Tromso lies in theauroral oval where substorm occurs frequently. Therefore, theobserved enhancement may be attributed to substorms. Duringsubstorms the ionization caused by particle precipitation is en-hanced, leading to an increase of NmF2. Due to the lower back-ground electron density, a more noticeable peak is detected atsolar minimum.
5. Conclusion
Climatological features of NmF2 are investigated and comparedamong the Arctic and Antarctic stations of Tromso, Longyearbyenand Zhongshan based on long-term observations. Main features ofmonthly medians of hourly NmF2 at the three stations are shownin Table 4. The major results are as follows:
1.
The daytime NmF2 mainly reaches a peak at local noon atTromso. At Zhongshan, the peak time is close to local noon insummer, but close to magnetic noon in winter. In the sameseasons, it is close to local noon at solar minimum, but close tomagnetic noon at solar maximum. However, the maximumvalue of NmF2 mainly occurs at magnetic noon at Longyear-byen, showing magnetic noon anomaly. The solar radiation isthe primary factor in the formation of the ionosphere at threestations. Photoionization tends to be the main source of thedaytime NmF2 at Tromso. Compared with Tromso, photoioni-zation is still dominant but its proportion is lower at Zhong-shan. Plasma convection has a great influence on NmF2 as wellas particle precipitation. The influence of photoionization ismore weaken at Longyearbyen because of higher geographiclatitude. The maximum of NmF2 is mainly controlled by plasmaconvection and particle precipitation. It is surprising to findthat in summer when the photoionization is the highest themaximum value of NmF2 at Tromso occurs not at local noon,but close to magnetic noon. More detailed work is needed inthis area.2.
For annual variations, there are mainly semiannual anomaly atTromso and normal variability at both Longyearbyen andZhongshan during solar minimum years. Only in 1996 whenthe solar activity is the lowest, the normal variability occurs atTromso. During solar maximum years there is always semi-annual anomaly for all three stations. The well-known winteranomaly is evident at both Tromso and Zhongshan, but doesnot exist at Longyearbyen. All these are because there are largedifferences in solar radiation and component of neutral atmo-sphere between three stations.
3.
The wintertime NmF2 exhibits two peaks at both solar mini-mum and maximum at Longyearbyen, but result from differentphysical mechanisms. The diurnal variation displays one max-imum located at 05 UT and one around 16 UT at solar mini-mum, consistent with auroral particle precipitation. In additionto the daytime peak at magnetic noon, there is another peakjust before magnetic midnight during solar maximum years,which is attributed to the cross-polar transport of EUV ioniza-tion from day to night.4.
An enhancement of NmF2 is detected at magnetic midnight inwinter at Tromso, which is more apparent during solar mini-mum years. It is mainly caused by the nighttime substorms.5.
It is demonstrated that in addition to the solar radiation themagnetosphere–ionosphere coupling processes, such as theauroral particle precipitation and the plasma convection, playa significant role in the high-latitude ionosphere.6.
Generally speaking, the different behaviors of NmF2 betweenthe two hemispheres are mainly due to the asymmetry of solarradiation, the opposite departure of geomagnetic axis fromgeographic axis and the different component of neutral atmo-sphere, especially in winter. In this paper, we mainly focus onthe ionospheric climatological features of NmF2, thus someshort time period processes (such as magnetic storms, auroralsubstorm, etc.) are not taken into account.Acknowledgments
This work was supported by the National Basic ResearchProgram of China (grant 2012CB825603), the National NaturalScience Foundation of China (grant 41274148) and the PolarEnvironment Comprehensive Investigation & Assessment Pro-grams (CHINARE 2014-02-03). The F107 indices are downloadedfrom the SPIDR web site (http://spidr.ngdc.noaa.gov). We deeplythank Prof. Chris Hall and Prof. Asgeir Brekke for their help inproviding the data of dynasonde at Tromso. The digisonde DPS-4data at Zhongshan are issued by the Data-sharing Platform of PolarScience (http://www.chinare.org.cn) maintained by Polar ResearchInstitute of China and Chinese National Antarctic & Arctic DataCenter. The ESR data are available on the public database (http://www.eiscat.se/madrigal/cgi-bin/madInvent.cgi).
References
Appleton, E.V., Naismith, R., 1935. Some further measurements of upper atmo-spheric ionization. Proc. R. Soc. A 150 (871), 685–708.

S. Xu et al. / Journal of Atmospheric and Solar-Terrestrial Physics 119 (2014) 63–7070
Baron, M.J., Heinselman, C.J., Petriceks, J., 1983. Solar cycle and seasonal variationsof the ionosphere observed with the Chatanika incoherent scatter radar. RadioSci. 18 (6), 895–900.
Brinton, H.C., Grebowsky, J.M., Brace, L.H., 1978. The high-latitude winter F region at300 km: thermal plasma observations from AE-C. J. Geophys. Res. 83 (A10),4767–4776.
Cai, H.T., Ma, S.Y., Fan, Y., Liu, Y.C., Schlegel, K., 2007. Climatological features ofelectron density in the polar ionosphere from long-term observations ofEISCAT/ESR radar. Ann. Geophys. 25, 2561–2569.
Farmer, A.D., Crothers, S.R., Davda, V.N., 1990. The winter anomaly at Tromso. J.Atmos. Terr. Phys. 52 (6–8), 561–568.
Feldstein, Y.I., Starkov, G.V., 1967. Dynamics of auroral belt and polar geomagneticdisturbances. Planet. Space Sci. 15 (2), 209–229.
Fuller-Rowell, T.J., Rees, D., Quegan, S., Moffett, R.J., Bailey, G.J., 1988. Simulations ofthe seasonal and universal time variations of the high-latitude thermosphereand ionosphere using a coupled, three-dimensional, model. Pure Appl. Geo-phys. 127 (2–3), 189–217.
He, F., Zhang, B.C., 2011. A comparative study of the polar ionospheric F2 layer atcusp latitude between IRI model prediction and observations in both hemi-spheres at solar minimum. Chin. J. Polar Res. 23, 159–167(in Chinese).
He, L.S., Liu, R.Y., Liu, S.L., Liu, Y.H., 2000. Overall properties of F region around solarminimum at Zhongshan station, Antarctica. Chin. J. Geophys. 43 (3), 289–295(inChinese).
Heppner, J.P., 1977. Empirical models of high-latitude electric fields. J. Geophys. Res.82 (7), 1115–1125.
Hu, Z.J., Yang, H., Liang, J., Han, D., Huang, D., Hu, H., Zhang, B., Liu, R., Chen, Z., 2010.The 4-emission-core structure of dayside aurora oval observed by all-skyimager at 557.7 nm in Ny-Ålesund, Svalbard. J. Atmos. Sol. Terr. Phys. 72 (7–8), 638–642.
Liu, L.B., Zhao, B.Q., Wan, W.X., Ning, B.Q., Zhang, M.L., He, M.S., 2009. Seasonalvariations of the ionospheric electron densities retrieved from constellationobserving system for meteorology, ionosphere, and climate mission radiooccultation measurements. J. Geophys. Res. 114, A02302.
Liu, R.Y., Yang, H.G., 2011. Progress in polar upper atmospheric physics research inChina. Chin. J. Polar Res. 23, 241–258. (in Chinese).
Ma, R.P., Xu, J.Y., Liao, H.Z., 2003. The features and a possible mechanism ofsemiannual variation in the peak electron density of the low latitude F2 layer. J.Atmos. Sol. Terr. Phys. 65 (1), 47–57.
Moen, J., Qiu, X.C., Carlson, H.C., Fujii, R., McCrea, I.W., 2008. On the diurnalvariability in F2-region plasma density above the EISCAT Svalbard radar. Ann.Geophys. 26 (8), 2427–2433.
Picone, J.M., Hedin, A.E., Drob, D.P., Aikin, A.C., 2002. NRLMSISE-00 empirical modelof the atmosphere; statistical comparisons and scientific issues. J. Geophys.Res.107 (A12)(SIA 15-11–SIA 15-16).
Ratovsky, K.G., Oinats, A.V., Medvedev, A.V., 2013. Regular features of the polarionosphere characteristics from digisonde measurements over Norilsk. Adv.Space Res. 51 (4), 545–553.
Rishbeth, H., Garriott, O.K., 1969. Introduction to Ionospheric Physics. AcademicPress, New York p. 331.
Rishbeth, H., Setty, C.S.G.K., 1961. The F-layer at sunrise. J. Atmos. Terr. Phys. 20 (4),263–276.
Shen, C.S., Zi, M.Y., Wang, J.S., Liu, S.L., Xu, J.Y., 2003. The features of foF2 atZhongshan station of Antarctica. Chin. J. Polar Res. 15 (3), 186–194(in Chinese).
Torr, M.R., Torr, D.G., 1973. The seasonal behaviour of the F2-layer of the iono-sphere. J. Atmos. Terr. Phys. 35, 2237–2251.
Xu, Z.H., Liu, R.Y., Liu, S.L., Zhang, B.C., Hu, H.Q., Qi, X., 2006. Variations of theionospheric F2 layer critical frequency at Zhongshan Station, Antarctica. Chin. J.Geophys. 49 (1), 1–8(in Chinese).
Yonezawa, T., 1971. The solar-activity and latitudinal characteristics of the seasonal,non-seasonal and semi-annual variations in the peak electron densities of theF2-layer at noon and at midnight in middle and low latitudes. J. Atmos. Terr.Phys. 33, 889–907.
Zhang, Q.H., Zhang, B.C., Lockwood, M., Hu, H.Q., Moen, J., Ruohoniemi, J.M.,Thomas, E.G., Zhang, S.R., Yang, H.G., Liu, R.Y., McWilliams, K.A., Baker, J.B.H.,2013. Direct observations of the evolution of polar cap ionization patches.Science 339 (6127), 1597–1600.
Zhu, A.Q., Zhang, B.C., Huang, J.Y., Liu, R.Y., 2008. Comparative study of winter polarionospheric F2 layer in both hemispheres. Chin. J. Polar Res. 20 (1), 32–39(inChinese).