Embed Size (px)
Citation preview

Additional DesignProcedures
Comparative SloshingAnalysis of LNG ShipContainment Systems
April 2005
ShipRightDesign and construction

ABCD Lloyd’s Register Marine Business Stream 71 Fenchurch Street London EC3M 4BS Telephone 020 7709 9166 Telex 888379 LR LON G Fax 020 7488 4796
Lloyd's Register, its affiliates and subsidiaries and their respective officers, employees or agents are, individually and collectively, referred to in this clause as the ‘Lloyd's Register Group’. The Lloyd's Register Group assumes no responsibility and shall not be liable to any person for any loss, damage or expense caused by reliance on the information or advice in this document or howsoever provided, unless that person has signed a contract with the relevant Lloyd's Register Group entity for the provision of this information or advice and in that case any responsibility. Lloyd’s Register Marine Business Stream is a part of Lloyd’s Register. Lloyd’s Register is an exempt charity under the UK Charities Act 1993.
Lloyd’s Register,2005
Document History
Document Date: Notes:
April 2005 First issue

Comparative Sloshing Analysis of LNG Ship Containment Systems, April 2005
Content Page
Introduction 1 Section 1 Application 1 Section 2 Symbols 2 Section 3 Sloshing Investigation Report 2 Chapter 1 Sloshing Assessment Procedure 3 Section 1 Introduction to Sloshing Phenomena 3 Section 2 A Comparative Approach to Sloshing Analysis 5 Section 3 Phase I: Scope of the Ship Motion Analysis 6 Section 4 Phase II: Ship Motions Computations 8 Section 5 Phase III: CFD Analysis of Critical Cases 10 Section 6 Phase IV: Model Scale testing 11 Section 7 Phase V: Design Assessment 12 Chapter 2 CFD Modelling 13 Section 1 Objectives 13 Section 2 CFD Model 13 Chapter 3 Model Testing 14 Section 1 Introduction 14 Section 2 Objectives 14 Section 3 Test Rig requirements 14 Section 4 Testing Methodology 15 Section 5 Data Processing 15
References 17 Appendix 1 Summary of Sloshing Analysis 18
Requirements
Lloyd’s Register

Comparative Sloshing Analysis of LNG Ship Containment Systems, April 2005
Introduction 1. Application 2. Symbols 3. Sloshing Investigation Report ■ Section 1: Application Membrane LNG ships incorporating the NO96, MkIII and CS1 systems, of capacities of approximately 125,000 to 155,000m3, built in accordance with the designer’s recommendations and having tank shape and dimensions as agreed by Lloyd’s Register, may be operated worldwide in any sea conditions provided that filling is kept outside the range 10% of tank length through to 70% of tank height. The purpose of this barred fill range is to avoid sloshing damage. For membrane LNG ships not complying with these criteria, for example, with a reduced barred fill range within a restricted sea area, with tank shape/size outside the designer’s recommendations, or for large LNG ships with capacities greater than 155,000m3, then it is mandatory to carry out a technical investigation into the acceptability of the proposal. From experience, Lloyd’s Register may be able to advise on which proposals are potentially feasible and which are unlikely to be proven acceptable by such an investigation. The Rules and Regulations for the Construction and Classification of Ships for the Carriage of Liquefied Gases in Bulk incorporating the IMO International Code for the Construction and Equipment of Ships Carrying Liquefied Gases in Bulk (IGC Code) is referred to in this document as Lloyd’s Register’s Rules for Ships for Liquefied Gases. References to the IGC Code in this procedure are equivalent to references to the Rules for Ships for Liquefied Gases. Following the requirements of these guidelines will be accepted as a means of confirming that the containment system has been designed to take into account sloshing as required by paragraphs 4.3.1.1 and 4.4.2 of Lloyd’s Register’s Rules for Ships for Liquefied Gases. This procedure requires a comparison of the proposed design with an agreed suitable basis design of capacity of approximately 135,000 to 140,000m3 and with tank shape and size in accordance with the designer’s recommendations. It requires the following components:
• Establishing potentially critical fill height/ship speed/heading combinations using verified and validated computational methods;
• Testing of identified critical conditions for both the proposed ship, and the equivalent basis ship in a sloshing test rig at an appropriate scale and with appropriate scaling factors;
• Processing of the results in a manner acceptable to Lloyd’s Register. This document covers the membrane containment system only. The strength of the pump tower is to be investigated as specified in the Pump Tower Analysis Procedure and the strength of the inner hull structure supporting the containment system is to be verified by means of the Level 3 procedure in Reference 1, or an equivalent accepted method. In general, the sloshing strength of membrane containment systems is to be carried out in accordance with the procedures contained in this document. Where alternative procedures are proposed, these are to be agreed with Lloyd’s Register before commencement. If the computer programs and test rig employed are not approved by Lloyd’s Register, full particulars and evidence of verification and validation will be required to be submitted. The requirements for a test rig acceptable to Lloyd’s Register are described in Chapter 3, Section 3 of these guidelines. Lloyd’s Register may require the submission of computer input and output, and output from test rig instrumentation, to further verify the adequacy of the investigation.
Lloyd’s Register 1

Comparative Sloshing Analysis of LNG Ship Containment Systems, April 2005
It is recommended that the organisation carrying out the investigation consults with Lloyd’s Register on the scope of the work to be carried out well in advance of commencement. ■ Section 2: Symbols The symbols used in these guidance notes are defined as follows:
H Tank height L Tank length Pmax Maximum value of measured impact pressures P10 The mean of the ten highest impact pressures P1/10 The mean of the 10% highest impact pressures
■ Section 3: Sloshing Investigation Report A detailed report of the computations, testing and post-processing is to be submitted to demonstrate that sloshing pressures for the proposed operation or design are no greater than predicted for the basis ship. This is to include:
• a list of plans used, including dates and versions • the methodology used in the sloshing analysis procedure • details and validation of the seakeeping codes used to compute ship motions in irregular seas • details and validation of CFD codes if used to predict motions and pressures within a
membrane tank • details of computations and measurements for a reference ship of capacity 135,000 ~140,000
m3 • details of computations and measurements for the submitted ship of capacity greater than
155,000 m3 • details of the test rig, testing procedures and data analysis methods used.
Lloyd’s Register 2

Comparative Sloshing Analysis of LNG Ship Containment Systems, April 2005
Chapter 1: Sloshing Assessment Procedure
1. Introduction to Sloshing Phenomena 2. A Comparative Approach to Sloshing Analysis 3. Phase I: Scope of the Ship Motion Analysis 4. Phase II: Ship Motions Computations 5. Phase III: CFD Analysis of Critical Cases 6. Phase IV: Model Scale testing 7. Phase V: Design Assessment ■ Section 1: Introduction to Sloshing Phenomena
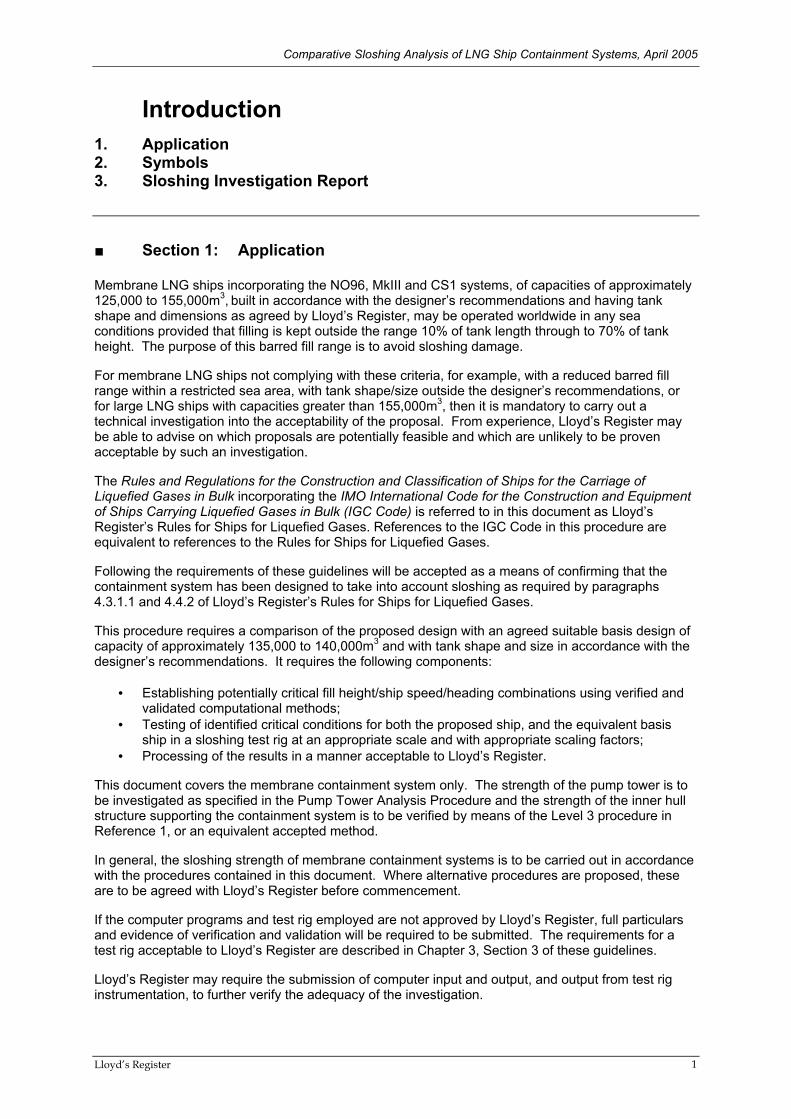
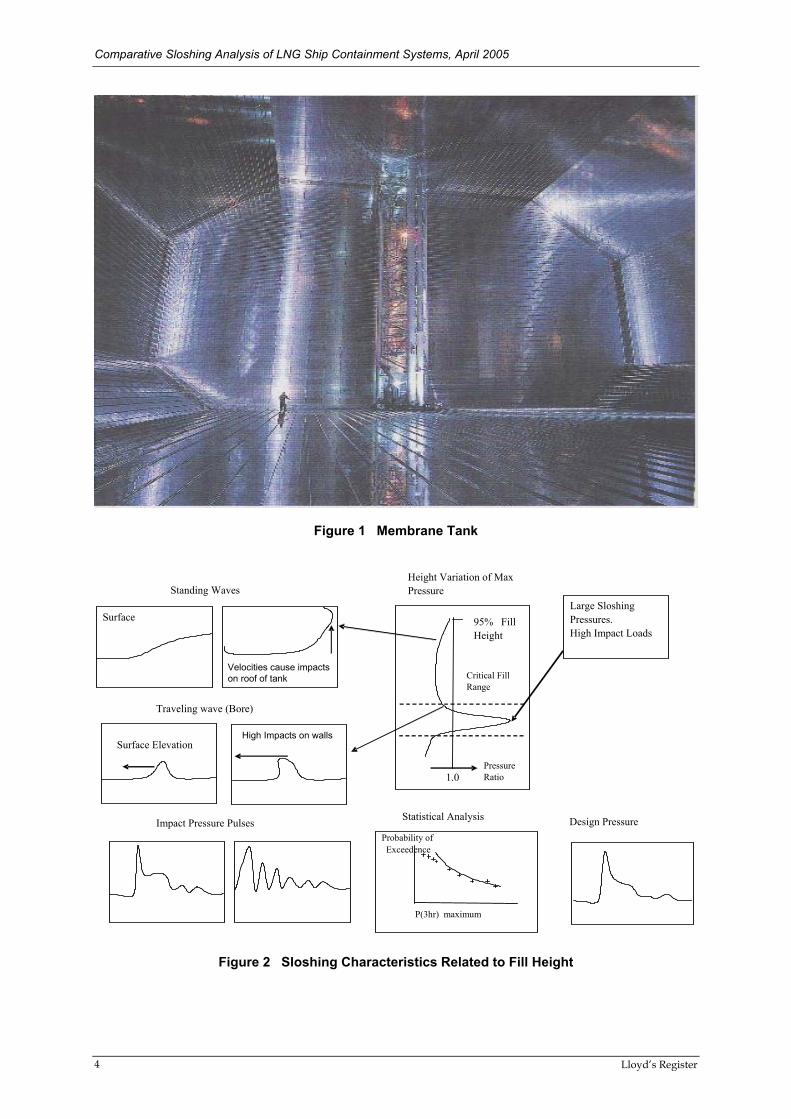
Sloshing is the violent resonant motion of the free surface of a fluid in a partially filled container or tank. The principal parameters, which determine the nature of this phenomenon, are the tank shape and filling level together with the amplitudes and frequency content of the tank motion. Sloshing is produced in cargo and ballast tanks of ships by wave-induced hull motions arising from the sea states in which the ship operates. Such motions, which are stochastic in nature, contain many frequencies and wave amplitudes, which, within partially filled tanks, induce fluid motion characteristics having similar frequency content. Sloshing motions can occur when the hull excitation periods, in response to irregular wave excitation, are close to the longitudinal and transverse natural periods of the fluid flow within a tank. Under such conditions the energy in the moving fluid can build up, producing significant velocities within the fluid and hence impacts between the fluid and the tank structure. In such circumstances, high pressures and forces can be transferred to the containment boundaries and supporting structures. Membrane tanks, Figure 1, have the potential to produce strong sloshing phenomena and impacts on the tank boundaries since they contain no internal structures with which to damp resonant fluid motions induced close to tank natural periods. The characteristics of the free surface sloshing wave in a membrane tank change with the fill height. The general tendencies with fill levels, observed in recent experimental studies, are illustrated in Figure 2 and are described below. At the highest fill levels above about 90%, the vapour space seeks the instantaneous highest point in the tank and this has a major influence on the fluid motion near the surface. At fill levels between 70%H and 90%H, the free surface takes the form of a standing wave. The oscillatory motion of the surface produces generally vertical velocity components and a shallow contact angle. A consequence is that air and vapour may become trapped between the fluid and tank wall causing a cushioning effect of the sloshing impact. At intermediate and low-fill levels (less than 70%), the free surface develops a travelling wave or a hydraulic jump (bore), which is characterised by a high velocity and high impact angle but with low vapour entrapment. Such a wave can transfer a significantly higher impact force to the walls of the tank than a standing wave; cushioning effects due to vapour entrapment are considered to be less likely.
Lloyd’s Register 3
Comparative Sloshing Analysis of LNG Ship Containment Systems, April 2005
Figure 1 Membrane Tank
Height Variation of Max Standing Waves Pressure
Figure 2 Sloshing Characteristics Related to Fill Height
1.0
95% Fill Height
Critical Fill Range
Pressure Ratio
Probability of Exceedence
P(3hr) maximum
Traveling wave (Bore)
Large Sloshing Surface Pressures.
Impact Pressure Pulses Statistical Analysis Design Pressure
Surface Elevation
High Impact Loads
Velocities cause impacts on roof of tank
High Impacts on walls
Lloyd’s Register 4

Comparative Sloshing Analysis of LNG Ship Containment Systems, April 2005
In 2003, Lloyd’s Register approved a reduction in the upper limit of the barred fill range, from 80%H to 70%H, for membrane tanks of new LNG ships of capacity around 155,000 m3. This conclusion was based on results from a comparative experimental study, which showed that the maximum pressures measured on the tank walls and roof of a scaled model of an existing membrane tank, were similar at 70%H and 80%H for simulated ship and tank motions representing unrestricted worldwide service. Additional structural assessments would, however, be required for the extent of bulkhead reinforcements of the inner hull and the pump tower and base before any new design could be approved for operation at fill levels between 70%H and 80%H. ■ Section 2: A Comparative Approach to Sloshing Analysis
In keeping with the comparative approach adopted by Lloyd’s Register, the shipbuilder is required to demonstrate that the sloshing loads on the tank primary barriers of new LNG membrane-type carriers with higher capacities are not greater than for approved ships up to155,000 m3. Such a comparative approach is considered to be conservative and is employed in the absence, worldwide, of accurate full scale data on sloshing loads in LNG membrane tanks leading to uncertainty concerning the scaling laws governing wall pressures and impact loads due to different sloshing phenomena. The Phases involved in evaluating a given design of membrane containment system are as follows:
Phase I: Analysis of ship motions for the full range of operation of the ship over its service life, which is taken to be 40-years. This involves extensive seakeeping computations for irregular motions incorporating a range of ship loading conditions, speeds, heading angles, wave periods and significant wave heights in order to define the maximum motions and accelerations experienced by the ship in a variety of operational sea-states. The ship motions calculations are to be performed using the design hull lines and loading data. The cargo tank experiencing the highest motions may be identified from these results; the natural periods for this tank may be computed covering the full range of approved fill levels.
Phase II: Selection of the most critical sea-states involving inspection of the energy
content of the response spectra around sloshing resonances, as well as an analysis of the results from a number of computer simulations of free surface flows within a tank. This selection process may also involve a further refinement of the seakeeping calculations to determine peak ship responses and energy contents at wave encounter periods spanning the range from the tank natural periods to the peak ship response periods for all six degrees of freedom, but particularly for surge, pitch, roll, and sway.
Phase III: Optional CFD analysis of fluid motion within the critical tank, in the most critical
sea states. Experience shows that such computations can be of assistance in establishing an effective experimental programme for physical testing with a scaled model of the tank. In particular, CFD results can assist in reducing the number of model tests to be performed and can provide guidance concerning the placement of pressure transducers on the walls and roof of the test tank.
Phase IV: Model testing to investigate sloshing phenomena, pressures and loads on the
tank boundaries for the critical sea states. This is best achieved by means of a scaled physical model of a tank, which is driven by time-series for rigid-body motions computed for irregular waves. The scale of the model should not be less than 1/70. Physical scaled models, at present, appear to be the only accurate means for deriving sloshing pressures and forces over sufficient time periods to allow statistical measures to be derived.
Phase V: Design assessment of the LNG containment system by comparing maximum
statistical values for time-series of pressures and forces with those obtained from equivalent model tests for an approved current design. The data should be measured during sloshing impacts on tank boundaries and should, conservatively, be scaled from model to ship scale using the Froude scaling method. In evaluating the impact data, absolute values of pressures and forces are not compared to the static strength of the containment and insulation system since considerable uncertainties exist in relation to the applicable scaling laws, to hydro-elastic
Lloyd’s Register 5

Comparative Sloshing Analysis of LNG Ship Containment Systems, April 2005
effects and to the effect of coupling actions between tank fluid motions and ship rigid body motions.
More detailed information on the above Phases is given in Sections 3 to 7 and a summary of the processes, with comments, is given in Appendix 1. ■ Section 3: Phase I: Scope of the Ship Motion Analysis Seakeeping analysis is to be performed using ship motions software, normally based on frequency domain methods, which is capable of accurately computing rigid body motions in irregular waves in the frequency and amplitude ranges to which they are applied. Such software should have been substantially validated against model and ship scale data and any significant deficiencies should be noted concerning the ability of the code to predict amplitudes and phase angles of the hull motions in any of the 6 degrees of freedom. Careful consideration is to be given to such deficiencies when evaluating the likelihood of sloshing and in defining the irregular time-series for hull rigid body motions prior to performing sloshing tests. The following sub-sections provide guidance on the selection of parameters for seakeeping analysis computations in support of sloshing loads. 3.1 Tank selection The tank which experiences the highest sloshing motion responses is to be selected. Tank No. 1 is furthest from the centre of rotation and has high rigid body motion response. However, since a tank at this location is of reduced length, the sloshing motion is generally accepted to be less severe than for the other rectangular tanks of greater length and higher cargo capacity. Hence, the critical tank will normally be selected on the basis of hull motions computed at the centre of gravity of tank No 2 of a 4-tank ship or tanks No. 2 and No. 5 of a 5-tank ship. Developments in large LNG designs may include extending the No. 1 tank by adopting taper at the forward end, thus reducing the tank cross-sectional area towards the forward end of the tank. Such a design is considered to be susceptible to increased forces on the membrane at the tapered end, since the sloshing fluid in motion will be forced at higher velocities into the ullage space. Forward and vertical motions, emanating from pitch surge and heave, have the potential to impart strong impacts on the tapered sides, corners and roof of a tapered tank and, as such, merit extra attention. 3.2 Loading conditions The loading conditions between departure and arrival with the highest transverse metacentric heights are chosen as the basis for rigid body calculation of the ship response amplitude operators, RAO’s. For loaded and ballast conditions these may be taken as:
a) A ‘loaded’ condition: No. 2 or No. 5 tank partially empty and all other tanks full b) A’ ballast’ condition: No. 2 or No. 5 tank partially full (10%L); other tanks empty
3.3 Wave environment The standard wave environment is the North Atlantic all-directions scatter diagram, recommended by IACS (Rec. No. 34) [2]. This environment is specified in Table 1 of Reference 2, in terms of the number of occurrences per 100,000 observations (34.25 years), defined in terms of the significant wave height (Hs) and zero up-crossing period (Tz) observed in a 3-hour interval. For a ship life of 40 years, a limiting envelope is derived from this Table by scaling the number of observations in each box by 40/34.25 and interpolating in each column for 1 observation. A similar procedure is employed to find the limiting envelope for, say, 20-years and 1-year.
Lloyd’s Register 6

Comparative Sloshing Analysis of LNG Ship Containment Systems, April 2005
3.4 Wave Spectrum The Pierson-Moskowitz spectrum, which is equivalent to the JONSWAP spectrum with a gamma value set to 1.0, is to be used to model the wave environment in the North Atlantic or any open ocean areas. For a wave environment in a restricted sea area with limited fetch, the mean JONSWAP wave spectrum with a gamma value of 3.3 is to be used. In both cases, a short crested sea condition with a cosine spreading function as defined in Reference 2 is to be applied. 3.5 Ship Speeds and Wave Headings It is not considered necessary to perform seakeeping analyses at all ship speeds and all wave headings, since some operational restrictions exist and the aim of the analyses is to establish the highest ship responses under realistic operational conditions. The following assumptions apply for ship speed and wave headings as a function of the significant wave height Hs:
• For Hs ≤ 5m, the ship is assumed to attain full service speed and all wave headings can occur.
• For the range 5m < Hs ≤ 10m, the ship speed is 2/3 of full speed, and only head to beam
seas need be considered. • For Hs > 10m, two ship speeds and headings are considered:
a) 5 knots and wave headings for head seas between 180 and 135 degrees, representing a
voluntary speed reduction and a wave heading maintained close to head seas (180 degrees).
b) 0 knots and beam seas (wave heading of 90 degrees) representing an emergency
situation where all main engine power or steering is lost.
Alternative ship speeds, headings and wave heights may be acceptable to Lloyd’s Register on submission of a properly justified proposal. The selection of critical sea-states and headings is determined from an inspection of energy content of the response spectra close to the tank resonance periods as well as an analysis of the sloshing loads from a number of computer simulations. 3.6 Tank Fill Heights Computations and model tests are to include the following fill heights: 10%L, 70%H, 80%H, 85%H, 90%H and 95%H. The low fill limit, 10%L, corresponds to approximately 15%H for the current 4-tank ships of 125,000 m3 ~ 155,000 m3 capacity. However, for 4-tank large LNG ship designs, the resulting increase in tank length relative to the tank height may result in a 10%L fill height which is close to the known critical region between 20%H and 40%H. Experimental results have shown significant increases in the maximum sloshing loads in the critical region due to the development of strong bore waves. The GM value for the 10%L filling is to be taken from the ballast condition with all tanks filled to 10%L. Analysis of the high fill settings is to be performed with the highest GM; this will usually correspond to a loading condition where one tank is filled to 70%H and the remainder are filled to 10%L.
Lloyd’s Register 7

Comparative Sloshing Analysis of LNG Ship Containment Systems, April 2005
■ Section 4: Phase II: Ship Motion Computations 4.1 Ship Motions Ship motions in irregular waves are to be calculated for the range of ship loading, tank loading, environmental and ship operational parameters defined in Section 3. Such calculations are necessary in order to determine the maximum ship motion responses in regions where tank fluid motions may lead to sloshing. The ship motions in irregular waves may be computed in two parts as follows:
Rigid Body Motions: The ship rigid body motions are computed as transfer functions using regular waves. Such computations are generally based on linear strip theory or 3-D potential flow theory. The effect of forward speed may be included through the encounter frequency approximation, while roll-damping is more amenable to empirical corrections. The ship natural periods and responses are obtained for 6 degrees of freedom. Extreme Responses: The rigid body response data are used together with wave spectra definitions to perform short term statistical analysis in irregular waves. Ship responses, per 1m of significant wave height, are computed using the rigid body transfer functions, assuming that the irregular wave system, defining a sea state, can be represented by a set of unit regular (sinusoidal) waves using Fourier analysis methods.
4.2 Critical Cases The results of such ship motions analyses should provide the following:
• Maximum acceleration, pitch or roll at encounter wave periods near the peak ship response pitch or roll period from any of the above heading/speed combinations;
• Maximum acceleration, pitch or roll at encounter wave periods near the tank natural period from any of the above heading/speed combinations;
• Maximum acceleration, pitch or roll at encounter wave periods between the above periods from any of the above heading/speed combinations.
The maximum sloshing loads are found by searching for ship motion conditions which produce the worst sloshing motions when combined with the tank natural period. In practice, the maximum ship motions along the 40-year North Atlantic contour would be computed. In addition, the sloshing loads at the tank natural period, plus and minus 1 second, should be considered. If the client has software which couples the ship and cargo motions, then (as with model tests which are coupled) Lloyd’s Register would advise searching along the 40-year North Atlantic contour to find the maximum sloshing loads. The maximum ship motion may generally be determined from the pitch and roll motion for sea-state comparisons. However, the other components should not be neglected; the relative importance of these respective motions is generally: pitch, roll, sway, surge, heave and yaw. Lloyd’s Register considers that at least the first four should be addressed. Typically the maximum response at the peak ship response period and the maximum response at the tank natural period will not excite the maximum sloshing response. This will be excited by responses at periods between the two as shown by the circled markers in Figures 3 and 4. Hence there is a requirement to review such additional wave periods. Computer simulations of fluid motions, by CFD methods, can provide additional information by which the number of critical cases may be refined. 4.3 Sloshing Analysis Sloshing analyses to investigate the strength of the inner hull supporting structure are to be carried out using the Level 3 approach in Reference [1]. This utilises the ship motion responses discussed
Lloyd’s Register 8

Comparative Sloshing Analysis of LNG Ship Containment Systems, April 2005
above, together with the natural periods of the liquid in the tank. These periods are computed at each selected fill level using software with capabilities similar to the Lloyd’s Register ShipRight Sloshing software. Typical results for rigid body responses and tank natural periods (TNP) are compared in Figures 3 and 4. The TNP is the period at which the fluid in a tank is in resonant motion. These periods, predominantly in the transverse and longitudinal directions, are determined by the tank dimensions and fill heights. The ship also has natural periods (SNP) in each of its six degrees of freedom. The proximity of the TNP to the SNP indicates the likelihood that significant dynamic magnification of the tank fluid may be expected. Experience indicates that the likelihood is high where:
a) The natural rolling period of the ship (SNP) and the tank fluid (TNP) lie within a 5 second interval, or
b) The natural pitching periods of the ship and the tank fluid lie within a 3 second interval.
Where either of these simple criteria is satisfied, the intervals between the respective SNP and TNP for pitch and roll are sub-divided and the corresponding ship responses computed from the rigid body and irregular wave modules. The peak response data for irregular motions may then be applied to CFD methods to provide indications of potential sloshing characteristics. As an additional precaution, sloshing performance is to be assessed near the second harmonic of the TNP, since this has been established, from experience, as a potential cause of severe sloshing.
Figure 3 Tank Natural Period (Pitching) v. Calculated Ship Motions
0 1 2 3 4 5 6 7 8
H1/10 Pitch Amplitude Pitching response
Head Sea
5 7 9 11 13
TankNaturalPeriod
Quartering
Beam Sea
Encounter Wave Period
The circled markers indicate key conditions for sloshing motion assessment
Lloyd’s Register 9

Comparative Sloshing Analysis of LNG Ship Containment Systems, April 2005
Wave Encounter FrequencyH1/10 Rolling
Figure 4 Tank Natural Period (Rolling) v. Calculated Ship Motions
■ Section 5: Phase III: CFD Analysis of Critical Cases CFD tools may be used to compute sloshing performance, such as fluid trajectories and wall pressures, due to sloshing impacts. CFD methods are used primarily to reduce the size of the matrix of cases to be studied at model scale and to assist in initial placement of pressure and load sensors. Two approaches to modelling sloshing with CFD tools are to be found:
a) the “Marker and Cell” (MAC) method based on finite difference schemes. The cells are generally made as square as possible while being arranged within the tank boundaries in a uniform rectangular mesh. Such methods have been used for sloshing analysis of liquid cargo tanks for many years.
b) 3-D approaches using Reynolds’ Averaged Navier-Stokes (RANS) codes. Such codes are
now emerging within the industry. The critical cases of ship motion responses derived in Phase II by calculation or model testing permit a set of equivalent regular wave conditions to be identified which give motions equivalent to the magnitude of the maximum irregular motions.
The equivalent regular wave is proposed as a means of permitting manageable CFD computations to be performed in a representative manner. It is determined from irregular ship motions calculations at various headings for a given wave spectrum and for a full scale equivalent duration of three hours. From the highest 10% of the response data, the most probable maximum response and its corresponding period (Tp) can be derived. Such maximum values are extracted for Pitch, Surge, Yaw and Roll (see Section 4, Critical Cases) respectively and may be expected to be close to the 1/1000 maximum expected value. Sway and yaw motions may be combined when generating sloshing rig motions.
The sloshing analysis stage may be summarised as follows:
• Using computed or measured data for the critical motion and acceleration responses, perform CFD sloshing analyses for both the project larger ship design and the “control” ship at different filling levels;
• Select a few of the most critical cases from the CFD studies with regular motion responses and perform irregular CFD analyses.
The CFD results may be used to define a series of model-scale tests for a 4, 5 or 6-degree of freedom test rig subjected to the irregular motions derived in Phase II.
0.0 2.0 4.0 6.0 8.0
10.0 12.0 14.0 16.0
TankNatural
The circled markers indicate key conditions for sloshing motion assessment
Period
Head Q'trBeam
4 6 8 10 12
14Rolling Amplitude
Lloyd’s Register 10

Comparative Sloshing Analysis of LNG Ship Containment Systems, April 2005
■ Section 6: Phase IV: Model Scale testing
odel scale tests are considered to be an essential part of the comparative assessment approach for
.1 Requirements for Model Test Rig
odel tests are to be conducted using water-filled, plastic, glass or steel vessels fitted with ig is to be
he motions for each axis of the rig are determined by combining the response amplitude operators
be
ce
he test rig must be capable of performing the requested irregular motion of the tank which may tly
,
s.
he model tank must be rigid with its highest structural eigenperiod well below the expected slamming
.2 Data Capture Requirements
ressure transducer locations may initially be determined from the CFD studies of Phase III. Visual
cur at the
ecordings are to be taken for a minimum of 5 hours for each condition. However, in practice, this of
.3 Statistical Analysis of Measured Data
he principal quantities measured in the model tests are time series pressures in areas of highest be
Msloshing loads since the available CFD tools are considered to be less accurate in modelling the complex fluid flow and wall-interaction processes observed in membrane-type cargo tanks. 6 Mcombinations of pressure transducers, force plates and video observation equipment. The rcapable of being driven in at least four degrees of freedom (pitch, surge, roll and yaw) using time-series signals derived from the seakeeping analyses of Phases I and II. Froude scaling is used to transform the ship scale motion amplitudes and time scales to the model scale. Tfrom the ship motion studies with the sea-state wave spectrum to produce the tank motion response spectra. A Fast-Fourier algorithm may then be used to generate the irregular time histories of the motion on each axis. A random motion signal which does not repeat in the period of excitation mayobtained by starting the time-series generation process with a random ‘seed’ value. Care must be taken to avoid errors in the relative phases of the motions, particularly between surge and pitch, sinsome tests have shown a great sensitivity to such errors. Tinclude large accelerations and forces. The forcing mechanisms must not be influenced significanby the inertia of the tank and the sloshing forces, in order to comply with the prescribed motions. Alsothe maximum possible translation and rotation amplitudes of the rig must be larger than the prescribed maximum motion amplitudes. The response of the sloshing rig is to be compared with the input motion signals which drive the rig in order to confirm that the tank is executing the desired motion Tload duration. Force panels or pressure cells are to measure mean forces or pressures over an area consistent with the main structural elements such as the mean distance between stiffeners or the ‘footprint’ of an insulation box. 6 Pobservations of free surface movements during the tests may be used to refine the transducer positions. The transducers may be triggered at a pre-set pressure threshold and sampled at frequencies not lower than 20 kHz in order to capture the short impulsive peaks which can ocstart of a sloshing impact pulse. All pressure pulse and force panel data in the time interval after the pressure trigger level has been exceeded should be stored for analysis and, where possible, should be linked to video data in order to link visual aspects of sloshing impacts to pressure pulse characteristics and force panel loads. Rmay not allow sufficient impacts to be observed and thus may inhibit meaningful statistical analyses the data. It is thus advisable to perform several 5-hour runs, each with a new randomising ‘seed’ number, in order that sufficient impacts are recorded. 6 Tsloshing impacts. These data are stored and analysed to extract averages and maxima which can analysed in a statistical manner as given below:
Lloyd’s Register 11

Comparative Sloshing Analysis of LNG Ship Containment Systems, April 2005
a) Scaling the model pressures to ship scale. At present it is conventional to apply Froude iate
b) nalysing each recorded pressure pulse to extract characteristics features from the impact d
c) rom each 5 hour run, forming statistical measures such as:
Pmax The maximum value of the measured impact pressures
d) hese data are then accumulated from series of 5-hour runs and fitted with Weibull or Log-
e) he pressure value with a probability of exceedence of .001 (1/1000 occurrences) is obtained
Section 7: Phase V: Design Assessment
he design assessment phase for a new design of a large LNG membrane containment system is
ew
he principal quantities involved in the comparative assessment process are the statistical measures
bsolute values of pressures and forces are not used for final design assessments since uncertainties
• the applicable the scaling laws; ank boundaries;
nd hull rigid body motions.
scaling to the whole pressure signal. However, there is much debate about how approprand how conservative such an approach may be. Full scale comparative data is required in order to fully resolve this issue. Atime-series such as the Pmax value, the dominant slopes within the pressure time-series anlocal averages of parts of the signal in sub-intervals related to the natural frequency of the containment system. F
P10 The mean of the 10 highest impact pressures P1/10 The mean of the 10% highest impact pressures TNormal probability functions. Tfrom the probability function which provides a best fit to the data in the region of the highest pressures.
■ Tobtained by comparing the significant statistical values for the maximum pressure obtained from model tests in which the critical ship motions have been simulated. The statistical values for the ndesign should not exceed those determined for an existing design which has been proven in service. Tfor maximum pressures and forces measured on the model tank boundaries and scaled by the Froudemethod to ship scale. Froude scaling is adopted as a conservative measure. Aexist within the industry concerning the influences of:
• hydro-elastic effects at the fluid-t• cushioning effects from vapour entrapment; • coupling effects between tank fluid motions a
Lloyd’s Register 12

Comparative Sloshing Analysis of LNG Ship Containment Systems, April 2005
Chapter 2: CFD Modelling
1. Objectives 2. CFD Models ■ Section 1: Objectives CFD modelling investigations are carried out to provide details of fluid motions within the cargo tanks with the following objectives:
• to allow a preliminary assessment of the critical motions cases and refinement of the test matrix for the measurement of tank sloshing loads at model scale;
• to provide preliminary information for locating pressure and load transducers during model
testing in order to capture the peak sloshing pressures and loads;
• to provide a means, in conjunction with model test results, of specifying loading data with which to determine that stress levels and buckling capabilities of primary structures, under the applied static and dynamic loads, are within acceptable limits.
■ Section 2: CFD Models CFD models in current use within the Marine industry range from relatively simple 2-dimensional methods to the more complex 3-dimensional Reynolds-Averaged Navier-Stokes (RANS) codes. Significant effort is being expended within the industry to verify the accuracy of the RANS codes against experimental data. The simpler 2-dimensional methods are limited both in the number of hull motion components which can be considered and in their ability to model the more complex interactions which occur with bore-type sloshing waves and irregular motions. Problems also occur in defining adequate mesh sizes and distributions with which to model the tank boundaries. Such models, however, are quick to run and hence a large number of excitation cases can be considered in a reasonable time scale. Modern general purpose RANS codes are not subject to the limitations of 2-dimensional models; mesh sizes and distributions can be fitted to the tank shapes and can be refined in areas of particular interest. The analysis of sloshing flows induced by irregular motions requires long processing times even on fast computers. The validation of such codes requires access both to good visual observations of the various sloshing phenomena observed at partial fills and to extensive wall pressure measurements. At present, such data, where it exists, applies only to model scales which range from about 1/70 to 1/20 of ship scale. Full scale ship data is necessary in order to allow accurate scaling from model to ship.
Lloyd’s Register 13

Comparative Sloshing Analysis of LNG Ship Containment Systems, April 2005
Chapter 3: Model Testing
SECTION 1 1. Introduction 2. Objectives 3. Test Rig requirements 4. Testing Methodology 5. Data Processing ■ Section 1: Introduction Sloshing in membrane tanks of LNG ships is a complex process which, at present, is more accurately simulated by scaled model testing than by computation. Model tests are also more efficient in allowing long term estimates of peak pressures to be derived. CFD studies can identify trends. However, only model tests, at present, can provide accurate statistical data on fluid impact loads. ■ Section 2: Objectives
The objectives of scaled model testing are:
• to assess the tank sloshing performance in the most critical cases of cargo motions derived from hull motions calculations for simulated operation in irregular waves;
• to provide measured pressure time-histories and statistical measures of the maximum
pressure loads induced during a series of simulated short term irregular sea states; • to verify that the sloshing pressures, on the boundaries of the cargo tank under consideration,
are no greater than measured on an agreed basis design; • to provide loading data with which to determine that stress levels and buckling capabilities of
primary structures, under the applied static and dynamic loads, are within acceptable limits. ■ Section 3: Test Rig requirements
Sloshing tests have largely been conducted on model scale rigs limited to 2 degrees of freedom, most commonly pitch and surge or roll and sway. In 2003 Marintek, Norway, configured a 4-degree of freedom system (pitch, surge, roll and sway) adapted to an existing towing tank carriage located above a small towing tank. Tests with water-filled models of membrane tanks were conducted in air. A 6-degree of freedom system was installed by GTT in 2004 and validation testing was initiated in February 2005. The principal requirements for such test rigs are:
• To accommodate membrane tanks to a scale not less than 1/70; • To generate scaled irregular ship motions at the centroid of the tank, specified as time series,
simulating at least 4-degrees of freedom; namely, pitch, surge, roll and sway;
Lloyd’s Register 14

Comparative Sloshing Analysis of LNG Ship Containment Systems, April 2005
• To accommodate maximum displacements, velocities and accelerations which are larger than the maxima expected for the respective motion time-series for hull motions computed or measured for irregular waves;
• To reproduce the motions, specified as time-series, from sea-keeping tests or calculations in
irregular waves in an accurate and verifiable manner; • To use tank models of a sufficiently rigid construction that boundary impact processes do not
significantly influence the measured time-series pressures recorded during the maximum sloshing impacts;
• To allow video observations of the cargo motions which contribute to the highest sloshing
loads. ■ Section 4: Testing Methodology
The testing methodology for assessing sloshing loads relates to a process by which locations and details of the maximum sloshing induced pressure loads are determined accurately for a given large LNG design and are compared with equivalent results from an existing proven design for a 135,000 ~ 140,000 m3 ship. Such data are used to provide long term statistical estimates of peak pressures and containment loads for a larger design. The model tests should seek to identify the dominant sloshing responses to the critical irregular motions conditions. Indications of such conditions, for varying fill heights, may be identified using the analysis procedures discussed in Chapter 1, Sections 4 and 5. The model test thus consists of a series of runs, each covering 5 hours at full scale. Irregular time-series motions are generated for the selected tank location and are applied to the actuating mechanisms of the sloshing rig, thus simulating motions in each of the applicable degrees of freedom. The time-series are derived from computed or measured spectra for tank motion responses. These spectra are obtained by combining the response amplitude operators for ship motions with wave spectrum data. Pressure time-series, obtained by sampling at not less than 20 kHz, and video observations should be stored for analysis. Data storage may be triggered by a peak-over-threshold process in which the time-series data is monitored continuously. The time-series is stored when a part of the pressure signal exceeds a predefined threshold value. The length of the stored record should be sufficient to include the pressure peak durations at adjacent transducers in a cluster. Multiple runs may be necessary for the same conditions in order to ensure that sufficient data has been obtained for stable measures of the statistical pressure maxima to be derived. Each test is then repeated using a new motion time-series derived using a different random seed value. Many pressure transducer locations should be provided in the tank, based on CFD analysis and visual observations from run to run. Transducer locations may be changed in order to ensure that the maximum pressures are detected. Vibration transducers may also be placed on the exterior walls of the tank in order to gauge the response of the wall material to hydro-elastic influences of sloshing impacts. ■ Section 5: Data Processing
The stored pressure and vibration data may then be analysed in a variety of ways, and visual observations of the sloshing impacts may offer insights into relationships between pressure and wave impact characteristics. The pressure peaks may be counted by applying a peak-over-threshold approach involving a moving time window in which the dominant peak is derived. Other peaks in a given window may be treated as
Lloyd’s Register 15

Comparative Sloshing Analysis of LNG Ship Containment Systems, April 2005
originating from secondary events. The threshold value is required to be determined so that peaks due to noise are omitted while sufficient data is accumulated to ensure statistical relevance. The threshold approach involves subtracting the threshold value from the time-series, effectively cutting of the lower part of each oscillatory segment of the signal. The up-crossing points may then be determined, between which the peaks may be found. The maximum peak in any given window is counted as a dominant impact peak. The following averages and maxima of the sloshing peaks may then be formed:
Pmax The maximum value of the measured impact pressures; P10 The mean of the 10 highest impact pressures; P1/10 The mean of the 10% highest impact pressures.
Accumulations of such measures over a sufficient series of repeated 5-hour runs may then be fitted with Weibull or Log-Normal probability functions in order to determine exceedence levels. The curve-fitting process should be weighted towards the high-amplitude portion of the data sample in order to ensure accurate estimation of exceedence levels. In addition to these measures, the energy levels within the time series data may be computed and compared.
Lloyd’s Register 16

Comparative Sloshing Analysis of LNG Ship Containment Systems, April 2005
References
1) ShipRight - Structural Design Assessment – Sloshing Loads and Scantling Assessment.
2) International Association of Classification Societies Recommendation 34 – Standard Wave Data.
Lloyd’s Register 17

Comparative Sloshing Analysis of LNG Ship Containment Systems, April 2005
Appendix 1: Summary of Sloshing Analysis Requirements: Computations and Model Scale Investigations 1. Procedure for determining ship motions An overview of the procedure for determining the worst ship motion for sloshing loads is described in Table 1. Ship motions calculations should be performed with verified and validated seakeeping software in order to provide the ship motions data for irregular wave systems from which to determine the maximum sloshing loads. The results of such ship motions analyses should provide:
• maximum motion and acceleration in pitch, sway and roll at encounter wave periods near the pitch or roll natural period from any of the above heading/speed combinations;
• motion and acceleration in surge and pitch, sway and roll at encounter wave periods near the
tank natural periods in the longitudinal and transverse directions, respectively. It should be noted that the tank natural period changes with fill height. The responses are to be considered from any of the above heading/speed combinations;
• motion and acceleration in surge, pitch, sway and roll at encounter wave periods between the
above periods from any of the above heading/speed combinations. The maximum sloshing loads require searching for ship motion conditions which produce the worst scenario when combined with the tank natural period. If the client has software which couples the ship and cargo motions, then (as with model tests which are coupled) Lloyd’s Register would advise searching along the 40-year North Atlantic contour to find the maximum sloshing loads. The yaw contribution should be included in the sway response in the No. 2 and No. 5 tanks. The lever arm for the corresponding sway response calculation is taken as the distance between the centres of gravity of the ship and the respective tank. Typically the maximum response at the peak ship response period and the maximum response at the tank natural period will not excite the maximum sloshing response. This will be excited by a response at a period between the two; hence there is a requirement to review additional wave periods. Having found the set of wave periods for maximum response, it is then necessary to determine a corresponding set of equivalent regular waves so that the phase relationship of the ship motion responses can be determined. 2. CFD Sloshing Analysis CFD calculations may be made on a comparative basis using measured or computed ship motions together with tank geometries of previous satisfactory designs as references. Such calculations have normally been based on 2-dimensional CFD codes using a sequence of 1-degree of freedom calculations. Where 3-dimensional codes exist and have been verified, increased numbers of the degrees of freedom may be considered. Degrees of Freedom: Of the 6 degrees of freedom involved, at least pitch, roll, sway, surge and yaw should be considered. Pitch dominates high fills, while sway dominates low ballast fills. Time interval: Within the calculations, a sampling frequency of at least 1 kHz (∆t=1msec ) should be considered. However, the optimum depends on the ability of the calculations to converge. Pressure Locations: Impact pressure locations should be determined in the regions of highest pressures. These are dependent on the liquid motions. CFD has the advantage of providing output as
Lloyd’s Register 18

Comparative Sloshing Analysis of LNG Ship Containment Systems, April 2005
contours of pressure and hence may be determined during the post-processing stage of the calculations. For normal filling ranges, from 70%H to 98%H, the maximum pressures occur on the top surface of the tank membrane and in the upper corners between the side, top and transverse walls Excitation time: It has been determined from model tests that 5 hours is the recommended minimum for computations using irregular ship motions since this is the normal simulation time in model tests. Comparisons may be made based on any of the following statistical values derived from the CFD analysis:
• Pmax: maximum value of the impact pressures (determined from peak and mean pressures) • P10: mean of the 10 highest impact pressures • P1/10: mean of the 1/10 highest impact pressure
P1/10 is regarded as the most useful output. 3. Sloshing Rig Model Tests Lloyd’s Register recommends the use of a captive rig for partial fill studies of sloshing. The rig should accommodate a model tank to a scale not less than 1/70 and should be activated simultaneously in at least the following 4 degrees of freedom: pitch, roll, sway and surge. The rig motions should be irregular and these may be computed or measured. Pressure sensors or load cells should be installed in the regions of highest pressure as indicated by CFD calculations or through adjusting the locations during preliminary tests. The pressure transducers should be sampled at 20 kHz or above in order to capture short time-duration peaks in the pressure time series, while the test durations should be at least 3 hours (ship scale), although 5 hours has been deemed necessary in some cases. Several 3-hour tests should be made using random starting parameters for each ship motion setting. Time series records of the pressure impacts should be analysed to provide characteristics of the impact traces and to allow statistical measures to be established for the probabilities of exceeding values of pressure in a 3-hour period. Video recordings may also be of use in categorizing the more large-scale sloshing characteristics of the fluid-structure interactions during impacts.
Lloyd’s Register 19

Comparative Sloshing Analysis of LNG Ship Containment Systems, April 2005
Table 1: Ranges of Speeds, Headings and Sea-states
Lloyd’s Register procedure Comment Tank selection Full width tank with highest ship
motions Generally tank No. 2 of a 4-tank ship or tank Nos. 2 and 5 of a 5-tank ship. The No.1 tank of a 4-tank membrane LNG ship is rectangular and is normally excluded due its reduced length. However, LLNG ships which include a tapered No. 1 tank should also include this tank in the sloshing analysis.
Loading condition selection
Two loading conditions: a) Fully loaded condition (No 2 or No. 5 cargo tanks
partially filled; other cargo tanks full);
b) Ballast condition (No 2 or No. 5 cargo tank
partially filled; other cargo tanks empty).
Partial fill in more than one tank is not a valid loading condition. Cargo would normally be transferred between tanks to ensure high fill heights in as many tanks as possible.
Wave environment
40-year wave envelope derived from the scatter diagram in the IACS Guideline for the North Atlantic (No 34)
This wave environment is commonly accepted as the standard within the marine industry.
Ship speed Four cases: - Full service speed. - 2/3 of the service speed. - 5 knots. - 0 knots (damaged condition).
Representing: - normal design operating condition. - speed reduction in waves exceeding 5m
(significant height). - operation in extreme weather (significant
wave height > 10m). - blackout or shaft-line failure conditions
Wave heading Wave headings from head seas to following seas in increments of 15 degrees
The 15-degree increment is a compromise between fine grid resolution and efficient computation time.
Tank fillings Five high-fill cases are considered: 95%, 90%, 85%, 80%, 70% of tank height; One case at a low fill level in a 5-tank large LNG is considered: 10%L
The worst GM value should be considered amongst the partial fill-heights and between the departure and arrival conditions.
Ship motion responses in irregular waves are to be computed and reviewed for a range of sea states in order to determine the worst tank sloshing responses.
The short term ship motions of acceleration and roll are to be determined for the combinations of speed, heading and sea state shown in Table 2. For sea-state comparisons, it is necessary to review the sensitivity to wave period and wave height.
Head sea
Normally the worst occurrence of vertical motion response in the range 150 to 180 degrees.
Beam seas
90 degrees: gives strong response in the transverse direction ( sway, yaw and roll)
Worst condition selection
Quartering seas The headings which gives the worst ship motion response; normally from 15 to 75 degrees and 105 to 150 degrees.
Wave spectrum The Pierson-Moskowitz spectrum is to be used to model wave environment in the North Atlantic or any open ocean areas.
Normally, short crested waves with a χ2
distribution are assumed. (Gamma=1.0 may be used for comparisons). For the North Atlantic, a cosine squared spreading function is assumed.
Lloyd’s Register 20

Comparative Sloshing Analysis of LNG Ship Containment Systems, April 2005
Table 2: Ranges of Speeds, Headings and Sea-states
Heading (Sea direction)
Heading (Degrees)
Sea-state (Significant Wave Heights)
If Hs ≤ 5m If 5m <Hs ≤ 10m If Hs > 10m
All possible wave periods below the 40-year North Atlantic wave Contour
Stern sea 0 *All speeds 2/3 V **Not required
Stern quartering sea 15, 30, 45, 60, 75 *All speeds 2/3 V **Not required
Beam sea 90 *All speeds 2/3 V Zero speed
Bow quartering sea 105, 120, 135, 150 *All speeds 2/3 V **Not required
Head sea 150, 165, 180 *All speeds 2/3 V 5 knots
Notes: **Ship motion calculations can be omitted for 2/3 service speed and Hs = 5m since higher responses are obtained at this speed for significant wave heights between 5 and 10m **The ship is considered to operate in the highest sea states under slow speed in head seas and at zero speed , under blackout conditions in beam seas.
Lloyd’s Register 21