Embed Size (px)
Citation preview

Comparative Metagenomics Reveals Host SpecificMetavirulomes and Horizontal Gene Transfer Elements inthe Chicken Cecum MicrobiomeAni Qu1, Jennifer M. Brulc1, Melissa K. Wilson1, Bibiana F. Law2, James R. Theoret2, Lynn A. Joens2,
Michael E. Konkel3, Florent Angly4,5, Elizabeth A. Dinsdale4,6, Robert A. Edwards4,7,8, Karen E. Nelson9,
Bryan A. White1,10*
1 Department of Animal Sciences, University of Illinois, Urbana, Illinois, United States of America, 2 Department of Veterinary Science and Microbiology, University of
Arizona, Tucson, Arizona, United States of America, 3 School of Molecular Biosciences, Center for Biotechnology, Washington State University, Seattle, Washington, United
States of America, 4 Department of Biology, San Diego State University, San Diego, California, United States of America, 5 Department of Computational Science, San
Diego State University, San Diego, California, United States of America, 6 School of Biological Sciences, Flinders University, Adelaide, Australia, 7 Center for Microbial
Sciences, San Diego State University, San Diego, California, United States of America, 8 Department of Computer Sciences, San Diego State University, San Diego,
California, United States of America, 9 The J. Craig Venter Institute, Rockville, Maryland, United States of America, 10 The Institute for Genomic Biology, University of
Illinois, Urbana, Illinois, United States of America
Abstract
Background: The complex microbiome of the ceca of chickens plays an important role in nutrient utilization, growth andwell-being of these animals. Since we have a very limited understanding of the capabilities of most species present in thececum, we investigated the role of the microbiome by comparative analyses of both the microbial community structure andfunctional gene content using random sample pyrosequencing. The overall goal of this study was to characterize thechicken cecal microbiome using a pathogen-free chicken and one that had been challenged with Campylobacter jejuni.
Methodology/Principal Findings: Comparative metagenomic pyrosequencing was used to generate 55,364,266 bases ofrandom sampled pyrosequence data from two chicken cecal samples. SSU rDNA gene tags and environmental gene tags(EGTs) were identified using SEED subsystems-based annotations. The distribution of phylotypes and EGTs detected withineach cecal sample were primarily from the Firmicutes, Bacteroidetes and Proteobacteria, consistent with previous SSU rDNAlibraries of the chicken cecum. Carbohydrate metabolism and virulence genes are major components of the EGT content ofboth of these microbiomes. A comparison of the twelve major pathways in the SEED Virulence Subsystem (metavirulome)represented in the chicken cecum, mouse cecum and human fecal microbiomes showed that the metavirulomes differedbetween these microbiomes and the metavirulomes clustered by host environment. The chicken cecum microbiomes hadthe broadest range of EGTs within the SEED Conjugative Transposon Subsystem, however the mouse cecum microbiomesshowed a greater abundance of EGTs in this subsystem. Gene assemblies (32 contigs) from one microbiome sample werepredominately from the Bacteroidetes, and seven of these showed sequence similarity to transposases, whereas theremaining sequences were most similar to those from catabolic gene families.
Conclusion/Significance: This analysis has demonstrated that mobile DNA elements are a major functional component ofcecal microbiomes, thus contributing to horizontal gene transfer and functional microbiome evolution. Moreover, themetavirulomes of these microbiomes appear to associate by host environment. These data have implications for definingcore and variable microbiome content in a host species. Furthermore, this suggests that the evolution of host specificmetavirulomes is a contributing factor in disease resistance to zoonotic pathogens.
Citation: Qu A, Brulc JM, Wilson MK, Law BF, Theoret JR, et al. (2008) Comparative Metagenomics Reveals Host Specific Metavirulomes and Horizontal GeneTransfer Elements in the Chicken Cecum Microbiome. PLoS ONE 3(8): e2945. doi:10.1371/journal.pone.0002945
Editor: Niyaz Ahmed, Centre for DNA Fingerprinting and Diagnostics, India
Received March 10, 2008; Accepted July 14, 2008; Published August 13, 2008
Copyright: � 2008 Qu et al. This is an open-access article distributed under the terms of the Creative Commons Attribution License, which permits unrestricteduse, distribution, and reproduction in any medium, provided the original author and source are credited.
Funding: These studies were supported by the Food Safety Research Response Network, a Coordinated Agricultural Project, funded through the NationalResearch Initiative of the USDA Cooperative State Research, Education and Extension Service, Grant number ##2005-35212-15287. The funders had no role instudy design, data collection and analysis, decision to publish, or preparation of the manuscript.
Competing Interests: The authors have declared that no competing interests exist.
* E-mail: [email protected]
Introduction
Microorganisms and their complex microbial communities are
responsible for most of the biochemical transformations in the
environment. The gastrointestinal tract of animals harbors a large,
complex, and dynamic microbial community, and the composition
of this community ultimately reflects the co-evolution or selection
of microorganisms with their animal host and the diet adopted by
the host. As a result of issues that relate to food safety and animal
nutrition and health, the structure and function of the gut
microbial community has received significant attention from
researchers. The majority of these microbial species cannot be
PLoS ONE | www.plosone.org 1 August 2008 | Volume 3 | Issue 8 | e2945

cultured under traditional culturing techniques, and therefore, we
have a very limited understanding of the capabilities of most
species. More recently, with the introduction and growth of
molecular tools in microbial ecology, many culture-independent
methods have developed to overcome the cultivation biases and
allow detailed information on microbial community diversity,
structure, and function. The use of the small subunit (SSU) rRNA
gene as a phylogenetic marker to study bacterial and archaeal
diversity, as well as the composition of various environments and
natural communities has resulted in tremendous quantities of
information about microbial communities. Nonetheless, these
techniques have revealed limited information on the physiological
role that is played by individual species that have been identified
by SSU rDNA sequencing. SSU rRNA gene surveys continue to
expand, and as of 2008 the Ribosomal Database Project (RDP;
http://rdp.cme.msu.edu/) holds an estimated 481,650 aligned
and annotated 16S rRNA gene sequences, demonstrating the
extent of microbial diversity in the environment and hinting at
what remains to be discovered.
The sequencing of the genomes from several hundred microbial
and numerous eukaryotic species has laid the foundation for
generating genomic sequence data from whole environments
without first using a culturing step. This approach, also known as
‘‘metagenomics’’ [1], is defined as the genomic analysis of
microorganisms by direct extraction and cloning of DNA from
an assemblage of microorganisms [1]. Pyrosequencing is the base
for a promising new generation sequence technology developed by
454 Life Sciences (http://www.454.com/) [2–5] and is now being
applied to metagenomics. One approach has been the use of the
pyrosequence technology to increase the depth of SSU rDNA
surveys by sequencing amplicons from the variable region of the
SSU molecule. This has been applied to ocean microbial samples
[6], soils [7], and was recently used in a multiplex pyrosequencing
study of 286 enviornmental samples that generated 437,544 SSU
rDNA tags, nearly as many as have already been generated by
Sanger sequencing [8]. The second approach uses random sample
pyrosequencing to generate environmental gene tags (EGTs
(protein families [9]) from microbiomes. This approach allows
one to highlight significant differences in metabolic potential in
each environment. This has been applied to environmental biomes
[10] as well as the gastrointestinal microbiomes of C57BL/6J mice
with or without a mutation in the leptin gene [11], and was
recently used to analyze ,14 million pyrosequences from 45
distinct microbiomes and 42 viromes [12], including the ones
analyzed in detail in this study.
While the cloning and sequencing of SSU rDNA, T-RFLP and
array based-OFRG has been used to describe the microbial
communities of the gastrointestinal tracts of poultry [13–27], the
functional gene content of these microbiomes has not been
studied. One area of interest is the role of commensal
gastrointestinal bacteria in Campylobacter jejuni colonization of
chickens. Investigators have reported that the use of antibiotic
growth promotants (AGP), which altered the microbiome,
decreased the levels of Campylobacter bacteria in chickens reared
conventionally versus chickens reared without AGP [28]. Specif-
ically, Campylobacter 16S rDNA was detected in the cecal samples of
all AGP-free birds at days 14 and 21, but not in chickens reared
conventionally. C. jejuni colonizes the ceca of chickens at densities
of 108 CFU per gram of cecal contents or greater without causing
disease [29–31]. By two to three weeks of age, most commercially
reared poultry are colonized by C. jejuni [32]. While day-old chicks
can become colonized with C. jejuni when experimentally
inoculated, natural colonization with C. jejuni does not occur until
after 2 to 3 weeks of age [30,33–35]. After C. jejuni colonizes a few
birds in a flock, it rapidly spreads throughout the flock [34,36].
Once colonized with C. jejuni, the bacteria remain present
throughout the bird’s lifespan [30,35]. In fact, 50 to 90% of
domestic chicken carcasses are contaminated at the time of sale
[37,38]. However, we lack a fundamental understanding of how C.
jejuni colonization affects the normal cecal community structure
and visa versa.
In order to expand on these studies, we applied for the first time
to our knowledge, a random sample pyrosequencing approach to
the complex microbiome of the cecum of chickens. Our goal was
to obtain both phylotype and functional gene content, or the
metabolic potential, by a characterization of the microbiome from
a pathogen-free chicken and one that had been challenged by a
single low-level inoculation with C. jejuni. The present study
demonstrates that random sample pyrosequencing can provide
high fidelity gene assemblies from the microbiome, and revealed
that in the chicken cecum, mobile elements are a major functional
component of these microbiomes. It also appears that the genes
associated with virulence or a ‘‘metavirulome’’ of these micro-
biomes cluster by host environment. This suggests that the core
and variable microbiome content in a host species not only
influences the adaptation of mutualistic or commensal microor-
ganisms, but also influences disease resistance to zoonotic
pathogens.
Results
In order to better understand the functional gene content and
metabolic potential in the chicken cecal microbial community, we
undertook a direct large-scale random sample comparative metage-
nomic strategy using 454 pyrosequencing. The overall goal of this
study was to obtain a detailed characterization of the microbiome
using a pathogen-free chicken (cecum A), and one that had been
challenged by a single low-level inoculation with C. jejuni (cecum B),
with respect to both phylotype (ribosomal DNA gene tags) and
functional content (environmental gene tags; EGTs). Similar
relationships (Figure 1 and Table 1) were seen for SSU rDNA hits
against the Ribosomal Database Project (Bacterial SSU rDNA), and
against European Ribosomal RNA databases (Archaeal and
Eukaryotic SSU rDNA). The number of SSU rDNA hits in the
chicken cecum metagenomic libraries (Table 1), are consistent with
the numbers we found for rumen microbiomes [39]. As expected, the
distribution of phylotypes fell predominantly into the Firmicutes,
Bacteroidetes and Proteobacteria (Figure 1), regardless of the SSU rDNA
database used for the analysis. The taxanomic distribution of the
numerically abundant Bacterial Phyla (Actinobacteria, Bacteroides,
Chlorobi, Deferribacteres, Firmicutes, Fusobacteria, Proteobacteria and Verruco-
microbia) were compared between eight poultry cecal SSU rDNA
libraries (Wilcoxon exact test P#0.05) [16,17,20,25–27]. The analysis
was conducted on the percent of sequences showing similarity to each
bacteria phylum, thus normalizing for variance in sequencing depth.
There was no difference between any pairing (P.0.05). While there
was no difference between samples, the percent of sequences showing
similarity in each bacterial group differed (Figure 2). Firmicutes were
the dominant taxa associated with all chicken ceca. Bacteriodes were
highly represented in the Chicken cecum A, Chicken cecum B and
samples from turkey poult ceca [20]. A high abundance of
Actinobacteria was found in the broiler chicken samples [25]. All
other taxa were found in low abundance. We only detected one
Campylobacter SSU rDNA sequence and this was in the cecum B
microbiome, from the chicken challenged with C. jejuni. No Archaeal
and few Eucarya SSU rDNA (,1%) or mitochondria phylotypes (48
and 19 respectively) were identified in our microbiomes, with the
majority most similar to the Chordata (i.e., host).
Chicken Cecal Metagenomics
PLoS ONE | www.plosone.org 2 August 2008 | Volume 3 | Issue 8 | e2945
Further insight into the diversity within the two chicken cecum
metagenomic samples was obtained by comparing the number of
SSU rDNA sequences and EGTs (E value,161025) in different
bacterial phyla (Figure 1). Sequence length is one of the primary
factors in assessing similarity between sequences, and BLAST E
values are dependent on both the length of the query sequence and
the length of the database to which they are being compared [40].
Although this will affect the number of significant sequences found
in the searches by a factor of two or more [41], pyrosequencing
yielded orders of magnitude more sequence per dollar than
comparable Sanger sequencing, more than compensating for these
missing sequences. The sequences missed in our searches are
expected to be randomly distributed, and therefore are not
expected to skew the comparative analysis. Finally, while
classifying EGTs from short pyrosequencing reads has been
challenging, a recent report demonstrates that EGTs as short as 27
amino acids can accurately be classified with an average specificity
ranging from 97% for Superkingdom to 93% for Order [42].
Bacterial specific EGTs represented approximately 97% of the
total EGTs (Table 1) and the distribution of phylotypes fell
predominantly into the Firmicutes, Bacteroidetes and Proteobacteria
groups, regardless of the microbiome analyzed (Figure 1). The
distribution of EGTs from the Bacteria is congruent with the
distribution of SSU rDNA phylotypes, as was found with the
Soudan Mine and rumen microbiome studies [10,39]. Archaeal
EGTs constituted approximately 1% of EGTs in these metagen-
ome libraries (Table 1), matching well with previous estimates of
Archaea numbers in the adult chicken cecum microbiome [23,24].
The majority of Archaeal EGTs correspond to methanogenic
classes with the largest proportion corresponding to the Eur-
yarchaeota (Figure 3). The majority of eukaryotic EGTs (75 and
53%, respectively) were most similar to the Chordata (i.e., host),
Figure 1. Phylogenetic composition of bacterial phyla from pyrosequence 16S rDNA sequences, and environmental gene tags(EGTs) from two pyrosequenced chicken cecum samples. The percent of sequences in each of the bacterial phyla from the chicken cecum Aand B microbiomes is shown. E-value cutoff for SSU rDNA hits for all databases used is 161025 with a minimum length of 50 bp. The BLASTX cutofffor EGTs is 161025.doi:10.1371/journal.pone.0002945.g001
Chicken Cecal Metagenomics
PLoS ONE | www.plosone.org 3 August 2008 | Volume 3 | Issue 8 | e2945

fungi (6 and 12%, respectively) and the Viridiplantae (i.e., feed; 6
and 12%, respectively) (Figure 3). These EGT proportions were
expected from our current knowledge of the chicken cecum
microbiome community structure.
We also used two independent statistical analyses to measure the
diversity in these microbiomes (Table 2). First, we applied
Shannon-Weiner, Simpson’s lambda, and Pielou’s evenness
analyses for measuring species richness and evenness [43] for the
Figure 2. The taxanomic distribution of Bacterial Phylum in eight microbial samples from the cecum of chickens.doi:10.1371/journal.pone.0002945.g002
Table 1. Summary of pyrosequence data from different chicken cecum samples.
Chick cecum A Chick cecum B
Number of sequences 294,682 237,940
Total length of sequences 30,657,259 24,707,007
Ave length of sequences (bp) 104 104
Total coding sequences (EGTs) (% of total sequences) 117,231 (0.38%) 76,424 (0.31%)
Archaea EGTs (% of total EGTs) 951 (0.81%) 847 (1.11%)
Bacteria EGTs (% of total EGTs) 114,074 (97.3%) 74,480 (97.5%)
Broad host range plasmids (% of total EGTs) 1 (0.001%) 2 (0.003%)
Eukarya EGTs (% of total EGTs) 2061 (1.76%) 968 (1.27%)
Plasmids (% of total EGTs) 2 (0.002%) 8 (0.01%)
Virus EGTs (% of total EGTs) 142 (0.12%) 119 (0.16%)
Number of SSU rDNA Hits:
Ribosome Database Project (% of total sequences) 489 (0.002%) 416 (0.002%)
European Ribosomal RNA Database (% of total sequences) 510 (0.002%) 401 (0.002%)
The BLASTX cutoff for environmental gene tags (EGTs) is 161025. E-value cutoff for SSU rDNA hits for all databases used is 161025 with a minimum length of 50 bp.doi:10.1371/journal.pone.0002945.t001
Chicken Cecal Metagenomics
PLoS ONE | www.plosone.org 4 August 2008 | Volume 3 | Issue 8 | e2945

SSU rDNA hits against the European Ribosome Database. We
also used the PHACCS analysis system [44] to estimate the
genotype richness, diversity, and evenness of the different
metagenomes by analyzing random sequences in the two
microbiomes (Table 2). The cecum A microbiome had less
richness and evenness than the cecum B microbiome regardless of
the statistical model. The community structure changes from
logarithmic (chicken cecum A) to lognormal (chicken cecum B). In
Figure 3. Phylogenetic composition of archaeal and eukaryotic environmental gene tags (EGTs) from two pyrosequenced chickencecum samples. The percent of EGTs in each of the archaeal class or eukaryotic division from the two pyrosequenced chicken cecum samplesmicrobiomes is shown.doi:10.1371/journal.pone.0002945.g003
Chicken Cecal Metagenomics
PLoS ONE | www.plosone.org 5 August 2008 | Volume 3 | Issue 8 | e2945
chicken cecum A compared with chicken cecum B, there are a
great number of species (richness; ,3,500 genotypes compared to
,1,900 genotypes), but a higher dominance of some genotypes.
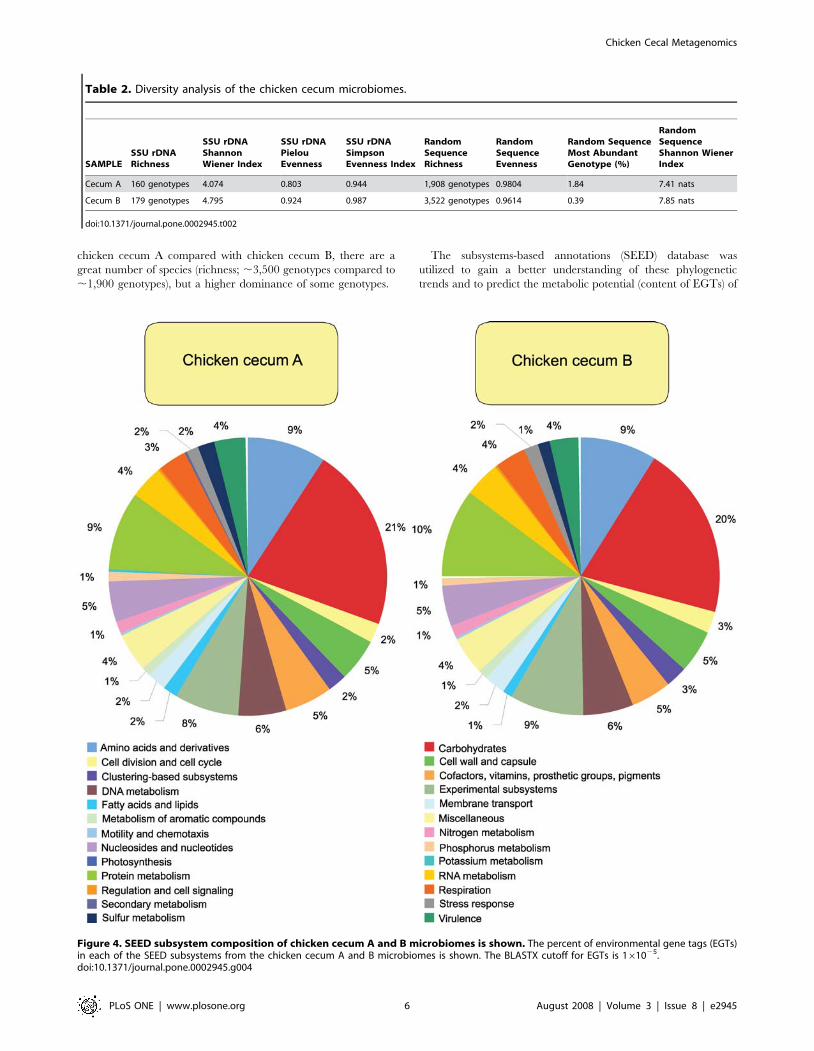
The subsystems-based annotations (SEED) database was
utilized to gain a better understanding of these phylogenetic
trends and to predict the metabolic potential (content of EGTs) of
Table 2. Diversity analysis of the chicken cecum microbiomes.
SAMPLESSU rDNARichness
SSU rDNAShannonWiener Index
SSU rDNAPielouEvenness
SSU rDNASimpsonEvenness Index
RandomSequenceRichness
RandomSequenceEvenness
Random SequenceMost AbundantGenotype (%)
RandomSequenceShannon WienerIndex
Cecum A 160 genotypes 4.074 0.803 0.944 1,908 genotypes 0.9804 1.84 7.41 nats
Cecum B 179 genotypes 4.795 0.924 0.987 3,522 genotypes 0.9614 0.39 7.85 nats
doi:10.1371/journal.pone.0002945.t002
Figure 4. SEED subsystem composition of chicken cecum A and B microbiomes is shown. The percent of environmental gene tags (EGTs)in each of the SEED subsystems from the chicken cecum A and B microbiomes is shown. The BLASTX cutoff for EGTs is 161025.doi:10.1371/journal.pone.0002945.g004
Chicken Cecal Metagenomics
PLoS ONE | www.plosone.org 6 August 2008 | Volume 3 | Issue 8 | e2945

these microbiomes (Figures 4–8). The EGT proportions were also
expected from our current knowledge of the cecal microbiome
community structure. The subsystems are annotated across
genomes and are based on biochemical pathways, fragments of
pathways, and clusters of genes that function together, or any
group of genes considered to be related. Much of this analysis is
dependent on sequence databases, and while we tried to avoid
database bias by using multiple databases and alternative querying
algorithms for analysis, we are aware that some sequences have no
matched relatives in the databases, or are over-represented in the
databases. Further, sequence similarity does not always mean
functional similarity and this may influence the interpretation of
our results as minor sequence dissimilarities may represent
functional different or even a completely new functions. Consistent
with our analysis of 45 microbiomes [12], the chicken cecum
microbiomes are dominated by carbohydrate metabolism, and are
sparsely populated with genes for respiration, reflecting the more
stable anoxic environment in the gastrointestinal tract. Genes
associated with the cell wall metabolism were abundant, as were
virulence genes (Figure 5). To extend this analysis, we applied
statistical methods [45], which compare those subsystems that are
more, or less, represented in the different microbiomes (sample
size of 5,000 proteins, 20,000 repeated samples; p,0.02). Again,
consistent with the higher abundance of Bacteriodetes within cecum
A, this metagenome had higher levels of the following subsystems
when compared with cecum B; Chitin and N-Acetylglucosamine
Utilization, L-Arabinose Utilization, L-Rhamnose Utilization,
Lactose Utilization, Conjugative Transposon from Bacteroidales,
Galactosylceramide and Sulfatide Metabolism, and Ton and Tol
Transport Systems.
When looking solely at the chicken cecum and the SEED
Virulence Subsystem, resistance to antibiotics and other toxic
compounds dominated (55–57%). Resistance to both tetracyclines
and fluoroquinolones represented 25 to 31% of the EGTs in this
subsystem (Figure 6). Cobalt-zinc-cadmium resistance was also
found to be abundant. These antibiotics are used routinely in
poultry production and so their presence is not unexpected, even
though their abundance is striking with respect to the other classes
of virulence genes. The other class of genes, found in both the
DNA metabolism and the virulence categories, are those genes
associated with Bacteroidales conjugative transposons or mobile
DNA elements which are detected in similar numbers to those of
tetracycline resistance (Figures 7 and 8). Consistent with the higher
abundance of Bacteriodetes within Cecum A, this metagenome had
Figure 5. Virulence subsystem composition of chicken cecum A and B microbiomes is shown. The percent of environmental gene tags(EGTs) in each of the virulence subsystems from the chicken cecum A and B microbiomes is shown. The BLASTX cutoff for EGTs is 161025.doi:10.1371/journal.pone.0002945.g005
Chicken Cecal Metagenomics
PLoS ONE | www.plosone.org 7 August 2008 | Volume 3 | Issue 8 | e2945
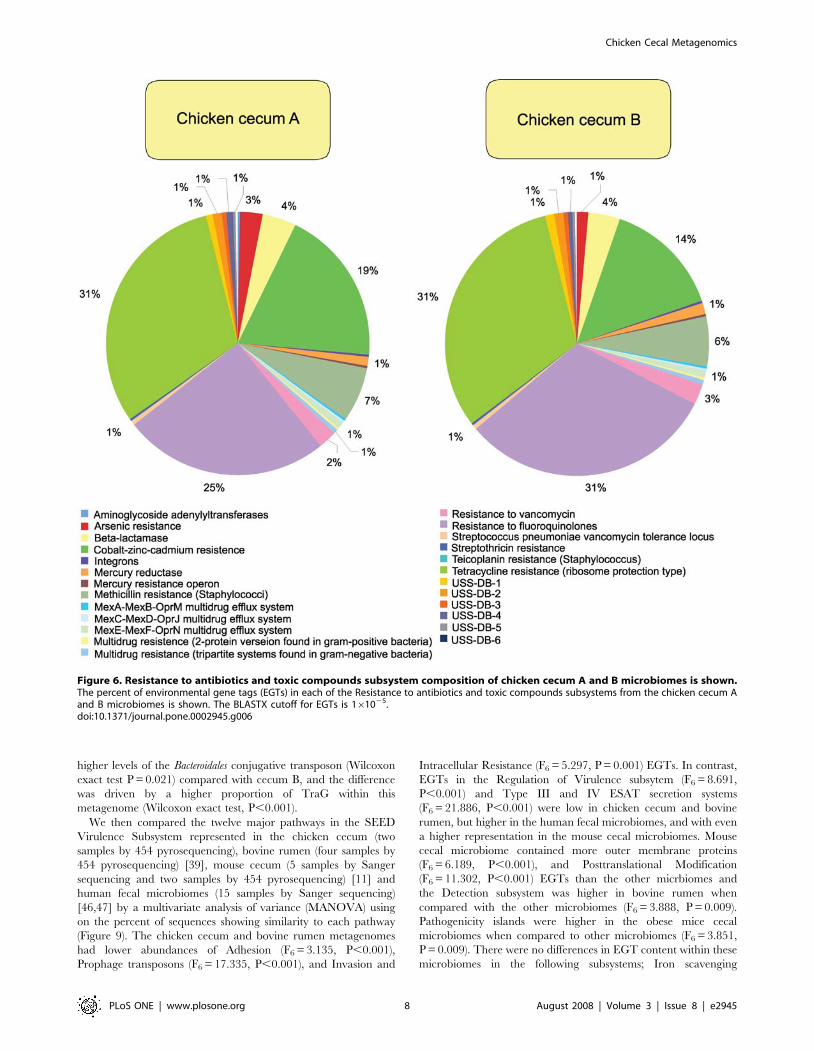
higher levels of the Bacteroidales conjugative transposon (Wilcoxon
exact test P = 0.021) compared with cecum B, and the difference
was driven by a higher proportion of TraG within this
metagenome (Wilcoxon exact test, P,0.001).
We then compared the twelve major pathways in the SEED
Virulence Subsystem represented in the chicken cecum (two
samples by 454 pyrosequencing), bovine rumen (four samples by
454 pyrosequencing) [39], mouse cecum (5 samples by Sanger
sequencing and two samples by 454 pyrosequencing) [11] and
human fecal microbiomes (15 samples by Sanger sequencing)
[46,47] by a multivariate analysis of variance (MANOVA) using
on the percent of sequences showing similarity to each pathway
(Figure 9). The chicken cecum and bovine rumen metagenomes
had lower abundances of Adhesion (F6 = 3.135, P,0.001),
Prophage transposons (F6 = 17.335, P,0.001), and Invasion and
Intracellular Resistance (F6 = 5.297, P = 0.001) EGTs. In contrast,
EGTs in the Regulation of Virulence subsytem (F6 = 8.691,
P,0.001) and Type III and IV ESAT secretion systems
(F6 = 21.886, P,0.001) were low in chicken cecum and bovine
rumen, but higher in the human fecal microbiomes, and with even
a higher representation in the mouse cecal microbiomes. Mouse
cecal microbiome contained more outer membrane proteins
(F6 = 6.189, P,0.001), and Posttranslational Modification
(F6 = 11.302, P,0.001) EGTs than the other micrbiomes and
the Detection subsystem was higher in bovine rumen when
compared with the other microbiomes (F6 = 3.888, P = 0.009).
Pathogenicity islands were higher in the obese mice cecal
microbiomes when compared to other microbiomes (F6 = 3.851,
P = 0.009). There were no differences in EGT content within these
microbiomes in the following subsystems; Iron scavenging
Figure 6. Resistance to antibiotics and toxic compounds subsystem composition of chicken cecum A and B microbiomes is shown.The percent of environmental gene tags (EGTs) in each of the Resistance to antibiotics and toxic compounds subsystems from the chicken cecum Aand B microbiomes is shown. The BLASTX cutoff for EGTs is 161025.doi:10.1371/journal.pone.0002945.g006
Chicken Cecal Metagenomics
PLoS ONE | www.plosone.org 8 August 2008 | Volume 3 | Issue 8 | e2945

mechanism (F6 = 1.03, P = 0.43), Resistance to antibiotics and
toxic compounds (F6 = 1.406, P = 0.258), Toxins and superanti-
gens (F6 = 1.042, P = 0.427).
After a hierarchal clustering analysis, non-dimensional scaling was
then used to determine the relationship between these the
metavirulome of these microbiomes (Figure 10). The abundance of
four virulence pathways differed between organisms and are the
driving factors in the metavirulome clustering. Microbiomes from
chicken cecum and bovine rumen showed a low abundance of EGTs
showing similarity to the Type III and IV ESAT Secretion System,
Invasion and Intracellular Resistance, Prophage Transposons, and
Adhesion and Regulation of Virulence subsystems. The mouse cecal
microbiomes showed the widest level of variation in the abundance of
sequences similar to each subsystem, regardless of sequencing
technology. The adult male and female humans had remarkable
similarity in the abundance of sequences to each subsystem, except
for Male InA which was more similar to the mouse cecal microbiome
due to higher abundances of sequences similar to outer membrane
proteins. The two human subjects from the USA [46] were most
similar to each other, and were not similar to the other adult human
samples from Japan [47]. The human fecal microbiomes from the
two weaned children were similar to the adult signature. The sample
from Child F1U was an extreme outlier and this possibly caused by
low levels of EGTs that showed similarity to the Adhesion and
Posttransitonal Modification subsystems.
The number of sequences that showed similarity to the Bacteroides
transposon group was 541 and 159 in Chicken cecum A and B
respectively, suggesting that they are worthy of investigation.
Chicken cecum metagenomes had the broadest range of genes
within the conjugative transposon subsystem, with 17 genes
represented, however the mice cecum microbiomes had a higher
abundance of sequences similar to transposons. In comparison the
human fecal metagenomes only carried one transposon gene, traF.
The lean mouse cecal microbiome had an average of 10.6 genes and
obese mouse cecal microbiome had an average of 12 genes
represented. One mouse, lean mouse 1, had the highest abundance
of transposon genes. The number of genes represented across the
whole dataset was low, making normalization of the data difficult.
Thus, a non-parametric pairwise T-test was used to describe the
difference between the individual microbiomes. Two genes traE and
Figure 7. DNA Metabolism subsystem composition of chicken cecum A and B microbiomes is shown. The percent of environmentalgene tags (EGTs) in each of the DNA Metabolism subsystems from the chicken cecum A and B microbiomes is shown. The BLASTX cutoff for EGTs is161025.doi:10.1371/journal.pone.0002945.g007
Chicken Cecal Metagenomics
PLoS ONE | www.plosone.org 9 August 2008 | Volume 3 | Issue 8 | e2945

traA were only present in the chicken cecum metagenomes. The
distribution of transposon genes between the two chicken cecum
microbiomes and those in the mouse cecum, human fecal and
rumen microbiomes also differed (Table 3 and Figure 11). Chicken
cecum A was particularly over-represented was traF, traO and traQ in
comparison with Chicken cecum B. In general, the chicken cecum
microbiomes contained a different complement of transposon genes
from the rumen and obese mouse cecum microbiomes. Chicken
cecum B was different to all mouse cecal metagenomes, due to the
low abundance of transposon genes. The lean mouse 1 cecal
microbiome was overrepresented with traF, traP, traM, traG, traL,
traH and was different compared to all other metagenomes. The
other mice cecal microbiomes had a similar distribution of
transponson sequences. Interestingly, the human fecal microbiomes
had either few transposon genes or many transposon genes from this
gene family. Because of this, the human fecal microbiomes, with few
transposon genes, differed from the chicken cecum microbiomes,
whereas the human fecal microbiomes, possessing many transposon
genes, were similar to the chicken cecum microbiomes.
While a limitation of the random sample pyrosequencing
approach is the resulting short read lengths, we were able to
assemble some of these reads into 33 contigs of .500 nucleotides
(32 from cecum A and one from cecum B; Table 4 and Table 5).
Translations of these contigs (EGTs) were used for BLASTX
analysis. The majority of these translations showed similarity with
genes from the Bacteroidetes (20 contigs), the dominant taxa from this
microbiome. Seven contigs shared amino acid sequence similarities
(54 to 100%) with transposases from the Bacteroidetes, confirming the
results from the non-assembled data, two contigs shared sequence
similarity (99 and 100%, respectively) with proteases from the
Bacteroidetes, and seven contigs had sequence similarity with
hypothetical proteins found in Bacteroidetes. In addition, there were
single contig matches for xyulose kinase and L-rhamnose/H+symporter also from the Bacteroidetes. Finally, there was one contig
that exhibited 92% sequence similarity with the BcrA drug efflux
gene from Enterococcus faecalis. The single assembled contig from
chicken cecum B showed 93% amino acid sequence similarity with
a hypothetical protein from Bacteroides ovatus.
Figure 8. Conjugative transposon, Bacteriodales subsystem composition of chicken cecum A and B microbiomes is shown. Thepercent of environmental gene tags (EGTs) in each of the Conjugative transposon, Bacteriodales subsystems from the chicken cecum A and Bmicrobiomes is shown. The BLASTX cutoff for EGTs is 161025.doi:10.1371/journal.pone.0002945.g008
Chicken Cecal Metagenomics
PLoS ONE | www.plosone.org 10 August 2008 | Volume 3 | Issue 8 | e2945

Discussion
The microbiome datasets presented herein represent the first
assessment of the metabolic potential of the chicken cecum
microbiome at the level functional gene content. As such, they
represent a baseline for future studies and will be of great use in
understanding the large, complex, and dynamic microbial
community of the chicken cecum, the composition of which
ultimately reflects the co-evolution/selection of microbes with their
host and diet. It is clear that the composition and function the
Figure 9. The mean (SE) percent of sequences identified within the SEED Virulence Subsystem in the microbiomes from chickencecum, bovine rumen, mouce cecum and human fecal samples.doi:10.1371/journal.pone.0002945.g009
Chicken Cecal Metagenomics
PLoS ONE | www.plosone.org 11 August 2008 | Volume 3 | Issue 8 | e2945

Figure 10. A multi-dimensional representation of the SEED Virulence Subsystem EGTs in the microbiomes from chicken cecum,bovine rumen, mouce cecum and human fecal samples. The groups were divided to create similar group sizes which ensures better statisticaloutcomes. Each subsystem was tested for normality and log transformed where required. A General Linear Model was used with a post hoc Tukey’stest being used to identify group membership. The differences between the subsystem abundance in each organism were then visualized usingproxscal multidimensional scaling (MDS). The MDS was conducted on a single start and required 594 iterations, with Stress value of 0.102. The arrowsindicate the direction in which the proportion of sequences was increasing and was driving the separation between metagenomes.doi:10.1371/journal.pone.0002945.g010
Table 3. The results of a Wiloxon test to compare the abundance of Transposon genes in the chicken cecum, mouse cecum,human fecal and rumen microbiomes.
Chicken A Z Score Significance Chicken B Z score Significance
Chicken A vs. chicken B 23.527 0.000
Human 7 (13665) 23.623 0.000 HumaninM 23.625 0.000
Human8 23.623 0.000 Rumen 710F6 160698 23.623 0.000
HumaninE 23.623 0.000 Human F2 Y 44637 23.622 0.000
HumaninM 23.623 0.000 Human F1 S 36048 23.575 0.000
Rumen 710F6 (160698) 23.622 0.000 Human F2 W 38078 23.480 0.001
Rumen 80F6 (47885) 23.622 0.000 Mouse obese 1 3143 23.290 0.001
Rumen pooled planktonic (60955) 23.622 0.000 Human In A 25759 23.290 0.001
Rumen 640F (662531) 23.575 0.000 Mouse lean 1 3048 23.148 0.002
Mouse obese 454 23.480 0.001 HumaninE 23.009 0.003
Human F1 T 42144 23.480 0.001 Rumen 640F6 62531 22.912 0.004
Human F2 V 44394 23.385 0.001 Human 7 13665 22.819 0.005
Human In R 40935 23.007 0.003 human8 22.819 0.005
Mouse lean 1 (3048) 22.675 0.007 Rumen pooled planktonic 60955 22.818 0.005
Mouse lean 454 22.580 0.010 Rumen 80F6 47885 22.676 0.007
Human F2 Y 44637 22.107 0.035 Human F2 X 37249 22.580 0.010
Mouse obese 1 (3143) 21.918 0.055 Human In D 44036 22.438 0.015
Human F2 X 37249 21.681 0.093 Mouse obese 454 22.249 0.025
Human F1 S 36048 21.160 0.246 Mouse lean 2 2828 22.155 0.031
Mouse lean 3 (2894) 21.018 0.309 Mouse lean 3 2894 21.870 0.061
Human In A 25759 20.686 0.492 Human F1 T 42144 20.545 0.586
Human F2 W 38078 20.450 0.653 Mouse lean 2 2828 20.544 0.586
Mouse obese 2 (2438) 20.118 0.906 Mouse lean 454 20.260 0.795
doi:10.1371/journal.pone.0002945.t003
Chicken Cecal Metagenomics
PLoS ONE | www.plosone.org 12 August 2008 | Volume 3 | Issue 8 | e2945

Figure 11. The distribution of sequences similar to each transposon gene from the chicken cecum, mouse cecum, human fecal andrumen microbiomes.doi:10.1371/journal.pone.0002945.g011
Chicken Cecal Metagenomics
PLoS ONE | www.plosone.org 13 August 2008 | Volume 3 | Issue 8 | e2945

Table 4. Summary of blastx results of chicken cecum A assembled contigs.
Contig Length Genbank # Annotation Organism ScoreE value(Expect)
Identities(%)
00246 1552 YP_001298993.1 putative transposase Bacteroides vulgatus 483 1e-134 99
ZP_01958971.1 hypothetical protein BACCAC_00562 Bacteroides caccae 410 2e-112 96
ZP_01958551.1 hypothetical protein BACCAC_00123 Bacteroides caccae 407 8e-112 95
12082 629 YP_001304583.1 putative transposase Parabacteroides distasonis 328 1-88 98
YP_001297372.1 putative transposase Bacteroides vulgatus 274 3e-72 100
ZP_01961195.1 hypothetical protein BACCAC_02821 Bacteroides caccae 180 6e-44 74
25141 526 YP_001300792.1 putative transposase Bacteroides vulgatus 231 2e-59 100
YP_001297547.1 putative transposase Bacteroides vulgatus 229 4e-59 99
YP_001298735.1 putative transposase Bacteroides vulgatus 229 4e-59 99
25921 921 YP_001297694.1 transposase Bacteroides vulgatus 572 2e-161 100
YP_001298173.1 transposase Bacteroides vulgatus 570 4e-161 99
ZP_01890000.1 transposase unidentified eubacterium 280 9e-74 46
25932 1045 YP_001297547.1 putative transposase Bacteroides vulgatus 640 0.0 99
YP_001300792.1 putative transposase Bacteroides vulgatus 640 0.0 100
NP_812469.1 putative transposase Bacteroides thetaiotaomicron 640 0.0 99
25980 1447 ZP_01254245.1 transposase Psychroflexus torquis 352 4e-95 54
ZP_01890000.1 transposase unidentified eubacterium 345 6e-93 53
YP_001298173.1 transposase Bacteroides vulgatus 306 2e-81 46
26741 583 YP_001297710.1 transposase Bacteroides vulgatus 396 4e-109 99
YP_001297386.1 transposase Bacteroides vulgatus 396 4e-109 99
EDO11111.1 hypothetical protein BACOVA_03013 Bacteroides ovatus 388 9e-107 96
09258 606 YP_001299838.1 conserved hypothetical protein, putative TonB Bacteroides vulgatus 253 2e-82 99
YP_213356.1 hypothetical protein BF3767 Bacteroides fragilis 67.8 4e-10 37
YP_101268.1 TonB Bacteroides fragilis 67.8 4e-10 37
10937 607 YP_001297387.1 hypothetical protein BVU_0035 Bacteroides vulgatus 145 7e-52 90
EDO11113.1 hypothetical protein BACOVA_03015 Bacteroides ovatus 140 1e-33 94
EDO11112.1 hypothetical protein BACOVA_03014 Bacteroides ovatus 84 6e-15 84
25918 874 EDO52987.1 hypothetical protein BACUNI_02999 Bacteroides uniformis 160 9e-38 97
EDO13931.1 hypothetical protein BACOVA_00321 Bacteroides ovatus 155 4e-36 95
EDO11072.1 hypothetical protein BACOVA_02972 Bacteroides ovatus 155 4e-36 95
25929 639 EDO53852.1 hypothetical protein BACUNI_02471 Bacteroides uniformis 129 2e-28 93
ZP_01962139.1 hypothetical protein BACCAC_03787 Bacteroides caccae 127 4e-28 92
YP_001152206.1 ORF137 Pinus koraiensis 93.6 8e-18 56
25961 1554 CAJ30045.1 conserved hypothetical protein Magnetospirillum gryphiswaldense 141 1e-31 54
EDO11070.1 hypothetical protein BACOVA_02970 Bacteroides ovatus 107 2e-21 65
EDO53850.1 hypothetical protein BACUNI_02467 Bacteroides uniformis 107 3e-21 83
26526 1002 EDP10382.1 hypothetical protein EUBDOL_01624 Eubacterium dolichum 228 6e-58 100
EDP10383.1 hypothetical protein EUBDOL_01625 Eubacterium dolichum 219 3e-55 100
EDP10384.1 hypothetical protein EUBDOL_01626 Eubacterium dolichum 205 3e-51 100
27457 1346 EDO51852.1 hypothetical protein BACUNI_04402 Bacteroides uniformis 321 8e-86 73
EDO55703.1 hypothetical protein BACUNI_00736 Bacteroides uniformis 232 4e-59 77
EDO51853.1 hypothetical protein BACUNI_04403 Bacteroides uniformis 143 1e-54 56
22050 614 YP_001298764.1 transcriptional regulator Bacteroides vulgatus 47 8e-04 100
ZP_01960532.1 hypothetical protein BACCAC_02149 Bacteroides caccae 43.9 0.006 72
YP_133705.1 MobN1 Bacteroides uniformis 40.4 0.071 68
25094 552 YP_001298467.1 putative exported protease Bacteroides vulgatus 374 2e-102 95
ZP_02033115.1 hypothetical protein PARMER_03138 Parabacteroides merdae 244 2e-63 62
YP_212141.1 putative exported tricorn protease Bacteroides fragilis 239 5e-62 60
00991 554 YP_001297716.1 hypothetical protein BVU_0375 Bacteroides vulgatus 338 7e-92 99
Chicken Cecal Metagenomics
PLoS ONE | www.plosone.org 14 August 2008 | Volume 3 | Issue 8 | e2945

microbiome can be affected by various factors such as dietary
ingredients, nutrient levels, environment, probiotic, and antibiotic
treatments. Moreover, the gastrointestinal tract microbiome plays
an important role in the growth and health of the host through its
effects on gastrointestinal tract morphology, nutrition, pathogen-
esis of intestinal diseases, and immune responses. This compar-
ative microbiome data provides a critical genetic context for
understanding food safety, animal nutrition, animal health and
well-being. Additionally, the combined pyrosequence approach
and subsystems-based annotations available in the SEED database
allowed us to gain an understanding of the metabolic potential of
these microbiomes. Sequence information was recovered in a
comparative context based on the ecology of the microbial
communities that inhabit the chicken cecum, which in the future
this will allow us to link metabolic potential to the identity of cecal
microbes in their natural habitat.
Metagenomic analysis allows the relative abundances of all
genes to be determined and used to generate a dataset for the
assessment of the functional potential of each community [10,48–
53]. Our ability to assemble genes from primarily the Bacteroidetes
suggests that this is an important phylum in the chicken cecum,
similar to that observed in studies of the human fecal microbiome
[46,47]. We also note that while the community structure of the
cecal microbiome from the C. jejuni challenged chicken has greater
diversity and evenness with a distribution of more Firmicutes at the
expense of the Bacteroidetes and other taxa. While this may suggest
that the challenge affected the community structure in such a way
as to diminish the levels of the dominant taxa, this may be the
result of host variation in community structure. Even though the
phylotype distribution was significantly different between the
microbiome from a pathogen-free chicken compared with one that
had been challenged by a single low-level inoculation with C. jejuni,
the functional gene content of these two microbiomes was similar.
We have proposed from our metabiome analysis of 45
microbiomes and 42 viromes that the frequency of a gene
encoding a particular metabolic function reflects its relative
importance in an environment [12]. Interestingly, differences in
functional and taxonomic evenness reported for microbial
communities [51,54] suggest that the frequency of a gene encoding
a particular metabolic function reflects its relative importance in
an environment. It also appears that like the human fecal
microbiome, the chicken cecum microbiome contains an abundance
of transferable elements including conjugative transposons, support-
ing the hypothesis that a driving force in microbiome composition
and diversity in gastrointestinal tracts, or for that matter any
environment of high microbial density, is horizontal gene transfer
[47,55]. Our observation that nearly 25% of the assembled contigs
show similarity with mobile elements (transposases) is consistent with
a microbiome evolution model that predicts that variation in gene
content is mediated via horizontal gene transfer [56] which also
controls gene distribution within the pan microbiome. This could be
accelerated in this microbiome by the use of antibiotics, which is
evidenced by the high proportion of antibiotic resistance genes
detected in the chicken cecum microbiome. In this study we have
primarily sampled the core microbiome of conserved, abundant
genes within microbial metagenomes. This core microbiome is
supplemented by a less abundant ‘‘variable microbiome’’ or
‘‘specialization genes’’ to provide those unique functions as and
when required [57]. Our work supports the observation that the core
genomes of widely distributed microbes remain essentially the same,
Table 4. cont.
Contig Length Genbank # Annotation Organism ScoreE value(Expect)
Identities(%)
YP_001304010.1 hypothetical protein BDI_2669 Parabacteroides distasonis 210 3e-53 62
YP_213505.1 hypothetical protein BF3924 Bacteroides fragilis 199 9e-50 55
26290 647 XP_454253.1 unnamed protein product Kluyveromyces lactis 35 3.4 30
XP_453624.1 unnamed protein product Kluyveromyces lactis 34.7 4.4 31
NP_197442.1 ABC transporter family protein Arabidopsis thaliana 33.5 9.9 32
25938 583 AAS78451.1 BcrA Enterococcus faecalis 355 7e-97 92
YP_001273166.1 multidrug ABC transporter, ATPase component,CcmA
Methanobrevibacter smithii 224 2e-57 58
YP_001086833.1 putative lantibiotic ABC transporter,ATP-bindingprotein
Clostridium difficile 221 3e-56 56
25946 541 YP_001299600.1 xylulose kinase Bacteroides vulgatus 370 2e-101 100
EDO54840.1 hypothetical protein BACUNI_01362 Bacteroides uniformis 345 8e-94 91
EDO12568.1 hypothetical protein BACOVA_01710 Bacteroides ovatus 337 2e-91 88
26189 591 YP_001297927.1 L-rhamnose/H+ symporter Bacteroides vulgatus 392 5e-108 100
NP_812676.1 L-rhamnose/H+ symporter Bacteroides thetaiotaomicron 374 2e-102 93
EDO10968.1 hypothetical protein BACOVA_03603 Bacteroides ovatus 372 6e-102 93
27252 545 YP_001301101.1 dipeptidyl aminopeptidase Bacteroides vulgatus 375 7e-103 100
ZP_02031298.1 hypothetical protein PARMER_01283 Parabacteroides merdae 322 5e-87 81
YP_001303599.1 dipeptidyl aminopeptidase Parabacteroides distasonis 308 1e-82 77
03484 541 YP_001298244.1 putative transmembrane protein Bacteroides vulgatus 201 1e-50 100
YP_211132.1 putative transmembrane protein Bacteroides fragilis 87 5e-16 59
YP_211133.1 putative transmembrane protein Bacteroides fragilis 81.3 3e-14 77
doi:10.1371/journal.pone.0002945.t004
Chicken Cecal Metagenomics
PLoS ONE | www.plosone.org 15 August 2008 | Volume 3 | Issue 8 | e2945

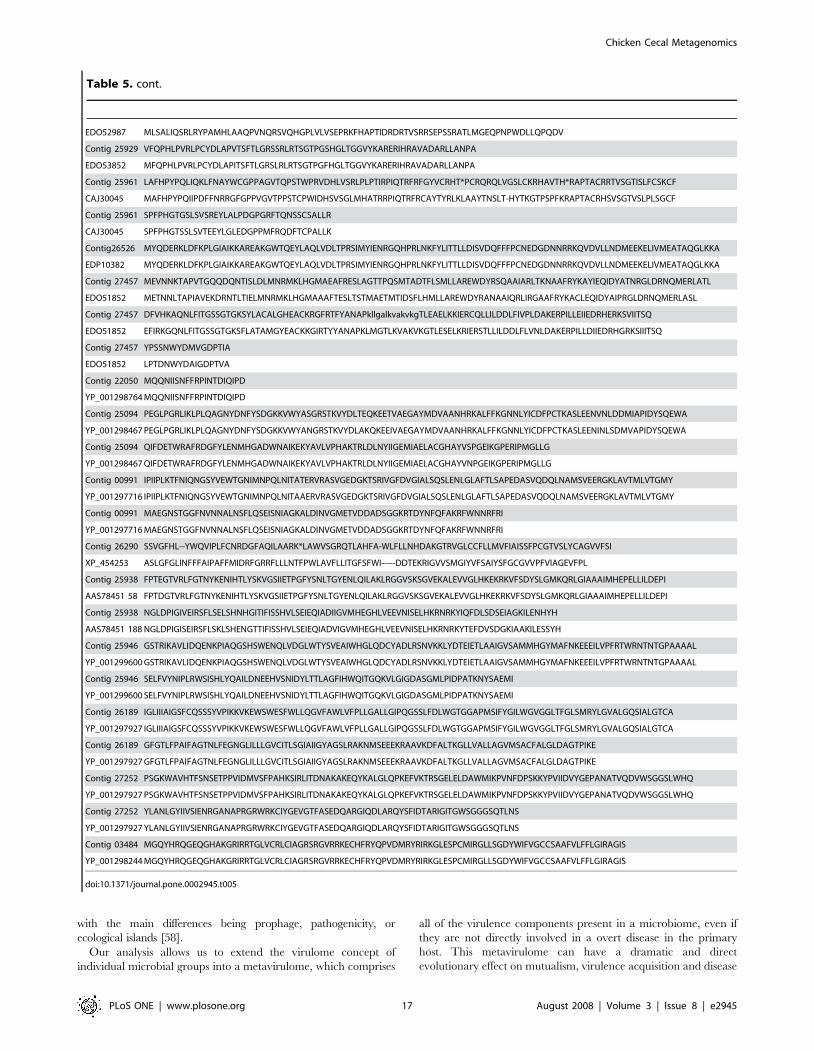
Table 5. BlastX alignments for the chicken cecum A assembled contigs.
Contig 00246 MIAIIKGTDVHTVTSVLLKLSRRRRYQVREITLDMAPNMEQIARICFPAAKRVTDRFHVQKLAYEAVQEMRVKARWEALDEESTQIAYAKACGKMYHAPVFANGDTR
YP_001298993 MIAIIKGTDVHTVTSVLLKLSRRRRYQVREITLDMAPNMEQIARICFPAAKRVTDRFHVQKLAYEAVQEMRVKARWEALDEESTQIAYAKACGKMYHAPVFANGDTR
Contig 00246 KQLLARSIYLLYKKESLWTQSQRIRAEILFKEYPDIKKGYYLSMRLGLIYHQCKFKDIALTRLARWYDEVDKSGFLTFGRVARSIQTHYLDIINFFERRATNAAAE
YP_001298993 KQLLARSIYLLYKKESLWTQSQRIRAEILFKEYPDIKKGYYLSMRLGLIYHQCKFKDIALTRLARWYDEVDKSGFLTFGRVARSIQTHYLDIINFFERRATNAEAE
Contig 00246 SFNAKIKAFRAQFRGVRDRAFFLYRLAKLYA
YP_001298993 SFNAKIKAFRAQFRGVRDRAFFLYRLAKLYA
Contig 12082 MFPESKVTEIYCMADDFCKEFTLQQEKYMIKDMKTMHRNKPNRMSDAEIMVILILFHSGGFRCFKHYYKEYVCKHLKHLFPRQVSYNRFVELEKEVLLPMTIFIK
YP_001304583 MFPESKVTEIYCMADDFCKEFTLQQEKYMIKDMKTMHRNNPNRMSDAEIMVILILFHSGGFRCFKHYYKEYVCKHLKHLFPRQVSYNRFVELEKEVLLPMTIFIK
Contig 12082 RVLLGTCTGISFVDSTPLCVCRNQRILIHKTFEGLAERGRCSMGWFFGFKLH
YP_001304583 RVLLGTCTGISFVASTPLCVCRNQRILIHKTFEGLAERGRCSMGWFFGFKLH
Contig 25141 MQQKLMNVRVRCVAADSIYANNANRKFCTKYGISTSFVRKGRAAKDEPLRKVLRSELSKERATRLEGSFGTQKQHYSLSRIKARNRKTEILWIFFGIHTANAIL
YP_001300792 MQQKLMNVRVRCVAADSIYANNANRKFCTKYGISTSFVRKGRAAKDEPLRKVLRSELSKERATRLEGSFGTQKQHYSLSRIKARNRKTEILWIFFGIHTANAIL
Contig 25141 IIEKIRNKTAKAA
YP_001300792 IIEKIRNKTAKAA
Contig 25921 LEHAHDYLLYPENIGENLSLDETCLSNGDVYTILTNKAAKGRKGALVAMVRGVATDAVSGILRRLPHRKRLSVKTVTTDLSSAMMLTVRKVFPAAKLINDRFHV
YP_001297694 LEHAHDYLLYPENIGENLSLDETCLSNGDVYTILTNKAAKGRKGALVAMVRGVATDAVSGILRRLPHRKRLSVKTVTTDLSSAMMLTVRKVFPAAKLINDRFHV
Contig 25921 QQLMSEAVDRLRIRYRWKVLDAENQAIREHRQkkkeakskaereRIGKWEPERMENGETLPQIVSRSKHIILKHWSKWNEQQKTRAAILFDKFPKLLEGYSLSM
YP_001297694 QQLMSEAVDRLRIRYRWKVLDAENQAIREHRQKKKEAKSKAERERIGKWEPERMENGETLPQIVSRSKHIILKHWSKWNEQQKTRAAILFDKFPKLLEGYSLSM
Contig 25921 KLTDIFNKKSGPDEARLNLARWYNEVEKFDYMEFNKVLDTFSNHSTTIINYFEERLTNASAESFNAKIKAFRSQLRGVADLKFFMFRLARLYA
YP_001297694 KLTDIFNKKSGPDEARLNLARWYNEVEKFDYMEFNKVLDTFSNHSTTIINYFEERLTNASAESFNAKIKAFRSQLRGVADLKFFMFRLARLYA
Contig 25932 MAKIVNISEIHPTLGFTEFDILEKYRKSFNESELGKLHSVFPFECMAKAAGLSDRRLGRRNRFSPSAKIALMVLKAYTGFSDRQLVEHLNGNIHYQIFCGIMI
YP_0012297547
MAKIVNISEIHPTLGFTEFDILEKYRKSFNESELGKLHSVFPFECMAKAAGLSDRRLGRRNRFSPSAKIALMVLKAYTGFSDRQLVEHLNGNIHYQIFCGIMI
Contig 25932 PPSLPITNFKIVSAIRNEIASRLDIDSFQELLASHWKPYLDNLHVCMTDATCYESHMRFPTDMKLLWESLEWLYRHICRHCRELGIRRPRNKYRNVAESYLSY
YP_0012297547
PPSLPITNFKIVSAIRNEIASRLDIDSFQELLASHWKPYLDNLHVCMTDATCYESHMRFPTDMKLLWESLEWLYRHICRHCRELGIRRPRNKYRNVAESYLSY
Contig 25932 CkkrkrrasrarmlkrrMIKLLEKLLSQRDGIHSEYGALLRYTQDYHKRLSIIRKVLVQEKEMFEGRKVSDRIVSIDRHYVRPIVRGKETKSVEFGAKVNNIQ
YP_0012297547
CKKRKRRASRTRMLKRRMIKLLEKLLSQRDGIHSEYGALLRYTQDYHKRLSIIRKVLVQEKEMFEGRKVSDRIVSIDRHYVRPIVRGKETKSVEFGAKVNNIQ
Contig 25932 IDGISFIEHLSFKAFNEGIRLKDCI
YP_0012297547
IDGISFIEHLSFKAFNEGIRLKDCI
Contig 25980 YYHINGDTFEKQYKEVLSGYREWSELSHAEDWLVFPENIGESICIDETAPSNGELYTIVSNRSSRGGKGTIIAIVKGVAADAVTEALMRI DEDKRLLVKEITMDM
ZP-01254245 YYKINGRILQYHYKNHLSDFKDWIQKEHAQDWLLYPENIGTYLSLDETSLSNGELYTILTNKNAQGKKGSIVAIVKGTRAIDVINILNKI PLERRNVVEEVTVDM
Contig 25980 SNSMRLIARRCFPNAMRTIDRFHIQKLACDALQEMRIAHRWDAIQADTDAREEAKCLGEAYTPIVLANGDTHKQLLARSRYLLFKSADKWTESQRQRAEVLFETY
ZP-01254245 AGSMNLIAKKCFPKTELVTDRFHVQKLASEAVQEERIRLRWEIMEQENSDILEARKKGRTYKFELLGNGDTHKQLLARSRYLLFKSKTKWTVRQRERAEILFKLY
Contig 25980 PDLKEAYSLTHSLRMIFSKNTVKDAARLSLARWYNKVDDSGFKSFNVIAATLYEHYDEVLNFFVNRATNAFAESFNAKIKAFRAALRGVTDIKFFLFRLTKLYA
ZP-01254245 PSIEKAYNLAQGLTYIFENNTHKDVARLKLAHWYDKVEKSQFKSFSTIARSIQMHYVPILNYFNNRSTNASAESFNAKIKEFRAQFRGVRDVKFFLYRLTKLFA
Contig 26741 PMPEGLSLEGATKLGEEVSEQYAVSPARFYVKRIIRPKYRLADGRIITAPMPVMAHPHSNASESVLAHIATAKYYDHLPLHRQLDIFEREGIHLSPSTVSNW
YP_001297710 PMPEGLSLEGATKLGEEVSEQYAVSPARFYVKRIIRPKYRLADGRIITAPMPVMAHPHSNASESVLAHIATAKYYDHLPLHRQLDIFEREGIHLSPSTVSNW
Contig 26741 MMAAAQRLEPIYNELRELVKDSYYVMADETPHPVLESDRPGALHRGYMWNFYLPRFHTPFFEYHKGRGSSGTDTLLAGQVRVVQSDGFAVY
YP_001297710 MMAAAQRLEPIYNELRELVKDSYYVMADETPHPVLESDRPGALHRGYMWNFYLPRFHTPFFEYHKGRGSSGIDTLLAGQVRVVQSDGFAVY
Contig 09258 ENSKPVPYDYFLTMRFWKEDLEHYLLYRECAQEDLEKTTWEPYRYSSYPGGTVALTQFINSHLKITPEMKATGKQGRVIYSFNVDIDGSMKDFRLVRGLDPLMD
YP_001299838 KNSKPVPYDYFLTMRFWKEDLEHYLLYRECAQEDLEKTTWEPYRYSSYPGGTVALTQFINSHLKITPEMKATGKQGRVIYSFNVDIDGSMKDFRLVRGLDPLMD
Contig 09258 AEALRVLQLVNEKWSTG
YP_001299838 AEALRVLQLVNEKWSTG
Contig 10937 FRSWPFPQQSFLVLLPLSQGCNFHKGIDGLCGEVIRHTGSCVSEQSCHIFPDRSRSRLHILYRCDDEYRLECRRLNRGSFLLKKEERKKDFLQISWNRLNELLT
YP_001297387 FRSSPFWSY---YLYP--QGCNFHKGIDGLCGEVIRHTGSCVSEQSCHIFPDRSRSRLHILYRCDDEYRLECRRLNRGSFLLKKEERKKDFLQISWNRLNELLT
Contig 10937 VKKYRKTVEK
YP_001297387 VKKYRKTVEK
Contig 25918 MLSALIRSRLRYPAMHLAAQPANQRSVQHGPLVLVSEPRKFHAPTIDRDRTVSRRSEPSSRATLMGEQPNPWDLLQPQDV
Chicken Cecal Metagenomics
PLoS ONE | www.plosone.org 16 August 2008 | Volume 3 | Issue 8 | e2945
with the main differences being prophage, pathogenicity, or
ecological islands [58].
Our analysis allows us to extend the virulome concept of
individual microbial groups into a metavirulome, which comprises
all of the virulence components present in a microbiome, even if
they are not directly involved in a overt disease in the primary
host. This metavirulome can have a dramatic and direct
evolutionary effect on mutualism, virulence acquisition and disease
EDO52987 MLSALIQSRLRYPAMHLAAQPVNQRSVQHGPLVLVSEPRKFHAPTIDRDRTVSRRSEPSSRATLMGEQPNPWDLLQPQDV
Contig 25929 VFQPHLPVRLPCYDLAPVTSFTLGRSSRLRTSGTPGSHGLTGGVYKARERIHRAVADARLLANPA
EDO53852 MFQPHLPVRLPCYDLAPITSFTLGRSLRLRTSGTPGFHGLTGGVYKARERIHRAVADARLLANPA
Contig 25961 LAFHPYPQLIQKLFNAYWCGPPAGVTQPSTWPRVDHLVSRLPLPTIRPIQTRFRFGYVCRHT*PCRQRQLVGSLCKRHAVTH*RAPTACRRTVSGTISLFCSKCF
CAJ30045 MAFHPYPQIIPDFFNRRGFGPPVGVTPPSTCPWIDHSVSGLMHATRRPIQTRFRCAYTYRLKLAAYTNSLT-HYTKGTPSPFKRAPTACRHSVSGTVSLPLSGCF
Contig 25961 SPFPHGTGSLSVSREYLALPDGPGRFTQNSSCSALLR
CAJ30045 SPFPHGTSSLSVTEEYLGLEDGPPMFRQDFTCPALLK
Contig26526 MYQDERKLDFKPLGIAIKKAREAKGWTQEYLAQLVDLTPRSIMYIENRGQHPRLNKFYLITTLLDISVDQFFFPCNEDGDNNRRKQVDVLLNDMEEKELIVMEATAQGLKKA
EDP10382 MYQDERKLDFKPLGIAIKKAREAKGWTQEYLAQLVDLTPRSIMYIENRGQHPRLNKFYLITTLLDISVDQFFFPCNEDGDNNRRKQVDVLLNDMEEKELIVMEATAQGLKKA
Contig 27457 MEVNNKTAPVTGQQDQNTISLDLMNRMKLHGMAEAFRESLAGTTPQSMTADTFLSMLLAREWDYRSQAAIARLTKNAAFRYKAYIEQIDYATNRGLDRNQMERLATL
EDO51852 METNNLTAPIAVEKDRNTLTIELMNRMKLHGMAAAFTESLTSTMAETMTIDSFLHMLLAREWDYRANAAIQRLIRGAAFRYKACLEQIDYAIPRGLDRNQMERLASL
Contig 27457 DFVHKAQNLFITGSSGTGKSYLACALGHEACKRGFRTFYANAPkllgalkvakvkgTLEAELKKIERCQLLILDDLFIVPLDAKERPILLEIIEDRHERKSVIITSQ
EDO51852 EFIRKGQNLFITGSSGTGKSFLATAMGYEACKKGIRTYYANAPKLMGTLKVAKVKGTLESELKRIERSTLLILDDLFLVNLDAKERPILLDIIEDRHGRKSIIITSQ
Contig 27457 YPSSNWYDMVGDPTIA
EDO51852 LPTDNWYDAIGDPTVA
Contig 22050 MQQNIISNFFRPINTDIQIPD
YP_001298764 MQQNIISNFFRPINTDIQIPD
Contig 25094 PEGLPGRLIKLPLQAGNYDNFYSDGKKVWYASGRSTKVYDLTEQKEETVAEGAYMDVAANHRKALFFKGNNLYICDFPCTKASLEENVNLDDMIAPIDYSQEWA
YP_001298467 PEGLPGRLIKLPLQAGNYDNFYSDGKKVWYANGRSTKVYDLAKQKEEIVAEGAYMDVAANHRKALFFKGNNLYICDFPCTKASLEENINLSDMVAPIDYSQEWA
Contig 25094 QIFDETWRAFRDGFYLENMHGADWNAIKEKYAVLVPHAKTRLDLNYIIGEMIAELACGHAYVSPGEIKGPERIPMGLLG
YP_001298467 QIFDETWRAFRDGFYLENMHGADWNAIKEKYAVLVPHAKTRLDLNYIIGEMIAELACGHAYVNPGEIKGPERIPMGLLG
Contig 00991 IPIIPLKTFNIQNGSYVEWTGNIMNPQLNITATERVRASVGEDGKTSRIVGFDVGIALSQSLENLGLAFTLSAPEDASVQDQLNAMSVEERGKLAVTMLVTGMY
YP_001297716 IPIIPLKTFNIQNGSYVEWTGNIMNPQLNITAAERVRASVGEDGKTSRIVGFDVGIALSQSLENLGLAFTLSAPEDASVQDQLNAMSVEERGKLAVTMLVTGMY
Contig 00991 MAEGNSTGGFNVNNALNSFLQSEISNIAGKALDINVGMETVDDADSGGKRTDYNFQFAKRFWNNRFRI
YP_001297716 MAEGNSTGGFNVNNALNSFLQSEISNIAGKALDINVGMETVDDADSGGKRTDYNFQFAKRFWNNRFRI
Contig 26290 SSVGFHL--YWQVIPLFCNRDGFAQILAARK*LAWVSGRQTLAHFA-WLFLLNHDAKGTRVGLCCFLLMVFIAISSFPCGTVSLYCAGVVFSI
XP_454253 ASLGFGLINFFFAIPAFFMIDRFGRRFLLLNTFPWLAVFLLITGFSFWI-----DDTEKRIGVVSMGIYVFSAIYSFGCGVVPFVIAGEVFPL
Contig 25938 FPTEGTVRLFGTNYKENIHTLYSKVGSIIETPGFYSNLTGYENLQILAKLRGGVSKSGVEKALEVVGLHKEKRKVFSDYSLGMKQRLGIAAAIMHEPELLILDEPI
AAS78451 58 FPTDGTVRLFGTNYKENIHTLYSKVGSIIETPGFYSNLTGYENLQILAKLRGGVSKSGVEKALEVVGLHKEKRKVFSDYSLGMKQRLGIAAAIMHEPELLILDEPI
Contig 25938 NGLDPIGIVEIRSFLSELSHNHGITIFISSHVLSEIEQIADIIGVMHEGHLVEEVNISELHKRNRKYIQFDLSDSEIAGKILENHYH
AAS78451 188 NGLDPIGISEIRSFLSKLSHENGTTIFISSHVLSEIEQIADVIGVMHEGHLVEEVNISELHKRNRKYTEFDVSDGKIAAKILESSYH
Contig 25946 GSTRIKAVLIDQENKPIAQGSHSWENQLVDGLWTYSVEAIWHGLQDCYADLRSNVKKLYDTEIETLAAIGVSAMMHGYMAFNKEEEILVPFRTWRNTNTGPAAAAL
YP_001299600 GSTRIKAVLIDQENKPIAQGSHSWENQLVDGLWTYSVEAIWHGLQDCYADLRSNVKKLYDTEIETLAAIGVSAMMHGYMAFNKEEEILVPFRTWRNTNTGPAAAAL
Contig 25946 SELFVYNIPLRWSISHLYQAILDNEEHVSNIDYLTTLAGFIHWQITGQKVLGIGDASGMLPIDPATKNYSAEMI
YP_001299600 SELFVYNIPLRWSISHLYQAILDNEEHVSNIDYLTTLAGFIHWQITGQKVLGIGDASGMLPIDPATKNYSAEMI
Contig 26189 IGLIIIAIGSFCQSSSYVPIKKVKEWSWESFWLLQGVFAWLVFPLLGALLGIPQGSSLFDLWGTGGAPMSIFYGILWGVGGLTFGLSMRYLGVALGQSIALGTCA
YP_001297927 IGLIIIAIGSFCQSSSYVPIKKVKEWSWESFWLLQGVFAWLVFPLLGALLGIPQGSSLFDLWGTGGAPMSIFYGILWGVGGLTFGLSMRYLGVALGQSIALGTCA
Contig 26189 GFGTLFPAIFAGTNLFEGNGLILLLGVCITLSGIAIIGYAGSLRAKNMSEEEKRAAVKDFALTKGLLVALLAGVMSACFALGLDAGTPIKE
YP_001297927 GFGTLFPAIFAGTNLFEGNGLILLLGVCITLSGIAIIGYAGSLRAKNMSEEEKRAAVKDFALTKGLLVALLAGVMSACFALGLDAGTPIKE
Contig 27252 PSGKWAVHTFSNSETPPVIDMVSFPAHKSIRLITDNAKAKEQYKALGLQPKEFVKTRSGELELDAWMIKPVNFDPSKKYPVIIDVYGEPANATVQDVWSGGSLWHQ
YP_001297927 PSGKWAVHTFSNSETPPVIDMVSFPAHKSIRLITDNAKAKEQYKALGLQPKEFVKTRSGELELDAWMIKPVNFDPSKKYPVIIDVYGEPANATVQDVWSGGSLWHQ
Contig 27252 YLANLGYIIVSIENRGANAPRGRWRKCIYGEVGTFASEDQARGIQDLARQYSFIDTARIGITGWSGGGSQTLNS
YP_001297927 YLANLGYIIVSIENRGANAPRGRWRKCIYGEVGTFASEDQARGIQDLARQYSFIDTARIGITGWSGGGSQTLNS
Contig 03484 MGQYHRQGEQGHAKGRIRRTGLVCRLCIAGRSRGVRRKECHFRYQPVDMRYRIRKGLESPCMIRGLLSGDYWIFVGCCSAAFVLFFLGIRAGIS
YP_001298244 MGQYHRQGEQGHAKGRIRRTGLVCRLCIAGRSRGVRRKECHFRYQPVDMRYRIRKGLESPCMIRGLLSGDYWIFVGCCSAAFVLFFLGIRAGIS
doi:10.1371/journal.pone.0002945.t005
Table 5. cont.
Chicken Cecal Metagenomics
PLoS ONE | www.plosone.org 17 August 2008 | Volume 3 | Issue 8 | e2945

amongst commensal microbes. Dethelfsen et al. [59] recently
reviewed this topic as it related to individual pathogens and the
development of zoonotic pathogens, or those that are passed from
animals to humans. Indeed, it appears that commensal microbes
from domesticated species are the origin of many gastrointestinal
diseases found in humans and other species [60]. For example, C.
jejuni is a highly adapted to the avian gastrointestinal tract and is
regarded as a commensal in the chicken. Nonetheless, Campylo-
bacter species are recognized as important human pathogens, and
are the most commonly identified bacterial cause of diarrheal
illness in the world [61]. Thus, it would appear that the virulome
of these bacteria are adapted to their primary host, and once
transmission to a secondary host occurs the host immune system
does not recognize the organism and colonization and disease can
result. It would also appear that the metavirulome is a contributing
factor in the development of low-virulence niches for the primary
host-specific microbiome. Once these microbes are transmitted to
different hosts that harbor distinctly different metavirulomes, the
host environment could promote colonization of these zoonotic
pathogens followed by a disease state in the new host. The entire
microbiome must be considered in relationship to both ecological
and evolutionary forces of the host and the microbial community,
when considering the subtle differences in commensal and
pathogenic microbes
Materials and Methods
Chicken Cecum SamplingChicks were obtained from a commercial hatchery (Murray
McMurray, IA) and divided into two groups, A and B and housed in
separate isolation buildings. Upon arrival, a cloacal swab from each
bird was collected and plated on CEFEX media to ensure chicks were
free of Campylobacter. All birds were fed a commercial chicken feed
(Eagle milling, AZ) ad libitum for the duration of the study. Fourteen
days post hatching, chicks in pen B were challenged via oral gavage
with 16105 CFU C. jejuni NCTC11168. Chicks in pen A received
only PBS and served as negative controls. Fourteen days post
challenge, birds from each pen were euthanized and ceca collected
for further analysis. Fresh cecal samples from two (C. jejuni-inoculated
and C. jejuni-uninoculated) 28-day old chickens were analyzed. Cecal
contents were collected using aseptic techniques. Samples were stored
at 280uC until DNA extraction. These studies were approved by the
Institutional Animal Care and Use Committee (IACUC) at the
University of Arizona (Protocol#06-037), which assured adherence
to humane and ethical principles, as outlined in the Animal Welfare
Act, ILAR ‘‘Guide for Care and Use of Laboratory Animals,’’ and all
other applicable public laws and local policies.
DNA Extraction and PurificationGenomic DNA was extracted using a protocol similar to the
extraction of high molecular weight DNA for rumen and fecal
contents [62]. Deviation from this protocol included following the
Qiagen DNA Stool Kit manufacturer’s protocol (Qiagen,
Valencia, CA) following the addition of 960 ml of ASL buffer to
the samples. DNA purity and concentration was analyzed by
spectrophotometric quantification and gel electrophoresis.
Pyrosequencing and Sequence AnalysisThe two cecal samples were subjected to a single pyrosequence
run by 454 Life Sciences using a 454 Life Sciences Genome
Sequencer GS20 and analyzed using the SEED Annotation
Engine in MG-RAST (http://metagenomics.nmpdr.org; Version
1.2) [63]. The sequences were compared using the BLASTX
algorithm with an expected cutoff of 161025 [10]. The BLASTN
algorithm (E,161025 and a sequence length hit.50 nucleotides)
was used to identify SSU rDNA genes from release 9.3.3 of the
RDP database ([64]; http://rdp.cme.msu.edu/), and the Europe-
an Ribosomal RNA database (http://www.psb.ugent.be/rRNA/
index.html). RDP was used for robust Bacterial classification and
the Europeans Ribosomal RNA database was used to classify
Eukaryl and Archaeal sequences. The metagenomes used in this
paper are freely available from the SEED platform and are being
made accessible from CAMERA and the NCBI Short Read
Archive. The NCBI genome project IDs used in this study are:
28597, and 28599.
Diversity IndicesShannon-Weiner, Simpson’s lambda, and Pielou’s evenness
analyses for measuring species richness and evenness [43] for the
SSU rDNA hits used the following equations; eq. 6.1 (Shannon-
Weiner, or ‘‘Shannon’s entropy’’; p. 209), eq. 6.41 (Simpson’s
lambda, or ‘‘concentration;’’ p. 242), and eq. 6.44 (Pielou’s
evenness; p. 243) [43]. To estimate microbiome diversity, sets of
random sequences from each microbiome and the maximum
likelihood assemblage structure of assemblages was determined
using mathematical rank-abundance models in PHAge Commu-
nities from Contig Spectra (PHACCS) ([44]; http://biome.sdsu.
edu/phaccs). Random subsamples of the metagenomes were used
instead of the totality of the whole metagenomes, because
PHACCS analyses are more robust at low coverage.
StatisticsTo compare the distribution of taxonomic and functional
groups between the two metagenomes a non-parametric Wilcoxon
exact test was used. Non-parametric statistics were used because
they have minimal assumption, except that the population
distribution of the paired differences is assumed to be symmetric.
The test takes into account the magnitude of the differences
between two paired variables to identify whether significant
differences exist. The data was normalized for sequencing
efficiency by obtaining the percent distribution, prior to analysis.
A separate test was conducted for each variable group.
Author Contributions
Conceived and designed the experiments: LAJ BAW. Performed the
experiments: MKW BFL JRT. Analyzed the data: AQ JMB MKW MEK
FA ED RAE KEN. Contributed reagents/materials/analysis tools: LAJ.
Wrote the paper: AQ BAW.
References
1. Handelsman J (2004) Metagenomics: Application of genomics to uncultured
microorganisms. Microbiology and Molecular Biology Reviews 68: 669–685.
2. Hyman ED (1988) A New Method of Sequencing DNA. Analytical Biochemistry
174: 423–436.
3. Ronaghi M, Uhlen M, Nyren P (1998) A sequencing method based on real-time
pyrophosphate. Science 281: 363–365.
4. Ronaghi M, Karamohamed S, Pettersson B, Uhlen M, Nyren P (1996) Real-
time DNA sequencing using detection of pyrophosphate release. Analytical
Biochemistry 242: 84–89.
5. Margulies M, Egholm M, Altman WE, Attiya S, Bader JS, et al. (2005) Genome
sequencing in microfabricated high-density picolitre reactors. Nature 437: 376–380.
6. Sogin ML, Morrison HG, Huber JA, Welch DM, Huse SM, et al. (2006)
Microbial diversity in the deep sea and the underexplored ‘‘rare biosphere’’.
Proceedings of the National Academy of Sciences of the United States of
America 103: 12115–12120.
7. Roesch LFW, Fulthorpe RR, Riva A, Casella G, Hadwin AKM, et al. (2007)
Pyrosequencing enumerates and contrasts soil microbial diversity. The ISME
Journal 1: 283–290.
Chicken Cecal Metagenomics
PLoS ONE | www.plosone.org 18 August 2008 | Volume 3 | Issue 8 | e2945
8. Hamady M, Walker JJ, Harris JK, Gold NJ, Knight R (2008) Error-correcting
barcoded primers for pyrosequencing hundreds of samples in multiplex. NatureMethods Published online: 10 February 2008 | doi:10.1038/nmeth.1182..
9. Tringe SG, von Mering C, Kobayashi A, Salamov AA, Chen K, et al. (2005)
Comparative metagenomics of microbial communities. Science 308: 554–557.10. Edwards RA, Rodriguez-Brito B, Wegley L, Haynes M, Breitbart M, et al.
(2006) Using pyrosequencing to shed light on deep mine microbial ecology.BMC Genomics 7: 57–69.
11. Turnbaugh PJ, Ley RE, Mahowald MA, Magrini V, Mardis ER, et al. (2006) An
obesity-associated gut microbiome with increased capacity for energy harvest.Nature 444: 1027–1031.
12. Dinsdale EA, Edwards RA, Hall D, Angly F, Breitbart M, et al. (2008)Functional Metagenomic Profiling of Nine Biomes. Nature 452: 344–347.
13. Apajalahti J, Kettunen A, Graham H (2004) Characteristics of the gastrointes-tinal microbial communities, with special reference to the chicken. Worlds
Poultry Science Journal 60: 223–232.
14. Apajalahti JHA, Kettunen A, Bedford MR, Holben WE (2001) Percent G+Cprofiling accurately reveals diet-related differences in the gastrointestinal
microbial community of broiler chickens. Applied and EnvironmentalMicrobiology 67: 5656–5667.
15. Fairchild AS, Smith JL, Idris U, Lu J, Sanchez S, et al. (2005) Effects of orally
administered tetracycline on the intestinal community structure of chickens andon tet determinant carriage by commensal bacteria and Campylobacter jejuni.
Applied and Environmental Microbiology 71: 5865–5872.16. Lan PTN, Hayashi H, Sakamoto M, Benno Y (2002) Phylogenetic analysis of
cecal microbiota in chicken by the use of 16S rDNA clone libraries.Microbiology and Immunology 46: 371–382.
17. Lu JR, Idris U, Harmon B, Hofacre C, Maurer JJ, et al. (2003) Diversity and
succession of the intestinal bacterial community of the maturing broiler chicken.Applied and Environmental Microbiology 69: 6816–6824.
18. Smirnov A, Perez R, Amit-Romach E, Sklan D, Uni Z (2005) Mucin dynamicsand microbial populations in chicken small intestine are changed by dietary
probiotic and antibiotic growth promoter supplementation. Journal of Nutrition
135: 187–192.19. Scupham AJ (2007) Examination of the microbial ecology of the avian intestine
in vivo using bromodeoxyuridine. Environmental Microbiology 9: 1801–1809.20. Scupham AJ (2007) Succession in the intestinal microbiota of preadolescent
turkeys. FEMS Microbiology Ecology 60: 136–147.21. Scupham AJ, Jones JA, Wesley IV (2007) Comparison of DNA extraction
methods for analysis of turkey cecal microbiota. Journal of Applied Microbiology
102: 401–409.22. Scupham AJ, Patton TG, Bent E, Bayles DO (2008) Comparison of the cecal
microbiota of domestic and wild turkeys. Microbial Ecology Online First Jan 8,2008..
23. Saengkerdsub S, Anderson RC, Wilkinson HH, Kim WK, Nisbet DJ, et al.
(2007) Identification and quantification of methanogenic archaea in adultchicken ceca. Applied and Environmental Microbiology 73: 353–356.
24. Saengkerdsub S, Herrera P, Woodward L, Anderson C, Nisbet DJ, et al. (2007)Detection of methane and quantification of methanogenic archaea in faeces
from young broiler chickens using real-time PCR. Letters in AppliedMicrobiology 45: 629–634.
25. Bjerrum L, Engberg RM, Leser TD, Jensen BB, Finster K, et al. (2006)
Microbial community composition of the ileum and cecum of broiler chickens asrevealed by molecular and culture-based techniques. Poultry Science 85:
1151–1164.26. Lu JR, Sanchez S, Hofacre C, Maurer JJ, Harmon BG, et al. (2003) Evaluation
of broiler litter with reference to the microbial composition as assessed by using
16S rRNA and functional gene markers. Applied and EnvironmentalMicrobiology 69: 901–908.
27. Zhu XY, Zhong TY, Pandya Y, Joerger RD (2002) 16S rRNA-based analysis ofmicrobiota from the cecum of broiler chickens. Applied and Environmental
Microbiology 68: 124–137.
28. Wise MG, Siragusa GR (2007) Quantitative analysis of the intestinal bacterialcommunity in one- to three-week-old commercially reared broiler chickens fed
conventional or antibiotic-free vegetable-based diets. J Appl Microbiol 102:1138–1149.
29. Beery JT, Hugdahl MB, Doyle MP (1988) Colonization of gastrointestinal tractsof chicks by Campylobacter jejuni. Appl Environ Microbiol 54: 2365–2370.
30. Sahin O, Morishita TY, Zhang Q (2002) Campylobacter colonization in poultry:
sources of infection and modes of transmission. Anim Health Res Rev 3: 95–105.31. Konkel ME, Christensen JE, Dhillon AS, Lane AB, Hare-Sanford R, et al.
(2007) Campylobacter jejuni strains compete for colonization in broiler chicks.Applied and Environmental Microbiology 73: 2297–2305.
32. Sahin O, Zhang Q, Meitzler JC, Harr BS, Morishita TY, et al. (2001)
Prevalence, antigenic specificity, and bactericidal activity of poultry anti-Campylobacter maternal antibodies. Appl Environ Microbiol 67: 3951–3957.
33. Berndtson E, Danielsson-Tham ML, Engvall A (1996) Campylobacter incidenceon a chicken farm and the spread of Campylobacter during the slaughter
process. Int J Food Microbiol 32: 35–47.34. Shreeve JE, Toszeghy M, Pattison M, Newell DG (2000) Sequential spread of
Campylobacter infection in a multipen broiler house. Avian Dis 44: 983–988.
35. Wagenaar JA, Mevius DJ, Havelaar AH (2006) Campylobacter in primary animalproduction and control strategies to reduce the burden of human campylo-
bacteriosis. Rev Sci Tech 25: 581–594.
36. Evans SJ, Sayers AR (2000) A longitudinal study of campylobacter infection of
broiler flocks in Great Britain. Prev Vet Med 46: 209–223.
37. Doyle MP, Jones MP (1992) Food-borne transmission and antibiotic resistance of
Campylobacter jejuni. Campylobacter jejuni Current Status and Future Trends.
Washington, D.C.: American Society for Microbiology. pp 45–48.
38. Stern NJ (1992) Reservoirs for Campylobacter jejuni and approaches for
intervention in poultry. Campylobacter jejuni Current Status and Future Trends.
Washington, D.C.: American Society for Microbiology. pp 49–60.
39. Brulc JM, Antonopoulos DA, Berg Miller ME, Wilson MK, Yannarell AC, et al.
(2008) Comparative metagenomics of the rumen microbiome by random
sampling pyrosequencing. Proceedings of the National Academy of Sciences of
the United States of America In Review, Communicated by Jillian Banfield..
40. Altschul SF, Gish W, Miller W, Myers EW, Lipman DJ (1990) Basic Local
Alignment Search Tool. Journal of Molecular Biology 215: 403–410.
41. Wommack KE, Bhavsar J, Ravel J (2008) Metagenomics: Read Length Matters.
Applied and Environmental Microbiology 74: 1453–1463.
42. Krause L, Diaz NN, Goesmann A, Kelley S, Nattkemper TW, et al. (2008)
Phylogenetic classification of short environmental DNA fragments. Nucleic
Acids Research. pp 1–10. doi:10.1093/nar/gkn038..
43. Legendre P, Legendre L (1998) Numerical Ecology. Amsterdam, the Nether-
lands: Elsevier B.V.. pp 853.
44. Angly F, Rodriguez-Brito B, Bangor D, McNairnie P, Breitbart M, et al. (2005)
PHACCS, an online tool for estimating the structure and diversity of uncultured
viral communities using metagenomic information. BMC Bioinformatics 6: 41.
45. Rodriguez-Brito B, Rohwer F, Edwards RA (2006) An application of statistics to
comparative metagenomics. BMC Bioinformatics 7: 162–173.
46. Gill SR, Pop M, DeBoy RT, Eckburg PB, Turnbaugh PJ, et al. (2006)
Metagenomic analysis of the human distal gut microbiome. Science 312:
1355–1359.
47. Kurokawa K, Itoh T, Kuwahara T, Oshima K, Toh H, et al. (2007)
Comparative metagenomics revealed commonly enriched gene sets in human
gut microbiomes. DNA Research 14: 169–181.
48. Breitbart M, Hewson I, Felts B, Mahaffy JM, Nulton J, et al. (2003)
Metagenomic analyses of an uncultured viral community from human feces.
Journal of Bacteriology 185: 6220–6223.
49. Breitbart M, Salamon P, Andresen B, Mahaffy JM, Segall AM, et al. (2002)
Genomic analysis of uncultured marine viral communities. Proceedings of the
National Academy of Sciences of the United States of America 99:
14250–14255.
50. Wegley L, Edwards R, Rodriguez-Brito B, Liu H, Rohwer F (2007)
Metagenomic analysis of the microbial community associated with the coral
Porites astreoides. Environmental Microbiology 9: 2707–2719.
51. Angly FE, Felts B, Breitbart M, Salamon P, Edwards RA, et al. (2006) The
marine viromes of four oceanic regions. Plos Biology 4: 2121–2131.
52. Breitbart M, Rohwer F (2005) Method for discovering novel DNA viruses in
blood using viral particle selection and shotgun sequencing. Biotechniques 39:
729–736.
53. Fierer N, Breitbart M, Nulton J, Salamon P, Lozupone C, et al. (2007)
Metagenomic and small-subunit rRNA analyses reveal the genetic diversity of
bacteria, archaea, fungi, and viruses in soil. Applied and Environmental
Microbiology 73: 7059–7066.
54. Torsvik V, Ovreas L (2002) Microbial diversity and function in soil: from genes
to ecosystems. Current Opinion in Microbiology 5: 240–245.
55. Ley RE, Peterson DA, Gordon JI (2006) Ecological and evolutionary forces
shaping microbial diversity in the human intestine. Cell 124: 837–848.
56. Frigaard NU, Martinez A, Mincer TJ, DeLong EF (2006) Proteorhodopsin
lateral gene transfer between marine planktonic Bacteria and Archaea. Nature
439: 847–850.
57. Turnbaugh PJ, Ley RE, Hamady M, Fraser-Liggett CM, Knight R, et al. (2007)
The Human Microbiome Project. Nature 449: 804–810.
58. Cuadros-Orellana S, Martin-Cuadrado AB, Legault B, D’Auria G,
Zhaxybayeva O, et al. (2007) Genomic plasticity in prokaryotes: the case of
the square haloarchaeon. ISME Journal 1: 235–245.
59. Dethlefsen L, McFall-Ngai M, Relman DA (2007) An ecological and
evolutionary perspective on human-microbe mutualism and disease. Nature
449: 811–818.
60. Wolfe ND, Dunavan CP, Diamond J (2007) Origins of major human infectious
diseases. Nature 447: 279–283.
61. Humphrey T, O’Brien S, Madsen M (2007) Campylobacters as zoonotic
pathogens: a food production perspective. International Journal of Food
Microbiology;doi:10.1016/j.ijfoodmicro.2007.01.006..
62. Yu Z, Yu M, Morrison M (2006) Improved serial analysis of V1 ribosomal
sequence tags (SARST-V1) provides a rapid, comprehensive, sequence-based
characterization of bacterial diversity and community composition. Environ-
mental Microbiology 8: 603–611.
63. Overbeek R, Begley T, Butler RM, Choudhuri JV, Chuang HY, et al. (2005)
The subsystems approach to genome annotation and its use in the project to
annotate 1000 genomes. Nucleic Acids Research 33: 5691–5702.
64. Cole JR, Chai B, Farris RJ, Wang Q, Kulam SA, et al. (2005) The Ribosomal
Database Project (RDP-II): sequences and tools for high-throughput rRNA
analysis. Nucleic Acids Research 33: D294–296.
Chicken Cecal Metagenomics
PLoS ONE | www.plosone.org 19 August 2008 | Volume 3 | Issue 8 | e2945