Embed Size (px)
Citation preview

Journal of Biotechnology 70 (1999) 249–270
Comparative evaluation of compact photobioreactors forlarge-scale monoculture of microalgae
Asterio Sanchez Miron, Antonio Contreras Gomez,Francisco Garcıa Camacho, Emilio Molina Grima, Yusuf Chisti *
Department of Chemical Engineering, Uni6ersity of Almerıa, E-04071 Almerıa, Spain
Received 27 October 1998; received in revised form 17 November 1998; accepted 22 December 1998
Abstract
Engineering analyses combined with experimental observations in horizontal tubular photobioreactors and verticalbubble columns are used to demonstrate the potential of pneumatically mixed vertical devices for large-scale outdoorculture of photosynthetic microorganisms. Whereas the horizontal tubular systems have been extensively investigated,their scalability is limited. Horizontal tubular photobioreactors and vertical bubble column type units differsubstantially in many ways, particularly with respect to the surface–to–volume ratio, the amount of gas in dispersion,the gas–liquid mass transfer characteristics, the nature of the fluid movement and the internal irradiance levels. Asillustrated for eicosapentaenoic acid production from the microalga Phaeodactylum tricornutum, a realistic commercialprocess cannot rely on horizontal tubular photobioreactor technology. In bubble columns, presence of gas bubblesgenerally enhances internal irradiance when the Sun is low on the horizon. Near solar noon, the bubbles diminish theinternal column irradiance relative to the ungassed state. The optimal dimensions of vertical column photobioreactorsare about 0.2 m diameter and 4 m column height. Parallel east–west oriented rows of such columns located at 36.8°Nlatitude need an optimal inter-row spacing of about 3.5 m. In vertical columns the biomass productivity variessubstantially during the year: the peak productivity during summer may be several times greater than in the winter.This seasonal variation occurs also in horizontal tubular units, but is much less pronounced. Under identicalconditions, the volumetric biomass productivity in a bubble column is �60% of that in a 0.06 m diameter horizontaltubular loop, but there is substantial scope for raising this value. © 1999 Elsevier Science B.V. All rights reserved.
Keywords: Microalgae; Photobioreactors; Scale-up; Photosynthetic culture; Eicosapentaenoic acid; Phaeodactylum tricornutum
1. Introduction
Photobioreactors for large-scale monoculture ofmicroalgae have conventionally been designed asdevices with large surface–to–volume ratios. Var-ious types of tubular photobioreactors are exam-ples of this approach (Lee, 1986; Borowitzka,
* Corresponding author: Tel.: +34-950-215566; fax: +34-950-215484.
E-mail address: [email protected] (Y. Chisti)
© 1999 Elsevier Science B.V. All rights reserved.
PII: S 0168 -1656 (99 )00079 -6

A. Sanchez Miron et al. / Journal of Biotechnology 70 (1999) 249–270250
1996). These reactors occupy vast land areas: theyare expensive to build; difficult to maintain; andonly somewhat scaleable. Tubular photobioreac-tors can usefully satisfy only medium level pro-duction demands. Attempted, large–scaleproduction in horizontal tubular loops has failedquite spectacularly in one case (Fig. 1); hence,other reactor configurations are needed for theproduction of larger quantities of pharmacologi-cally active compounds that certain microalgaecan potentially produce.
The areal productivity, i.e. productivity per unitland area, is low for conventional tubular photo-bioreactors and in large units as well as modulardesigns, sterile operation to the levels demandedin the pharmaceutical industry is difficult. Somelow surface–to–volume, pneumatically agitatedphotobioreactors can potentially overcome thesesignificant disadvantages. Examples of the lattertype are bubble columns and airlift bioreactors.Large scale culture of microalgae in these systemshas not been investigated as it has always beenassumed that small surface–to–volume ratios ofthese devices would make them ineffective. Thisneed not be so as reported in this work whichdeals with comparative outdoor evaluation of pi-lot scale bubble column photobioreactors withrespect to performance in horizontal tubularloops.
Data are reported on three aspects of compara-tive characterization: (a) gas–liquid hydrodynam-ics and mass transfer; (b) internal irradiance levelsas functions of Sun’s location relative to the pho-tobioreactors; and (c) performance during cultureof the microalga Phaeodactylum tricorntum. Alsoreported are the effects of hydrodynamics on sur-vival behavior of algal cells.
2. Comparison of performance
The vertical and the horizontal tubular photo-bioreactors differ in several significant ways in-cluding differences in light regimens, gas–liquidhydrodynamics and mass transfer behavior. Someof these factors—e.g. hydrodynamics and lightregimen—are interrelated. Their impact on cul-ture performance is discussed below.
2.1. Hydrodynamics
The hydrodynamics of flow in horizontal tubesand vertical columns are generally quite different.The necessarily gas sparged bubble columns andairlift reactors tend to have substantially greatergas holdups than do horizontal tubular solar re-ceivers. The latter are virtually free of gas and anybubbles present are localized to a narrow zonealong the upper portion of the tubes; moreover,the bubbles are relatively small. In contrast, thereare many more and larger bubbles in verticalphotobioreactors and the gas–liquid flow is muchmore chaotic than the highly directional flow in asmall-diameter horizontal pipe. Differences in gasholdup and the bubble size affect light penetra-tion, gas–liquid mass transfer, mixing and shearstress levels.
2.1.1. Gas holdupGas holdup measurements in a bubble column
photobioreactor confirm that holdup increaseswith specific power input in accordance with pre-viously published data (Chisti, 1989). Thus, theholdup data in tap water (Fig. 2) closely followedthe equation
o=3.317×10⁻⁴�PG
VL
�0.97
, (1)
whereas data in sea water (Fig. 2) agreed with thecorrelation
o=7.958×10⁻⁵�PG
VL
�1.249
. (2)
In these equations the power input due to aera-tion is calculated as
PG
VL
=rLgUG, (3)
where rL is the density of the liquid, g is thegravitational acceleration and UG is the superficialgas velocity in the column. Eqs. (1) and (2) wereestablished by Chisti (1989) for tap water and 0.15M aqueous sodium chloride, respectively. Theequations apply to the bubble flow regime, or UG
values less than about 0.05 m s−1 (PG/VL:500W m−3) The obvious decline in the rate of in-crease of gas holdup with increasing specific

A. Sanchez Miron et al./ Journal of Biotechnolgoy 70 (1999) 249–270 251
Fig. 1. A commercial horizontal tubular bioreactor facility that failed to perform to expectations and was abandoned. This facilitywas located in Cartagena, Spain and it was owned by Photobioreactors Ltd.

A. Sanchez Miron et al. / Journal of Biotechnology 70 (1999) 249–270252
power input values above about 400 W m−3 (Fig.2b) is due to a well-known change in the flowregime from bubble to churn turbulent flow(Chisti, 1989). Equations for estimating gasholdup in the latter regime have been published(Chisti, 1989), but that regime is not likely to be
used in microalgal culture in vertical photobiore-actors because of the cell damaging potential ofintense turbulence (Silva et al., 1987; Suzuki et al.,1995; Contreras et al., 1998; Chisti, 1999a). Datain Fig. 2 reveal that the flow transition occursearlier in tap water, around a power input of 280
Fig. 2. Variation of fractional gas holdup with specific power input in the bubble column: (a) tap water; and (b) sea water.

A. Sanchez Miron et al./ Journal of Biotechnolgoy 70 (1999) 249–270 253
Table 1Composition of Almerıa bay Mediterranean sea water (Contr-eras et al., 1998)
Amount (kg m−3)Component
20.812ChlorideSulfate 2.866
0.168BicarbonateNa+ 10.552
1.362Mg2+
Ca2+ 0.5190.413K+
Total dissolved solids 36.608NegligibleTotal organic carbon
Ionic strength 0.727
perforated pipe with 17 holes of 1 mm diameter,giving a gas flow area that was 0.05% of the totalcolumn cross-sectional area. The sparger headwas shaped into a cross that was located centrally,0.076 m above the base of the column. The inter-nal diameter of the column was 0.19 m and it wasmade of 3.3 mm thick poly(methyl methacrylate),except for the lower 0.25 m section that was madeof stainless steel. For the power input range ofrelevance here, Eqs. (1) and (2) are known toapply to bubble columns irrespective of the size ofthe sparger holes. Agreement of the data withEqs. (1) and (2) suggests that changes in spargercharacteristics are unlikely to affect the holdup inthe two fluids.
2.1.2. Effects of holdup on irradianceThe effect of gas holdup on the measured inter-
nal irradiance inside the column is shown in Figs.3–6. The data in these figures were obtained onclear, cloudless days. The irradiance levels weremeasured using one spherical quantum sensor—either a Biospherical QSL 100 (Biospherical In-struments Inc., San Diego, CA) unit or a LI-CORLI-196SA (Li-cor, Inc., Lincoln, NE) device—lo-cated always at the centerline of the column, 0.87m below the static surface of the liquid. Data were
W m−3. The coalescence inhibiting effect of saltsin sea water allows bubble flow to persist longerin that medium. Similar results have been re-ported earlier (Chisti, 1989). The data in Fig. 2were obtained in an outdoor bubble column witha gas-free liquid height of 1.93 m. Either tapwater or Mediterranean sea water was the liquidphase. The composition of the latter is noted inTable 1. Except during culture, a small amount ofhypochlorite (50 ml corresponding to 35 g l−1
free chlorine) was added to sea water to preventmicrobial growth. Air was sparged through a
Fig. 3. Daily variation in internal irradiance in the bubble column in tap water. The gas holdup value was 0.101. The differencebetween the aerated and unaerated irradiance levels is also noted. The data are for 7 and 8 July, 1998.

A. Sanchez Miron et al. / Journal of Biotechnology 70 (1999) 249–270254
Fig. 4. Daily variation in internal irradiance in the bubble column in tap water. The gas holdup value was 0.052. The differencebetween the aerated and unaerated irradiance levels is also noted. The data are for 25 June and 1 July, 1998.
acquired using a DaqBook/100–901 (IOtech, Inc.,Cleveland, OH) data acquisition card connectedto an IBM compatible 486 computer operating at100 MHz.
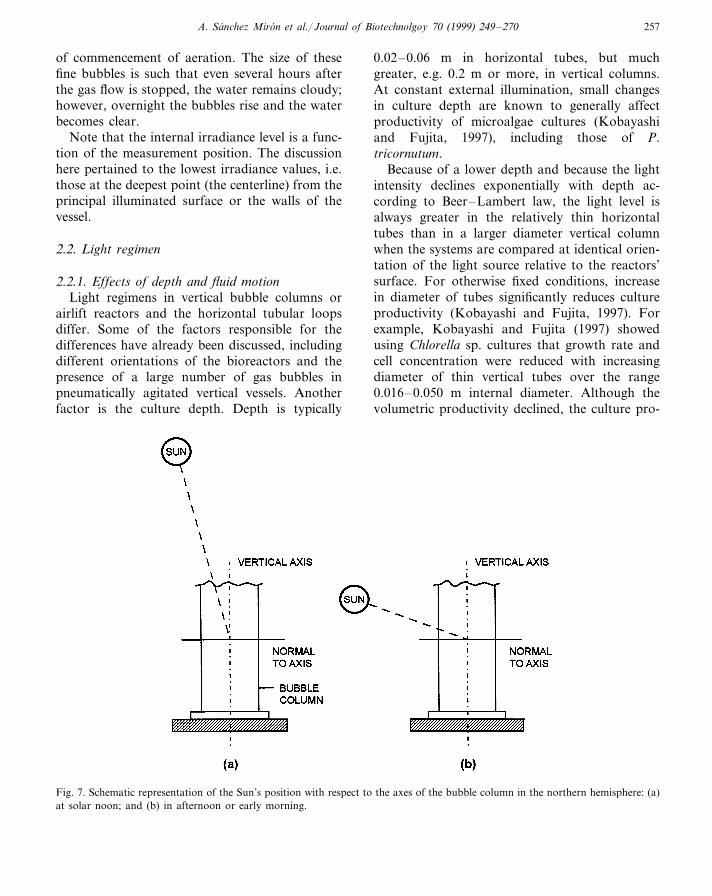
The trough in irradiance around 14 h (Figs.3–6), or solar noon, occurs when the Sun is at itsapex and most nearly aligned with the verticalaxis of the bubble column (Fig. 7a). In this posi-tion, the direct sunlight flux on the column is atit’s lowest, hence, the internal irradiance level islow. Also, around solar noon, because of a highangle of incidence, a greater amount of radiationis reflected off the surface of the column com-pared to when the angle of incidence is small(afternoon, morning). The irradiance peaks at11:30 and 17:30 h in the absence of bubbling(Figs. 3–5) occur when the Sun is low on thehorizon and most closely aligned with the normalto the bubble column’s vertical axis (Fig. 7b).Typically, the internal irradiance levels at thesetimes exceed those at solar noon. This generalpattern is seen irrespective of whether the reactoris aerated or if it is gas-free. Of course, in ahorizontally placed tubular loop the pattern ofvariation of irradiance with time will be different,the irradiance profile will have a single peak (Gar-cıa Camacho et al., 1999) that will coincide withthe solar noon.
As shown for tap water in Fig. 3, bubbling at aconstant high aeration rate (UG=0.051 m s−1)corresponding to a gas holdup of 0.101, mayeither enhance or reduce the level of internalirradiance depending on the position of the lightsource, the Sun. Irradiance is enhanced duringperiods when the Sun is most closely aligned withthe normal to the vertical axis of the column (Fig.7b). Around solar noon, when the Sun is bestaligned with the vertical axis (Fig. 7a), presence ofbubbles reduces internal irradiance. Depending ontime, the difference between the aerated and un-aerated irradiance levels may range from −12 to+35% (Fig. 3). The effect of aeration on internalirradiance diminishes as the gas flow rate is re-duced (Fig. 4); however, even at a low superficialgas velocity of 0.0025 m s−1, corresponding to afractional gas holdup of 0.008, or less than 1%,the irradiance level is affected by up to �15%relative to gas-free operation in tap water (Fig. 5).Aeration at any level consistently shifts the irradi-ance maxima relative to the ungassed state (Figs.3–6), the morning irradiance maximum occurs upto 1 h earlier than in the absence of bubbling.Similarly, the afternoon irradiance maximum oc-curs up to 1 h later than when no aeration isemployed.

A. Sanchez Miron et al./ Journal of Biotechnolgoy 70 (1999) 249–270 255
Irradiance enhancement and reduction by bub-bles result from a combination of two factors:shading of culture by bubbles; and the phe-nomenon of total internal reflectance. In the bub-ble flow regime, the bubble shape ispredominantly ellipsoidal (Fig. 8) with the majoraxis of the bubble roughly perpendicular to thevertical axis of the bubble column. At a given gasholdup and bubble size, the bubbles provide agreater shading effect when the light source ishigh on the horizon than when it is low (Fig. 8a).Furthermore, when the light source is high, i.e.closely aligned with the vertical axis of thecolumn, the surface of the bubble reflects incidentlight poorly and much of the radiation penetratesinto the gas phase. In contrast, when the lightsource is low on the horizon, it is more closelyaligned with the major axis of the bubble (Fig. 8b)and the low approach angle of radiation relativeto the gas–liquid interface causes total internalreflection of a large portion of the radiation (Fig.8b). In effect, each bubble becomes a reflectorthat allows better dispersion of incident radiationwithin the liquid. This total internal reflectancemore than compensates for the smaller shadowsof sideways illumination, the shadow region be-hind a bubble is illuminated by reflectance from
other nearby bubbles. Because of reflectance thetotal internal irradiance is greater relative to bub-ble-free operation when much of the incident radi-ation simply passes through the bubble column.Whether these effects will occur and to whatextent, in optically less clear algal culture brothsremains to be seen. Experiments are currentlyunderway to establish this point.
A comparison of Figs. 3–5 reveals that boththe irradiance enhancement and reduction effectsin tap water are stronger at the higher aerationrate when the gas holdup and the number ofbubbles are greater. With more bubbles there aremore reflectors in the fluid when the light sourceis low on the horizon. Similarly, the shadowingeffect of many more bubbles is stronger when theSun is at its apex. The data in Figs. 3–5 are forthe bubble flow regime and the irradiance patternscould be different in the churn turbulent regimeand also when the gas holdup is so high that clearpatches of liquid allowing through penetration oflight do not exist.
Comparing Figs. 4 and 6 for tap and sea water,respectively, at identical aeration rates, the pat-terns of variation in irradiance are generally simi-lar; however, the irradiance enhancement in seawater is somewhat greater than in tap water. In
Fig. 5. Daily variation in internal irradiance in the bubble column in tap water. The gas holdup value was 0.008. The differencebetween the aerated and unaerated irradiance levels is also noted. The data are for 9 and 13 July, 1998.

A. Sanchez Miron et al. / Journal of Biotechnology 70 (1999) 249–270256
Fig. 6. Daily variation in internal irradiance in the bubble column in sea water. The gas holdup value was 0.065. The differencebetween the aerated and unaerated irradiance levels is also noted. The data are for 14 and 15 September, 1998.
contrast, the irradiance diminishing effect is virtu-ally non-existent in sea water up to a gas velocityof 0.021 m s−1: the bubble size is slightly smallerthan in tap water, the holdup is somewhatgreater, and the sphericity of the bubbles ishigher. These factors combine to reduce the shad-owing effect of the bubbles during midday relativeto that experienced in tap water. Quantitatively,the shadowing effect of bubbles can be shown todepend on bubble diameter and the gas holdup asfollows:
Shadowing effect 8o
dB
, (4)
where o is the fractional gas holdup and dB is themean bubble diameter. The above relationshiporiginates from the fact that the light shadowingeffect of bubbles depends on their number in agiven volume (VD) of dispersion and on the meandiameter of bubbles, i.e.
Shadowing effect 8NB · dB
2
VD
. (5)
Because the number of bubbles depends on thevolume of gas (VG) in dispersion,
NB8VG
dB3 (6)
and, by definition, the overall gas holdup is givenas
o=VG
VG+VL
=VG
VD
, (7)
relationship (4) is derived readily. Expression (4)does not consider bubble sphericity effects, how-ever, with reference to Fig. 8a it is easily shownthat at constant gas holdup an increase in spheric-ity should reduce the size of the shadow andhence the irradiance diminishing effect at midday.
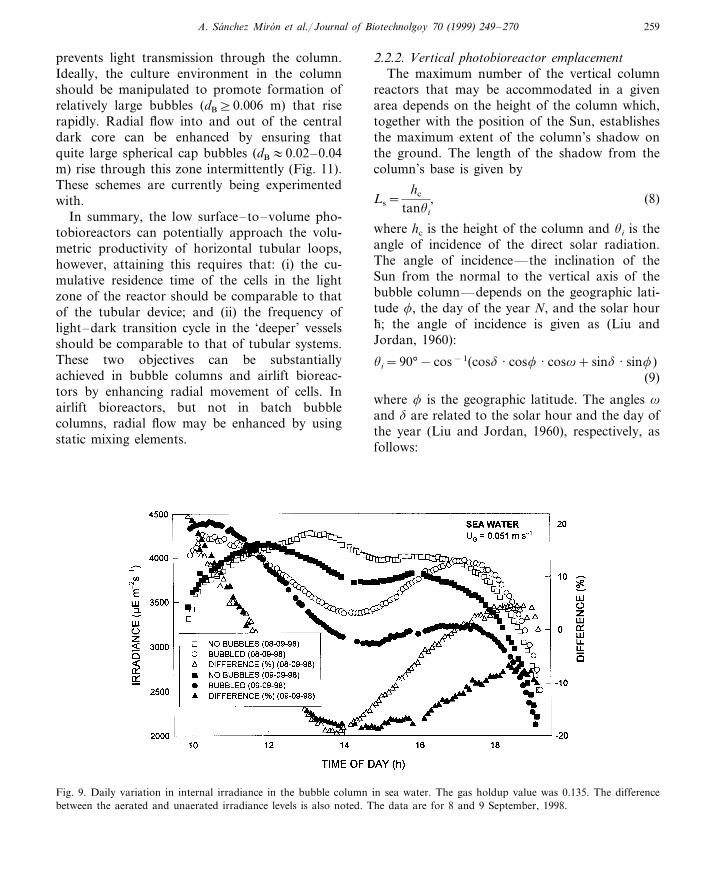
At much higher aeration rates than in Fig. 6,the situation in Fig. 9 is observed in sea water.Fig. 9 is for a highly turbulent system (PG/VL:500 W m−3) when the bubble size is quite smalland the gas holdup is relatively high (\13%) sothat the gas–liquid dispersion is cloudy (Fig. 10).Light penetration is now reduced quite a lot rela-tive to the bubble-free case (Fig. 9). Note that inFig. 9, the irradiance enhancement seen between10 and 12 h is not repeated to the same extent inthe afternoon around 16–18 h. This is because atcommencement of aeration in the morning thefluid is not as cloudy as in the afternoon, the finebubbles responsible for cloudiness accumulatewith time and their concentration gradually in-creases to some steady state value from the time
A. Sanchez Miron et al./ Journal of Biotechnolgoy 70 (1999) 249–270 257
of commencement of aeration. The size of thesefine bubbles is such that even several hours afterthe gas flow is stopped, the water remains cloudy;however, overnight the bubbles rise and the waterbecomes clear.
Note that the internal irradiance level is a func-tion of the measurement position. The discussionhere pertained to the lowest irradiance values, i.e.those at the deepest point (the centerline) from theprincipal illuminated surface or the walls of thevessel.
2.2. Light regimen
2.2.1. Effects of depth and fluid motionLight regimens in vertical bubble columns or
airlift reactors and the horizontal tubular loopsdiffer. Some of the factors responsible for thedifferences have already been discussed, includingdifferent orientations of the bioreactors and thepresence of a large number of gas bubbles inpneumatically agitated vertical vessels. Anotherfactor is the culture depth. Depth is typically
0.02–0.06 m in horizontal tubes, but muchgreater, e.g. 0.2 m or more, in vertical columns.At constant external illumination, small changesin culture depth are known to generally affectproductivity of microalgae cultures (Kobayashiand Fujita, 1997), including those of P.tricornutum.
Because of a lower depth and because the lightintensity declines exponentially with depth ac-cording to Beer–Lambert law, the light level isalways greater in the relatively thin horizontaltubes than in a larger diameter vertical columnwhen the systems are compared at identical orien-tation of the light source relative to the reactors’surface. For otherwise fixed conditions, increasein diameter of tubes significantly reduces cultureproductivity (Kobayashi and Fujita, 1997). Forexample, Kobayashi and Fujita (1997) showedusing Chlorella sp. cultures that growth rate andcell concentration were reduced with increasingdiameter of thin vertical tubes over the range0.016–0.050 m internal diameter. Although thevolumetric productivity declined, the culture pro-
Fig. 7. Schematic representation of the Sun’s position with respect to the axes of the bubble column in the northern hemisphere: (a)at solar noon; and (b) in afternoon or early morning.

A. Sanchez Miron et al. / Journal of Biotechnology 70 (1999) 249–270258
Fig. 8. Projected shadows of an ellipsoidal bubble illuminated from top or side (a). The shadow is much larger for overheadillumination compared to when sideways illumination occurs. (b) Total internal reflection at bubble–liquid interface when theincident radiation beam is closely aligned with the major axis of the bubble. The minor axis of the bubble is generally parallel tothe vertical axis of the bubble column.
ductivity (kg m−2 h−1) per unit bioreactor foot-print area increased with increasing tube diameter(Kobayashi and Fujita, 1997) for a constant exter-nal level of illumination. The areal productivitymore than doubled with increasing tube diameterover the noted range.
Although culture depth is an important influ-ence on production characteristics, considerationof depth alone is unsatisfactory; the nature andmagnitude of fluid movement also need takinginto account. In any photobioreactor, vertical orhorizontal, the depth to which light penetratesdepends on the external irradiance level, thebiomass concentration and the absorption charac-teristics of the biomass. The culture volume adja-cent to the illuminated walls is relatively better lit.At a certain depth, the light intensity falls togrowth limiting levels and a ‘dark zone’ is encoun-tered. Because short dark periods interspersedamong sufficiently long and intense light periodsdo not affect the growth rate, the growth reducingpotential of a dark zone is minimized by ensuringthat elements of fluid do not reside in this zone
for long (Molina Grima et al., 1999). A dark zonemust exist for at least part of the year even in ashallow photobioreactor tube that is optimallydesigned to make full use of the available lightduring summer noons. The depth of the dark zoneis inevitably greater in large-diameter verticalcolumns than in narrow horizontal tubes; how-ever, because of a highly chaotic flow regime andmovement of bubbles, the radial movement offluid that is necessary for improved light–darkcycling is substantially greater in bubble columnsthan in tubular loops. The latter have a highlydirectional flow in which the radial component issmall compared to the axial component. Yet, thebetter radial flow in vertical aerated columns doesnot fully compensate for their larger diameter,hence, the volumetric productivity is reduced rela-tive to narrow horizontal tubular photobioreac-tors. For best performance, bubble columns needto be operated at the highest feasible aerationrates consistent with the shear tolerance of themicroalga; however, the aeration rate must not beso high as to produce a gas holdup level that
A. Sanchez Miron et al./ Journal of Biotechnolgoy 70 (1999) 249–270 259
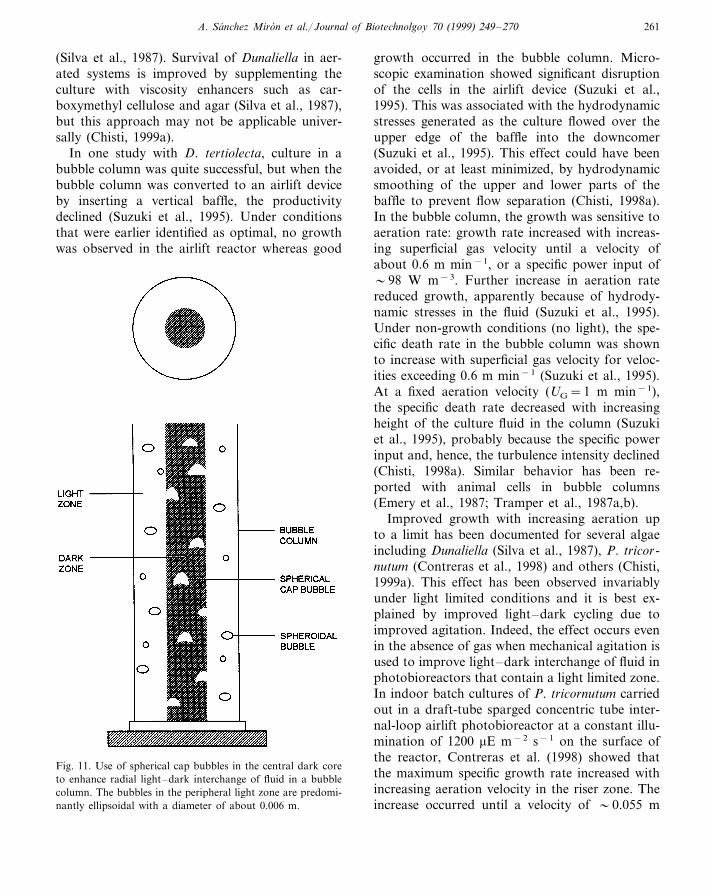
prevents light transmission through the column.Ideally, the culture environment in the columnshould be manipulated to promote formation ofrelatively large bubbles (dB]0.006 m) that riserapidly. Radial flow into and out of the centraldark core can be enhanced by ensuring thatquite large spherical cap bubbles (dB:0.02–0.04m) rise through this zone intermittently (Fig. 11).These schemes are currently being experimentedwith.
In summary, the low surface–to–volume pho-tobioreactors can potentially approach the volu-metric productivity of horizontal tubular loops,however, attaining this requires that: (i) the cu-mulative residence time of the cells in the lightzone of the reactor should be comparable to thatof the tubular device; and (ii) the frequency oflight–dark transition cycle in the ‘deeper’ vesselsshould be comparable to that of tubular systems.These two objectives can be substantiallyachieved in bubble columns and airlift bioreac-tors by enhancing radial movement of cells. Inairlift bioreactors, but not in batch bubblecolumns, radial flow may be enhanced by usingstatic mixing elements.
2.2.2. Vertical photobioreactor emplacementThe maximum number of the vertical column
reactors that may be accommodated in a givenarea depends on the height of the column which,together with the position of the Sun, establishesthe maximum extent of the column’s shadow onthe ground. The length of the shadow from thecolumn’s base is given by
Ls=hc
tanui
, (8)
where hc is the height of the column and ui is theangle of incidence of the direct solar radiation.The angle of incidence—the inclination of theSun from the normal to the vertical axis of thebubble column—depends on the geographic lati-tude f, the day of the year N, and the solar hour"; the angle of incidence is given as (Liu andJordan, 1960):
ui=90°−cos−1(cosd · cosf · cosv+sind · sinf)(9)
where f is the geographic latitude. The angles v
and d are related to the solar hour and the day ofthe year (Liu and Jordan, 1960), respectively, asfollows:
Fig. 9. Daily variation in internal irradiance in the bubble column in sea water. The gas holdup value was 0.135. The differencebetween the aerated and unaerated irradiance levels is also noted. The data are for 8 and 9 September, 1998.

A. Sanchez Miron et al. / Journal of Biotechnology 70 (1999) 249–270260
Fig. 10. The bubble dispersion on the left allows through transmission of light whereas the cloudy dispersion on the right blockslight. These pictures were taken in sea water at aeration power inputs of 154 and 518 W m−3, respectively. The perforated pipesparger hole diameter was 1 mm in both cases.
v=15(12−'), (10)
and
d=23.45 · sin�360(284+N)
365�
. (11)
The loci of the maximum extent of the shadow ofa 2 m tall bubble column are plotted in Fig. 12 forrepresentative days in winter, spring, and summerseasons at the geographic location of Almerıa(36.8°N, 2.9°W). The maximum extent of theshadow in January is about 7.4 m, whereas themaximum extent in July is about 1.3 m. Thesedistances are measured north–south between par-allel east–west lines passing through the base ofthe vertical column and the tip of the column’sshadow. Ideally, parallel east–west rows of bub-ble columns should be spaced by at least themaximum length of the shadow in winter. Thiswould assure that the reactors are never mutuallyshaded, however, a more optimal setup wouldplace the rows of reactors closer, about midwaybetween the high extremes of the shadow length inthe summer and the winter. Consequently, therewill be no mutual shading in the summer butsome shading would occur during the winter. In asingle east–west row of columns the columnscould be spaced quite close together; e.g. a spac-
ing of 0.35 m between centers of adjacent columnsof 0.2 m diameter. Close spacing within east–westrows has no impact on illumination, but it im-proves efficiency of land use.
2.3. Shear effects
Shear stress has been implicated as an impor-tant factor in culture of several microalgae (Silvaet al., 1987; Suzuki et al., 1995; Contreras et al.,1998; Chisti, 1999a). A cell damaging hydrody-namic environment is easily attained in bubblecolumns and airlift reactors (Silva et al., 1987;Suzuki et al., 1995; Contreras et al., 1998; Chisti,1998a), but damage to algal cells has never beendocumented within tubes of tubular photobiore-actors. This may suggest that the damage is some-how linked with the presence of bubbles inpneumatically agitated devices, but extensive stud-ies prove otherwise. With most microalgae, in-creasing aeration rate up to quite high valuesimproves culture productivity (Silva et al., 1987;Contreras et al., 1998), but damage occurs whenthe turbulence is so intense that the fluid mi-croeddy size approaches cellular dimension. Onlyin one case—that of the commercially importantbut unusually fragile marine alga Dunaliella—hasdamage been associated directly with the bubbles
A. Sanchez Miron et al./ Journal of Biotechnolgoy 70 (1999) 249–270 261
(Silva et al., 1987). Survival of Dunaliella in aer-ated systems is improved by supplementing theculture with viscosity enhancers such as car-boxymethyl cellulose and agar (Silva et al., 1987),but this approach may not be applicable univer-sally (Chisti, 1999a).
In one study with D. tertiolecta, culture in abubble column was quite successful, but when thebubble column was converted to an airlift deviceby inserting a vertical baffle, the productivitydeclined (Suzuki et al., 1995). Under conditionsthat were earlier identified as optimal, no growthwas observed in the airlift reactor whereas good
growth occurred in the bubble column. Micro-scopic examination showed significant disruptionof the cells in the airlift device (Suzuki et al.,1995). This was associated with the hydrodynamicstresses generated as the culture flowed over theupper edge of the baffle into the downcomer(Suzuki et al., 1995). This effect could have beenavoided, or at least minimized, by hydrodynamicsmoothing of the upper and lower parts of thebaffle to prevent flow separation (Chisti, 1998a).In the bubble column, the growth was sensitive toaeration rate: growth rate increased with increas-ing superficial gas velocity until a velocity ofabout 0.6 m min−1, or a specific power input of�98 W m−3. Further increase in aeration ratereduced growth, apparently because of hydrody-namic stresses in the fluid (Suzuki et al., 1995).Under non-growth conditions (no light), the spe-cific death rate in the bubble column was shownto increase with superficial gas velocity for veloc-ities exceeding 0.6 m min−1 (Suzuki et al., 1995).At a fixed aeration velocity (UG=1 m min−1),the specific death rate decreased with increasingheight of the culture fluid in the column (Suzukiet al., 1995), probably because the specific powerinput and, hence, the turbulence intensity declined(Chisti, 1998a). Similar behavior has been re-ported with animal cells in bubble columns(Emery et al., 1987; Tramper et al., 1987a,b).
Improved growth with increasing aeration upto a limit has been documented for several algaeincluding Dunaliella (Silva et al., 1987), P. tricor-nutum (Contreras et al., 1998) and others (Chisti,1999a). This effect has been observed invariablyunder light limited conditions and it is best ex-plained by improved light–dark cycling due toimproved agitation. Indeed, the effect occurs evenin the absence of gas when mechanical agitation isused to improve light–dark interchange of fluid inphotobioreactors that contain a light limited zone.In indoor batch cultures of P. tricornutum carriedout in a draft-tube sparged concentric tube inter-nal-loop airlift photobioreactor at a constant illu-mination of 1200 mE m−2 s−1 on the surface ofthe reactor, Contreras et al. (1998) showed thatthe maximum specific growth rate increased withincreasing aeration velocity in the riser zone. Theincrease occurred until a velocity of �0.055 m
Fig. 11. Use of spherical cap bubbles in the central dark coreto enhance radial light–dark interchange of fluid in a bubblecolumn. The bubbles in the peripheral light zone are predomi-nantly ellipsoidal with a diameter of about 0.006 m.

A. Sanchez Miron et al. / Journal of Biotechnology 70 (1999) 249–270262
Fig. 12. Locus of the shadow of a 2 m tall bubble column during the day. The loci are shown for three representative seasons for8 h (January) or 10 h (April, June) days, centered at midday.
s−1, corresponding to a specific power input of�270 W m−3. Whether improved growth wasdue to enhanced fluid interchange between thelight and dark zones was unclear and other fac-tors may have contributed. The cultures wereclearly light limited whenever the biomass concen-tration exceeded about 1 kg m−3.
Increase in aeration rate beyond 0.055 m s−1
substantially reduced the specific growth rate ofP. tricornutum cultures (Contreras et al., 1998). At
the critical aeration rate value of 0.055 m s−1, thecalculated Kolmogoroff microeddy scale was 45mm, or comparable to the dimensions of the algalcells (up to 35 mm long and 3 mm wide (Lewin etal., 1958)). Except for robust microorganisms,damage to cells has generally been observed whenthe dimensions of the isotropic turbulence mi-croeddies approach those of the cells (Chisti,1999a), however, the assumption of isotropic tur-bulence is almost never justifiable under typical

A. Sanchez Miron et al./ Journal of Biotechnolgoy 70 (1999) 249–270 263
operation of bubble columns and airlift systems(Chisti, 1998a).
Why has cell damage not been observed inhorizontal tubular photobioreactor pipes is read-ily explained. For a 200 m straight run smoothhorizontal tube of 0.06 m diameter, the culturevelocity would have to exceed 1.14 m s−1 for themicroscale of turbulence to approach 45 mm—thevalue that damaged the P. tricornutum cells in thevertical airlift device. This velocity value is easilyestimated from the relationship between the Kol-mogoroff microeddy length scale (l) and the spe-cific energy dissipation rate (Chisti, 1999a):
l=�mL
rL
�3/4
E−1/4. (12)
The specific energy dissipation rate E in (Eq. (12))is related with the pressured drop (DP), i.e.
E=ULDPrLL
, (13)
where L is the length of the tube and UL is theculture velocity. The pressure drop in (Eq. (13)) isobtained using the expression:
DP=2Cf
Ld
rLUL2 . (14)
In (Eq. (14)), the Fanning friction factor (Cf) isobtained from the Blasius equation:
Cf=0.0792�rLULd
mL
�−0.25
, (15)
where d is the diameter of the tubing. For theabove calculations, the measured viscosity of thealgal culture was virtually the same as that ofwater.
In practice, because of low pressure ratings oftypically used transparent materials of construc-tion, a culture velocity as high as 1.14 m s−1
cannot be attained in long-run continuous tub-ings. Typically, the culture velocity in tubularloops does not exceed 0.5 m s−1, or less than halfthe damaging threshold value. In theory, highculture velocities should benefit productivity byincreasing the allowable length of a continuousrun tube before oxygen concentration builds up tohigh inhibitory levels. In reality, pumping be-comes difficult as the tube length increases. The
cell damaging potential of pumps is another con-sideration that is especially relevant to tubularphotobioreactor culture. Damage in pumps istreated elsewhere (Chisti, 1999a).
2.4. Gas– liquid mass transfer
Microalgae generate oxygen during photosyn-thesis, hence, dissolved oxygen levels equivalent toseveral times air saturation are easily reached inclosed cultures. Oxygen concentrations above airsaturation generally inhibit photosynthesis in mi-croalgae (Aiba, 1982). In studies with Chlorella6ulgaris, Markl and Mather (1985) noted that therate of photosynthesis increased by 14% whenthere was almost no dissolved oxygen. Saturationof the medium with pure oxygen reduced thephotosynthesis rate by 35%. Accumulation ofoxygen to inhibitory levels is a major problem inhorizontal tubular photobioreactors and thisproblem becomes more severe as the length ofcontinuous run tubing increases. With Spirulinaplatensis under intense artificial illumination, oxy-gen production rates have been estimated at 0.35–0.5 g l−1 h−1 for radiation intensity levels of1500–2600 mE m−2 s−1 (Tredici et al., 1991). Inone case, a tubular photobioreactor designed as acommercial production unit with several kilome-ter long tube runs (Fig. 1) failed to produce partlybecause of oxygen accumulation. This device wasapparently the largest horizontal tube photobiore-actor ever constructed and it’s failure is clearevidence of limited scalability of this type ofbioreactor. Existing functioning tubular photo-bioreactors are typically a mere fraction of thesize of the device shown in Fig. 1.
Oxygen removal into the exhaust gas-phase issubstantially greater in pneumatically agitatedvertical reactors than in horizontal tubes. Forexample, for a power input value of 24 W m−3—the lowest value in Fig. 2a—the overall volumet-ric gas–liquid mass transfer coefficient (kLaL) inthe bubble column was estimated at 0.0037 s−1
using the equation
kLaL=2.39×10⁻⁴�PG
VL
�0.86
. (16)

A. Sanchez Miron et al. / Journal of Biotechnology 70 (1999) 249–270264
Eq. (16) applies to air–water systems (Chisti,1989). The estimated kLaL in the column wasabout 4-fold the estimated value for a horizontaltube with a reported 3% maximum gas holdup(Camacho Rubio et al., 1999). In view of theseresults, vertical tubular photobioreactors such asbubble columns should easily maintain a dis-solved oxygen level only a little higher than the airsaturation value. Consequently, vertical reactorswill experience little oxygen inhibition. Indeed, inone case the dissolved oxygen level did not exceedthe air saturation value during outdoor culture ofP. tricornutum in a draft-tube airlift reactor (Con-treras, 1996). Because of a reduced level of dis-solved oxygen, the photooxidation-associated lossof biomass and product metabolite will be lowerin vertical reactors. Photooxidation occurs espe-cially when high levels of dissolved oxygen com-bine with an intensely irradiated environment.
2.5. O6erall producti6ity: the case of EPA
Eicosapentaenoic acid (EPA) is a polyunsatu-rated fatty acid that is potentially medically sig-nificant in treatment of certain cancers and heartdisease (Rambjor et al., 1996; Simonsen et al.,1998). EPA is produced by several microalgae andsome other microorganisms. EPA occurs also infish oil. Current annual demand of EPA is ap-proximately 125 tonnes in Japan alone and aworld-wide demand has been estimated at 300tonnes per annum (Corden, personal communica-tion). A facility producing just 20 tonnes EPA perannum from microalgal sources would need togenerate 24 tonnes of wet biomass daily, operat-ing continuously for 95% of the calendar year.This figure assumes an EPA content of about 2%(w/w, dry weight basis) in P. tricorntum, an opti-mistic 80% recovery of the EPA and 85% mois-ture in the biomass. For this production capacity,an optimally operated horizontal tubular photo-bioreactor (0.06 m tube diameter) would have avolume of 2350 m3. This volume is based on anexperimentally observed dry biomass productivityof 2.02 kg m−3 d−1 in June, or an average annualproductivity of 1.535 kg m−3 d−1. The lattervalue accounts for the experimentally documented8% per month decline in productivity going from
mid summer to mid winter (Acien Fernandez etal., 1998). Such a reactor will occupy a surfacearea of about 14.1 ha. This estimation of surfacearea assumes an optimal distance of 0.11 m be-tween adjacent parallel horizontal tube runs. Intheory, this distance could be reduced by halfalthough some loss of productivity would occurdue to mutual shading.
A bubble column tank farm for the same 20tonne annual EPA production would have a totalvolume of 8220 m3 based on experimentally mea-sured dry biomass productivity of 0.64 kg m−3
d−1 in June, or a mean annual productivity of0.486 kg m−3 d−1. Such a tank farm will occupyan area 16.3 ha. Each bubble column would be0.2 m in diameter, 2.1 m tall, with a culturevolume of about 0.06 m3. East–west orientedrows, 995 m long, will have a spacing of 0.35 mbetween column centers, inter-row spacing will be3.4 m measured between column centers. Becausea 3.4 m inter-row spacing results in mutual shad-ing of columns for part of the year, the meanannual volumetric productivity of biomass de-clines to 0.439 kg m−3 d−1, or about 90% of theunshaded productivity. The land use efficiencymay seem lower for the bubble column tank farm,however, the column height used was only 2.1 mand efficiency improves with increasing columnheight as shown in Fig. 13. Thus, for a morerealistic column height of 4 m, the total volumeneeded to for 20 tonnes per annum EPA capacitywill be about 10 120 m3. The mean annual volu-metric productivity of biomass will decline furtherto 0.356 kg m−3 d−1 because of increased mutualshading of the taller columns, but the area de-mand will reduce to �40% of that with 2.1 mcolumns. Because of the larger volume percolumn, fewer columns will be needed. The effectof bubble column height on mean annual volu-metric biomass and EPA productivities is shownin Fig. 14 for a facility with 46 columns arrangedin four east–west oriented rows with 3.4 m inter-row spacing. The volumetric productivity declineswith increasing column height because of in-creased duration of the mutually shaded period.The increased production with increasing columnheight (Fig. 13) occurs because the culture volumedepends directly on height and more volume is

A. Sanchez Miron et al./ Journal of Biotechnolgoy 70 (1999) 249–270 265
accommodated on a given land surface whentaller columns are employed. Because tallercolumns have reduced volumetric productivity asa result of longer periods of mutual shading,increasing height does not increase the annualproduction linearly (Fig. 13). Beyond a height of5 m, the annual production from a given area isno longer sensitive to column height (Fig. 13)because the decline in volumetric productivity ex-actly balances the effect of increased volume.
The biomass productivity numbers used inthese estimations were obtained in a 0.2 m3 hori-zontal tubular reactor that occupied an area of 12m2. The reactor was located on a reflective surfacewith an albedo of 2 and it produced P. tricorntumbiomass. The culture was carried out in Mannand Myers (1968) medium (Table 2) formulated insea water (Table 1) at 3-fold concentration thanrecommended by Mann and Myers (1968). Theoptimal dilution rate during the summer (June)was �0.05 h−1, giving a biomass productivity of2.02 kg m−3 d−1 with 4 kg m−3 biomass in theeffluent. The maximum a real productivity of thereactor was a mere 0.034 kg m−2 d−1.
As noted earlier, the experimental productivityin a single 2 m tall column, 0.2 m in diameter, was0.64 kg m−3 d−1 in June. The maximum arealproductivity of the single reactor was 0.093 kgm−2 d−1, accounting for the 1.3 m shadow lengthand 0.3 m effective width of the column. Theculture medium was a modified Ukeles (1961)medium (Garcıa Sanchez, 1994) made in sea water(Table 1) at three times the components concen-trations noted in Table 2. Differences in mediahad no effect on culture behavior.
Comparing superficially, the mean annual volu-metric productivity of the vertical column wasonly 30% of that of the horizontal tubular loop,however, it needs emphasizing that the horizontaldevice was located on a reflective surface thatenhanced the total incident radiation on it’s sur-face by a factor of two. If the vertical column isplaced on a similarly reflective background itsproductivity will increase minimally by a factor of1.8; hence, comparing on an equal basis, thevolumetric productivity of the vertical unit isabout 57% of that in the horizontal device.
Fig. 13. Annual biomass and EPA production of a multiple bubble column facility as a function of column height. Column diameterwas 0.2 m. Forty-five columns were accommodated on a 13.9×5.9 m surface with 3.4 m center-to-center between east–west orientedrows.

A. Sanchez Miron et al. / Journal of Biotechnology 70 (1999) 249–270266
Fig. 14. Effect of bubble column height on mean annual volumetric productivity of biomass and EPA. Forty-five columns wereplaced on a 13.9×5.9 m surface with 3.4 m center-to-center between east–west oriented rows.
In any outdoor culture, the mean monthly pro-ductivity varies during the year because of cyclicchanges in external irradiance: in horizontally ori-ented photobioreactors productivity peaks duringsummer when the Sun is highest on the horizon.Productivity is lower during winter. As notedearlier, the experimentally measured decline inproductivity is about 8% per month going frommid summer to mid winter for horizontally placedtubes (Acien Fernandez et al., 1998). Whether thesame level of decline would occur in vertical tubesremains to be confirmed. Annual variation inproductivity in a vertical photobioreactor mayfollow a different cyclic pattern than observedwith horizontal devices. During summer when theSun is highest on the horizon, a vertical bubblecolumn should experience lower average irradi-ance than in winter when the direct radiationfrom the Sun affects a greater part of the reactor’ssurface. This variation is similar to that seen inthe gas-free state in Figs. 3–6, except that thecycle is annual. This annual cyclic pattern hasimportant advantages for the vertical orientedphotobioreactors. Higher irradiance levels in thewinter should reduce any heating demand whereas
lower irradiance in the summer should reduce theneed for cooling. Furthermore, the low surface–to–volume ratio should help reduce heat lossesduring the night.
The expected variation in biomass and EPAproduction for a bubble column farm and a hori-zontal tubular loop photobioreactor occupyingthe same land area (82 m2) is shown in Fig. 15.The production rate values in Fig. 15 are for asystem in which the adjacent horizontal tubes of0.06 m diameter are spaced optimally at 0.11 m,whereas the bubble columns are spaced 0.3 mwall-to-wall within an east–west row and theinter-row spacing is 3.4 m. Again, the assumedmean annual culture biomass productivity is 0.438kg m−3 d−1 based on experimentally observedproductivity of 0.64 kg m−3 d−1 in a singlebubble column for cultures of P. tricornutum dur-ing June. For the tubular loop system, the as-sumed average annual productivity is 1.535 kgm−3 d−1. The bubble column diameter used is0.2 m and the column height is 2 m. This diameteris close to the maximum practicable in view of thelight penetration needs.

A. Sanchez Miron et al./ Journal of Biotechnolgoy 70 (1999) 249–270 267
For a given land area and 0.2 m diametercolumns, the annual biomass production increaseswith culture height as shown in Fig. 13 eventhough the volumetric productivity declines (Fig.14). The optimal column height is about 5 m (Fig.13), but because of considerations such as windspeed and strength of optically transparent mate-rials such as glass and thermoplastics, the maxi-mum permissible height is 4 m. The effect ofinter-row spacing of 2 m tall columns (0.2 mdiameter) on annual production from a fixed landarea of 82 m2 is shown in Fig. 16. Clearly, toattain maximum yield while keeping the numberof columns to a minimum implies an optimalinter-row spacing of between 2.5 and 3.5 m.
Use of multiple vertical columns has other im-portant advantages: (i) a more uniform and bettercontrolled pH than could ever be possible in aplug flow tubular loop; (ii) improved culture ho-mogeneity and, therefore, a consistent metabolicstate of the cells; (iii) greater operational flexibilityin view of the ability to easily vary the number ofcolumns in production at a given time; (iv) abilityto culture several different algae at the same timein separate units; and (v) substantially reduced
need for pumping the culture as there would beno recirculation. Flow management among theindividual column bioreactors as well as samplingcan be easily automated (Chisti, 1998b). Similarly,rapid and automatic clean–in–place and chemicalsterilization of individual photobioreactor unitsbecomes feasible (Chisti and Moo-Young, 1994;Chisti, 1999b) while a part of the facility remainsin production.
Among factors that could significantly improvethe EPA–from–microalgae process feasibility isimproved yield. Raising EPA content of thebiomass from the current 2% of dry weight to 3%under consistent outdoor production will reducethe production facility size by about 30%. Simi-larly, a 50% improvement in bubble columnbioreactor productivity from the current 0.486–0.729 kg m−3 d−1 (no shading) will reduce thefacility size further. Overall, with these two im-provements, a 20 tonne per annum bubble columnbased EPA facility will require a volume of 3653m3, or less than 45% of the volume needed whenthe yield and illumination are not enhanced. Boththe noted improvements are realistic. EPA con-tent of biomass may be improved by geneticmanipulation and selection of better producingstrains of P. tricornutum. Accomplishing this willaffect the bubble column and the tubular loopbased facilities equally. Improved illuminationand consequent biomass productivity enhance-ment is feasible only for the bubble column sys-tem as the tubular loop productivity numbers arealready the maximum attainable in an outdoorsystem with the external irradiance level enhancedto twice the direct radiation from the Sun. Thebubble column volumetric productivity can befurther enhanced by employing artificial illumina-tion at night, technology exists for placing a lowpower vertical light source at the axis of thecolumn. This kind of efficient internal illumina-tion is not practicable in horizontal tubular loops.Of course, artificial illumination may add to capi-tal cost and it will certainly add to the operatingexpense, but for sufficiently high-value productsthe improved productivity may more than com-pensate for the greater expense.
Table 2Composition of the media
Component Concentration (kg m−3)
Mann and Modified Ukeles’Myers (1968) medium
MgSO4 · 7H2O 1.20 –1.00NaNO3 1.000.30CaCl2 –
K2HPO4 –0.10NaH2PO4 · 2H2O 0.016–
0.03Na2EDTA 0.016×10⁻³H3BO3 –2×10⁻³FeSO4 · 7H2O ––Fe(III) citrate 4.9×10⁻³
MnCl2 1.4×10⁻³ ––MnCl2 · 4H2O 9.9×10⁻⁴
ZnSO4 · 7H2O –3.3×10⁻⁴
ZnCl2 1.36×10⁻⁴–Co(NO3)2 · 6H2O –7.0×10⁻⁶
2.4×10⁻⁵–CoCl2 · 6H2OCuSO4 · 5H2O 2.0×10⁻⁶ 2.5×10⁻⁵
2.42×10⁻⁴–Na2MoO4 · 2H2O

A. Sanchez Miron et al. / Journal of Biotechnology 70 (1999) 249–270268
Fig. 15. Mean monthly biomass and EPA production rates of a bubble column (0.2 m diameter, 2 m tall, 3.4 m center-to-centerbetween east–west oriented rows) farm and a horizontal tubular loop photobioreactor (0.06 m tube diameter) occupying equal landareas (82 m2). The column farm accommodated 45 columns.
Fig. 16. Effect of inter-row spacing on annual production from 82 m2 land area accommodating a maximum number of bubblecolumns (2 m tall, 0.2 m diameter) in 13.9 m long east–west oriented rows.
3. Conclusions
Horizontal tubular photobioreactors are gener-ally believed to be the most practicable culture
system for fully contained large-scale monocultureof microalgae, nevertheless, as discussed here, de-tailed analyses reveal severe limitations of tubularphotobioreactors. Unless the concentration of the
A. Sanchez Miron et al./ Journal of Biotechnolgoy 70 (1999) 249–270 269
desired microalgal metabolite in the biomass isunusually high and the market size for theproduct is exceedingly small, the use of horizontaltubular photobioreactors would be impossible incommercial production. Unlike horizontal tubulardevices, vertical reactors such as bubble columnsand airlift vessels appear to be the only ones thatcan be effectively used in large-scale culture ofmicroalgae. As demonstrated here, overall, thevertical bubble columns perform better than thehorizontal loops. Bubble columns are morescaleable and provide a relatively homogeneousculture environment. In addition, the low sur-face–to–volume bubble columns demand lesscooling. Vertical columns experience less photoin-hibition during periods of high light intensity;during low light seasons such as winter, the verti-cal reactors still receive substantial total radiationbecause they receive more reflected light than dohorizontal tubes. So far, bubble columns andairlift bioreactors have been ignored for large-scale culture of photosynthetic organisms, an ob-vious low surface–to–volume ratio of thesedevices relative to horizontal tubular loops has inthe past been automatically perceived as a barrierto their use, but such perceptions have never beensubstantiated.
4. Nomenclature
cross-sectional area of downcomer zoneAd
(m2)Ar cross-sectional area of riser zone (m2)Cf Fanning friction factor
diameter (m)dmean bubble diameter (m)dB
E energy dissipation rate per unit mass (Wkg−1)
EPA eicosapentaenoic acidgravitational acceleration (m s−2)gheight of the column (m)hc
solar hour (h)"kLaL overall volumetric gas–liq-
uid mass transfer coefficient for oxygen(s−1)
length of tubing (m)L
length of the shadow from the column’sLs
base (m)l length scale of microeddies (m)
day of the yearNNB number of bubbles in dispersion
pressure drop (Pa)DPPG power input due to aeration (W)UL superficial liquid velocity in the tube (m
s−1)volume of gas–liquid dispersion inVD
bioreactor (m3)VG volume of gas in liquid (m3)
volume of liquid in bioreactor (m3)VL
Greek symbolsd declination the angular position of the
Sun at solar noon with respect to theplane of the equator, north positive(−23.45° 5 d 5 23.45°), defined byEq. (11)
o fractional gas holdupangle of incidence defined by Eq. (9)ui
mL viscosity of liquid (Pa s)density of liquid (kg m−3)rL
f geographic latitudev angle corresponding to the solar hour,
defined by (Eq. (10)
Acknowledgements
This work was supported by the EuropeanCommission contract BRPR CT970537 and CI-CYT (BIO-98-0522), Spain.
References
Acien Fernandez, F.G., Garcıa Camacho, F., Sanchez Perez,J.A., Fernandez Sevilla, J.M., Molina Grima, E., 1998.Modelling of biomass productivity in tubular photobiore-actors for microalgal cultures: Effects of dilution rate, tubediameter and solar irradiance. Biotechnol. Bioeng. 58,605–616.
Aiba, S., 1982. Growth kinetics of photosynthetic microorgan-isms. Adv. Biochem. Eng. 23, 85–156.
Borowitzka, M.A., 1996. Closed algal photobioreactors: de-sign considerations for large–scale systems. J. Mar. Bio-technol. 4, 185–191.

A. Sanchez Miron et al. / Journal of Biotechnology 70 (1999) 249–270270
Camacho Rubio, F., Acien Fernandez, F.G., Sanchez Perez,J.A., Garcıa Camacho, F., Molina Grima, E., 1999. Pre-diction of dissolved oxygen and carbon dioxide concentra-tion profiles in tubular photobioreactors for microalgalculture. Biotechnol. Bioeng. 62, 71–86.
Chisti, Y., 1989. Airlift Bioreactors. Elsevier, New York, p.355.
Chisti, Y., 1998a. Pneumatically agitated bioreactors in indus-trial and environmental bioprocessing: Hydrodynamics,hydraulics and transport phenomena. Appl. Mech. Rev.51, 33–112.
Chisti, Y., 1998b. Biosafety. In: Subramanian, G. (Ed.),Bioseparations and Bioprocessing: A Handbook, vol. 2.Wiley-VCH, New York, pp. 379–415.
Chisti, Y., 1999a. Shear sensitivity. In: Flickinger, M.C.,Drew, S.W. (Eds.), Encyclopedia of Bioprocess Technol-ogy. Wiley, New York, pp. 2379–2406.
Chisti, Y., 1999b. Process hygiene: (e) modern systems of plantcleaning. In: Robinson, R., Batt, C., Patel, P. (Eds.),Encyclopedia of Food Microbiology, Academic Press,London (in press).
Chisti, Y., Moo-Young, M., 1994. Clean-in-place systems forindustrial bioreactors: design, validation and operation. J.Ind. Microbiol. 13, 201–207.
Contreras, A., 1996. Caracterizacion de una columna de bur-bujeo con recirculacion interna. Aplicacion al cultivo dePhaeodactylum tricornutum. Ph.D. Thesis, University ofAlmerıa, Almerıa, Spain.
Contreras, A., Garcıa, F., Molina, E., Merchuk, J.C., 1998.Interaction between CO2-mass transfer, light availabilityand hydrodynamic stress in the growth of Phaeodactylumtricornutum in a concentric tube airlift photobioreactor.Biotechnol. Bioeng. 60, 318–325.
Emery, A.N., Lavery, M., Williams, B., Handa, A., 1987.Large-scale hybridoma culture. In: Webb, C., Mavituna, F.(Eds.), Plant and Animal Cells: Process Possibilities. EllisHorwood, Chichester, pp. 137–146.
Garcıa Camacho, F., Contreras Gomez, A., Acien Fernandez,F.G., Fernandez Sevilla, J., Molina Grima, E., 1999. Useof concentric-tube airlift photobioreactors for microalgaloutdoor mass cultures. Enzyme Microbial. Technol. 124,164–172.
Garcıa Sanchez, J.L., 1994. Estudio multifactorial de nutrien-tes para el crecimiento de la microalga marina Isochrysisgalbana. Evaluacion en un fotobiorrecator tubular externo.Ph.D. Thesis, University of Almerıa, Spain.
Kobayashi, K., Fujita, K., 1997. Tube diameter on tubular
photobioreactor for microalgal culture and its biomassproductivity. J. Chem. Eng. Jpn. 30, 339–341.
Lee, Y.K., 1986. Enclosed bioreactors for the mass cultivationof photosynthetic microorganisms: the future trend. TrendsBiotechnol. 4, 186–189.
Lewin, J.C., Lewin, R.A., Philpott, D.E., 1958. Observationson Phaeodactylum tricornutum. J. Gen. Microbiol. 18,418–426.
Liu, B.Y.H., Jordan, R.C., 1960. The interrelationship andcharacteristic distribution of direct, diffuse and total solarradiation. Solar Energy 7, 53–65.
Mann, J.E., Myers, J., 1968. On pigments, growth and photo-synthesis of Phaeodactylum tricornutum. J. Phycol. 4, 349–355.
Markl, H., Mather, M., 1985. Mixing and aeration of shallowopen ponds. Arch. Hydrobiol. Beih. 20, 85–93.
Molina Grima, E., Acien Fernandez, F.G., Garcıa Camacho,F., Chisti, Y., 1999. Photobioreactors: Light regime, masstransfer and scaleup. J. Biotechnol. 70, 233–249.
Rambjor, G.S., Walen, A.I., Windsor, S.L., Harris, W.S.,1996. Eicosapentaenoic acid is primarily responsible forhpotriglyceridemic effect of fish oil in humans. Lipids 40(Suppl. 5), 45–49.
Silva, H.J., Cortinas, T., Ertola, R.J., 1987. Effect of hydrody-namic stress on Dunaliella growth. J. Chem. Technol.Biotechnol. 40, 41–49.
Simonsen, S., van’t Veer, P., Strain, J.J., et al., 1998. Adiposetissue omega-3 and omega-6 fatty acid content and breastcancer in the EURAMIC study. Am. J. Epidemiol. 147,342–352.
Suzuki, T., Matsuo, T., Ohtaguchi, K., Koide, K., 1995.Gas-sparged bioreactors for CO2 fixation by Dunaliellatertiolecta. J. Chem. Technol. Biotechnol. 62, 351–358.
Tramper, J., Joustra, D., Vlak, J.M., 1987a. Bioreactor designfor growth of shear-sensitive insect cells. In: Webb, C.,Mavituna, F. (Eds.), Plant and Animal Cells: ProcessPossibilities. Ellis Horwood, Chichester, pp. 125–136.
Tramper, J., Smit, D., Straatman, J., Vlak, J.M., 1987b.Bubble column design for growth of fragile insect cells.Bioprocess. Eng. 2, 37–41.
Tredici, M.R., Carlozzi, P., Zittelli, G.C., Materassi, R., 1991.A vertical alveolar panel (VAP) for outdoor mass cultiva-tion of microalgae and cyanobacteria. Bioresour. Technol.38, 153–159.
Ukeles, R., 1961. The effect of temperature on the growth andsurvival of several marine algae species. Biol. Bull. 120,255–264.
.


![COMPACT guide translation AD MB AD · 2020. 4. 21. · 1 COMPACT [Comparative Analysis of Conspiracy Theories] [dt. Vergleichende Analyse von Verschwörungstheorien] ist ein von der](https://img.dokumen.tips/doc/110x75/5fd67c954b83aa1bf512c87d/compact-guide-translation-ad-mb-ad-2020-4-21-1-compact-comparative-analysis.jpg)