Embed Size (px)
Citation preview

Research ArticleComparative Assessment of SVC and TCSC Controllers on theSmall Signal Stability Margin of a Power System IncorporatingIntermittent Wind Power Generation
T R Ayodele
Department of Electrical Engineering Faculty of Technology University of Ibadan Ibadan 0037 Nigeria
Correspondence should be addressed to T R Ayodele tayodele2001yahoocom
Received 9 August 2014 Accepted 24 November 2014 Published 11 December 2014
Academic Editor Ujjwal K Saha
Copyright copy 2014 T R AyodeleThis is an open access article distributed under the Creative Commons Attribution License whichpermits unrestricted use distribution and reproduction in any medium provided the original work is properly cited
Wind power is highly variable due to the stochastic behavior of wind speeds This intermittent nature could excite theelectromechanical modes resulting in the small signal instability of a power system In this study the performance of static VARcompensation (SVC) and thyristor controlled series capacitor (TCSC) controllers in the damping of electromechanical modesis analyzed and compared The study employs probabilistic modal analysis method using Monte Carlo simulation and Latinhypercube sampling techniques Various scenarios are created to get insight into the study The results obtained from the modalanalysis are verified by using the time-domain simulation Some of the key results show that SVC is more robust in the dampingof electromechanical modes compared to TCSC The result also reveals that allocation of power system stabilizer (PSS) usingprobabilistic method is more effective and robust compared to deterministic approach
1 Introduction
The complexity of power system has increased due to highrate of growth of power demands and the increasing pene-tration of renewable energy generators (REGs) on the grid inrecent years has further pushed the operation of the existingtransmission lines closer to their operating limit This hasnecessitated the need to understand the impact of REGs onthe overall stability of a power system The output powerof most REGs (wind generators PV small hydrogeneratorsetc) is highly variable and can have considerable effect onthe dynamic behavior of a power system leading to powerswing and less synchronizing coupling [1] Wind generatorshave been the most proliferated REG in recent time This is aresult of its technologicalmaturity and the availability of windresources in many regions of the world [2] The present andthe progressive scales of integration have generated concernabout the possible impact it may have on the power systemgrid integrity Most of the large wind farms are located wherethe wind resources are found hence they are far from theload center and are connected to relatively weak grid [3]The presence of wind generators connected to such weak
transmission networks incurs serious concern about systemstability system security and power quality Small signalstability is a key issue in the study of grid impact of windpower integration as a result of its intermittent nature [4 5]Small signal stability is concerned with the ability of a powersystem to ascertain a stable operating condition followinga small perturbation around its operating equilibrium [6]Modal analysis is widely recognized for the analysis of smallsignal stability of a power system The analysis is carriedout based on the system nonlinear equations describing thedynamic behavior of the system linearized about a chosenoperating point
In order to take into consideration the stochastic natureof wind power probabilistic modal analysis method viaMonte Carlo simulation (MCS) is employed using MAT-LAB based power system toolbox (PST) The wind speedsused for the generation of intermittent wind power aredrawn from Weibull distribution using Latin hypercubesampling (LHS) techniques The use of LHS reduces thenumber of iterations required in traditional MCS and hencereduces computational effort and cost The basic outline of
Hindawi Publishing CorporationJournal of Wind EnergyVolume 2014 Article ID 570234 12 pageshttpdxdoiorg1011552014570234
2 Journal of Wind Energy
the procedures for generating LHS as used in this paper isgiven in Appendix A However details on the application ofLHS techniques to probabilistic small signal stability can befound in Ayodele et alrsquos work [7]
FACTS controllers have been extensively used to improvethe steady-state control problems and enhancing power sys-tem stability in addition to the main function of power flowcontrol [8] Damping electromechanical power oscillationshas been recognized as an important issue in electric powersystem operation Application of power system stabilizers(PSS) with increasing transmission line loading over longdistances may in many cases not provide sufficient dampingfor interarea power swings In such cases other solutions forpower oscillation damping are needed Fuzzy logic controlledenergy storage (energy capacitor system) has been used toenhance the overall stability of electric power system [9]Hossain et al compared SVC and STATCOM in the improve-ment of voltage stability and concluded that STATCOMprovides better response during low voltage compared to SVC[1] The performance of three FACTS controllers namelystatic compensator (STATCOM) static synchronous seriescompensator (SSSC) and the unified power flow controller(UPFC) was studied in [10] using current injection modelThemodel was applied to damping electromechanicalmodesAccording to their results UPFC is the most effective FACTScontroller for damping interarea oscillations and SSSC ismore effective than STATCOM Comparison of proportionalintegrated derivative (PID) power system stabilizer (PSS)and thyristor controlled dynamic brake (TCDB) in smallsignal stability study has been presented by Balwinder [11]It was concluded that combination of PID with TCDB offersbetter improvement in oscillation damping Application ofcontrollable series compensator (CSC) in damping powersystem oscillation was investigated on the basis of Philip-Heffron model by Swift and Wang [12] In their workthe capability of CSC controller was analyzed in terms ofits damping torque contribution both for single machineinfinite bus and for multimachine power system The sameauthors later compared the effectiveness of damping torqueof FACTS devices namely SVC CSC and phase shifter(PS) to power system [13] It was concluded that SVC andCSC damping provide more damping torque during highload conditions while PS damping control does not dependon system load condition However none of the aforemen-tioned study compared SVC and thyristor controlled seriescapacitor (TCSC) controllers Moreover none of the studiesincorporates wind power in their study In the present studySVC and TCSC controllers are compared for the dampingof electromechanical mode of a wind generator connectedpower system considering the intermittent nature of windpower using probabilistic approach
2 Model Description
Analysis of small signal stability in an interconnected powersystem requires adequate model describing various compo-nents making up the system Therefore this section presentsthe model approach of these components
Rotor speeddeviation Gain Washout filter
KPSSsTW
1 + sTW
1 + sT11 + sT2
1 + sT3
1 + sT4
Vs max
Vsmin
Vs
Leadlag
Figure 1 PSS block diagram design
21 Synchronous Generator Model Synchronous machinecan bemathematically modeled as either elementary classicalmodels or detailed ones In the detailedmodels transient andsubtransient phenomena are considered [14 15] In this studydetailed model is employed to model all the synchronousgenerators
The mechanical variables are linked with the electricalvariables using the following [16]
(119863 + 119879119895119878) = 119879119898 minus (11986410158401015840119902 119868119902 + 119864
10158401015840119889 119868119889)
119878120575 = 120596 minus 1(1)
where 119863 and 119879119895 represent the damping constant and theinertia time constant respectively 119879119898 stands for the inputmechanical torque 120596 and 120575 represent the rotational speedand rotor angle respectively 11986410158401015840119889 and 119864
10158401015840119902 correspond to the
subtransient generated voltage in the direct and quadratureaxes and 119868119889 and 119868119902 stand for the armature current in the directand quadrature axes respectively
22 Power System Stabilizer (PSS) Model The input signalto PSS may be rotor speed rotor angle or a combination ofthis signal The linearized differential equation of PSS can bewritten as follows [11]
119889Δ119883119882(Pss)119889119905
= 119870PSSΔsdot120596 minus 1119879119882Δ119883119882(PSS) (2)
119889Δ119883(Pss)119889119905
= 11987911198792Δsdot
119883119882(PSS) +11198792Δ119883119882(PSS) minus
11198792Δ119883119882(PSS)
(3)
119889Δ119881119904(Pss)119889119905
= 11987931198794Δsdot
119883(PSS) +11198794Δ119883(PSS) minus
11198794Δ119881119904(PSS) (4)
where 119889Δ119883119882(Pss) represent the output of washout filter119889Δ119883(Pss) represent the output of first lag-lead network Δ119881119904is the output signal of PSS block and 119879119882 is the washout timeconstant 1198791 and 1198793 are lead-time constants while 1198792 and 1198794are the lag time constants of lag-lead network Figure 1 depictsthe PSS block diagram design
23 SVC Controller Model Facts controllers are electronicdevices that are used to enhance power system performance[17] SVC is used to inject a controlled capacitance or induc-tive current in order to control specific variables mainly busvoltage [18] There are basically two configurations of SVCthe fixed capacitor (FC) with thyristor controlled reactor(TCR) and the thyristor switched capacitor (TSC) with TCRThemodel of SVCas implemented inPST software is depictedin Figure 2
Journal of Wind Energy 3
Vref
VT
+
+
+
Σ
SVC-sig
KR
1 + sTR
BSVC max
BSVC
BSVC min
Figure 2 SVC model
24 TCSC Controller Model TCSC has proven to be veryrobust and effective in the of power system oscillations Thedamping effect is obtained by inserting the TCSC in theinterconnecting transmission line and executing reactancemodulation in phase with the speed difference between thegenerators connected to the two terminals of the line Thedamping effect of TCSC has the following benefits [19]The effectiveness of the TCSC for controlling power swingsincreases with higher levels of power transfer the dampingeffect of a TCSC on an inertia is unaffected by the locationof the TCSC the damping effect is insensitive to the loadcharacteristic when a TCSC is utilized to damp interareamodes and it does not excite any local modes in the process[18]The TCSCmodel as implemented in this paper is shownin Figure 3 where 119883119898 is the stability control modulationreactance value which is determined by the stability ordynamic control loop 119883119890119900 is the steady state reactance orset point of the TCSC whose value is determined by thesteady state control loop and 119883119890 is the equivalent capacitivereactance of the TCSC
25 Wind Energy Conversion System Model
251 Wind Speed Model The intermittent nature of windpower is a result of the stochastic nature of wind speed whichis the prime mover of any wind energy conversion systemtherefore adequate model of wind speed that will capture thevariability of wind power is required In this study the windspeed is modelled using two-parameter Weibull distributionwhich is found to be appropriate for modelling wind speed inmany regions of the world [20ndash22] Two-parameter Weibulldistribution can be represented as (5) [23] where 119891119882(V) isthe probability of observing wind speed (V) and 119896 and 119888 arethe Weibull shape and scale parameters of the distributionrespectivelyThe shape and the scale parameters are providedin Table 7 in the Appendix B
119891119882 (V) =119896119888(V119888)119896minus1
exp [minus(V119888)119896
] (5)
252 Wind Generator Model The variable speed wind tur-bine is being considered as the most promising amongthe technologies for grid connection of wind generatorstoday However a significant number of fixed speed windturbines are still in operation In this study fixed speed wind
generator made of squirrel cage induction generator (SCIG)is employed Figure 4 gives the schematic diagram of theelectrical power output (119875119890) of a typical wind turbine Not allthe energy in the mass of moving air can be converted intoelectrical powerThe amount of energy that can be convertedinto useful electrical power depends on the coefficient of theperformance of the turbine the transmission efficiency andthe generator efficiency This can be written as
119875119890 =12120588119860119862119901120578119898120578119892V
3 (6)
where 119862119901 is the coefficient of the performance of the turbineit is a function of the tip speed ratio and the pitch angleTheoretically it has a maximum value of 059 known as theBetz limit 120578119898 is the mechanical transmission efficiency and120578119892 is the generator efficiency The generated active power ofwind generator was modeled as [22]
119875119890(V119894) =
119875119903V2119894 minus V
2ci
V2119903 minus V2ci (Vci le V119894 le V119903)
119875119903 =12120588119860119862119901120578119898120578119892V3119903 (V119903 le V119894 le Vco)
0 (V119894 le Vci V119894 ge Vco)
(7)
where V119894 is the vector of wind speeds generated accordingto the Weibull distribution of known parameters 119875119890(V119894) is thevector of active wind power generated in accordance with thestochastic wind speed and power curve of a wind turbine Vciis the cut-in wind speed V119903 is the rated wind speed Vco is thecut-out wind speed and119875119903 is the rated powerThe parametersof the wind turbine are provided in Table 7 in Appendix B
253 Reactive Power Model of Wind Generator The activepower injected into the grid is derived from the power curveof the wind turbine with the prior knowledge of wind speedand its distribution The reactive power absorbed or injectedfrom or into the grid respectively can be derived using thesteady state equivalent circuit of an asynchronous inductiongenerator as shown in Figure 5 where 119880 is the terminalvoltage 1198831 is the stator reactance 1198832 is the rotor reactance119883119898 is themagnetising reactance and 1199032 is the rotor resistanceThe stator resistance is neglected From the circuit the realpower injected to the grid can be calculated as
119875119890(V119894) =minus1198802 (1199032119904119894)(1199032119904119894)
2 + 1198832 (8)
where119883 = 1198831 +1198832 and 119875119890(V119894) is the generated active power atdifferentwind speeds according to the power curve in (3)Theamount of reactive power absorbed from the grid depends onthe rotor slip 119904119894 which also changes as the wind power variesin accordance with the variations in wind speed Based on(8) 119904119894 was derived as (9)The reactive power119876(V119894) absorbed at
4 Journal of Wind Energy
Steady statecontrol loop
Stability controlloop
Input signal
Reference setpoint
+
+Σ
KR
1 + sTR
Xm
Xeo
Xe
Xemax
Xemin
(a)
Input signal 1 + sT11 + sT2
1 + sT3
1 + sT4
XKWsTW
1 + sTW
(b)
Figure 3 (a) TCSC model for stability study and (b) TCSC stability control loop
Turbine Transmission GeneratorPm
WmCP 120578m 120578g
Pt
Wt
PePW
Figure 4 Block diagram of wind generator electrical power output
U
r2sX1 X2
Xm
Figure 5 State equivalent circuit of an asynchronous generator
different wind speeds can be computed as (10) Consider thefollowing
119904119894 =minus1198801199032 + radic119880411990322 minus 1198752119890(V119894)119883
2119903222119875119890(V119894)119883
2(9)
119876(V119894) =1199042119894119883(119883 + 119883119898) + 119903
22
1199041198941198831198981199032119875119890(V119894) (10)
Different slip and reactive power can be obtained from therelation between active power and reactive power for differentgenerated active power depending on the wind speed
254 Wind Farm Model The combination of several WECSconstitutes a wind farm which may be of the same type ordifferent types The power output of a wind farm is the totalsum of the output power of individual WECS For a windfarmwith119873numbers ofWECS the output power of thewindfarm (119875119890(V119894)119908119891) at different wind speeds (V119894) can be written as
119875119890(V119894)119908119891 =119873
sum119896=1
119899119896119875119890(V119894)119896 (11)
where 119899119896 indicates the number of WECS of type 119896 and 119875119890(V119894)119896is the output electrical power of type 119896WECS Similarly thereactive power absorbed by the wind farm can be expressedas
119876(V119894)119908119891 =119873
sum119896=1
119899119896119876(V119894)119896 (12)
For awind farm consisting of the same types of wind turbines(11) and (12) become (13) and (14) Consider the following
119875119890(V119894)119908119891 = 119873119875119890(V119894) (13)
119876(V119894)119908119891 = 119873119876(V119894) (14)
3 Power System and SmallSignal Stability Model
The dynamic model of power system with wind turbinescan be modeled as a set of nonlinear differential algebraicequation
= 119891 (119909 119910 119901) (15)
0 = 119892 (119909 119910 119901) (16)
where119909 is the dynamic state variable which is directly definedby (15) and 119910 is the instantaneous variable such that thesystem satisfies the constraint in (16)Theparameter119901 definesa specific system configuration and the operating conditionThe state matrix can be obtained by linearizing the systempower flow equations
Choosing the equilibrium point (119909119900 119910119900 119901119900) (15) and (16)are linearized by taking the first order Taylor expansion as (17)and (18) respectively Consider the following
Δ = 119865119909Δ119909 + 119865119910Δ119910 (17)
0 = 119866119909Δ119909 + 119866119910Δ119910 (18)
Journal of Wind Energy 5
If 119866119910 is nonsingular matrix then
Δ = (119865119909 minus 119865119910119866minus1119910 119866119909) Δ119909
119860 = 119865119909 minus 119865119910119866minus1119910 119866119909
(19)
where 119865119909 119865119910 119866119909 and 119866119910 are power flow Jacobian matricesHence the small signal stability analysis for the model can beobtained as
Δ = 119860Δ119909 (20)
The value of 120582 that satisfies (21) is the eigenvalues of matrix119860 It contains information about the response of the systemto a small perturbation
det (120582119868 minus 119860) = 0 (21)
The eigenvalue can be real andor complex The complexvalues appear in conjugate pairs if119860 is real (22)The complexeigenvalues are referred to as oscillatory modes and theyappear in conjugate
120582119894 = 120590119894 plusmn 119895120596119894 (22)
Each eigenvalue represents a system mode and the rela-tionship between this mode and the stability is given byLyapunovrsquos first method [14]
The frequency of oscillation in Hz and the damping ratioare given by
119891 = 1205961198942120587
120585 = minus120590119894radic1205902119894 + 1205962119894
(23)
The contributions of states on oscillation can be observed byevaluating the participation factors (PFs) of each state on aparticular mode Participation factor gives the relationshipamong the states and eigenmode in a dynamic system [14]The participation factor of mode 119894 can be computed using[24]
119901119894 = (
11990111198941199012119894119901119898119894
)
119901119896119894 =1003816100381610038161003816Φ11989611989410038161003816100381610038161003816100381610038161003816Ψ1198941198961003816100381610038161003816
sum119899119896=11003816100381610038161003816Φ11989611989410038161003816100381610038161003816100381610038161003816Ψ1198941198961003816100381610038161003816
(24)
where119898 is the number of state variables 119901119896119894 is the participa-tion factor of the 119896th state variable into mode 119894 Φ119896119894 is the 119894thelement of the 119896th right eigenvector of 119860 and Ψ119894119896 is the 119898thelement of the 119894th left eigenvector of 119860
4 System under Study
An IEEE 4-machine 2-area network as depicted in Figure 6is used for the study
SG1
SG2
SG3
SG4
110
2
203
4 14
13 11011
12
L1 L2
Area 1 Area 2SVC
TCSC
Wind farm
998400120
Figure 6 Modified IEEE 4-machine 2-area network consisting ofwind generators
The network is selected because it consists of two areasinterconnected by weak tie-line which makes it suitable forstudying interareamodes Moreover the network parametersare readily available and this will enhance repeatability of thework The network is slightly modified to incorporate windfarm at bus 20 The wind farm consists of 50 different windgenerators made of SCIG technology and each is of 2MWThe network also consists of four conventional synchronousgenerators at buses 1 2 11 and 12 SVC is connected to bus3 while TCSC is connected on the line connecting buses 3and 13 The data used for the load flow can be found in [25]the data not found in the reference due to modification to thenetwork are provided in Appendix B
The flow chart of Monte Carlo simulation algorithm forthe analysis of small signal stability is depicted in Figure 7 andis programmed based on power system toolbox (PST) [25] inMATLAB
The analysis begins with the generation of wind speedfor the wind turbine using Weibull distribution throughLHS method An earlier study showed that for small signalstability application 100 runs of input variables generatedusing LHS are appropriate in Monte Carlo simulation toachieve reasonable results [7]The loadflowanalysis is carriedout next using Newton-Raphson algorithm followed by thedamping ratio computation via modal analysis Finally theresults are analysed statistically
5 Scenario Creation Results and Discussion
Four scenarios (Case AndashCase D) are created in order to gainmeaningful insight into the study The description and theresults of each scenario are discussed under each case
51 Case A Original Network (No Wind Farm Connectedand No Controllers Connected) The base case is made up ofthe original network without considering the wind farm andthe controllers (PSS SVC and TSCS) This is to know theinitial state of the network in terms of small signal stabilityand hence the impact of the controllers when they are lateradded The result of the simulation shows that there are totalof 55 modes in which 24 are oscillatory which appears in
6 Journal of Wind Energy
Table 1 Oscillatory modes before wind power integration
Number Modes Damping ratio (120585) Frequency (119891)120582119894 = 120590119894 plusmn 119895120596119894
5 and 6 minus0236 plusmn 0520 0413 00837 and 8 minus0238 plusmn 0525 0414 00849 and 10 minus0249 plusmn 0645 0360 010311 and 12 minus0492 plusmn 0986 0446 015713 and 14 minus0800 plusmn 1322 0518 021021 and 22 minus0009 plusmn 3586 00024 057125 and 26 minus04780 plusmn 6885 0069 109627 and 28 minus0488 plusmn 6932 0070 110333 and 34 minus8587 plusmn 9555 0668 152135 and 36 minus8605 plusmn 9792 0660 155837 and 38 minus8718 plusmn 10064 0655 161239 and 40 minus8722 plusmn 10071 0655 1603
Generate wind speed fromWeibull distribution using
LHS technique
Generate active output power from the windturbine using the power curve model in
equation (3) and the corresponding reactivepower using equation (6)
Set
Perform load flow calculation on theIEEE 2-area 4-machine bus network
using Newton-Raphson algorithm
Calculate eigenvaluesvia
modal analysis
Statistical analysis of result
No
Yes
i = 1
ilt 100 i = i + 1
Figure 7 The flowchart of MCS based small signal stability
12 conjugate pairs The results of the oscillatory mode aredepicted in Table 1 In small signal stability studies themodesof interest are the electromechanical modes These modesmust be properly damped for a small signal secured powersystemThree conjugate pairs of electromechanicalmodes areidentified and are shown in Table 2 The table depicts thatthere is one conjugate pair of interarea modes (modes 21 and22) with damping ratio of 024 and oscillatory frequencyof 0571 Figure 8 depicts the compass plot confirming thatmodes 21 and 22 are interarea modes with generators in area1 (SG1 and SG2) oscillating against generators in area 2 (SG3
005
01
015
30
210
60
240
90
270
120
300
150
330
180 0
Interarea mode
G1
G3G4
G2
Figure 8 Compass plot of interarea mode
0 2 4 6Time (s)
8 100990
0995
1000
1005
1010
1015
Spee
d (p
u)
SG1SG2
SG3SG4
Figure 9 Speed deviation when 3-phase fault of duration 100mswas created at the middle of the line connecting buses 3 and 101
and SG4) Two conjugate pairs are identified as local modes(modes 9 and 10 and modes 27 and 28) with damping ratioof 36 and 7 respectively All the modes are positively andstrongly damped with damping ratio greater than 5 exceptthe interarea mode which has a damping ratio of 024 Theinterarea mode determines the stability of the system it cantherefore be concluded that the original network is weaklydamped The results were confirmed using time domainsimulation A 3-phase fault of duration 100ms was createdat the middle of lines connecting buses 3 and 13 the result isdepicted in Figure 9 It can be observed from the figure thatthe oscillation in the speed of the generators neither dies outnor grows signifying a weakly damped systemThis confirmsthe result of the modal analysis The figure also reveals theinterarea oscillation between the generators in area 1 and thegenerators in area 2
Journal of Wind Energy 7
Table 2 Electromechanical modes for Case A (base case ie no wind farm connected and no controllers)
Number Mode Type Damping ratio (120585) Frequency (119891) Participation (119901119894)120582119894 = 120590119894 plusmn 1198951205961198949 and 10 minus0249 plusmn 0645 Area 1 local 0360 1523 SG3 and SG421 and 22 minus0009 plusmn 3586 Interarea 00024 0571 SG1 SG2 SG3 and SG427 and 28 minus0488 plusmn 6932 Area 2 local 0070 1103 SG1 and SG2
Table 3 Electromechanical mode for Case B (wind farm connected to bus 20 and no controllers)
Number Type of mode Mean mode Damping ratio (120585) Frequency (119891)120582119894 = 120590119894 plusmn 119895120596119894 Mean SD Mean SD
9 and 10 Area 1 local minus0547 plusmn 7381119894 0065 0007 1177 0001521 and 22 Interarea 0061 plusmn 4018i minus0015 00029 0639 49 lowast 104
27 and 28 Area 2 local minus0534 plusmn 7314119894 0076 284 lowast 104 1164 00016
52 Case B (Wind Farm Is Connected at Bus 20 to the Networkin Case A) Wind farm made of 50 wind power generatorseach of 2MW was connected to bus 20 Again no controllerwas considered This will allow us to know the impact ofthe wind power on the small signal stability of the originalnetwork The wind power was generated as described in theflowchart in Figure 7 The result was statistically analysedand presented in Table 3 From the table it can be observedthat the interarea mode is negatively damped with meandamping ratio of minus0015 signifying an unstable system Thestandard deviation (SD) of the damping ratio is low (00029)This shows that in all the operating condition (varying windpower) the damping ratio is negative Figure 10(a) shows thatthe interareamodewas weakly damped (with damping rationof 00024) before wind farm was connected However theweakly damped interarea mode became unstable (shifted tothe left side of the plane) when wind farm was connected tothe network as shown in Figure 10(b) To verify this resulttime domain simulationwas carried out by creating a 3-phasefault of duration 100ms at the middle of line connecting bus3 to bus 13The results showing both the electrical power andthe speed of the four synchronous generatorswhenwind farmwas connected are presented in Figure 11The figure confirmsthat the system is unstable when wind power was injectedinto the network This is due to the interarea mode that isnegatively damped after the wind farm was connected Theinstability resulting from this mode can be vividly observedin Figure 11(b) with the generators in area 1 (SG1 and SG2)swinging against generators in area 2 (SG3 and SG4)
53 Case C (Power System Stabilizer Is Allocated to theGenerators) Themain function of power system stabilizer isto provide the synchronizing torque [14] and hence improvethe damping of a power systemHowever it has to be properlyallocated to themost suitable synchronous generator in orderto provide themost effective resultThe aimhere is to improvethe damping of the interarea mode in Case B by allocatingPSS The allocation of PSS has been traditionally done usingdeterministic method in which a single operating conditionis considered In this paper probabilistic approach is usedin determining the most suitable synchronous generatorto allocate the PSS in order to damp the interarea mode
Table 4 Damping of interarea mode (modes 21 and 22)
Methods Allocation Damping ratio (120585)Deterministic SG3 00076Probabilistic SG1 00726
The result is then compared with the deterministic methodFigure 12(a) shows the speed participation factor (PF) whendeterministic method is used (ie single operating conditionof wind speed is considered) while Figure 12(b) depicts themean speed PF using probabilistic approach (ie all the oper-ating conditions of wind speed are taken into considerationand the statistical average is determined) The result of thedeterministic method as depicted in Figure 12(a) reveals thatSG3 will be the generator that will provide the most effectivedamping when PSS is allocated while Figure 12(b) shows thatSG1 should be installed with PSS for effective damping of theinterarea mode
PSS were allocated using the two methods and the resultsare presented in Table 4 The table shows that when PSSis allocated deterministically the interarea mode in Case Bimproved from being negatively damped (minus0015) to beingweakly damped (00076) However when allocated proba-bilistically the negatively damped interarea mode becamestrongly damped (00726) The result is again verified usingtime domain simulation and is presented in Figure 13 Thefigure confirms that probabilistic method presents a betterallocation of PSS for small signal stability application
54 Case D (SVC and TCSC Are Installed in Turns) SVConly was first installed on bus 3 in the network of CaseB This is to give insight into the influence of SVC on thesmall signal stability of a power system The objective isto see its influence on the small signal stability and thencompare its performance with that of TCSCThereafter SVCwas taken out and then TCSC only was installed on the lineconnecting bus 3 to bus 13 Both SVC and PSS were laterinstalled to give insight into the combinational effect of theduo Finally SVC and PSS were taken out and both TCSCand PSS were installed The results are presented in Table 5The table shows that SVC has a better performance in the
8 Journal of Wind Energy
0 02 04 06 08 1 120
05
1
15
2
Damping ratio
Freq
uenc
y (H
z)
StableWeak
Local modes
minus02
Interarea
(a)
00
05
10
15
20
25
30
Mean damping ratio
Mea
n fre
quen
cy (H
z)
Local modes
Interarea
0 02 04 06 08 1 12
StableUnstable
minus02
(b)
Figure 10 The plot of frequency versus damping ratio of the network (a) without wind farm connected and (b) with wind farm connected
0 2 4 6 8 10
0
5
10
15
Elec
tric
al p
ower
(pu)
Time (s)
SG1SG2
SG3SG4
minus5
(a)
094
096
098
100
102
104
Roto
r spe
ed (p
u)
0 2 4 6 8 10Time (s)
SG1SG2
SG3SG4
(b)
Figure 11 Time domain simulation showing (a) the electrical power and (b) the speed deviation when wind power was connected to thenetwork
damping of the interarea mode with mean damping ratio of167 compared to that of TCSCwith damping ratio of 061The combination of SVC and PSS provides effective dampingcompared to TCSC and PSSThe controllers are compared inFigure 14 for the damping of the interarea mode
It can be viewed from the figure that the combination ofSVC and PSS gives the best damping to the interarea modewith damping ratio of 1554 The order of performance ofthe controllers as used in this paper is as shown in Table 6From the table it can be seen that combination of SVC andPSS puts up the overall best performance followed by thecombination of TCSC and PSS It is generally observed thatbetter results are obtained when the controllers are combined
Table 5 Influence of controllers in the damping of the interareamode (modes 21 and 22)
Damping ratio (120585) Frequency (119891)Mean Std Mean Std
SVC only 00167 00011 06082 00038TCSC only 00061 000069 06343 00010SVC + PSS 01554 00021 06288 000098TCSC + PSS 01032 00030 06270 00015
with PSS compared to when they are operated in a stand-alone mode
Journal of Wind Energy 9
SG1 SG2 SG3 SG40
02
04
06
08
10
Generators
Spee
d PF
(a)
SG1 SG2 SG3 SG40
02
04
06
08
10
Generators
Mea
n sp
eed
PF
(b)
Figure 12 The bar plot of (a) speed participation factor using deterministic method and (b) mean speed participation factor usingprobabilistic method
05
10
SG1SG2
SG3SG4
0
5
Time (s)
Machine speed deviations
Generators
Spee
d (p
u)
minus5
times10minus3
(a)
0
2
4
05
10
SG1SG2
SG3SG4
Time (s)
Machine speed deviations
Generators
Spee
d (p
u)
minus2
times10minus3
(b)
Figure 13 3D plot of speed when PSS is allocated using (a) deterministic method and (b) probabilistic method
Table 6 Order of performance of the controller(s) at dampingelectromechanical modes
SN Controllers and possible combination Order ofperformance
1 SVC + PSS 1st2 TCSC + PSS 2nd3 Probabilistic allocation of PSS only 3rd4 SCV only 4th5 Deterministic allocation of PSS only 5th6 TCSC only 6th
The result of the modal analysis was confirmed with timedomain simulation and the result is presented in Figure 15
6 Conclusion
Comparative assessment of SVC and TCSC controllers andtheir combination with PSS at improving the electrome-chanical modes excited by the intermittent wind powergenerated from wind farm made of fixed speed squirrel cageinduction generators has been studied using probabilisticmodal analysis Correctness of every result obtained by the
0 005 01 015 0203
04
05
06
07
08
09
Damping ratio
Freq
uenc
y (H
z)
Strongly dampedUnstableWeakly damped
SVConly
TCSConly
CaseB
Det PSSonly
Prob PSSonly
SVC + PSSTCSC + PSS
Figure 14 Comparison of performance of the controllers in thedamping of the interarea mode
modal analysis was verified using time domain simulation Itwas revealed that combination of SVC and PSS performs bestat damping the electromechanical modes followed by TCSCand PSS It can be deduced that better performance of thecontrollers is obtainedwhen combinedwith PSS compared to
10 Journal of Wind Energy
Table 7 Turbine parameters
Cut-in wind speed (Vci) 35ms Rated turbine power (Pr) 2MWRated wind speed (V119903) 10ms Weibull shape parameter (119896) 18Cut-out wind speed (Vco) 25ms Weibull scale parameter (119888) 10ms
Table 8 Induction generator parameters
Stator resistance (1199031) Neglected Magnetizing reactance 3 puRotor resistance (1199032) 0009 pu Inertial constant 4 sStator reactance (1199091) 001 pu Mechanical transmission efficiency (120578119898) 95Rotor reactance 0009 pu Generator efficiency (120578119892) 95
Table 9 Power system stabilizer parameters
Parameters Values Parameters ValuesLead time constant (1198791) 005 Washout time constant (119879119882) 10Lag time constant (1198792) 0015 Maximum output limit (Δ119881119904(max)) 02Lead time constant (1198793) 008 Minimum output limit (Δ119881119904(min)) minus005Lag time constant (1198794) 001 PSS gain (119870PSS) 100 pu
when operating as a stand-alone controller It has also beenshown that allocation of PSS using probabilistic techniquesenhances damping of electromechanical mode compared tothe deterministic allocation This is because in probabilisticallocation various combinations of wind power scenariosare taken into consideration unlike deterministic methodthat takes into consideration only single scenario The futurestudy will focus on the use of variable speed generator usingDFIG and optimal location of SVC for effective dampingof interarea mode excited by intermittent wind power Inthis study conclusions are made based on 4-machine 2-areanetwork further work will consider large network that willgive room for more scenario consideration
Appendices
A Latin Hypercube Sampling Techniques
The basic sampling procedures as applied to probabilisticsmall signal stability in this paper are as follows
(i) Let 1198661 119866119873 be the 119873 input random variables in aprobability problem The cumulative distribution of119866119899 which belongs to 1198661 119866119873 can be written as
119884119899 = 119865119899 (119866119899) (A1)
For a sample size 119896 the range of 119884119899 from [0 1] isdivided into 119896 nonoverlapping intervals of equivalentlength hence the length of each interval is given as1119896
(ii) One sample value is chosen from each intervalrandomly without replacement Then the samplingvalues of119866119899 can be calculated by the inverse functionThe 119899th sample of 119866119899 can be determined by
119866119899119896 = 119865minus1119899 (
119899 minus 05119896
) (A2)
0 2 4 6 8 100996
0998
1000
1002
1004
1006
1008
1010
Time (s)
Spee
d (p
u)
SVC only
PSS (PROB)
No controllerTCSC onlySVC + PSSTCSC + PSS
Figure 15 Time domain simulation comparison of the controllersfor damping interarea modes
(iii) The sample value of119866119899 can now be assembled in a rowof the sampling matrix as given in
[1198661198991 1198661198992 119866119899119896 119866119899119873] (A3)
Once all the 119896 input random variables are sampledan 119873 times 119870 primary sampling 119866 can be obtainedLHS can always start with the generation of uniformdistributed samples in interval [0 1] then invertingthe cumulative distribution function (CDF) to obtainthe target distribution
B Parameters Used in the Study
See Tables 7 8 9 10 and 11
Journal of Wind Energy 11
Table 10 SVC parameters
Parameters Values Parameters ValuesMaximum susceptance (119861svcmax) 1 pu Regulator gain (119870119877) 10Minimum susceptance (119861svcmin) minus1 pu Regulator time constant (119879119877) 005 s
Table 11 TCSC controller parameters
119879 (s) 119870119882 (pu) 119879119882 (s) 1198791 (s) 1198792 (s) 1198793 (s) 1198794 (s) 119883min (pu) 119883max (pu)0015 11 5 11 005 008 05 000527 00514
Conflict of Interests
The author declares that there is no conflict of interestsregarding the publication of this paper
References
[1] M J Hossain H R Pota M A Mahmud and R A RamosldquoImpacts of large-scale wind generators penetration on thevoltage stability of power systemsrdquo in Proceedings of the IEEEPower and Energy Society General Meeting pp 1ndash8 San DiegoCalif USA July 2011
[2] T R Ayodele A A Jimoh J L Munda and J T AgeeldquoChallenges of grid integration of wind power on power systemgrid integrity a reviewrdquo International Journal of RenewableEnergy Research vol 2 no 4 pp 618ndash626 2012
[3] M R Rathi and N Mohan ldquoA novel robust low voltage andfault ride through for wind turbine application operating inweak gridsrdquo in Proceedings of the 31st Annual Conference ofIEEE Industrial Electronics Society (IECON rsquo05) pp 2481ndash2486November 2005
[4] A Mendonca and J A Pecas Lopes ldquoImpact of large scale windpower integration on small signal stabilityrdquo in Proceedings of theInternational Conference on Future Power Systems AmsterdamThe Netherlands November 2005
[5] L B Shi C Wang L Z Yao L M Wang and Y X NildquoAnalysis of impact of grid-connected wind power on smallsignal stabilityrdquoWind Energy vol 14 no 4 pp 517ndash537 2011
[6] X Li Z Zeng J Zhou andY Zhang ldquoSmall signal stability anal-ysis of large scale variable analysis of large scale variable speedwind turbines integrationrdquo in Proceedings of the InternationalConference on Electrical Machines and Systems (ICEMS rsquo08) pp2526ndash2530 Wuhan China 2008
[7] T R Ayodele A A Jimoh J L Munda and J T Agee ldquoPer-formance evaluation of sampling techniques in Monte Carlosimulationndashbased probabilistic small signal stability analysisrdquoin Proceedings of the 23rd IASTED International Conference onModelling and Simulation (MS rsquo12) Banff Canada 2012
[8] W Qiao R G Harley and G K Venayagamoorthy ldquoEffects ofFACTS devices on a power system which includes a large windfarmrdquo in Proceedings of the IEEE PES Power Systems Conferenceand Exposition (PSCE rsquo06) pp 2070ndash2076 IEEE Atlanta GaUSA November 2006
[9] S Ibrahim ldquoEigenvalue based stability improvement of electricpower systems through voltage regulationrdquo International Jour-nal of Renewable Energy Research vol 3 no 2 pp 383ndash387 2013
[10] p Jungsoo J Gilsoo andM S Kwang ldquoModeling and control ofVSI type FACTS controllers for power system dynamic stabilityusing the current injection methodrdquo International Journal of
Control Automation and Systems vol 6 no 4 pp 495ndash5052008
[11] S S Balwinder ldquoLinearizedmodeling of singlemachine infinitebus power systemand controllers for small signal stability inves-tigation and enhancementrdquo International Journal of AdvancedResearch in Computer Engineering amp Technology vol 1 no 8pp 21ndash28 2012
[12] F J Swift and H FWang ldquoApplication of the controllable seriescompensator in damping power system oscillationsrdquo IEEEProceedingmdashGeneration Tranmision Distribution vol 143 no4 pp 359ndash364 1996
[13] H F Wang and F J Swift ldquoA unified model for the analysisof facts devices in damping power system oscillations part Isingle-machine infinite-bus power systemsrdquo IEEE Transactionson Power Delivery vol 12 no 2 pp 941ndash946 1997
[14] P Kundur Power System Stability and Control vol 1 ofTheEPRIPower System Engineering McGraw-Hill New York NY USA1994
[15] J Arrillaga and C P Arnoid Eds Computer Analysis of PowerSystems John Wiley and Sons Chichester UK 1990
[16] P M Anderson and A A Fouad Eds Power System Controland Stability IOWA State University Press Ames Iowa USA1977
[17] N Mithulananthan M M A Salama C A Canizares and JReeve ldquoDistribution system voltage regulation and var com-pensation for different static loadmodelsrdquo International Journalof Electrical Engineering Education vol 37 no 4 pp 384ndash3952000
[18] S K M Kodsi and C A Canizares ldquoModelling and simulationof IEEE 14 bus system with fact controllersrdquo Technical Report2003-3 2003
[19] R Grunbaum A Sannino and C Wahlberg Use of FACTS forEenhanced Flexibility and Efficiency in Power Transmission andDistribution Grids 2012
[20] T R Ayodele A A Jimoh J L Munda and J T Agee ldquoTheinfluence of wind power on the small signal stability of apower sysyemrdquo in Proceedings of the International Conference onRenewable Energy and Power Quality (ICREPQ rsquo11) Las Palmasde Gran Canaria Spain 2011
[21] T R Ayodele A A Jimoh J L Munda and J T AgeeldquoA statistical analysis of wind distribution and wind powerpotential in the coastal region of South Africardquo InternationalJournal of Green Energy vol 10 no 8 pp 814ndash834 2013
[22] T R Ayodele A A Jimoh J L Munda and J T Agee ldquoImpactsof tie-lines and wind generator location on small signal stabilityof a power systemrdquo International Journal of Renewable EnergyResearch vol 3 no 1 pp 51ndash59 2013
[23] M Veigas and G Iglesias ldquoEvaluation of the wind resourceand power performance of a turbine in Teneriferdquo Journal of
12 Journal of Wind Energy
Renewable and Sustainable Energy vol 4 no 5 Article ID053106 2012
[24] F Mei and B C Pal ldquoModelling and small-signal analysis of agrid connected doubly-fed induction generatorrdquo in Proceedingsof the IEEE Power Engineering Society GeneralMeeting pp 2101ndash2108 San Francisco Calif USA June 2005
[25] J Chow Power System Toolbox 20mdashDynamic Tutoria andFunctions Cherry Tree Scientific Software 2000
TribologyAdvances in
Hindawi Publishing Corporationhttpwwwhindawicom Volume 2014
International Journal of
AerospaceEngineeringHindawi Publishing Corporationhttpwwwhindawicom Volume 2014
FuelsJournal of
Hindawi Publishing Corporationhttpwwwhindawicom Volume 2014
Journal ofPetroleum Engineering
Hindawi Publishing Corporationhttpwwwhindawicom Volume 2014
Industrial EngineeringJournal of
Hindawi Publishing Corporationhttpwwwhindawicom Volume 2014
Power ElectronicsHindawi Publishing Corporationhttpwwwhindawicom Volume 2014
Advances in
CombustionJournal of
Hindawi Publishing Corporationhttpwwwhindawicom Volume 2014
Journal of
Hindawi Publishing Corporationhttpwwwhindawicom Volume 2014
Renewable Energy
Submit your manuscripts athttpwwwhindawicom
Hindawi Publishing Corporationhttpwwwhindawicom Volume 2014
StructuresJournal of
International Journal of
RotatingMachinery
Hindawi Publishing Corporationhttpwwwhindawicom Volume 2014
EnergyJournal of
Hindawi Publishing Corporationhttpwwwhindawicom Volume 2014
Hindawi Publishing Corporation httpwwwhindawicom
Journal ofEngineeringVolume 2014
Hindawi Publishing Corporation httpwwwhindawicom Volume 2014
International Journal ofPhotoenergy
Hindawi Publishing Corporationhttpwwwhindawicom Volume 2014
Nuclear InstallationsScience and Technology of
Hindawi Publishing Corporationhttpwwwhindawicom Volume 2014
Solar EnergyJournal of
Hindawi Publishing Corporationhttpwwwhindawicom Volume 2014
Wind EnergyJournal of
Hindawi Publishing Corporationhttpwwwhindawicom Volume 2014
Nuclear EnergyInternational Journal of
Hindawi Publishing Corporationhttpwwwhindawicom Volume 2014
High Energy PhysicsAdvances in
The Scientific World JournalHindawi Publishing Corporation httpwwwhindawicom Volume 2014
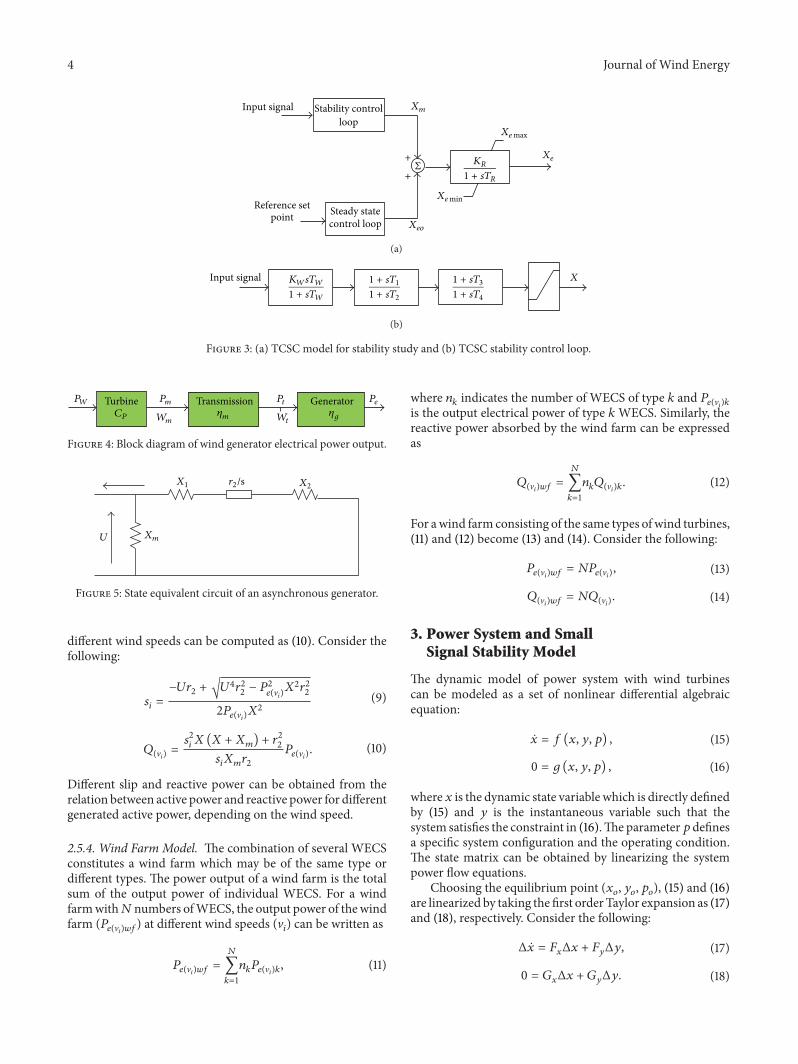
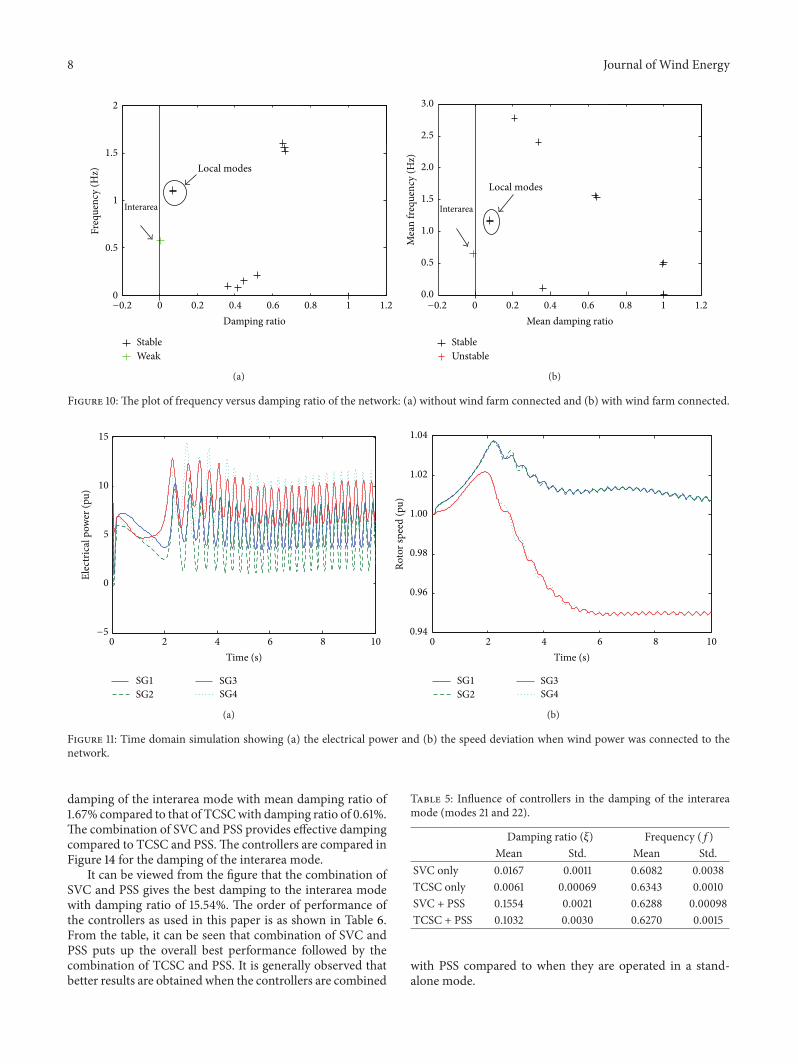