Embed Size (px)
Citation preview

Wilson Consulting Services, LLC
It must be demonstrated . . .
Comparative Analysis ofPerformance and Enrollment
Patterns Among South Carolina Public School Districts
February 1, 2019 by
David C. Wilson, MSEEFounder/CEO
Wilson Consulting Services, LLC

We are proponents and advocates of literacy in STEM and statistics in a technological and data-driven world.
STEM = ∑(Science, Technology, Engineering, Mathematics)
Comparative Analysis of Performance and Enrollment
Patterns Among South Carolina Public School Districts
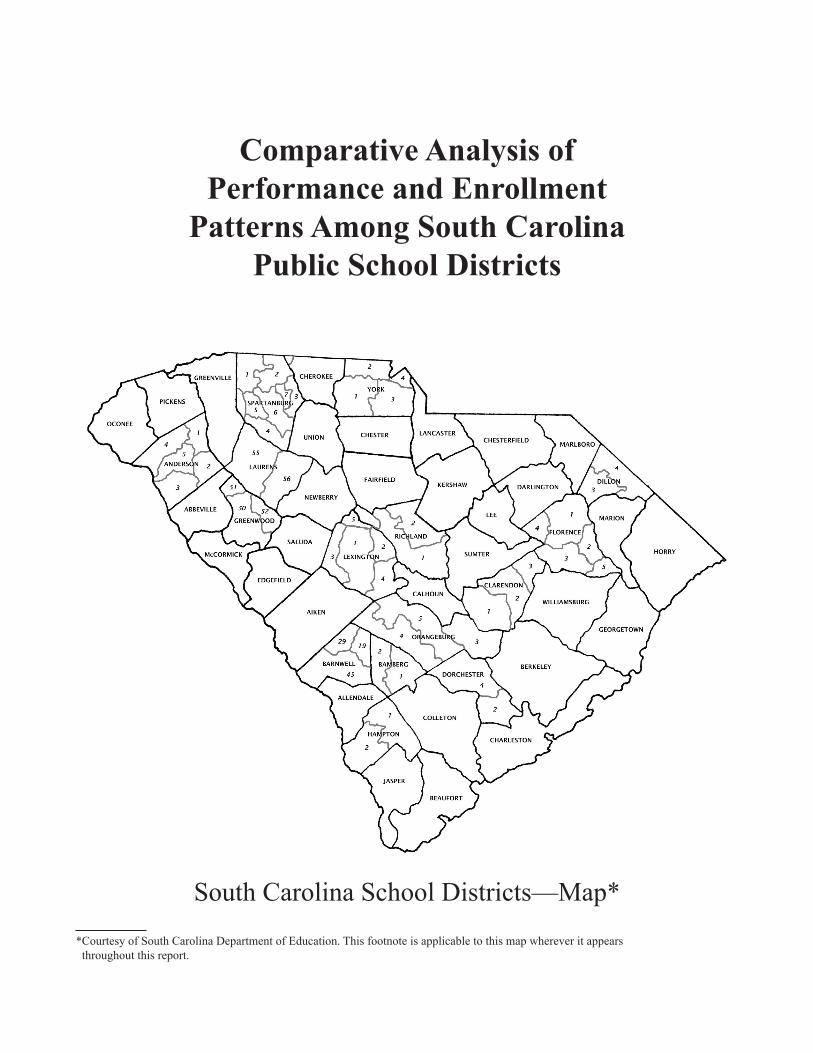
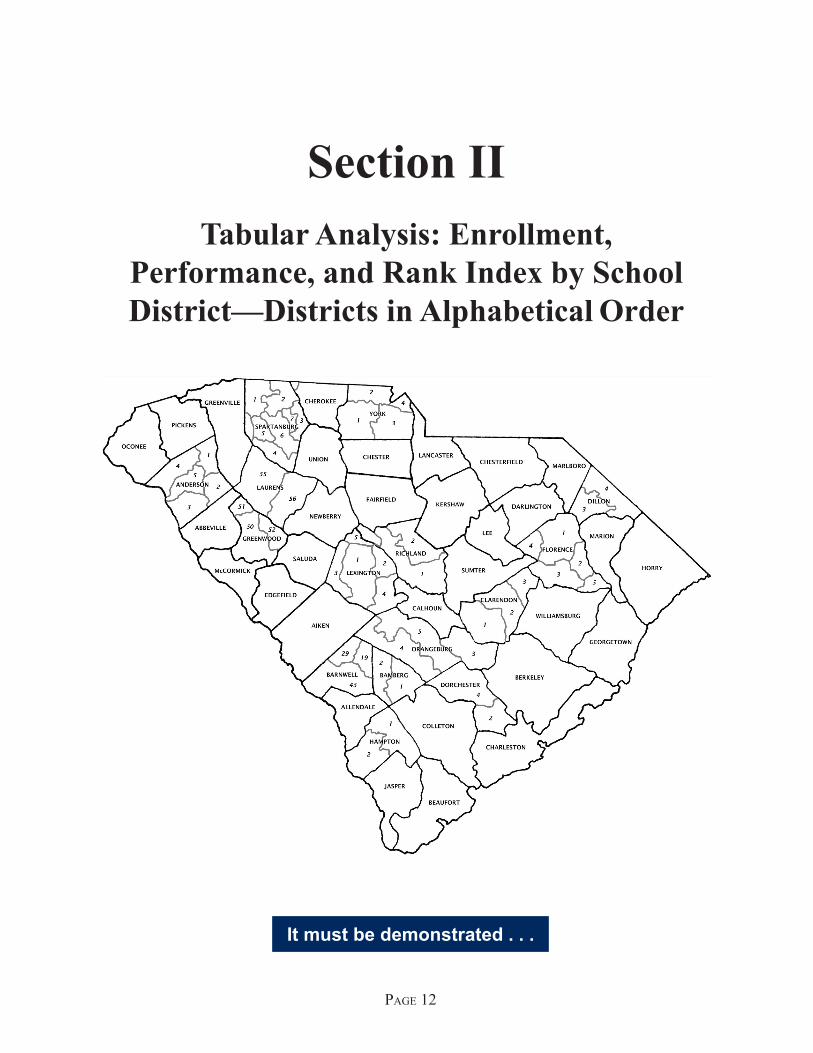
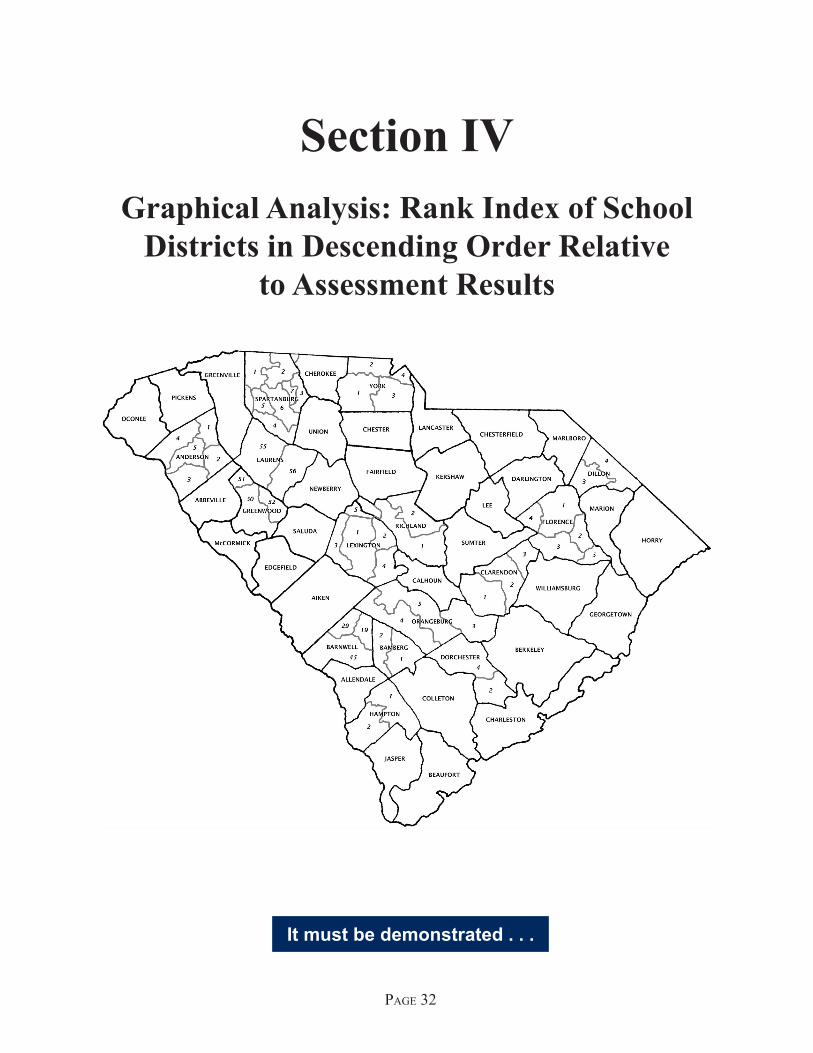
South Carolina School Districts—Map*
*Courtesy of South Carolina Department of Education. This footnote is applicable to this map wherever it appears throughout this report.
Copyright © 2019 by Wilson Consulting Services, LLC. No part of this report may be reproduced or modified in any form or by any means electronic, or mechanical, including photocopying, or recording, without permission from the author or publisher.
Manufactured in the United States of America.
Wilson Consulting Services, LLCConway, SC 29527
Table of Contents
The Author .................................................................................................................................... vi
Executive Summary ...................................................................................................................... vii
I. Introduction ........................................................................................................................ 9
II. Tabular Analysis: Enrollment, Performance, and Rank Index by School District ............... 12
III. Graphical Analysis: Performance of School Districts in Descending Order Relative to Assessment Results ............................................................................................................. 23
IV. Graphical Analysis: Rank Index of School Districts in Descending Order Relative to Assessment Results ........................................................................................................... 32
V. Graphical Analysis: Rank Index of School Districts in Descending Order Relative to Enrollment .......................................................................................................................... 41
VI. Performance and Enrollment Statistics Relative to Race/Ethnicity on Academic Outcomes ............................................................................................................................ 44
VII. Summary .............................................................................................................................. 51
Reference ...................................................................................................................................... 53
About us ...........................................................................................................................,,,,,,,,,,,.. 54
More Publications ......................................................................................................................... 54
Images of Other Publications ........................................................................................................ 55
NOTE: To jump to a specific page, click on the section text in the table of contents. Once on a page, clicking on the text above the black line at the top of the page will bring you back to the table of contents. Also, clicking on the South Carolina map at the beginning of a section page will bring you back to the table of contents. There are active links throughout the paper referring to a particular table or figure (highlighted in blue) which will bring you to the page containing the referenced table or figure.
Location of report: https://www.wilsonconsultingservices.net/wcs_schdist_sc_19.pdf
Contact information: [email protected]
v
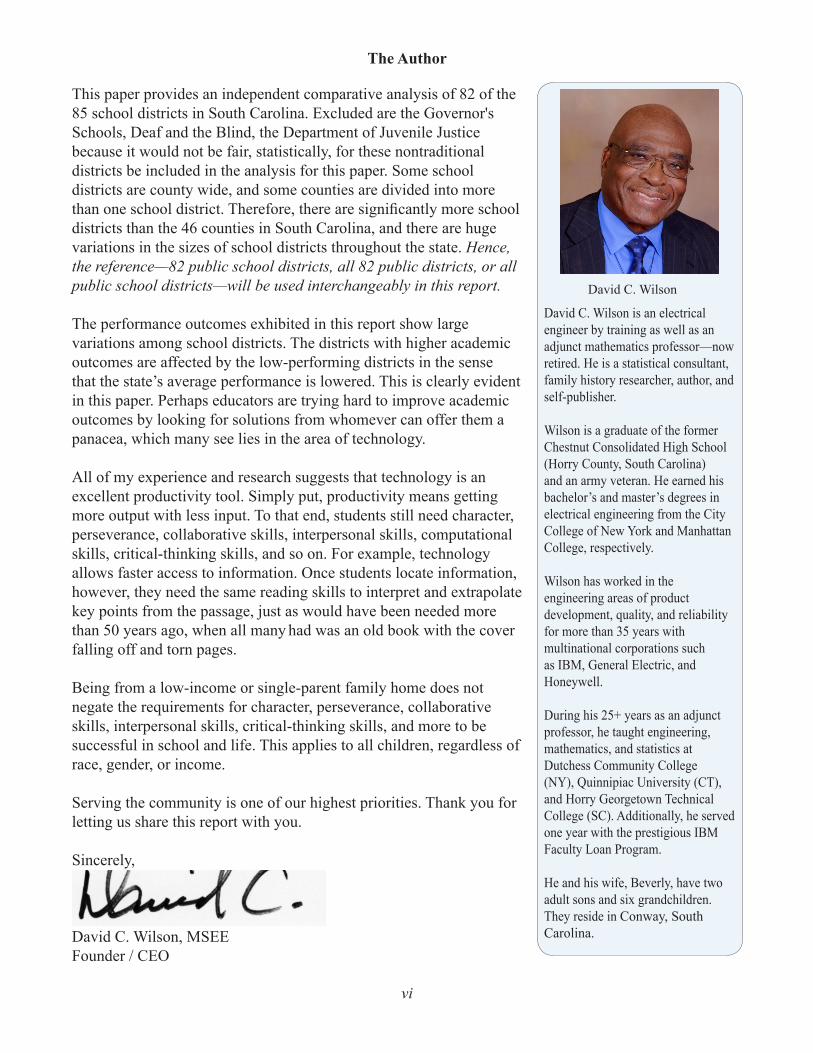
David C. Wilson is an electrical engineer by training as well as an adjunct mathematics professor—now retired. He is a statistical consultant, family history researcher, author, and self-publisher.
Wilson is a graduate of the former Chestnut Consolidated High School (Horry County, South Carolina) and an army veteran. He earned his bachelor’s and master’s degrees in electrical engineering from the City College of New York and Manhattan College, respectively.
Wilson has worked in the engineering areas of product development, quality, and reliability for more than 35 years with multinational corporations such as IBM, General Electric, and Honeywell.
During his 25+ years as an adjunct professor, he taught engineering, mathematics, and statistics at Dutchess Community College (NY), Quinnipiac University (CT), and Horry Georgetown Technical College (SC). Additionally, he served one year with the prestigious IBM Faculty Loan Program.
He and his wife, Beverly, have two adult sons and six grandchildren. They reside in Conway, South Carolina.
David C. Wilson
This paper provides an independent comparative analysis of 82 of the 85 school districts in South Carolina. Excluded are the Governor's Schools, Deaf and the Blind, the Department of Juvenile Justice because it would not be fair, statistically, for these nontraditional districts be included in the analysis for this paper. Some school districts are county wide, and some counties are divided into more than one school district. Therefore, there are significantly more school districts than the 46 counties in South Carolina, and there are huge variations in the sizes of school districts throughout the state. Hence, the reference—82 public school districts, all 82 public districts, or all public school districts—will be used interchangeably in this report.
The performance outcomes exhibited in this report show large variations among school districts. The districts with higher academic outcomes are affected by the low-performing districts in the sense that the state’s average performance is lowered. This is clearly evident in this paper. Perhaps educators are trying hard to improve academic outcomes by looking for solutions from whomever can offer them a panacea, which many see lies in the area of technology.
All of my experience and research suggests that technology is an excellent productivity tool. Simply put, productivity means getting more output with less input. To that end, students still need character, perseverance, collaborative skills, interpersonal skills, computational skills, critical-thinking skills, and so on. For example, technology allows faster access to information. Once students locate information, however, they need the same reading skills to interpret and extrapolate key points from the passage, just as would have been needed more than 50 years ago, when all many had was an old book with the cover falling off and torn pages.
Being from a low-income or single-parent family home does not negate the requirements for character, perseverance, collaborative skills, interpersonal skills, critical-thinking skills, and more to be successful in school and life. This applies to all children, regardless of race, gender, or income.
Serving the community is one of our highest priorities. Thank you for letting us share this report with you.
Sincerely,
David C. Wilson, MSEEFounder / CEO
vi
The Author
Executive Summary
This report provides an independent comparative analysis of the 2018 student test scores relative to the accountability measurements for the state of South Carolina for all 82 public school districts. This report also profiles the state’s public schools’ enrollment distribution by district, relative to size, academic ranking, and race/ethnicity.
The assessment tests included in this report are the South Carolina College- and Career-Ready Assessments (SCREADY), the End-of-Course Examination Program (EOCEP), the ACT test, and the SAT. This report is limited to these selected tests: (1) SCREADY—for English language arts and mathematics—and
(2) EOCEP—for Algebra 1 and English 1. Also included are the traditional ACT and SAT composite scores.
The two most notable statistics in this report involve school districts whose enrollment consists of more than 25 percent African American students and small school districts that are underperforming compared to other school districts. Furthermore, there is no credible research indicating that African American children are deficient in the ability to perform as well academically as other racial or ethnic groups.
Key Assessment StatisticsActive Enrollment
• The combined student population of school districts with 10,000 or more students is 559,539 (73 percent). For districts with fewer than 10,000 students, the combined total enrollment is 211,962 students (27 percent).
• Of the 82 school districts (24) with 10,000 or more students, the percentages of distribution of race/ethnicity are (1) African American—30 percent, (2) White—53 percent, (3) Hispanic or Latino—10 percent, and (4) Others—7 percent. For the school districts (58) with fewer than 10,000 students, the percentages are (1) African American—47 percent, (2) White—42 percent, (3) Hispanic or Latino—6 percent, and (4) Others—5 percent.
• There is a correlation between performance of school districts with 10,000 or more students and those with fewer than 10,000 students in favor of larger districts.
SCREADY• Of the 82 public school districts in South Carolina, 12 scored 50 percent* or greater in meeting or
exceeding expectations in English language arts (ELA) and mathematics. This equates to about 111,804 of the 352,407 test takers statewide or 32 percent of test takers performing 50 percent or higher. See Figure 3.1.1.
• Of the 82 public school districts in South Carolina, about 19 scored below 25 percent in meeting or exceeding expectations in ELA and mathematics. This equates to about 24,468 of the 352,407 test takers statewide or 7 percent of test takers performing at 25 percent or lower. Of the 24,468 students in the 19 school districts, African Americans comprised 73 percent of student enrollment. See Figure 3.1.1.
• Of the 82 public school districts, students attending large school districts outperformed those attending small school districts by 30 percent in ELA and mathematics. The difference increased to 60 percent between those in a school district of 10,000 or more and those in a district with fewer than 1,000 students. See Figure 6.2.1.
vii
*The 50 percent is an arbitrary number to show the number or percentage of students who performed at least half of the maximum
of 100 percent. In order to be at 100 percent, all test takers would have met or exceeded expectations.

EOCEP• Of the 82 public school districts in South Carolina, 10 districts scored 70 percent or greater (a grade
of C or higher) in English 1. This equates to about 8,436 test takers from these school districts of the total 58,645 test takers statewide or 15 percent earning a C or higher. See Figure 3.6.1.
• Of the 82 public school districts, students attending large school districts outperformed those attending small school districts by 32 percent in Algebra 1 and English 1 (combined). The difference increased to 51 percent between those in a school district of 10,000 or more and those in a district with fewer than 1,000 students. See Figure 6.2.2.
• Of the 82 public school districts with less than 25 percent African American students, these districts outperformed districts with 25 percent or more African American students by 28 percent in Algebra 1 and English 1 (combined). See Figure 6.3.1.
ACT• South Carolina deemed that an ACT composite score of 20 or higher indicates college and career
readiness, which is at the 51st percentile nationally. This means that in a school district with an ACT composite score of 20, only about 50 percent of its seniors are deemed college or career ready. See Figure 3.7.1.
• About five school districts (7,402 test takers) achieved an ACT composite score of 20 or higher out of 50,936 statewide test takers. This equates to about 15 percent of South Carolina ACT test takers, on average, achieving an ACT composite score of 20 or greater—college or career readiness—rounded up when applicable. See Figure 3.7.1.
• Of the 82 school districts, those with less than 25 percent African American students outperformed districts with 25 percent or more African American students on the ACT composite tests by 12 percent. The result shown in the ACT is significant because the difference is two full points (18 to 16), which is a drop in percentile ranking from the 39th to the 26th percentile (near the bottom quartile). See Figure 6.3.1.
SAT• On the SAT, an ACT composite score of 20 equates to about 1050—the 50th percentile. This means
that a school district with an SAT composite score of 1050, only about 50 percent of its seniors are deemed college or career ready. See Figure 3.8.1.
• About 29 school districts (13,885 test takers) obtained an SAT composite score of 1050 out of 21,921 statewide test takers. This equates to about 63 percent of South Carolina’s SAT test takers, on average, achieving an SAT composite score of 1050 or greater, which is equivalent to an ACT composite score of 20—South Carolina’s college- or career-readiness benchmark. The enrollment population for the 29 school districts was 454,000 students. See Figure 3.8.1.
• Of the SAT graduating seniors, test takers from large districts (scored 1066) performed at the 58th percentile equivalent compared to students from districts with fewer than 10,000 students (scored 1005) who performed at the equivalent of the 32nd percentile. Students from districts with fewer than 1,000 students (scored 908) performed at the 16th percentile. See Figure 6.3.3.
Key Assessment Statistics, cont.
viii
Executive Summary, cont.

Page 9
It must be demonstrated . . .
Section IIntroduction
© 2019 WCS, LLC.
Page 10 | ComParative analysis of PerformanCe and enrollment Patterns
The purpose of this report is to share with the general public an independent comparative
analysis of South Carolina’s assessment testing and student enrollment. All performance levels throughout this paper are based on school year 2017–18. There are significant variation among school districts test scores within the state by comparing the scores and enrollment of students attending public schools in all school districts in the state. This includes schools in all 85 districts, with the exception of special schools such as the Governor’s Schools, SC School for the Deaf and the Blind, and Department of Juvenile Justice; therefore, a total of 82 school districts are examined in this paper. When the state is listed among the rankings, the rankings will extend from 1 to 83. The ACT and SAT includes national scores; therefore, when the national measurements are included, the range is from 1 to 84 in this paper. The assessments include elementary, middle, and high schools, where applicable. Overall, 771,501 students were included in this analysis.
The analyses in this report are illustrated with tables and graphs, as well as in narrative form. The primary data source is the South Carolina Department of Education. The four tests used in this report are the South Carolina College- and Career-Ready Assessments (SCREADY, End-of-Course Examination Program (EOCEP),* the ACT, and the SAT.**
The subjects included came from two assessments: (1) SCREADY—English language arts and mathematics and (2) EOCEP—tests in high school gateway courses, including courses taken in middle school for high school credit. The EOCEP tests are in the following subject areas: Algebra 1, Biology 1, English 1, and US History and the Constitution. Algebra 1 and English 1 are included in the analysis from
the EOCEP assessment, but Biology 1 and US History and the Constitution are excluded from this report. The composite scores for the ACT and the SAT analysis are also given. The focused-on performance measurements in this paper is primarily on the subjects in English and mathematics because of their core value to success in school and life. Therefore, they were selected from the major assessment subjects as vital benchmarks to measure and compare.
This report takes a binary approach to the benchmark measurements; the student either met or did not meet the benchmark standard for readiness. The analyses do not break down the various other levels, such as approaching expectations and economic factors; thus, the analyses reflect the percentage of students scoring the minimum and above or did not score the minimum. The calculations of performance for the SCREADY and EOCEP are based on the number of test takers in a given district for that specific subject. The EOCEP assessment in this report shows the percentage of students earning a grade of C or higher (70–100). The ACT composite score is a scaled score based on the four parts of the test, with a range of 1–36. Additionally, the SAT composite score is a scaled score with a range of 400–1600. For this report, two courses were selected from the SCREADY test results—English language arts and mathematics—and from the EOCEP test results—Algebra 1 and English 1.
In addition to performance analysis, the author ranked each district—rank index—based on performance and student enrollment. The ranking index integer was assigned to a district based on the total number of districts starting with one (1) as being the best. Also, examined was the impact of district enrollment size and the variability
Introduction
*The EOCEP test scores in this paper are across one school year (2017–18). The EOCEP results in South Carolina Department of Education report card might be slightly different from those in this report because the state's report card is based on multiple years and a particular cohort of students. However, the performance pattern, statistically, remains the same.
**There were 50,936 and 22,141 South Carolina graduating seniors who took the ACT and SAT, respectively. It appears that only a fraction of the graduating seniors took the SAT test compared to the ACT test.
© 2019 WCS, LLC
south Carolina PubliC sChool distriCts | Page 11
of race/ethnicity among districts on academic outcomes.
The data are shown in tabular formats (Tables 2.1.1 and 2.2.1) and graphic formats. The total head count for each school district is included to give the reader a sense of the size of that school district. The rankings are in descending order, with the number one (1) being the highest relative to the other 82 districts plus the state for a total of 83. The ACT and SAT include the districts’ count plus the state and national for a total of 84 entities. The school districts—first column of Table 2.1.1—shown in alphabetical order indicating their performance in percentages in specific test areas. Table 2.2.1 depicts the rank index of each of South Carolina’s school districts, as shown in this report. The format of both tables is the same. For example, Table 2.1.1 shows Aiken County School District with 37 percent of students who met or exceeded expectations in SCREADY mathematics, and Table 2.2.1 shows the district’s rank index of 38 for the same subject. This means that Aiken County School District ranks 38 out of 83 (including state) in
SCREADY mathematics.
The graphs (Figures 3.1.1–3.8.1) depict a visual view of the performance percentage in descending order by school district for individual subject areas. The graphs (Figures 4.1.1–4.8.1) depict a visual view in descending order by school district for subject area. The graphs (Figures 5.1.1 and 5.2.1) show the visual distribution of school districts by enrollment size and performance in ascending order. The graphs (Figures 6.1.1, 6.2.1, 6.2.2, 6.2.3, 6.3.1, 6.3.2, 6.3.3, and 6.4.1) show visual distributions of student enrollment and race/ethnic groups by districts.
The efforts to disseminate these statistics on student performance and variation among school districts in South Carolina are not intended to lay blame on South Carolina or any of its school districts. Instead, it is to inform students, parents, community leaders, political leaders, and anyone interested in understanding the variations in student performance across South Carolina, and among school districts.
Introduction, cont.
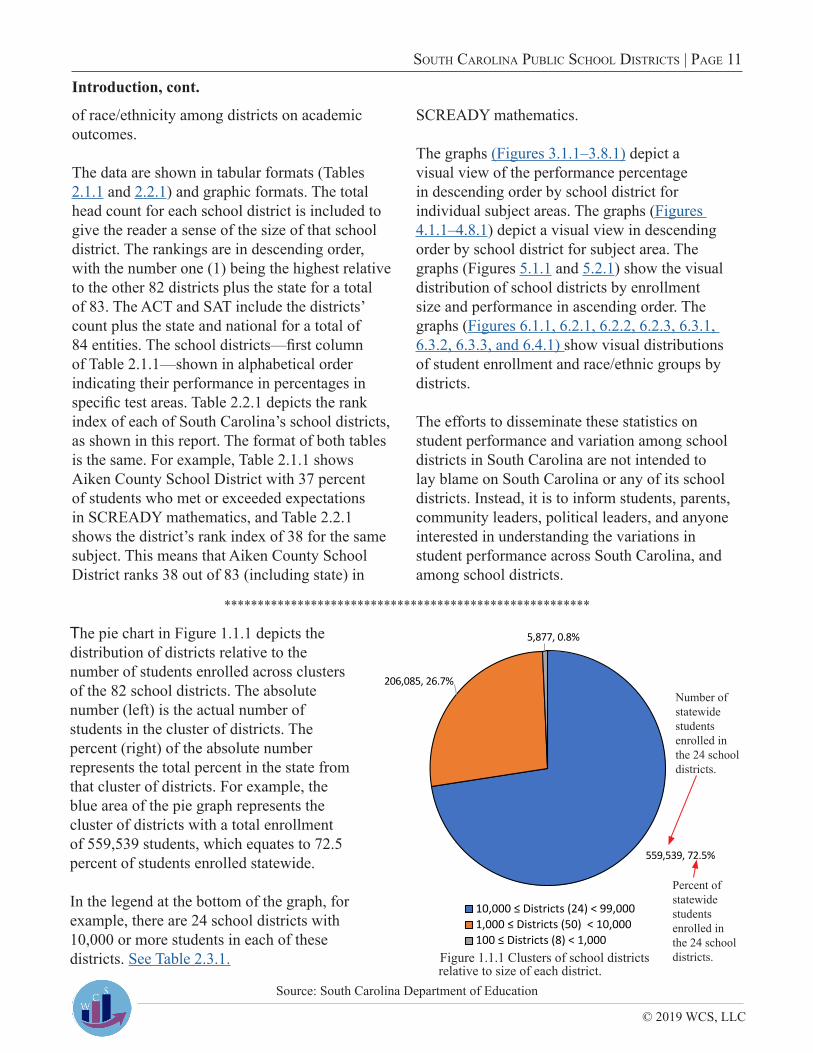
559,539, 72.5%
206,085, 26.7%
5,877, 0.8%
10,000 ≤ Districts (24) < 99,0001,000 ≤ Districts (50) < 10,000100 ≤ Districts (8) < 1,000
The pie chart in Figure 1.1.1 depicts the distribution of districts relative to the number of students enrolled across clusters of the 82 school districts. The absolute number (left) is the actual number of students in the cluster of districts. The percent (right) of the absolute number represents the total percent in the state from that cluster of districts. For example, the blue area of the pie graph represents the cluster of districts with a total enrollment of 559,539 students, which equates to 72.5 percent of students enrolled statewide.
In the legend at the bottom of the graph, for example, there are 24 school districts with 10,000 or more students in each of these districts. See Table 2.3.1.
Source: South Carolina Department of Education
*******************************************************
Figure 1.1.1 Clusters of school districts relative to size of each district.
Number of statewide students enrolled in the 24 school districts.
Percent of statewide students enrolled in the 24 school districts.
Page 12
It must be demonstrated . . .
Section IITabular Analysis: Enrollment,
Performance, and Rank Index by School District—Districts in Alphabetical Order
© 2019 WCS, LLC
south Carolina PubliC sChool distriCts | Page 13
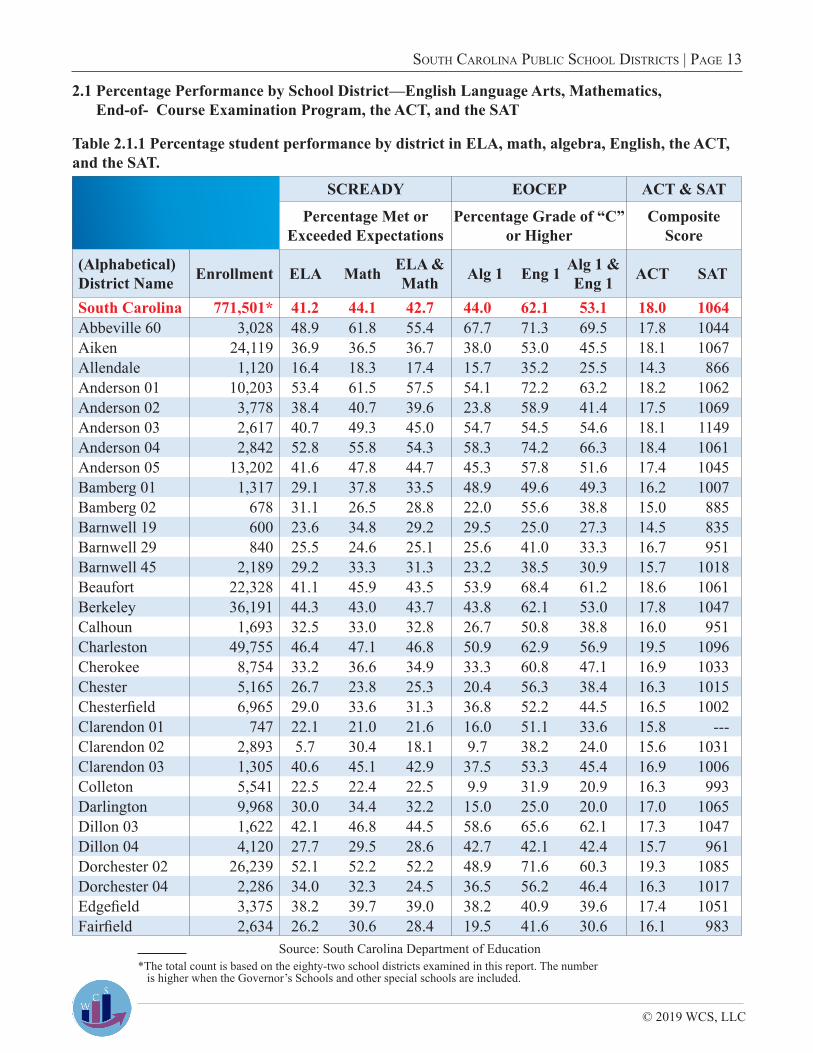
Table 2.1.1 Percentage student performance by district in ELA, math, algebra, English, the ACT, and the SAT.
SCREADY EOCEP ACT & SAT
Percentage Met or Exceeded Expectations
Percentage Grade of “C” or Higher
CompositeScore
(Alphabetical)District Name Enrollment ELA Math ELA &
Math Alg 1 Eng 1 Alg 1 & Eng 1 ACT SAT
South Carolina 771,501* 41.2 44.1 42.7 44.0 62.1 53.1 18.0 1064Abbeville 60 3,028 48.9 61.8 55.4 67.7 71.3 69.5 17.8 1044Aiken 24,119 36.9 36.5 36.7 38.0 53.0 45.5 18.1 1067Allendale 1,120 16.4 18.3 17.4 15.7 35.2 25.5 14.3 866Anderson 01 10,203 53.4 61.5 57.5 54.1 72.2 63.2 18.2 1062Anderson 02 3,778 38.4 40.7 39.6 23.8 58.9 41.4 17.5 1069Anderson 03 2,617 40.7 49.3 45.0 54.7 54.5 54.6 18.1 1149Anderson 04 2,842 52.8 55.8 54.3 58.3 74.2 66.3 18.4 1061Anderson 05 13,202 41.6 47.8 44.7 45.3 57.8 51.6 17.4 1045Bamberg 01 1,317 29.1 37.8 33.5 48.9 49.6 49.3 16.2 1007Bamberg 02 678 31.1 26.5 28.8 22.0 55.6 38.8 15.0 885Barnwell 19 600 23.6 34.8 29.2 29.5 25.0 27.3 14.5 835Barnwell 29 840 25.5 24.6 25.1 25.6 41.0 33.3 16.7 951Barnwell 45 2,189 29.2 33.3 31.3 23.2 38.5 30.9 15.7 1018Beaufort 22,328 41.1 45.9 43.5 53.9 68.4 61.2 18.6 1061Berkeley 36,191 44.3 43.0 43.7 43.8 62.1 53.0 17.8 1047Calhoun 1,693 32.5 33.0 32.8 26.7 50.8 38.8 16.0 951Charleston 49,755 46.4 47.1 46.8 50.9 62.9 56.9 19.5 1096Cherokee 8,754 33.2 36.6 34.9 33.3 60.8 47.1 16.9 1033Chester 5,165 26.7 23.8 25.3 20.4 56.3 38.4 16.3 1015Chesterfield 6,965 29.0 33.6 31.3 36.8 52.2 44.5 16.5 1002Clarendon 01 747 22.1 21.0 21.6 16.0 51.1 33.6 15.8 ---Clarendon 02 2,893 5.7 30.4 18.1 9.7 38.2 24.0 15.6 1031Clarendon 03 1,305 40.6 45.1 42.9 37.5 53.3 45.4 16.9 1006Colleton 5,541 22.5 22.4 22.5 9.9 31.9 20.9 16.3 993Darlington 9,968 30.0 34.4 32.2 15.0 25.0 20.0 17.0 1065Dillon 03 1,622 42.1 46.8 44.5 58.6 65.6 62.1 17.3 1047Dillon 04 4,120 27.7 29.5 28.6 42.7 42.1 42.4 15.7 961Dorchester 02 26,239 52.1 52.2 52.2 48.9 71.6 60.3 19.3 1085Dorchester 04 2,286 34.0 32.3 24.5 36.5 56.2 46.4 16.3 1017Edgefield 3,375 38.2 39.7 39.0 38.2 40.9 39.6 17.4 1051Fairfield 2,634 26.2 30.6 28.4 19.5 41.6 30.6 16.1 983
Source: South Carolina Department of Education
2.1 Percentage Performance by School District—English Language Arts, Mathematics, End-of- Course Examination Program, the ACT, and the SAT
*The total count is based on the eighty-two school districts examined in this report. The number is higher when the Governor’s Schools and other special schools are included. when the Governor's S
© 2019 WCS, LLC.
Page 14 | ComParative analysis of PerformanCe and enrollment Patterns
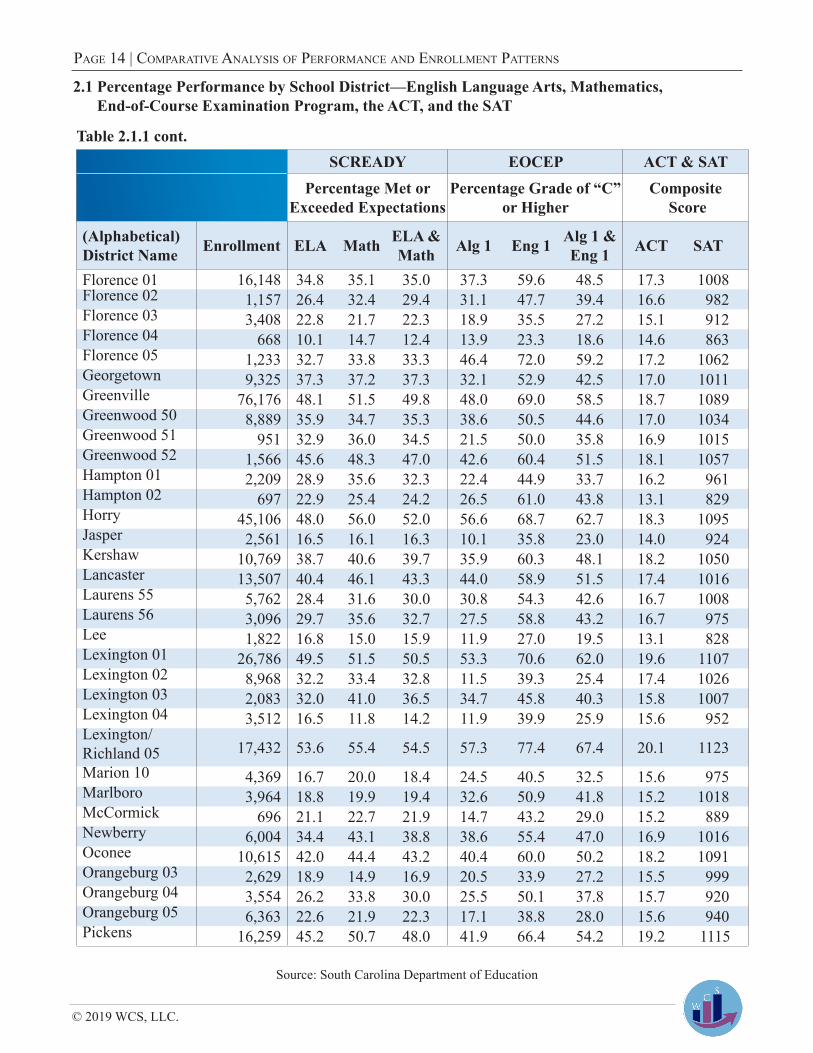
Table 2.1.1 cont.SCREADY EOCEP ACT & SAT
Percentage Met or Exceeded Expectations
Percentage Grade of “C” or Higher
Composite Score
(Alphabetical)District Name Enrollment ELA Math ELA &
Math Alg 1 Eng 1 Alg 1 & Eng 1 ACT SAT
Florence 01 16,148 34.8 35.1 35.0 37.3 59.6 48.5 17.3 1008Florence 02 1,157 26.4 32.4 29.4 31.1 47.7 39.4 16.6 982Florence 03 3,408 22.8 21.7 22.3 18.9 35.5 27.2 15.1 912Florence 04 668 10.1 14.7 12.4 13.9 23.3 18.6 14.6 863Florence 05 1,233 32.7 33.8 33.3 46.4 72.0 59.2 17.2 1062Georgetown 9,325 37.3 37.2 37.3 32.1 52.9 42.5 17.0 1011Greenville 76,176 48.1 51.5 49.8 48.0 69.0 58.5 18.7 1089Greenwood 50 8,889 35.9 34.7 35.3 38.6 50.5 44.6 17.0 1034Greenwood 51 951 32.9 36.0 34.5 21.5 50.0 35.8 16.9 1015Greenwood 52 1,566 45.6 48.3 47.0 42.6 60.4 51.5 18.1 1057Hampton 01 2,209 28.9 35.6 32.3 22.4 44.9 33.7 16.2 961Hampton 02 697 22.9 25.4 24.2 26.5 61.0 43.8 13.1 829Horry 45,106 48.0 56.0 52.0 56.6 68.7 62.7 18.3 1095Jasper 2,561 16.5 16.1 16.3 10.1 35.8 23.0 14.0 924Kershaw 10,769 38.7 40.6 39.7 35.9 60.3 48.1 18.2 1050Lancaster 13,507 40.4 46.1 43.3 44.0 58.9 51.5 17.4 1016Laurens 55 5,762 28.4 31.6 30.0 30.8 54.3 42.6 16.7 1008Laurens 56 3,096 29.7 35.6 32.7 27.5 58.8 43.2 16.7 975Lee 1,822 16.8 15.0 15.9 11.9 27.0 19.5 13.1 828Lexington 01 26,786 49.5 51.5 50.5 53.3 70.6 62.0 19.6 1107Lexington 02 8,968 32.2 33.4 32.8 11.5 39.3 25.4 17.4 1026Lexington 03 2,083 32.0 41.0 36.5 34.7 45.8 40.3 15.8 1007Lexington 04 3,512 16.5 11.8 14.2 11.9 39.9 25.9 15.6 952Lexington/Richland 05 17,432 53.6 55.4 54.5 57.3 77.4 67.4 20.1 1123Marion 10 4,369 16.7 20.0 18.4 24.5 40.5 32.5 15.6 975Marlboro 3,964 18.8 19.9 19.4 32.6 50.9 41.8 15.2 1018McCormick 696 21.1 22.7 21.9 14.7 43.2 29.0 15.2 889Newberry 6,004 34.4 43.1 38.8 38.6 55.4 47.0 16.9 1016Oconee 10,615 42.0 44.4 43.2 40.4 60.0 50.2 18.2 1091Orangeburg 03 2,629 18.9 14.9 16.9 20.5 33.9 27.2 15.5 999Orangeburg 04 3,554 26.2 33.8 30.0 25.5 50.1 37.8 15.7 920Orangeburg 05 6,363 22.6 21.9 22.3 17.1 38.8 28.0 15.6 940Pickens 16,259 45.2 50.7 48.0 41.9 66.4 54.2 19.2 1115
Source: South Carolina Department of Education
2.1 Percentage Performance by School District—English Language Arts, Mathematics, End-of-Course Examination Program, the ACT, and the SAT

© 2019 WCS, LLC
south Carolina PubliC sChool distriCts | Page 15
Table 2.1.1 cont.SCREADY EOCEP ACT & SAT
Percentage Met or Exceeded Expectations
Percentage Grade of “C” or Higher
Composite Score
(Alphabetical)District Name Enrollment ELA Math
ELA & Math Alg 1 Eng 1
Alg 1 & Eng 1 ACT SAT
Richland 01 23,782 33.4 31.3 32.4 31.7 59.0 45.4 16.6 1040Richland 02 28,411 42.8 45.0 43.9 49.3 63.0 56.2 17.7 1035Saluda 2,371 29.3 39.6 34.5 33.4 47.2 40.3 17.6 1016SC Public Charter School District 20,313 43.0 38.1 40.6 41.4 68.4 54.9 18.6 1072
Spartanburg 01 5,200 43.7 49.8 46.8 59.1 74.3 66.7 19.0 1094Spartanburg 02 10,254 49.4 52.6 51.0 51.3 69.0 60.2 18.2 1054Spartanburg 03 2,873 37.2 45.0 41.1 10.3 42.1 26.2 17.7 1097Spartanburg 04 2,900 47.8 62.1 55.0 55.6 70.1 62.9 18.2 1077Spartanburg 05 8,796 46.4 52.5 49.5 55.5 68.1 61.8 18.3 1066Spartanburg 06 11,467 35.3 36.1 35.7 47.9 64.1 56.0 17.9 1080Spartanburg 07 7,423 34.9 34.1 34.5 38.5 58.3 48.4 17.9 1090Sumter 16,587 27.2 30.8 29.0 23.8 46.9 35.4 15.6 970Union 3,964 29.1 32.8 31.0 25.6 39.2 32.4 16.1 931Williamsburg 3,589 23 18 20.5 4.2 30.5 17.4 14.7 891York 01 5,246 32.4 46.3 39.4 32.8 50.2 41.5 17.7 1011York 02 8,037 58.7 66.3 62.5 46.6 55.3 51.0 19.8 1101York 03 17,776 38.1 42 40.1 44.0 63.5 53.8 17.9 1041York 04 16,114 65.9 71.8 68.9 74.3 85.1 79.7 21.1 1143United States 51 Million 20.9 1049
Source: South Carolina Department of Education
2.1 Percentage Performance by School District—English Language Arts, Mathematics, End-of-Course Examination Program, the ACT, and the SAT, cont.
© 2019 WCS, LLC.
Page 16 | ComParative analysis of PerformanCe and enrollment Patterns
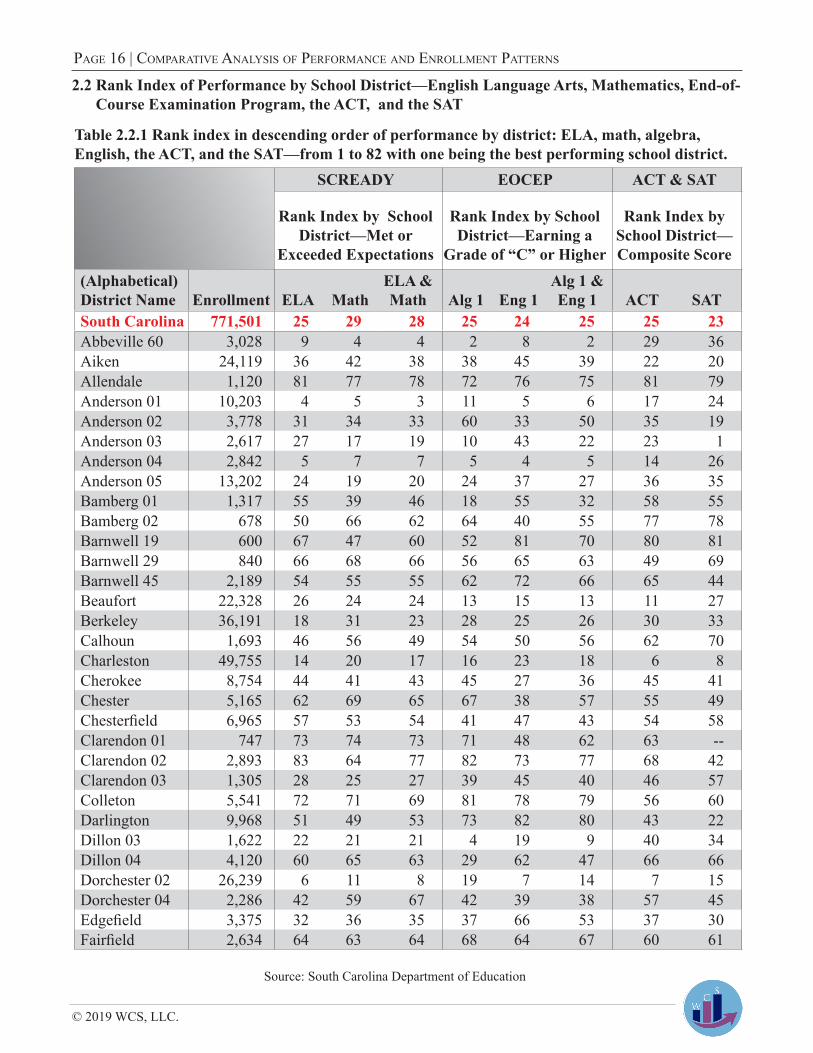
Table 2.2.1 Rank index in descending order of performance by district: ELA, math, algebra, English, the ACT, and the SAT—from 1 to 82 with one being the best performing school district.
SCREADY EOCEP ACT & SAT
Rank Index by School District—Met or
Exceeded Expectations
Rank Index by School District—Earning a
Grade of “C” or Higher
Rank Index by School District—Composite Score
(Alphabetical)District Name Enrollment ELA Math
ELA & Math Alg 1 Eng 1
Alg 1 & Eng 1 ACT SAT
South Carolina 771,501 25 29 28 25 24 25 25 23Abbeville 60 3,028 9 4 4 2 8 2 29 36Aiken 24,119 36 42 38 38 45 39 22 20Allendale 1,120 81 77 78 72 76 75 81 79Anderson 01 10,203 4 5 3 11 5 6 17 24Anderson 02 3,778 31 34 33 60 33 50 35 19Anderson 03 2,617 27 17 19 10 43 22 23 1Anderson 04 2,842 5 7 7 5 4 5 14 26Anderson 05 13,202 24 19 20 24 37 27 36 35Bamberg 01 1,317 55 39 46 18 55 32 58 55Bamberg 02 678 50 66 62 64 40 55 77 78Barnwell 19 600 67 47 60 52 81 70 80 81Barnwell 29 840 66 68 66 56 65 63 49 69Barnwell 45 2,189 54 55 55 62 72 66 65 44Beaufort 22,328 26 24 24 13 15 13 11 27Berkeley 36,191 18 31 23 28 25 26 30 33Calhoun 1,693 46 56 49 54 50 56 62 70Charleston 49,755 14 20 17 16 23 18 6 8Cherokee 8,754 44 41 43 45 27 36 45 41Chester 5,165 62 69 65 67 38 57 55 49Chesterfield 6,965 57 53 54 41 47 43 54 58Clarendon 01 747 73 74 73 71 48 62 63 --Clarendon 02 2,893 83 64 77 82 73 77 68 42Clarendon 03 1,305 28 25 27 39 45 40 46 57Colleton 5,541 72 71 69 81 78 79 56 60Darlington 9,968 51 49 53 73 82 80 43 22Dillon 03 1,622 22 21 21 4 19 9 40 34Dillon 04 4,120 60 65 63 29 62 47 66 66Dorchester 02 26,239 6 11 8 19 7 14 7 15Dorchester 04 2,286 42 59 67 42 39 38 57 45Edgefield 3,375 32 36 35 37 66 53 37 30Fairfield 2,634 64 63 64 68 64 67 60 61
Source: South Carolina Department of Education
2.2 Rank Index of Performance by School District—English Language Arts, Mathematics, End-of-Course Examination Program, the ACT, and the SAT
© 2019 WCS, LLC
south Carolina PubliC sChool distriCts | Page 17
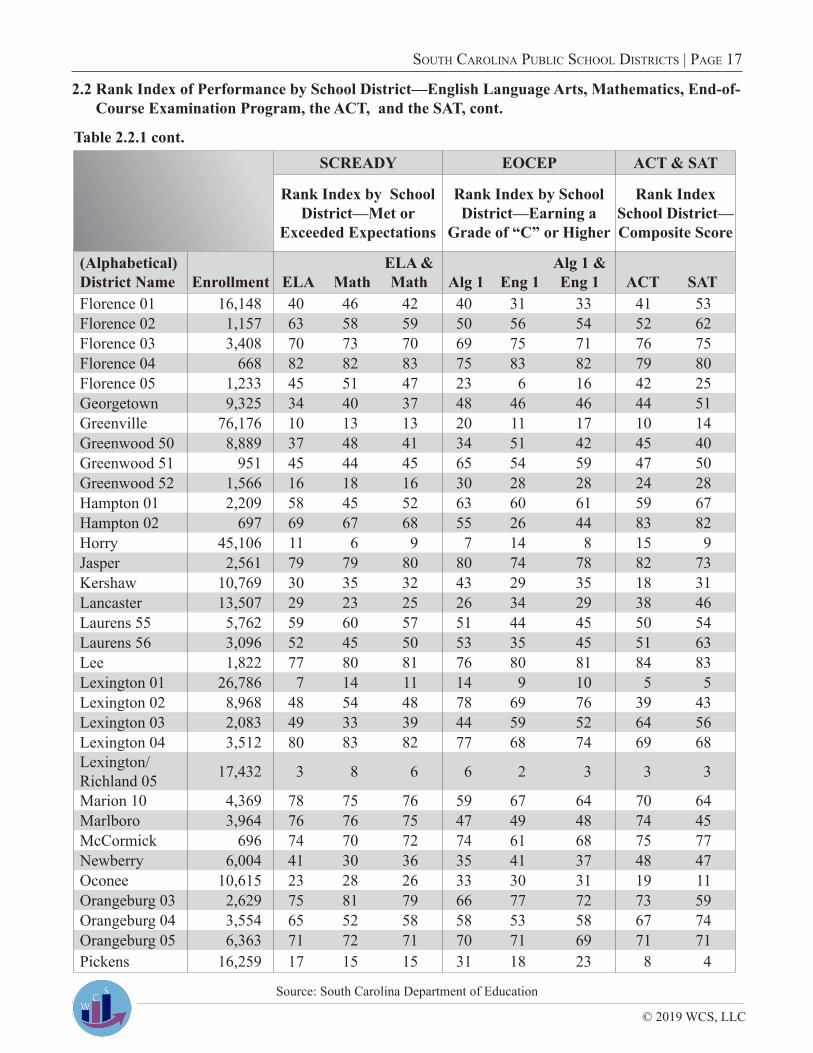
Table 2.2.1 cont.SCREADY EOCEP ACT & SAT
Rank Index by School District—Met or
Exceeded Expectations
Rank Index by School District—Earning a
Grade of “C” or Higher
Rank Index School District—Composite Score
(Alphabetical)District Name Enrollment ELA Math
ELA & Math Alg 1 Eng 1
Alg 1 & Eng 1 ACT SAT
Florence 01 16,148 40 46 42 40 31 33 41 53Florence 02 1,157 63 58 59 50 56 54 52 62Florence 03 3,408 70 73 70 69 75 71 76 75Florence 04 668 82 82 83 75 83 82 79 80Florence 05 1,233 45 51 47 23 6 16 42 25Georgetown 9,325 34 40 37 48 46 46 44 51Greenville 76,176 10 13 13 20 11 17 10 14Greenwood 50 8,889 37 48 41 34 51 42 45 40Greenwood 51 951 45 44 45 65 54 59 47 50Greenwood 52 1,566 16 18 16 30 28 28 24 28Hampton 01 2,209 58 45 52 63 60 61 59 67Hampton 02 697 69 67 68 55 26 44 83 82Horry 45,106 11 6 9 7 14 8 15 9Jasper 2,561 79 79 80 80 74 78 82 73Kershaw 10,769 30 35 32 43 29 35 18 31Lancaster 13,507 29 23 25 26 34 29 38 46Laurens 55 5,762 59 60 57 51 44 45 50 54Laurens 56 3,096 52 45 50 53 35 45 51 63Lee 1,822 77 80 81 76 80 81 84 83Lexington 01 26,786 7 14 11 14 9 10 5 5Lexington 02 8,968 48 54 48 78 69 76 39 43Lexington 03 2,083 49 33 39 44 59 52 64 56Lexington 04 3,512 80 83 82 77 68 74 69 68Lexington/Richland 05 17,432 3 8 6 6 2 3 3 3
Marion 10 4,369 78 75 76 59 67 64 70 64Marlboro 3,964 76 76 75 47 49 48 74 45McCormick 696 74 70 72 74 61 68 75 77Newberry 6,004 41 30 36 35 41 37 48 47Oconee 10,615 23 28 26 33 30 31 19 11Orangeburg 03 2,629 75 81 79 66 77 72 73 59Orangeburg 04 3,554 65 52 58 58 53 58 67 74Orangeburg 05 6,363 71 72 71 70 71 69 71 71Pickens 16,259 17 15 15 31 18 23 8 4
Source: South Carolina Department of Education
2.2 Rank Index of Performance by School District—English Language Arts, Mathematics, End-of-Course Examination Program, the ACT, and the SAT, cont.
© 2019 WCS, LLC.
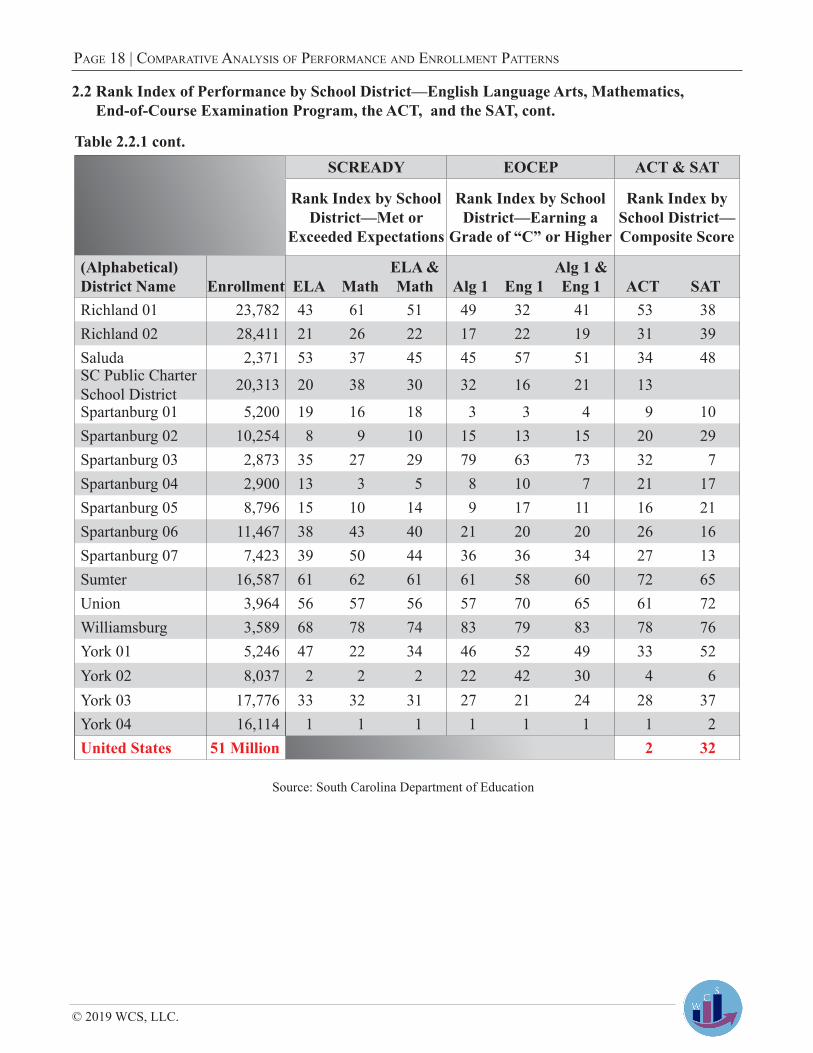
Page 18 | ComParative analysis of PerformanCe and enrollment Patterns
Table 2.2.1 cont.SCREADY EOCEP ACT & SAT
Rank Index by School District—Met or
Exceeded Expectations
Rank Index by School District—Earning a
Grade of “C” or Higher
Rank Index by School District—Composite Score
(Alphabetical)District Name Enrollment ELA Math
ELA & Math Alg 1 Eng 1
Alg 1 & Eng 1 ACT SAT
Richland 01 23,782 43 61 51 49 32 41 53 38Richland 02 28,411 21 26 22 17 22 19 31 39Saluda 2,371 53 37 45 45 57 51 34 48SC Public Charter School District 20,313 20 38 30 32 16 21 13
Spartanburg 01 5,200 19 16 18 3 3 4 9 10Spartanburg 02 10,254 8 9 10 15 13 15 20 29Spartanburg 03 2,873 35 27 29 79 63 73 32 7Spartanburg 04 2,900 13 3 5 8 10 7 21 17Spartanburg 05 8,796 15 10 14 9 17 11 16 21Spartanburg 06 11,467 38 43 40 21 20 20 26 16Spartanburg 07 7,423 39 50 44 36 36 34 27 13Sumter 16,587 61 62 61 61 58 60 72 65Union 3,964 56 57 56 57 70 65 61 72Williamsburg 3,589 68 78 74 83 79 83 78 76York 01 5,246 47 22 34 46 52 49 33 52York 02 8,037 2 2 2 22 42 30 4 6York 03 17,776 33 32 31 27 21 24 28 37York 04 16,114 1 1 1 1 1 1 1 2United States 51 Million 2 32
Source: South Carolina Department of Education
2.2 Rank Index of Performance by School District—English Language Arts, Mathematics, End-of-Course Examination Program, the ACT, and the SAT, cont.

© 2019 WCS, LLC
south Carolina PubliC sChool distriCts | Page 19
Table 2.3.1 Percentage distribution of student enrollment by school district and race/ethnicity.
Percentage distribution of student enrollment by district and race/ethnicity
(Alphabetical)District Name Enrollment White
Black or African
AmericanHispanic or Latino Other*
South Carolina 771,501 50.9 33.6 10.3 6.6Abbeville 60 3,028 62.1 33.9 1.5 2.4Aiken 24,119 50.5 33.9 10.2 5.4Allendale 1,120 3.0 93.8 1.5 1.7Anderson 01 10,203 80.3 6.4 7.6 5.8Anderson 02 3,778 76.7 14.2 2.8 6.3Anderson 03 2,617 83.3 8.3 3.4 5.0Anderson 04 2,842 75.1 16.4 2.7 5.8Anderson 05 13,202 50.7 33.1 8.1 8.2Bamberg 01 1,317 39.4 56.0 2.0 2.6Bamberg 02 678 2.5 94.2 0.7 2.5Barnwell 19 600 14.2 80.3 3.2 2.3Barnwell 29 840 39.9 55.1 1.2 3.8Barnwell 45 2,189 43.0 47.3 3.5 6.2Beaufort 22,328 39.9 26.3 27.8 6.0Berkeley 36,191 49.7 29.3 12.6 8.3Calhoun 1,693 35.1 56.6 6.8 1.4Charleston 49,755 48.2 37.0 9.9 4.9Cherokee 8,754 63.5 26.4 6.9 3.2Chester 5,165 46.8 46.1 2.3 4.8Chesterfield 6,965 49.9 38.0 6.8 5.3Clarendon 01 747 3.9 92.5 2.1 1.5Clarendon 02 2,893 28.0 62.3 5.0 4.6Clarendon 03 1,305 70.9 22.5 5.5 1.1Colleton 5,541 41.9 46.5 5.8 5.8Darlington 9,968 38.7 50.4 4.1 6.8Dillon 03 1,622 59.6 31.4 2.1 6.8Dillon 04 4,120 27.5 59.5 5.1 8.0Dorchester 02 26,239 53.9 28.9 8.3 8.9Dorchester 04 2,286 43.8 45.5 3.4 7.3Edgefield 3,375 48.8 39.5 6.5 5.2Fairfield 2,634 9.8 85.2 2.4 2.6
2.3 Percentage Enrollment Distribution of Student Enrollment by School District and Race/Ethnicity
*Other: American Indian, Asian, Hawaiian or Other Pacific Islander, Two or More Races, and missing.
Data Source: South Carolina Department of Education

© 2019 WCS, LLC.
Page 20 | ComParative analysis of PerformanCe and enrollment Patterns
Table 2.3.1 cont.Percentage distribution of student enrollment by district and race/ethnicity
(Alphabetical)District Name Enrollment White
Black or African
AmericanHispanic or Latino Other*
Florence 01 16,148 37.5 53.7 3.6 5.2Florence 02 1,157 55.4 35.9 4.3 4.4Florence 03 3,408 27.6 64.5 5.2 2.7Florence 04 668 8.4 79.9 7.6 4.0Florence 05 1,233 65.8 27.0 3.5 3.7Georgetown 9,325 49.3 43.7 5.7 1.3Greenville 76,176 53.8 22.5 16.4 7.3Greenwood 50 8,889 39.6 42.5 13.2 4.7Greenwood 51 951 74.4 15.5 5.5 4.6Greenwood 52 1,566 70.7 23.0 2.1 4.2Hampton 01 2,209 41.9 53.1 1.4 3.7Hampton 02 697 1.0 94.3 4.3 0.4Horry 45,106 59.7 18.5 14.4 7.4Jasper 2,561 11.6 58.9 27.8 1.8Kershaw 10,769 60.6 25.8 7.5 6.1Lancaster 13,507 59.3 26.4 9.2 5.1Laurens 55 5,762 54.4 29.9 12.1 3.5Laurens 56 3,096 52.4 36.6 5.6 5.5Lee 1,822 6.4 90.6 1.7 1.3Lexington 01 26,786 73.0 11.7 8.2 7.1Lexington 02 8,968 41.2 32.4 19.5 6.9Lexington 03 2,083 52.3 31.4 12.1 4.2Lexington 04 3,512 58.1 18.5 17.1 6.3Lexington/Richland 05 17,432 57.7 27.9 5.4 9.1Marion 10 4,369 17.1 76.6 3.2 3.1Marlboro 3,964 29.6 58.6 0.9 10.9McCormick 696 19.5 78.2 0.1 2.2Newberry 6,004 45.4 34.0 15.3 5.3Oconee 10,615 75.3 9.3 10.7 4.7
2.3 Percentage Enrollment Distribution of Student Enrollment by School District and Race/Ethnicity, cont.
*Other: American Indian, Asian, Hawaiian or Other Pacific Islander, Two or More Races, and missing.
Source: South Carolina Department of Education
© 2019 WCS, LLC
south Carolina PubliC sChool distriCts | Page 21
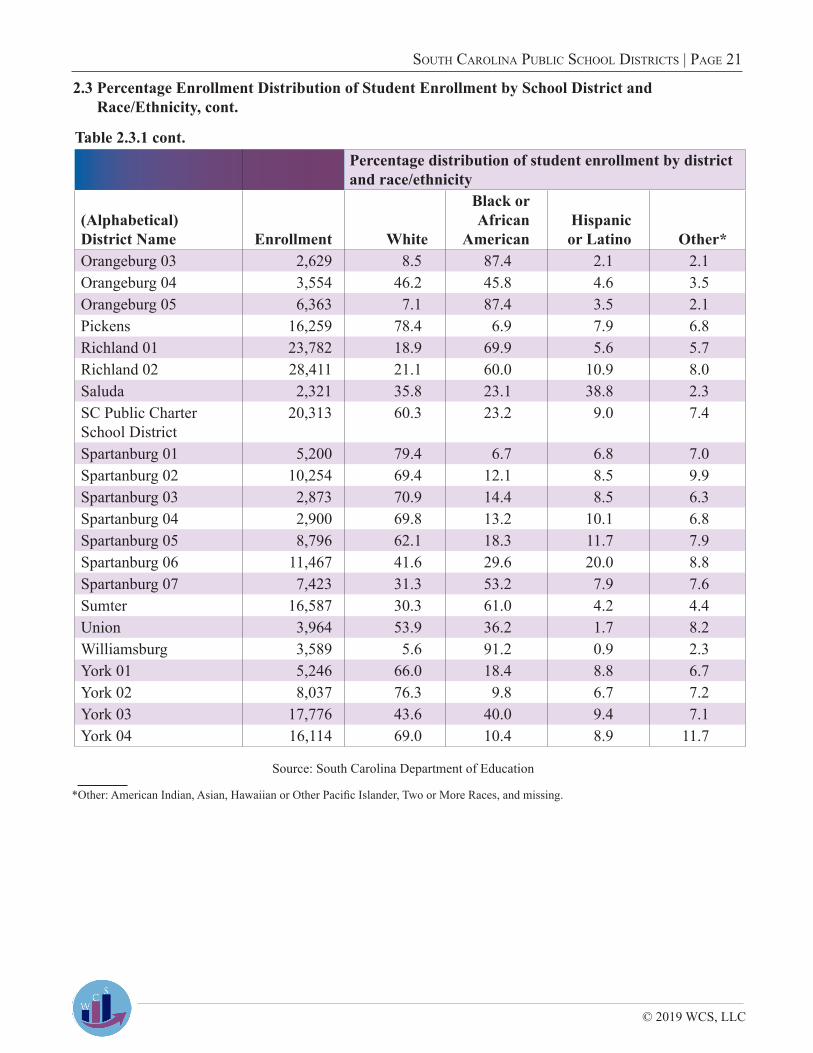
Table 2.3.1 cont.Percentage distribution of student enrollment by district and race/ethnicity
(Alphabetical)District Name Enrollment White
Black or African
AmericanHispanic or Latino Other*
Orangeburg 03 2,629 8.5 87.4 2.1 2.1Orangeburg 04 3,554 46.2 45.8 4.6 3.5Orangeburg 05 6,363 7.1 87.4 3.5 2.1Pickens 16,259 78.4 6.9 7.9 6.8Richland 01 23,782 18.9 69.9 5.6 5.7Richland 02 28,411 21.1 60.0 10.9 8.0Saluda 2,321 35.8 23.1 38.8 2.3SC Public Charter School District
20,313 60.3 23.2 9.0 7.4
Spartanburg 01 5,200 79.4 6.7 6.8 7.0Spartanburg 02 10,254 69.4 12.1 8.5 9.9Spartanburg 03 2,873 70.9 14.4 8.5 6.3Spartanburg 04 2,900 69.8 13.2 10.1 6.8Spartanburg 05 8,796 62.1 18.3 11.7 7.9Spartanburg 06 11,467 41.6 29.6 20.0 8.8Spartanburg 07 7,423 31.3 53.2 7.9 7.6Sumter 16,587 30.3 61.0 4.2 4.4Union 3,964 53.9 36.2 1.7 8.2Williamsburg 3,589 5.6 91.2 0.9 2.3York 01 5,246 66.0 18.4 8.8 6.7York 02 8,037 76.3 9.8 6.7 7.2York 03 17,776 43.6 40.0 9.4 7.1York 04 16,114 69.0 10.4 8.9 11.7
*Other: American Indian, Asian, Hawaiian or Other Pacific Islander, Two or More Races, and missing.
Source: South Carolina Department of Education
2.3 Percentage Enrollment Distribution of Student Enrollment by School District and Race/Ethnicity, cont.
© 2019 WCS, LLC.
Page 22 | ComParative analysis of PerformanCe and enrollment Patterns
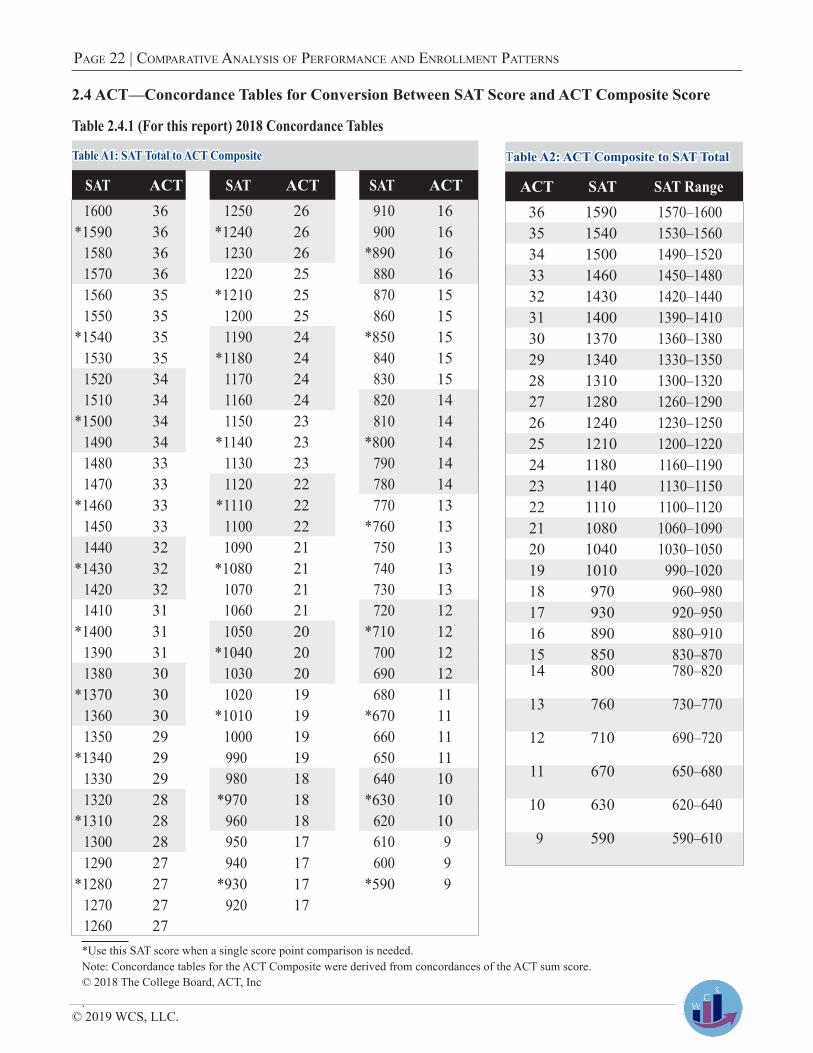
2.4 ACT—Concordance Tables for Conversion Between SAT Score and ACT Composite Score
Table 2.4.1 (For this report) 2018 Concordance Tables
Table A1: SAT Total to ACT Composite
SAT ACT SAT ACT SAT ACT1600 36 1250 26 910 16
*1590 36 *1240 26 900 161580 36 1230 26 *890 161570 36 1220 25 880 161560 35 *1210 25 870 151550 35 1200 25 860 15
*1540 35 1190 24 *850 151530 35 *1180 24 840 151520 34 1170 24 830 151510 34 1160 24 820 14
*1500 34 1150 23 810 141490 34 *1140 23 *800 141480 33 1130 23 790 141470 33 1120 22 780 14
*1460 33 *1110 22 770 131450 33 1100 22 *760 131440 32 1090 21 750 13
*1430 32 *1080 21 740 131420 32 1070 21 730 131410 31 1060 21 720 12
*1400 31 1050 20 *710 121390 31 *1040 20 700 121380 30 1030 20 690 12
*1370 30 1020 19 680 111360 30 *1010 19 *670 111350 29 1000 19 660 11
*1340 29 990 19 650 111330 29 980 18 640 101320 28 *970 18 *630 10
*1310 28 960 18 620 101300 28 950 17 610 91290 27 940 17 600 9
*1280 27 *930 17 *590 91270 27 920 171260 27
Table A2: ACT Composite to SAT Total
ACT SAT SAT Range36 1590 1570–160035 1540 1530–156034 1500 1490–152033 1460 1450–148032 1430 1420–144031 1400 1390–141030 1370 1360–138029 1340 1330–135028 1310 1300–132027 1280 1260–129026 1240 1230–125025 1210 1200–122024 1180 1160–119023 1140 1130–115022 1110 1100–112021 1080 1060–109020 1040 1030–105019 1010 990–102018 970 960–98017 930 920–95016 890 880–91015 850 830–87014 800 780–820
13 760 730–770
12 710 690–720
11 670 650–680
10 630 620–640
9 590 590–610
*Use this SAT score when a single score point comparison is needed.Note: Concordance tables for the ACT Composite were derived from concordances of the ACT sum score.© 2018 The College Board, ACT, Inc
.
Page 23
It must be demonstrated . . .
Section IIIGraphical Analysis: Performance of School
Districts in Descending Order Relative to Assessment Results
© 2019 WCS, LLC.
Page 24 | ComParative analysis of PerformanCe and enrollment Patterns
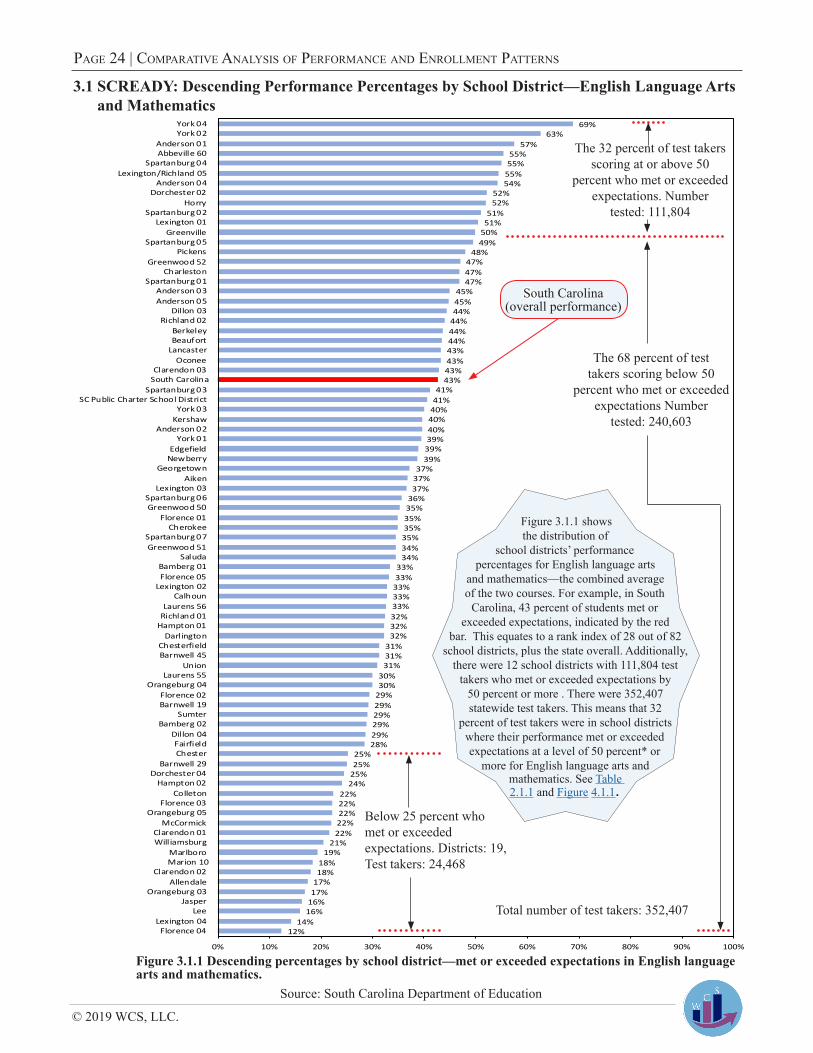
3.1 SCREADY: Descending Performance Percentages by School District—English Language Arts and Mathematics
69%63%
57%55%55%
55%54%
52%52%
51%51%
50%49%
48%47%47%47%
45%45%44%
44%44%44%43%43%43%43%
41%41%
40%40%40%39%39%39%
37%37%37%
36%35%35%35%35%34%34%
33%33%
33%33%33%32%32%32%
31%31%31%
30%30%
29%29%29%29%29%28%
25%25%
25%24%
22%22%22%22%22%
21%19%
18%18%
17%17%
16%16%
14%12%
0% 10% 20% 30% 40% 50% 60% 70% 80% 90% 100%
York 04York 02
Anderson 01Abbeville 60
Spartanburg 04Lexington/Richland 05
Anderson 04Dorchester 02
HorrySpartanburg 02
Lexington 01Greenville
Spartanburg 05Pickens
Greenwood 52Charleston
Spartanburg 01Anderson 03Anderson 05
Dillon 03Richland 02
BerkeleyBeaufort
LancasterOconee
Clarendon 03South Carolina
Spartanburg 03SC Public Charter School District
York 03Kershaw
Anderson 02York 01
EdgefieldNewberry
GeorgetownAiken
Lexington 03Spartanburg 06Greenwood 50
Florence 01Cherokee
Spartanburg 07Greenwood 51
SaludaBamberg 01Florence 05
Lexington 02Calhoun
Laurens 56Richland 01
Hampton 01Darlington
ChesterfieldBarnwell 45
UnionLaurens 55
Orangeburg 04Florence 02Barnwell 19
SumterBamberg 02
Dillon 04FairfieldChester
Barnwell 29Dorchester 04
Hampton 02Colleton
Florence 03Orangeburg 05
McCormickClarendon 01Williamsburg
MarlboroMarion 10
Clarendon 02Allendale
Orangeburg 03Jasper
LeeLexington 04
Florence 04
Figure 3.1.1 Descending percentages by school district—met or exceeded expectations in English language arts and mathematics.
Source: South Carolina Department of Education
Figure 3.1.1 shows the distribution of
school districts’ performance percentages for English language arts
and mathematics—the combined average of the two courses. For example, in South
Carolina, 43 percent of students met or exceeded expectations, indicated by the red
bar. This equates to a rank index of 28 out of 82 school districts, plus the state overall. Additionally,
there were 12 school districts with 111,804 test takers who met or exceeded expectations by
50 percent or more . There were 352,407 statewide test takers. This means that 32
percent of test takers were in school districts where their performance met or exceeded expectations at a level of 50 percent* or
more for English language arts and mathematics. See Table 2.1.1 and Figure 4.1.1.
The 32 percent of test takers scoring at or above 50
percent who met or exceeded expectations. Number
tested: 111,804
The 68 percent of test takers scoring below 50
percent who met or exceeded expectations Number
tested: 240,603
Total number of test takers: 352,407
South Carolina (overall performance)
Below 25 percent who met or exceeded expectations. Districts: 19, Test takers: 24,468

© 2019 WCS, LLC
south Carolina PubliC sChool distriCts | Page 25
66%59%
54%53%
53%52%
50%49%
49%48%48%48%
46%46%
46%45%
44%44%
43%43%
42%42%42%41%41%41%41%40%
39%38%38%38%
37%37%37%
36%35%35%35%34%34%
33%33%33%33%33%32%32%32%
31%30%30%29%29%29%29%29%29%
28%28%
27%27%26%26%26%
26%24%
23%23%23%23%23%22%
21%19%19%
17%17%17%17%16%
10%6%
0% 10% 20% 30% 40% 50% 60% 70% 80% 90% 100%
York 04York 02
Lexington/Richland 05Anderson 01Anderson 04
Dorchester 02Lexington 01
Spartanburg 02Abbeville 60
GreenvilleHorry
Spartanburg 04Charleston
Spartanburg 05Greenwood 52
PickensBerkeley
Spartanburg 01SC Public Charter School District
Richland 02Dillon 03
OconeeAnderson 05
South CarolinaBeaufort
Anderson 03Clarendon 03
LancasterKershaw
Anderson 02Edgefield
York 03Georgetown
Spartanburg 03Aiken
Greenwood 50Spartanburg 06Spartanburg 07
Florence 01Newberry
Dorchester 04Richland 01
CherokeeGreenwood 51
Florence 05CalhounYork 01
Lexington 02Lexington 03Bamberg 02
DarlingtonLaurens 56
SaludaBarnwell 45Bamberg 01
UnionChesterfieldHampton 01
Laurens 55Dillon 04
SumterChester
Florence 02Fairfield
Orangeburg 04Barnwell 29Barnwell 19
WilliamsburgHampton 02Florence 03
Orangeburg 05Colleton
Clarendon 01McCormick
Orangeburg 03Marlboro
LeeMarion 10
JasperLexington 04
AllendaleFlorence 04
Clarendon 02
3.2 SCREADY: Descending Performance Percentages by School District—English Language Arts
Source: South Carolina Department of EducationFigure 3.2.1 Descending percentages by school district—met or exceeded expectations in English language arts.
Figure 3.2.1
depicts the distribution of school districts’
performance percentages for English language arts. For example, in South Carolina 41 percent of students met
or exceeded expectations, indicated by the red bar. This equates to a rank index of 25 out of 82 school districts, plus the
state overall. Additionally, there were seven school districts, which equates to 48,579 or 14 percent of students statewide who
met or exceeded expectations at the performance level of 50 percent or
higher. There were 352,460 statewide test takers in English language
arts. See Table 2.1.1 and Figure 4.2.1.
Seven districts of test takersscoring at or above the 50 percent level of performance. Tested: 48,579
The were percent of test takersscoring below the performance
level of 50 percent. Number tested: 303,881
Total number of test takers: 352,460
South Carolina (overall performance)
© 2019 WCS, LLC.
Page 26 | ComParative analysis of PerformanCe and enrollment Patterns
72%66%
62%62%62%
56%56%55%
53%53%52%
52%52%
51%50%
49%48%
48%47%47%
46%46%46%
45%45%45%
44%44%
43%43%
42%41%41%41%
40%40%
38%38%
37%37%37%36%36%36%36%
35%35%35%34%34%34%34%34%33%33%33%33%32%32%
32%31%
31%31%30%
30%27%
25%25%
24%23%22%
22%22%
21%20%20%
18%18%
16%15%15%15%
12%
0% 10% 20% 30% 40% 50% 60% 70% 80% 90% 100%
York 04York 02
Spartanburg 04Abbeville 60Anderson 01
HorryAnderson 04
Lexington/Richland 05Spartanburg 02Spartanburg 05
Dorchester 02Greenville
Lexington 01Pickens
Spartanburg 01Anderson 03
Greenwood 52Anderson 05
CharlestonDillon 03
York 01LancasterBeaufort
Clarendon 03Richland 02
Spartanburg 03Oconee
South CarolinaNewberry
BerkeleyYork 03
Lexington 03Anderson 02
KershawEdgefield
SaludaSC Public Charter School District
Bamberg 01Georgetown
CherokeeAiken
Spartanburg 06Greenwood 51
Hampton 01Laurens 56
Florence 01Barnwell 19
Greenwood 50Darlington
Spartanburg 07Florence 05
Orangeburg 04Chesterfield
Lexington 02Barnwell 45
CalhounUnion
Florence 02Dorchester 04
Laurens 55Richland 01
SumterFairfield
Clarendon 02Dillon 04
Bamberg 02Hampton 02Barnwell 29
ChesterMcCormick
ColletonOrangeburg 05
Florence 03Clarendon 01
Marion 10MarlboroAllendale
WilliamsburgJasper
LeeOrangeburg 03
Florence 04Lexington 04
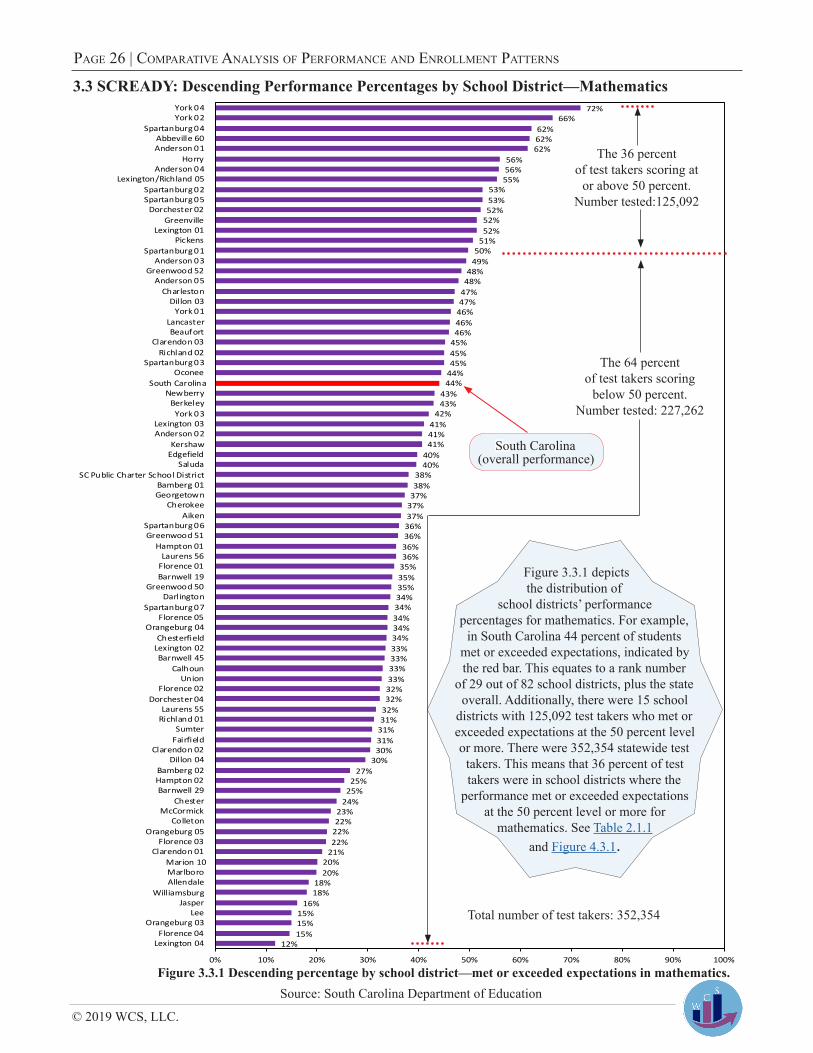
3.3 SCREADY: Descending Performance Percentages by School District—Mathematics
Source: South Carolina Department of EducationFigure 3.3.1 Descending percentage by school district—met or exceeded expectations in mathematics.
Figure 3.3.1 depicts the distribution of
school districts’ performance percentages for mathematics. For example,
in South Carolina 44 percent of students met or exceeded expectations, indicated by the red bar. This equates to a rank number
of 29 out of 82 school districts, plus the state overall. Additionally, there were 15 school
districts with 125,092 test takers who met or exceeded expectations at the 50 percent level or more. There were 352,354 statewide test
takers. This means that 36 percent of test takers were in school districts where the
performance met or exceeded expectations at the 50 percent level or more for
mathematics. See Table 2.1.1 and Figure 4.3.1.
Total number of test takers: 352,354
The 36 percent of test takers scoring at
or above 50 percent.Number tested:125,092
The 64 percent of test takers scoring
below 50 percent.Number tested: 227,262
South Carolina (overall performance)
© 2019 WCS, LLC
south Carolina PubliC sChool distriCts | Page 27
80%70%
67%67%
66%63%63%63%
62%62%62%
61%60%60%
59%59%
57%56%56%
55%55%
54%54%
53%53%
52%52%51%
51%50%
49%48%48%48%
47%47%
46%46%45%45%
45%45%
44%43%
43%43%42%
42%42%41%
40%40%
40%39%
39%39%38%
38%36%35%
34%34%33%
33%32%
31%31%
29%28%
27%27%27%
26%26%
25%25%
24%23%
21%20%
19%19%
17%
0% 10% 20% 30% 40% 50% 60% 70% 80% 90% 100%
York 04Abbeville 60
Lexington/Richland 05Spartanburg 01
Anderson 04Anderson 01
Spartanburg 04Horry
Dillon 03Lexington 01
Spartanburg 05Beaufort
Dorchester 02Spartanburg 02
Florence 05Greenville
CharlestonRichland 02
Spartanburg 06SC Public Charter School District
Anderson 03PickensYork 03
South CarolinaBerkeley
Anderson 05Greenwood 52
LancasterYork 02Oconee
Bamberg 01Florence 01
Spartanburg 07Kershaw
CherokeeNewberry
Dorchester 04Aiken
Clarendon 03Richland 01
Greenwood 50ChesterfieldHampton 02
Laurens 56Laurens 55
GeorgetownDillon 04
MarlboroYork 01
Anderson 02Saluda
Lexington 03Edgefield
Florence 02Bamberg 02
CalhounChester
Orangeburg 04Greenwood 51
SumterHampton 01
Clarendon 01Barnwell 29
Marion 10Union
Barnwell 45Fairfield
McCormickOrangeburg 05
Barnwell 19Florence 03
Orangeburg 03Spartanburg 03
Lexington 04Allendale
Lexington 02Clarendon 02
JasperColleton
DarlingtonLee
Florence 04Williamsburg
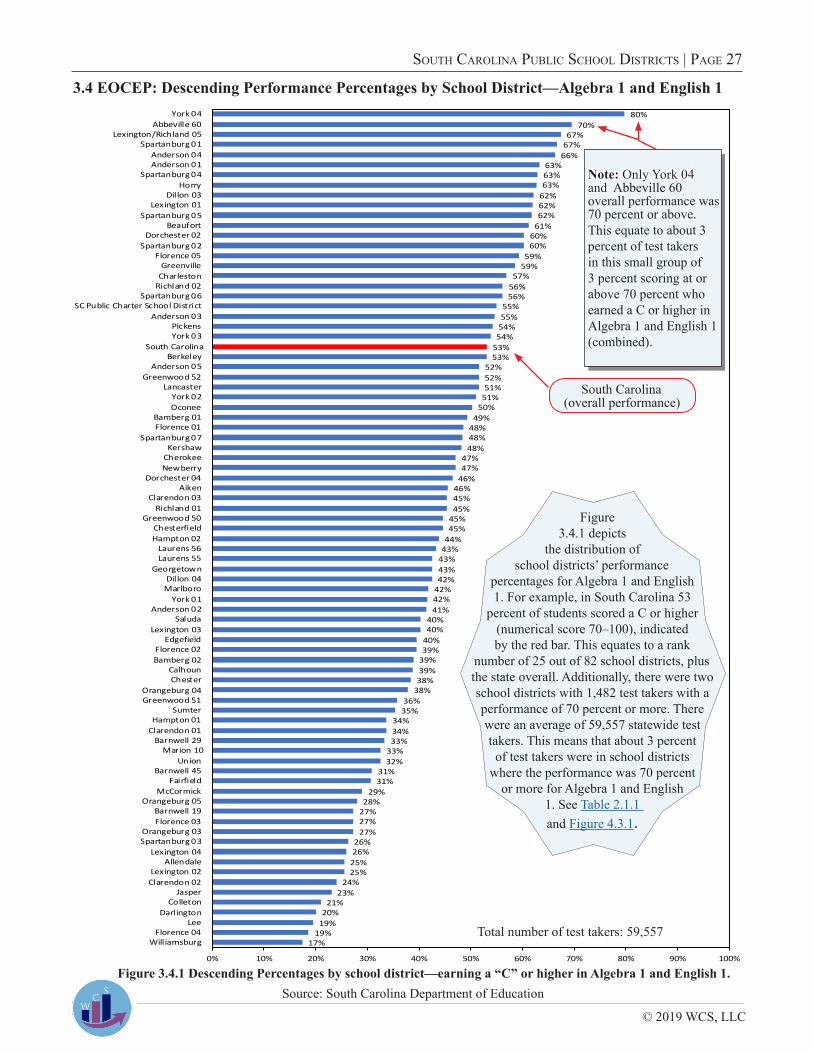
3.4 EOCEP: Descending Performance Percentages by School District—Algebra 1 and English 1
Figure 3.4.1 Descending Percentages by school district—earning a “C” or higher in Algebra 1 and English 1.Source: South Carolina Department of Education
Figure 3.4.1 depicts
the distribution of school districts’ performance
percentages for Algebra 1 and English 1. For example, in South Carolina 53
percent of students scored a C or higher (numerical score 70–100), indicated by the red bar. This equates to a rank
number of 25 out of 82 school districts, plus the state overall. Additionally, there were two school districts with 1,482 test takers with a performance of 70 percent or more. There were an average of 59,557 statewide test takers. This means that about 3 percent
of test takers were in school districts where the performance was 70 percent
or more for Algebra 1 and English 1. See Table 2.1.1 and Figure 4.3.1.
Total number of test takers: 59,557
South Carolina (overall performance)
Note: Only York 04 and Abbeville 60 overall performance was 70 percent or above. This equate to about 3 percent of test takers in this small group of 3 percent scoring at or above 70 percent who earned a C or higher in Algebra 1 and English 1 (combined).
© 2019 WCS, LLC.
Page 28 | ComParative analysis of PerformanCe and enrollment Patterns
74%68%
59%59%58%
57%57%
56%56%
55%54%54%
53%51%51%
49%49%49%
48%48%
47%46%
45%44%44%44%44%
43%43%
42%41%
40%39%39%39%38%38%
38%37%
37%37%
36%35%
33%33%
33%33%
32%32%
31%31%
30%28%
27%27%
26%26%26%
25%24%24%
23%22%22%
22%21%20%
20%19%
17%16%16%
15%15%
14%12%12%12%
10%10%10%10%
4%
0% 10% 20% 30% 40% 50% 60% 70% 80% 90% 100%
York 04Abbeville 60
Spartanburg 01Dillon 03
Anderson 04Lexington/Richland 05
HorrySpartanburg 04Spartanburg 05
Anderson 03Anderson 01
BeaufortLexington 01
Spartanburg 02Charleston
Richland 02Bamberg 01
Dorchester 02Greenville
Spartanburg 06York 02
Florence 05Anderson 05
South CarolinaLancaster
York 03BerkeleyDillon 04
Greenwood 52Pickens
SC Public Charter School DistrictOconee
Greenwood 50Newberry
Spartanburg 07Edgefield
AikenClarendon 03
Florence 01Chesterfield
Dorchester 04Kershaw
Lexington 03Saluda
CherokeeYork 01
MarlboroGeorgetownRichland 01Florence 02Laurens 55
Barnwell 19Laurens 56
CalhounHampton 02Barnwell 29
UnionOrangeburg 04
Marion 10Anderson 02
SumterBarnwell 45
Hampton 01Bamberg 02
Greenwood 51Orangeburg 03
ChesterFairfield
Florence 03Orangeburg 05
Clarendon 01Allendale
DarlingtonMcCormickFlorence 04
LeeLexington 04Lexington 02
Spartanburg 03Jasper
ColletonClarendon 02Williamsburg
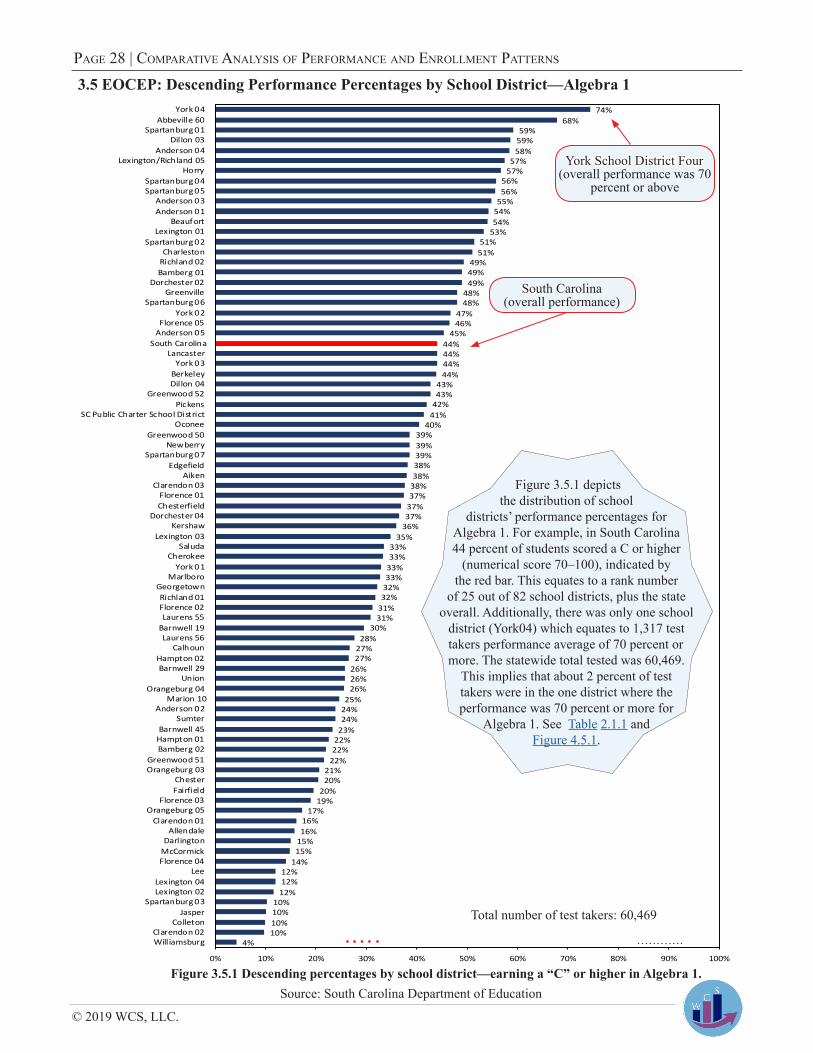
3.5 EOCEP: Descending Performance Percentages by School District—Algebra 1
Figure 3.5.1 Descending percentages by school district—earning a “C” or higher in Algebra 1.Source: South Carolina Department of Education
Figure 3.5.1 depicts the distribution of school
districts’ performance percentages for Algebra 1. For example, in South Carolina 44 percent of students scored a C or higher
(numerical score 70–100), indicated by the red bar. This equates to a rank number
of 25 out of 82 school districts, plus the state overall. Additionally, there was only one school
district (York04) which equates to 1,317 test takers performance average of 70 percent or more. The statewide total tested was 60,469.
This implies that about 2 percent of test takers were in the one district where the performance was 70 percent or more for
Algebra 1. See Table 2.1.1 and Figure 4.5.1.
Total number of test takers: 60,469
South Carolina (overall performance)
York School District Four(overall performance was 70
percent or above
© 2019 WCS, LLC
south Carolina PubliC sChool distriCts | Page 29
85%77%
74%74%
72%72%72%71%
71%70%
69%69%69%68%68%68%
66%66%
64%64%
63%63%
62%62%
61%61%60%60%60%60%
59%59%59%59%
58%58%
56%56%
56%55%55%
55%54%
53%53%53%
52%51%51%51%51%50%50%50%50%
48%47%47%
46%45%
43%42%42%
42%41%41%41%
40%39%39%39%39%38%
36%36%35%
34%32%
31%27%
25%25%
23%
0% 10% 20% 30% 40% 50% 60% 70% 80% 90% 100%
York 04Lexington/Richland 05
Spartanburg 01Anderson 04Anderson 01Florence 05
Dorchester 02Abbeville 60Lexington 01
Spartanburg 04Greenville
Spartanburg 02Horry
BeaufortSC Public Charter School District
Spartanburg 05Pickens
Dillon 03Spartanburg 06
York 03Richland 02Charleston
South CarolinaBerkeley
Hampton 02Cherokee
Greenwood 52KershawOconee
Florence 01Richland 01
Anderson 02Lancaster
Laurens 56Spartanburg 07
Anderson 05Chester
Dorchester 04Bamberg 02
NewberryYork 02
Anderson 03Laurens 55
Clarendon 03Aiken
GeorgetownChesterfield
Clarendon 01Marlboro
CalhounGreenwood 50
York 01Orangeburg 04Greenwood 51
Bamberg 01Florence 02
SaludaSumter
Lexington 03Hampton 01
McCormickDillon 04
Spartanburg 03Fairfield
Barnwell 29EdgefieldMarion 10
Lexington 04Lexington 02
UnionOrangeburg 05
Barnwell 45Clarendon 02
JasperFlorence 03
AllendaleOrangeburg 03
ColletonWilliamsburg
LeeBarnwell 19
DarlingtonFlorence 04
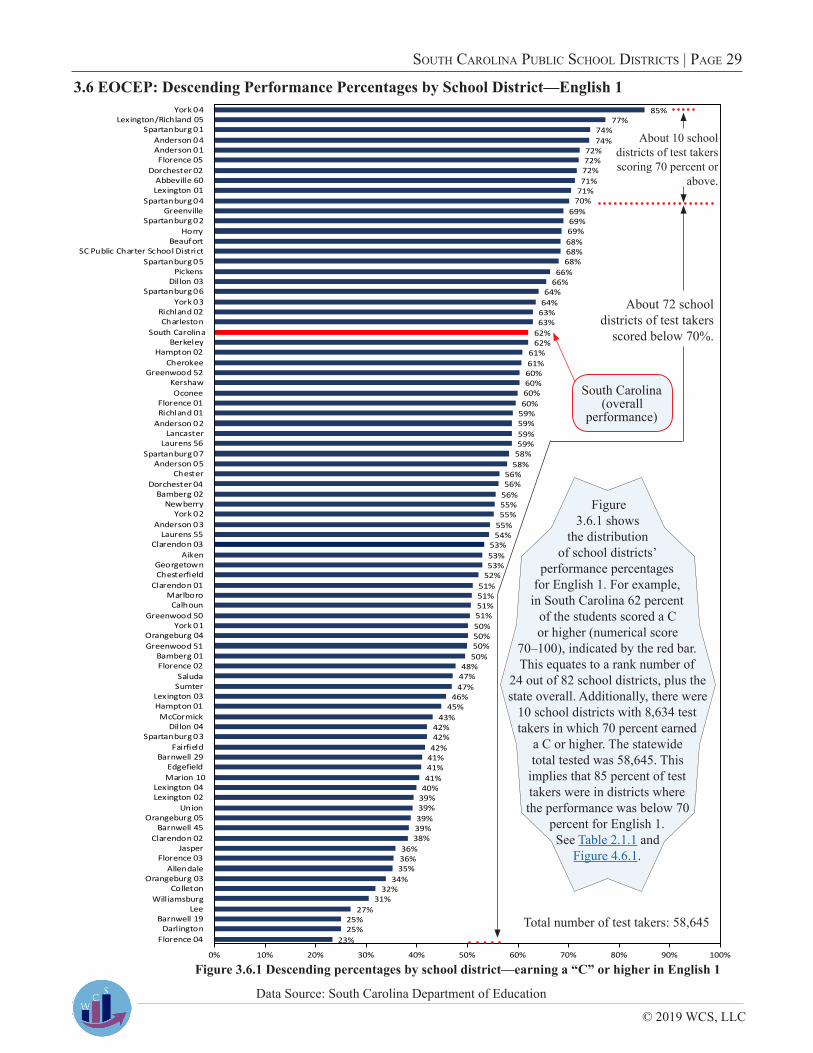
Figure 3.6.1 Descending percentages by school district—earning a “C” or higher in English 1
Data Source: South Carolina Department of Education
Figure 3.6.1 shows
the distribution of school districts’
performance percentages for English 1. For example, in South Carolina 62 percent
of the students scored a C or higher (numerical score
70–100), indicated by the red bar. This equates to a rank number of
24 out of 82 school districts, plus the state overall. Additionally, there were
10 school districts with 8,634 test takers in which 70 percent earned
a C or higher. The statewide total tested was 58,645. This
implies that 85 percent of test takers were in districts where the performance was below 70
percent for English 1. See Table 2.1.1 and
Figure 4.6.1.
About 10 school districts of test takersscoring 70 percent or
above.
About 72 school districts of test takers
scored below 70%.
Total number of test takers: 58,645
3.6 EOCEP: Descending Performance Percentages by School District—English 1
South Carolina (overall
performance)
© 2019 WCS, LLC.
Page 30 | ComParative analysis of PerformanCe and enrollment Patterns
3.7 ACT: Descending Order—ACT Composite Scores by School District21.1
20.920.1
19.819.619.5
19.319.2
19.018.718.618.6
18.418.318.318.218.218.218.218.218.118.118.118.017.917.917.917.817.817.717.717.717.617.517.417.417.417.417.317.317.2
17.017.017.016.916.916.916.9
16.716.716.716.616.616.5
16.316.316.316.216.216.116.116.0
15.815.815.715.715.715.615.615.615.615.615.5
15.215.215.115.0
14.714.614.5
14.314.0
13.113.1
1 6 11 16 21 26 31 36
York 04United States
Lexington/Richland 05York 02
Lexington 01Charleston
Dorchester 02Pickens
Spartanburg 01Greenville
BeaufortSC Public Charter District
Anderson 04Horry
Spartanburg 05Anderson 01
KershawOconee
Spartanburg 02Spartanburg 04
AikenAnderson 03
Greenwood 52South Carolina
Spartanburg 06Spartanburg 07
York 03Abbeville 60
BerkeleyRichland 02
Spartanburg 03York 01Saluda
Anderson 02Anderson 05
EdgefieldLancaster
Lexington 02Dillon 03
Florence 01Florence 05Darlington
GeorgetownGreenwood 50
CherokeeClarendon 03
Greenwood 51Newberry
Barnwell 29Laurens 55Laurens 56
Florence 02Richland 01Chesterfield
ChesterColleton
Dorchester 04Bamberg 01Hampton 01
FairfieldUnion
CalhounClarendon 01Lexington 03Barnwell 45
Dillon 04Orangeburg 04
Clarendon 02Lexington 04
Marion 10Orangeburg 05
SumterOrangeburg 03
MarlboroMcCormickFlorence 03Bamberg 02
WilliamsburgFlorence 04Barnwell 19
AllendaleJasper
Hampton 02Lee
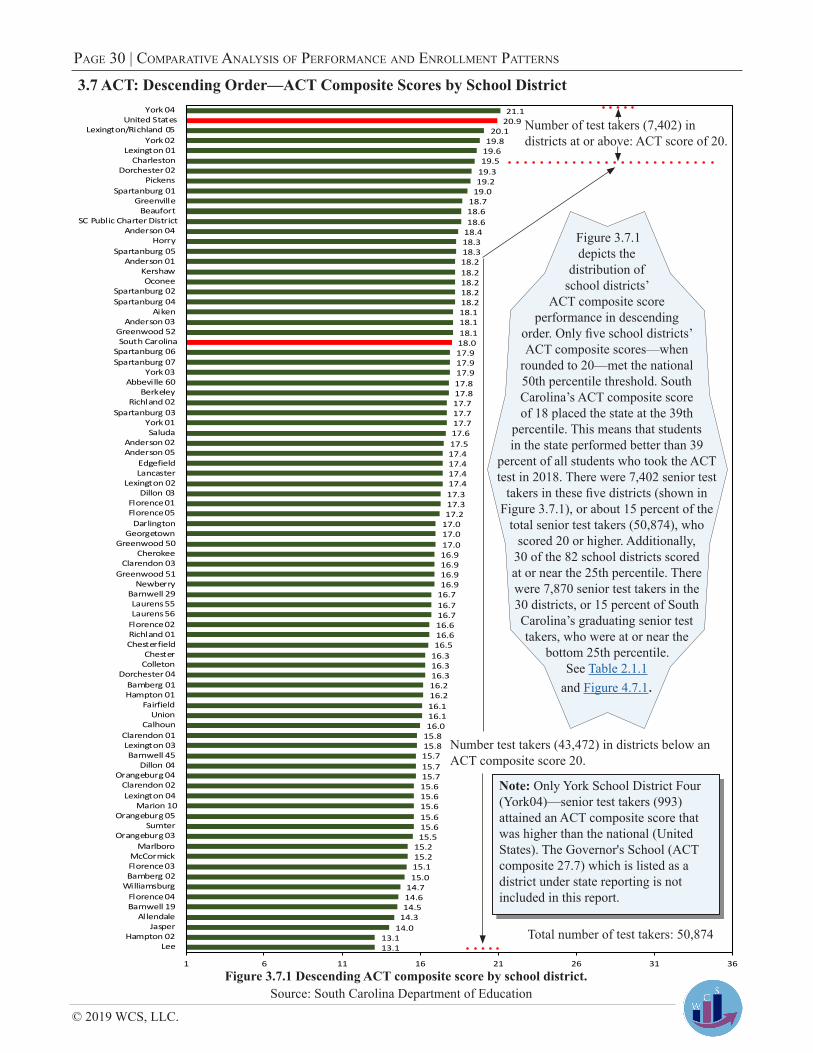
Figure 3.7.1 Descending ACT composite score by school district.Source: South Carolina Department of Education
Figure 3.7.1 depicts the
distribution of school districts’
ACT composite score performance in descending
order. Only five school districts’ ACT composite scores—when
rounded to 20—met the national 50th percentile threshold. South Carolina’s ACT composite score of 18 placed the state at the 39th
percentile. This means that students in the state performed better than 39
percent of all students who took the ACT test in 2018. There were 7,402 senior test
takers in these five districts (shown in Figure 3.7.1), or about 15 percent of the
total senior test takers (50,874), who scored 20 or higher. Additionally,
30 of the 82 school districts scored at or near the 25th percentile. There were 7,870 senior test takers in the 30 districts, or 15 percent of South Carolina’s graduating senior test takers, who were at or near the
bottom 25th percentile. See Table 2.1.1
and Figure 4.7.1.
Note: Only York School District Four (York04)—senior test takers (993) attained an ACT composite score that was higher than the national (United States). The Governor's School (ACT composite 27.7) which is listed as a district under state reporting is not included in this report.
Total number of test takers: 50,874
Number of test takers (7,402) in districts at or above: ACT score of 20.
Number test takers (43,472) in districts below an ACT composite score 20.
© 2019 WCS, LLC
south Carolina PubliC sChool distriCts | Page 31
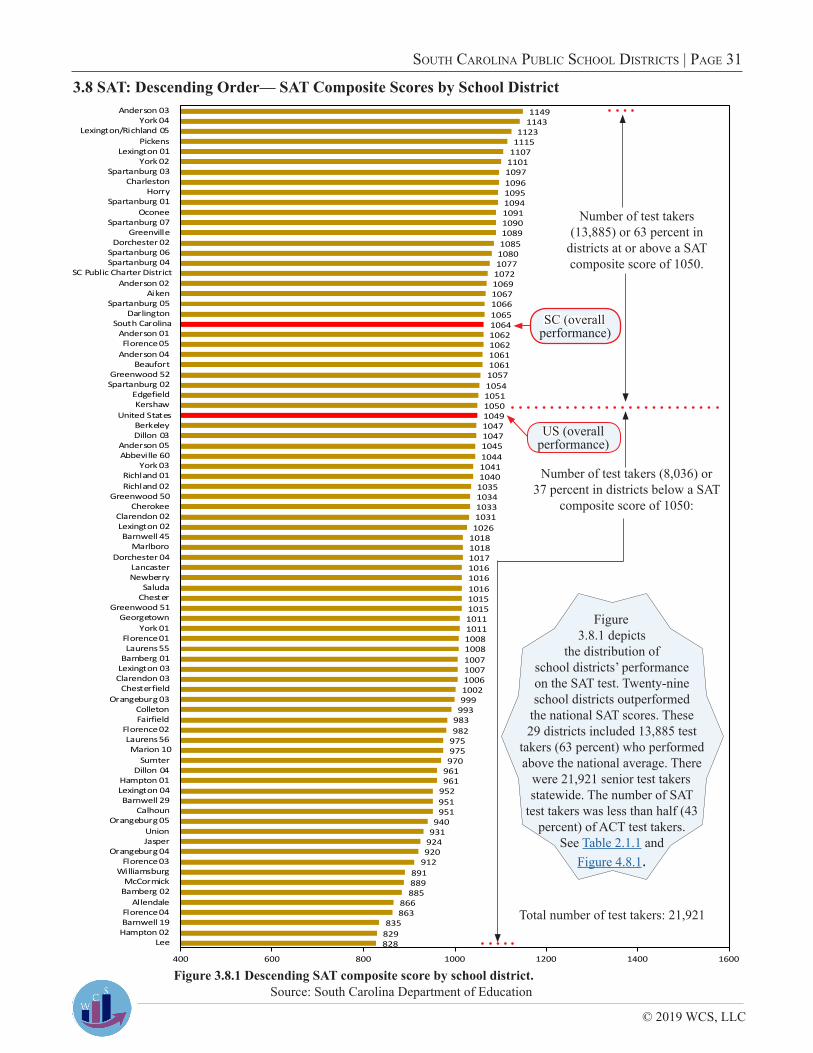
3.8 SAT: Descending Order— SAT Composite Scores by School District1149
11431123
11151107
1101109710961095109410911090108910851080107710721069106710661065106410621062106110611057105410511050104910471047104510441041104010351034103310311026
1018101810171016101610161015101510111011100810081007100710061002999
993983982
975975970
961961
952951951
940931
924920
912891889885
866863
835829828
400 600 800 1000 1200 1400 1600
Anderson 03York 04
Lexington/Richland 05Pickens
Lexington 01York 02
Spartanburg 03Charleston
HorrySpartanburg 01
OconeeSpartanburg 07
GreenvilleDorchester 02
Spartanburg 06Spartanburg 04
SC Public Charter DistrictAnderson 02
AikenSpartanburg 05
DarlingtonSouth Carolina
Anderson 01Florence 05
Anderson 04Beaufort
Greenwood 52Spartanburg 02
EdgefieldKershaw
United StatesBerkeleyDillon 03
Anderson 05Abbeville 60
York 03Richland 01Richland 02
Greenwood 50Cherokee
Clarendon 02Lexington 02Barnwell 45
MarlboroDorchester 04
LancasterNewberry
SaludaChester
Greenwood 51Georgetown
York 01Florence 01Laurens 55
Bamberg 01Lexington 03Clarendon 03
ChesterfieldOrangeburg 03
ColletonFairfield
Florence 02Laurens 56Marion 10
SumterDillon 04
Hampton 01Lexington 04Barnwell 29
CalhounOrangeburg 05
UnionJasper
Orangeburg 04Florence 03
WilliamsburgMcCormick
Bamberg 02Allendale
Florence 04Barnwell 19
Hampton 02Lee
Source: South Carolina Department of Education
Figure
3.8.1 depicts the distribution of
school districts’ performance on the SAT test. Twenty-nine school districts outperformed
the national SAT scores. These 29 districts included 13,885 test
takers (63 percent) who performed above the national average. There
were 21,921 senior test takers statewide. The number of SAT
test takers was less than half (43 percent) of ACT test takers.
See Table 2.1.1 and Figure 4.8.1.
Number of test takers (13,885) or 63 percent in
districts at or above a SAT composite score of 1050.
Number of test takers (8,036) or 37 percent in districts below a SAT
composite score of 1050:
Total number of test takers: 21,921
SC (overall performance)
US (overall performance)
Figure 3.8.1 Descending SAT composite score by school district.
Page 32
It must be demonstrated . . .
Section IVGraphical Analysis: Rank Index of School
Districts in Descending Order Relative to Assessment Results

© 2019 WCS, LLC
south Carolina PubliC sChool distriCts | Page 33
12
34
56
78
910
1113
1415
1617
1819
2021
2223
2425
2627
2829
3031
3233
3435
3637
3839
4041
4243
444545
4647
4849
5051
5253
5455
5657
5859
6061
6263
6465
6667
6869
7071
7273
7475
7677
7879
8081
8283
0 10 20 30 40 50 60 70 80 90
York 04York 02
Anderson 01Abbeville 60
Spartanburg 04Lexington/Richland 05
Anderson 04Dorchester 02
HorrySpartanburg 02
Lexington 01Greenville
Spartanburg 05Pickens
Greenwood 52Charleston
Spartanburg 01Anderson 03Anderson 05
Dillon 03Richland 02
BerkeleyBeaufort
LancasterOconee
Clarendon 03South Carolina
Spartanburg 03SC Public Charter School District
York 03Kershaw
Anderson 02York 01
EdgefieldNewberry
GeorgetownAiken
Lexington 03Spartanburg 06Greenwood 50
Florence 01Cherokee
Spartanburg 07Greenwood 51
SaludaBamberg 01Florence 05
Lexington 02Calhoun
Laurens 56Richland 01
Hampton 01Darlington
ChesterfieldBarnwell 45
UnionLaurens 55
Orangeburg 04Florence 02Barnwell 19
SumterBamberg 02
Dillon 04FairfieldChester
Barnwell 29Dorchester 04
Hampton 02Colleton
Florence 03Orangeburg 05
McCormickClarendon 01Williamsburg
MarlboroMarion 10
Clarendon 02Allendale
Orangeburg 03Jasper
LeeLexington 04Florence 04
4.1 SCREADY: Rank Descends for Performance by School District—English Language Arts and Mathematics
Figure 4.1.1 depicts the rank
index of school districts’ performance from best to worst in descending order. The rankings are based on the percentage of districts’
average performance in grades 3–8 in English language arts and mathematics
(combined). The rank indexes descend from the best performing district, York School
District Four, which ranked 1st out of the 82 districts, plus the state overall. The district of Horry County Schools
ranked 9th. See Table 2.2.1 and Figure 3.1.1.
Figure 4.1.1 Descending rank indexes by school district based on performance—English language arts and mathematics.
Source: South Carolina Department of Education
South Carolina (overall rank)
© 2019 WCS, LLC.
Page 34 | ComParative analysis of PerformanCe and enrollment Patterns
12
34
56
78
910
1113
1415
1617
1819
2021
2223
2425
2627
2829
3031
3233
3435
3637
3839
4041
4243
444545
4647
4849
5051
5253
5455
5657
5859
6061
6263
6465
6667
6869
7071
7273
7475
7677
7879
8081
8283
0 10 20 30 40 50 60 70 80 90
York 04York 02
Lexington/Richland 05Anderson 01Anderson 04
Dorchester 02Lexington 01
Spartanburg 02Abbeville 60
GreenvilleHorry
Spartanburg 04Charleston
Spartanburg 05Greenwood 52
PickensBerkeley
Spartanburg 01SC Public Charter School…
Richland 02Dillon 03Oconee
Anderson 05South Carolina
BeaufortAnderson 03
Clarendon 03LancasterKershaw
Anderson 02Edgefield
York 03Georgetown
Spartanburg 03Aiken
Greenwood 50Spartanburg 06Spartanburg 07
Florence 01Newberry
Dorchester 04Richland 01
CherokeeFlorence 05
Greenwood 51CalhounYork 01
Lexington 02Lexington 03Bamberg 02
DarlingtonLaurens 56
SaludaBarnwell 45Bamberg 01
UnionChesterfieldHampton 01
Laurens 55Dillon 04
SumterChester
Florence 02Fairfield
Orangeburg 04Barnwell 29Barnwell 19
WilliamsburgHampton 02Florence 03
Orangeburg 05Colleton
Clarendon 01McCormick
Orangeburg 03Marlboro
LeeMarion 10
JasperLexington 04
AllendaleFlorence 04
Clarendon 02
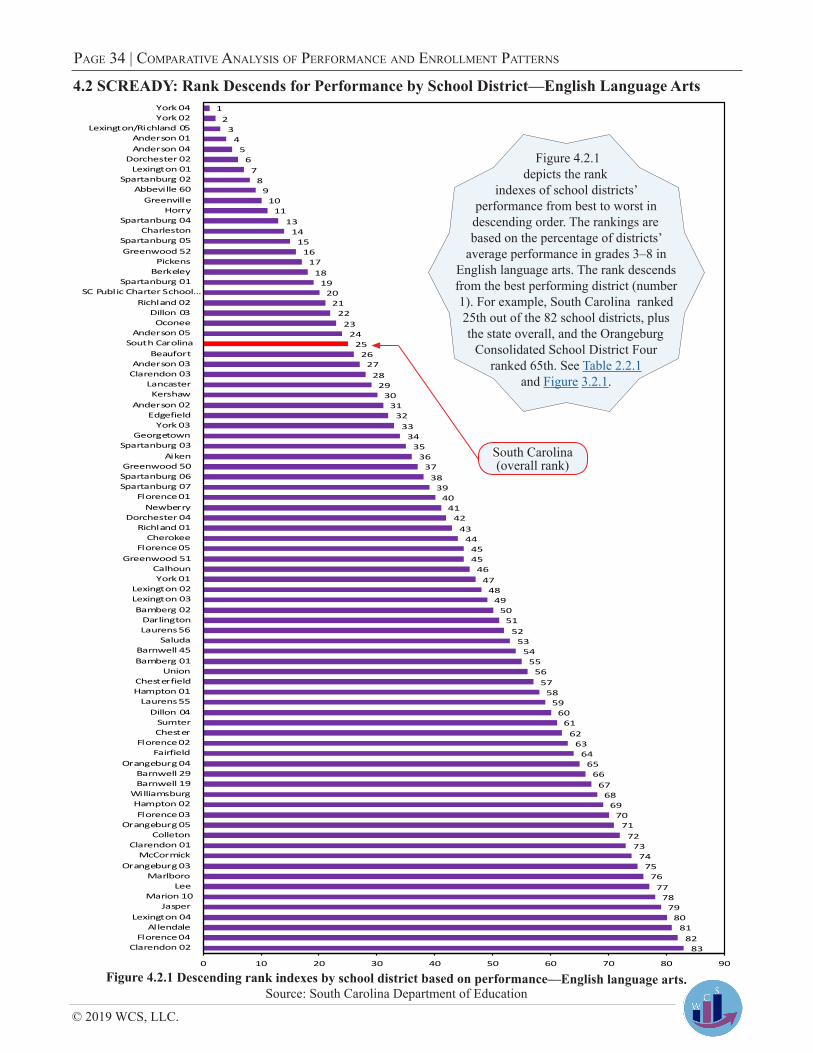
4.2 SCREADY: Rank Descends for Performance by School District—English Language Arts
Figure 4.2.1 Descending rank indexes by school district based on performance—English language arts.Source: South Carolina Department of Education
Figure 4.2.1 depicts the rank
indexes of school districts’ performance from best to worst in descending order. The rankings are based on the percentage of districts’
average performance in grades 3–8 in English language arts. The rank descends from the best performing district (number 1). For example, South Carolina ranked 25th out of the 82 school districts, plus the state overall, and the Orangeburg
Consolidated School District Four ranked 65th. See Table 2.2.1
and Figure 3.2.1.
South Carolina (overall rank)
© 2019 WCS, LLC
south Carolina PubliC sChool distriCts | Page 35
1234567891011
131415161718192021222324252627282930313233343536373839404142434445454647484950515253545556575859606162636465666768697071727374757677787980818283
0 10 20 30 40 50 60 70 80 90
York 04York 02
Spartanburg 04Abbeville 60Anderson 01
HorryAnderson 04
Lexington/Richland 05Spartanburg 02Spartanburg 05
Dorchester 02Greenville
Lexington 01Pickens
Spartanburg 01Anderson 03
Greenwood 52Anderson 05
CharlestonDillon 03
York 01LancasterBeaufort
Clarendon 03Richland 02
Spartanburg 03Oconee
South CarolinaNewberry
BerkeleyYork 03
Lexington 03Anderson 02
KershawEdgefield
SaludaSC Public Charter School District
Bamberg 01Georgetown
CherokeeAiken
Spartanburg 06Greenwood 51
Hampton 01Laurens 56
Florence 01Barnwell 19
Greenwood 50Darlington
Spartanburg 07Florence 05
Orangeburg 04Chesterfield
Lexington 02Barnwell 45
CalhounUnion
Florence 02Dorchester 04
Laurens 55Richland 01
SumterFairfield
Clarendon 02Dillon 04
Bamberg 02Hampton 02Barnwell 29
ChesterMcCormick
ColletonOrangeburg 05
Florence 03Clarendon 01
Marion 10MarlboroAllendale
WilliamsburgJasper
LeeOrangeburg 03
Florence 04Lexington 04
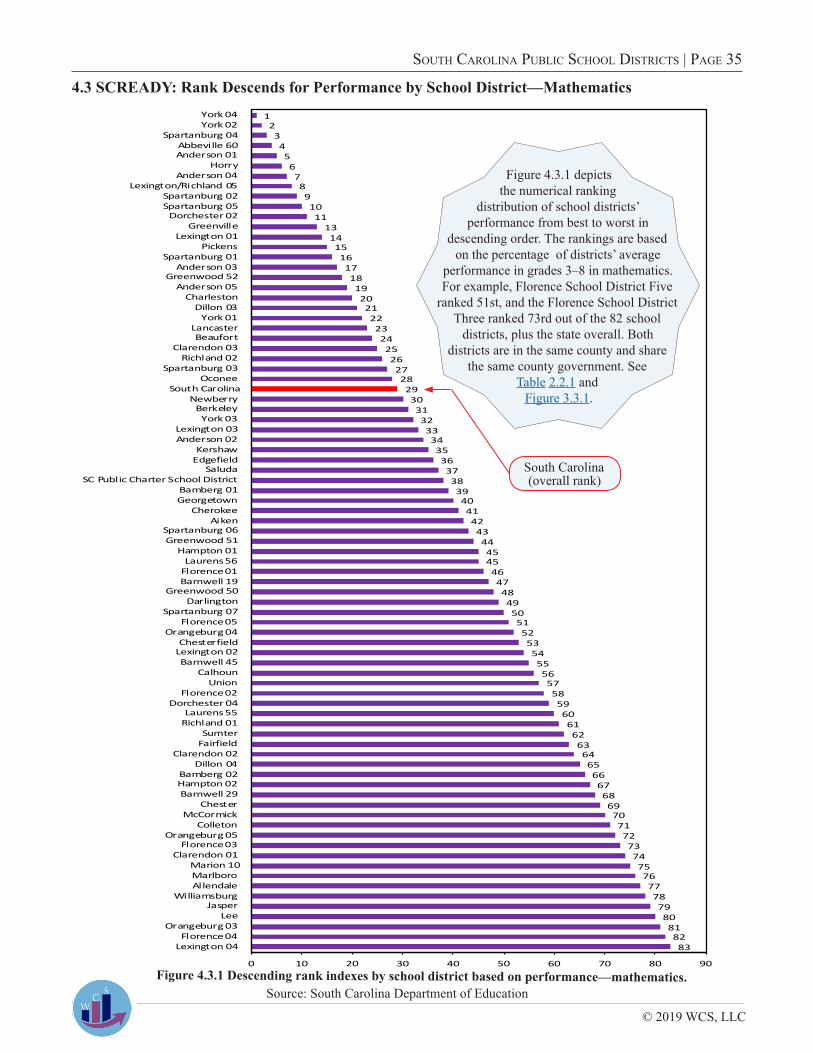
4.3 SCREADY: Rank Descends for Performance by School District—Mathematics
Source: South Carolina Department of Education
Figure 4.3.1 depicts the numerical ranking
distribution of school districts’ performance from best to worst in
descending order. The rankings are based on the percentage of districts’ average
performance in grades 3–8 in mathematics. For example, Florence School District Five
ranked 51st, and the Florence School District Three ranked 73rd out of the 82 school
districts, plus the state overall. Both districts are in the same county and share
the same county government. See Table 2.2.1 and Figure 3.3.1.
South Carolina (overall rank)
Figure 4.3.1 Descending rank indexes by school district based on performance—mathematics.

© 2019 WCS, LLC.
Page 36 | ComParative analysis of PerformanCe and enrollment Patterns
12
34
56
78
910
1113
1415
1617
1819
2021
2223
2425
2627
2829
3031
3233
3435
3637
3839
4041
4243
444545
4647
4849
5051
5253
5455
5657
5859
6061
6263
6465
6667
6869
7071
7273
7475
7677
7879
8081
8283
0 10 20 30 40 50 60 70 80 90
York 04Abbeville 60
Lexington/Richland 05Spartanburg 01
Anderson 04Anderson 01
Spartanburg 04Horry
Dillon 03Lexington 01
Spartanburg 05Beaufort
Dorchester 02Spartanburg 02
Florence 05Greenville
CharlestonRichland 02
Spartanburg 06SC Public Charter School District
Anderson 03PickensYork 03
South CarolinaBerkeley
Anderson 05Greenwood 52
LancasterYork 02Oconee
Bamberg 01Florence 01
Spartanburg 07Kershaw
CherokeeNewberry
Dorchester 04Aiken
Clarendon 03Richland 01
Greenwood 50ChesterfieldHampton 02
Laurens 55Laurens 56
GeorgetownDillon 04
MarlboroYork 01
Anderson 02Saluda
Lexington 03Edgefield
Florence 02Bamberg 02
CalhounChester
Orangeburg 04Greenwood 51
SumterHampton 01
Clarendon 01Barnwell 29
Marion 10Union
Barnwell 45Fairfield
McCormickOrangeburg 05
Barnwell 19Florence 03
Orangeburg 03Spartanburg 03
Lexington 04Allendale
Lexington 02Clarendon 02
JasperColleton
DarlingtonLee
Florence 04Williamsburg
Figure 4.4.1 shows
the ranking distribution of school districts’ performance for
Algebra 1 and English 1—the combined average of the two courses. The rankings
are based on the percentage performance of districts earning a grade C or higher, which
equates to numerical grades 70–100. The rank indexes descend from the best performing district
(number 1). For example, Georgetown County School District and Darlington County School District ranked 46th and 80th,
respectively. The districts are about the same size and have similar diversity
indexes. See Table 2.2.1 and Figure 3.4.1.
4.4 EOCEP: Rank Descends for Performance by School District—Algebra 1 and English 1
Figure 4.4.1 Descending rank indexes by school district based on performance—Algebra 1 and English 1.Source: South Carolina Department of Education
South Carolina (overall rank index)

© 2019 WCS, LLC
south Carolina PubliC sChool distriCts | Page 37
1234567891011
131415161718192021222324252627282930313233343536373839404142434445454647484950515253545556575859606162636465666768697071727374757677787980818283
0 10 20 30 40 50 60 70 80 90
York 04Abbeville 60
Spartanburg 01Dillon 03
Anderson 04Lexington/Richland 05
HorrySpartanburg 04Spartanburg 05
Anderson 03Anderson 01
BeaufortLexington 01
Spartanburg 02Charleston
Richland 02Bamberg 01
Dorchester 02Greenville
Spartanburg 06York 02
Florence 05Anderson 05
South CarolinaLancaster
York 03BerkeleyDillon 04
Greenwood 52Pickens
SC Public Charter…Oconee
Greenwood 50Newberry
Spartanburg 07Edgefield
AikenClarendon 03
Florence 01Chesterfield
Dorchester 04Kershaw
Lexington 03Cherokee
SaludaYork 01
MarlboroGeorgetownRichland 01Florence 02Laurens 55
Barnwell 19Laurens 56
CalhounHampton 02Barnwell 29
UnionOrangeburg 04
Marion 10Anderson 02
SumterBarnwell 45
Hampton 01Bamberg 02
Greenwood 51Orangeburg 03
ChesterFairfield
Florence 03Orangeburg 05
Clarendon 01Allendale
DarlingtonMcCormickFlorence 04
LeeLexington 04Lexington 02
Spartanburg 03Jasper
ColletonClarendon 02Williamsburg
4.5 EOCEP: Rank Descends for Performance by School District—Algebra 1
Figure 4.5.1 Descending rank indexes for performance by school district—Algebra 1.Source: South Carolina Department of Education
Figure 4.5.1
depicts the ranking distribution of school districts’ performance for Algebra 1. The
rankings are based on the percentage performance of districts where all test
takers have the chance to earn a grade of C or higher (numerical grades 70–100). The
rank indexes descend from the best performing district (number 1). For example, Aiken
County School District and Beaufort County School District ranked 38th and
13th, respectively. The schools have similar sizes with enrollments between
20,000 and 25,000 students. See Table 2.2.1 and
Figure 3.5.1.
South Carolina (overall rank)
© 2019 WCS, LLC.
Page 38 | ComParative analysis of PerformanCe and enrollment Patterns
1234567891011
131415161718192021222324252627282930313233343536373839404142434445454647484950515253545556575859606162636465666768697071727374757677787980818283
0 10 20 30 40 50 60 70 80 90
York 04Lexington/Richland 05
Spartanburg 01Anderson 04Anderson 01Florence 05
Dorchester 02Abbeville 60Lexington 01
Spartanburg 04Greenville
Spartanburg 02Horry
BeaufortSC Public Charter School District
Spartanburg 05Pickens
Dillon 03Spartanburg 06
York 03Richland 02Charleston
South CarolinaBerkeley
Hampton 02Cherokee
Greenwood 52KershawOconee
Florence 01Richland 01
Anderson 02Lancaster
Laurens 56Spartanburg 07
Anderson 05Chester
Dorchester 04Bamberg 02
NewberryYork 02
Anderson 03Laurens 55
AikenClarendon 03GeorgetownChesterfield
Clarendon 01Marlboro
CalhounGreenwood 50
York 01Orangeburg 04Greenwood 51
Bamberg 01Florence 02
SaludaSumter
Lexington 03Hampton 01McCormick
Dillon 04Spartanburg 03
FairfieldBarnwell 29
EdgefieldMarion 10
Lexington 04Lexington 02
UnionOrangeburg 05
Barnwell 45Clarendon 02
JasperFlorence 03
AllendaleOrangeburg 03
ColletonWilliamsburg
LeeBarnwell 19
DarlingtonFlorence 04
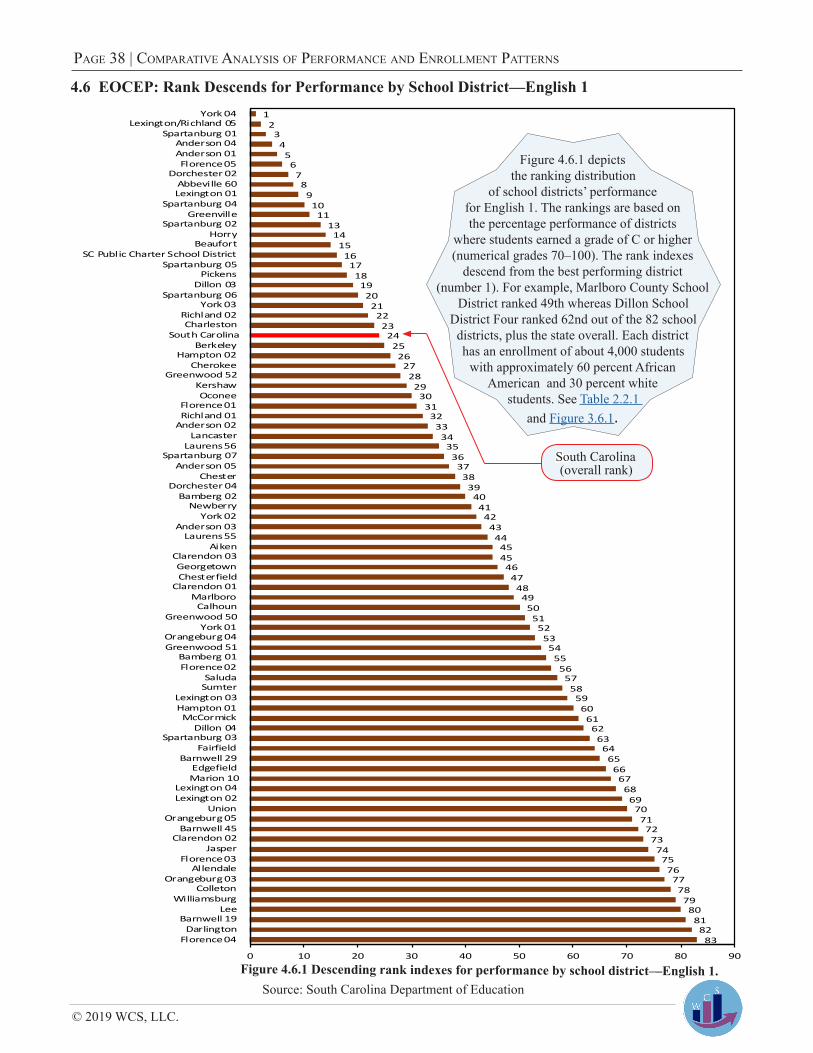
4.6 EOCEP: Rank Descends for Performance by School District—English 1
Figure 4.6.1 Descending rank indexes for performance by school district—English 1.Source: South Carolina Department of Education
Figure 4.6.1 depicts
the ranking distribution of school districts’ performance
for English 1. The rankings are based on the percentage performance of districts
where students earned a grade of C or higher (numerical grades 70–100). The rank indexes
descend from the best performing district (number 1). For example, Marlboro County School
District ranked 49th whereas Dillon School District Four ranked 62nd out of the 82 school
districts, plus the state overall. Each district has an enrollment of about 4,000 students
with approximately 60 percent African American and 30 percent white
students. See Table 2.2.1 and Figure 3.6.1.
South Carolina (overall rank)
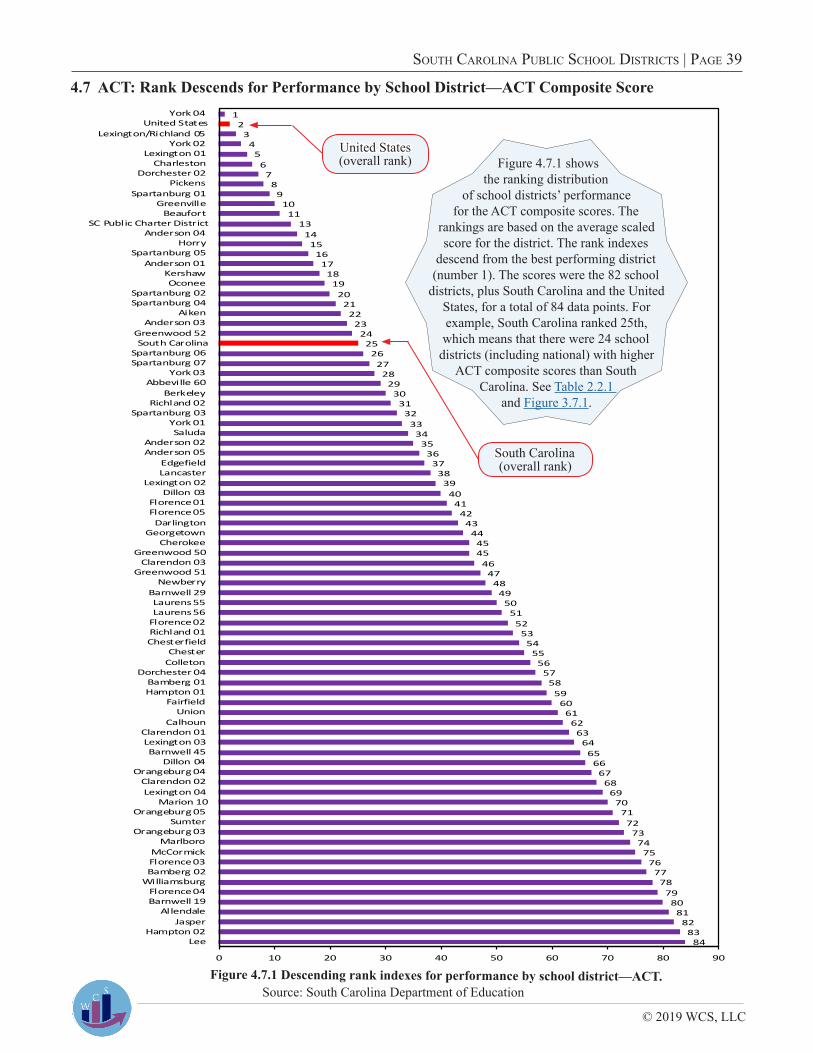
© 2019 WCS, LLC
south Carolina PubliC sChool distriCts | Page 39
1234567891011
13141516171819202122232425262728293031323334353637383940414243444545464748495051525354555657585960616263646566676869707172737475767778798081828384
0 10 20 30 40 50 60 70 80 90
York 04United States
Lexington/Richland 05York 02
Lexington 01Charleston
Dorchester 02Pickens
Spartanburg 01Greenville
BeaufortSC Public Charter District
Anderson 04Horry
Spartanburg 05Anderson 01
KershawOconee
Spartanburg 02Spartanburg 04
AikenAnderson 03
Greenwood 52South Carolina
Spartanburg 06Spartanburg 07
York 03Abbeville 60
BerkeleyRichland 02
Spartanburg 03York 01Saluda
Anderson 02Anderson 05
EdgefieldLancaster
Lexington 02Dillon 03
Florence 01Florence 05Darlington
GeorgetownCherokee
Greenwood 50Clarendon 03
Greenwood 51Newberry
Barnwell 29Laurens 55Laurens 56
Florence 02Richland 01Chesterfield
ChesterColleton
Dorchester 04Bamberg 01Hampton 01
FairfieldUnion
CalhounClarendon 01Lexington 03Barnwell 45
Dillon 04Orangeburg 04
Clarendon 02Lexington 04
Marion 10Orangeburg 05
SumterOrangeburg 03
MarlboroMcCormickFlorence 03Bamberg 02
WilliamsburgFlorence 04Barnwell 19
AllendaleJasper
Hampton 02Lee
4.7 ACT: Rank Descends for Performance by School District—ACT Composite Score
Source: South Carolina Department of Education
Figure 4.7.1 shows the ranking distribution
of school districts’ performance for the ACT composite scores. The
rankings are based on the average scaled score for the district. The rank indexes
descend from the best performing district (number 1). The scores were the 82 school
districts, plus South Carolina and the United States, for a total of 84 data points. For example, South Carolina ranked 25th, which means that there were 24 school
districts (including national) with higher ACT composite scores than South
Carolina. See Table 2.2.1 and Figure 3.7.1.
South Carolina (overall rank)
United States(overall rank)
Figure 4.7.1 Descending rank indexes for performance by school district—ACT.
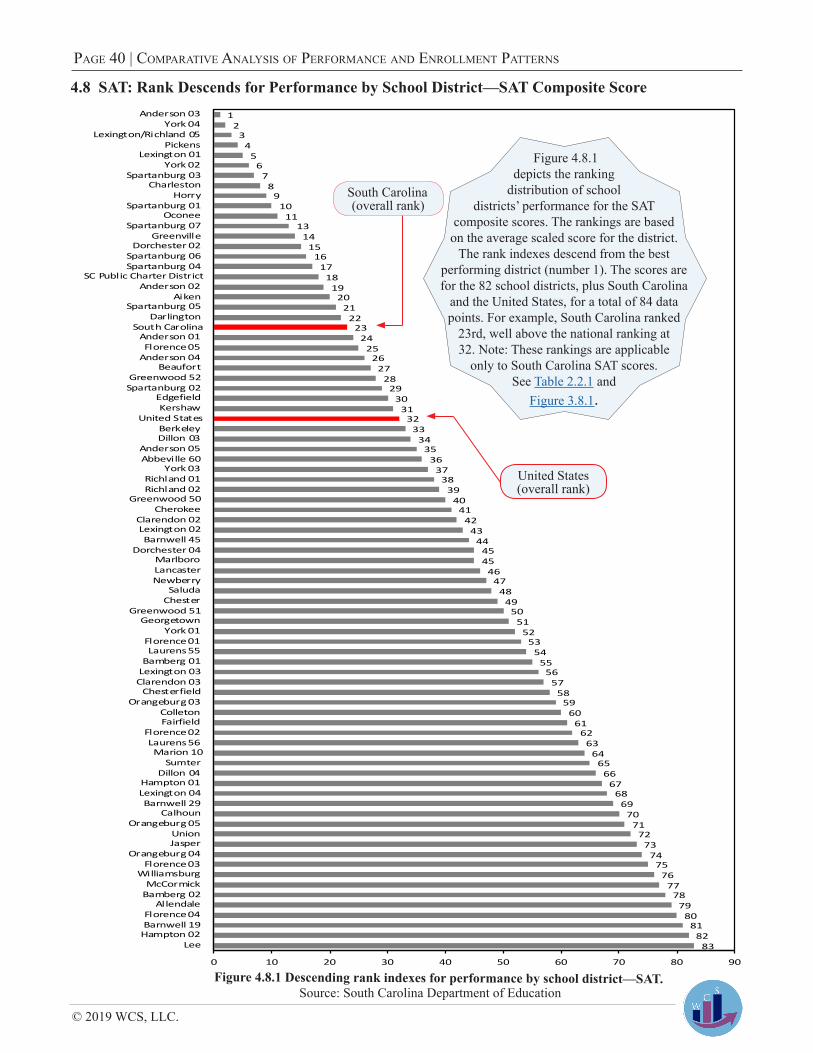
© 2019 WCS, LLC.
Page 40 | ComParative analysis of PerformanCe and enrollment Patterns
12
34
56
78
910
1113
1415
1617
1819
2021
2223
2425
2627
2829
3031
3233
3435
3637
3839
4041
4243
444545
4647
4849
5051
5253
5455
5657
5859
6061
6263
6465
6667
6869
7071
7273
7475
7677
7879
8081
8283
0 10 20 30 40 50 60 70 80 90
Anderson 03York 04
Lexington/Richland 05Pickens
Lexington 01York 02
Spartanburg 03Charleston
HorrySpartanburg 01
OconeeSpartanburg 07
GreenvilleDorchester 02
Spartanburg 06Spartanburg 04
SC Public Charter DistrictAnderson 02
AikenSpartanburg 05
DarlingtonSouth Carolina
Anderson 01Florence 05
Anderson 04Beaufort
Greenwood 52Spartanburg 02
EdgefieldKershaw
United StatesBerkeleyDillon 03
Anderson 05Abbeville 60
York 03Richland 01Richland 02
Greenwood 50Cherokee
Clarendon 02Lexington 02Barnwell 45
Dorchester 04MarlboroLancasterNewberry
SaludaChester
Greenwood 51Georgetown
York 01Florence 01Laurens 55
Bamberg 01Lexington 03Clarendon 03
ChesterfieldOrangeburg 03
ColletonFairfield
Florence 02Laurens 56Marion 10
SumterDillon 04
Hampton 01Lexington 04Barnwell 29
CalhounOrangeburg 05
UnionJasper
Orangeburg 04Florence 03
WilliamsburgMcCormick
Bamberg 02Allendale
Florence 04Barnwell 19
Hampton 02Lee
4.8 SAT: Rank Descends for Performance by School District—SAT Composite Score
Figure 4.8.1 Descending rank indexes for performance by school district—SAT.Source: South Carolina Department of Education
Figure 4.8.1 depicts the ranking
distribution of school districts’ performance for the SAT
composite scores. The rankings are based on the average scaled score for the district.
The rank indexes descend from the best performing district (number 1). The scores are for the 82 school districts, plus South Carolina
and the United States, for a total of 84 data points. For example, South Carolina ranked
23rd, well above the national ranking at 32. Note: These rankings are applicable
only to South Carolina SAT scores. See Table 2.2.1 and
Figure 3.8.1.
United States(overall rank)
South Carolina(overall rank)
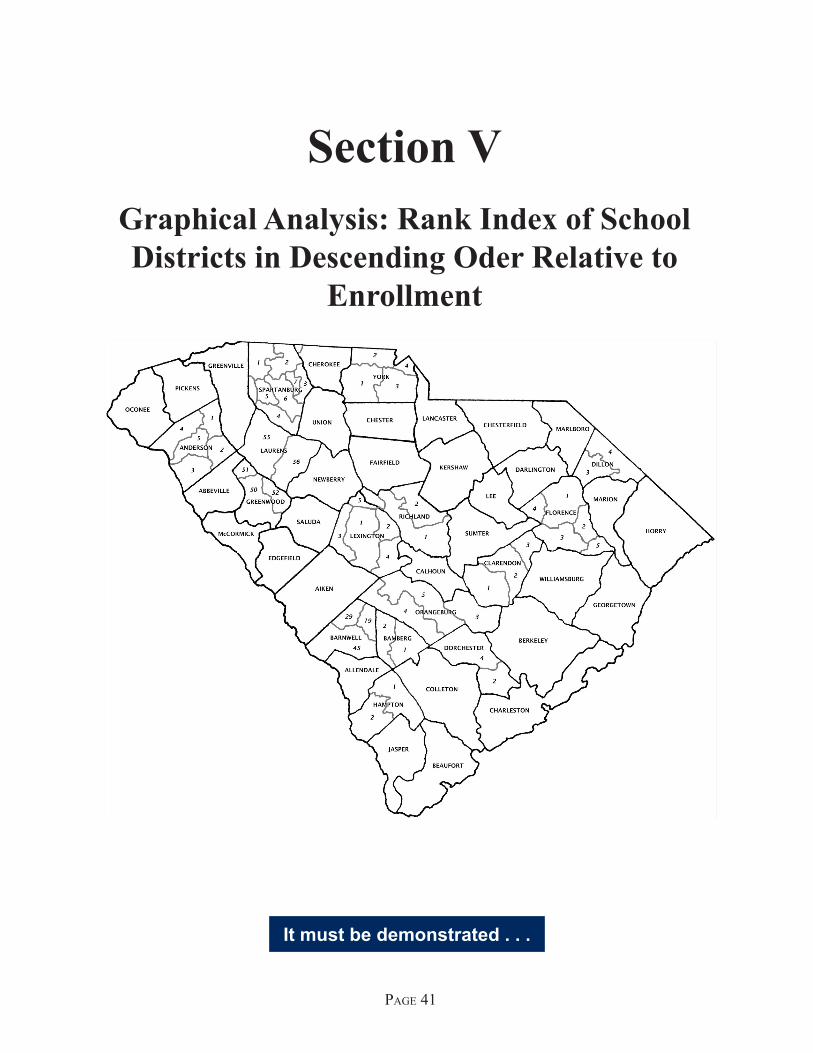
Page 41
It must be demonstrated . . .
Section VGraphical Analysis: Rank Index of School Districts in Descending Oder Relative to
Enrollment
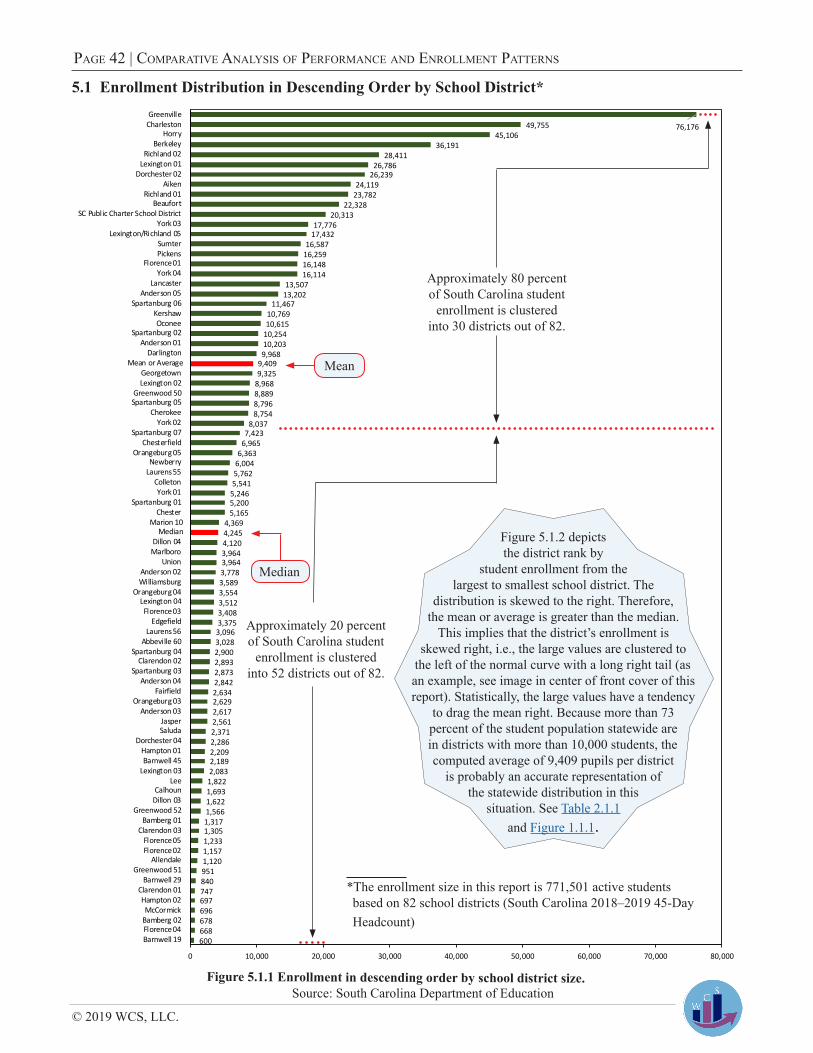
© 2019 WCS, LLC.
Page 42 | ComParative analysis of PerformanCe and enrollment Patterns
5.1 Enrollment Distribution in Descending Order by School District*
76,17649,75545,106
36,19128,411
26,78626,239
24,11923,782
22,32820,313
17,77617,432
16,58716,25916,14816,114
13,50713,202
11,46710,76910,615
10,25410,2039,968
9,4099,325
8,9688,8898,7968,754
8,0377,423
6,9656,363
6,0045,7625,541
5,2465,2005,165
4,3694,2454,1203,9643,9643,7783,5893,5543,5123,4083,3753,0963,0282,9002,8932,8732,8422,6342,6292,6172,5612,3712,2862,2092,1892,0831,8221,6931,6221,5661,3171,3051,2331,1571,120951840747697696678668600
0 10,000 20,000 30,000 40,000 50,000 60,000 70,000 80,000
GreenvilleCharleston
HorryBerkeley
Richland 02Lexington 01
Dorchester 02Aiken
Richland 01Beaufort
SC Public Charter School DistrictYork 03
Lexington/Richland 05SumterPickens
Florence 01York 04
LancasterAnderson 05
Spartanburg 06KershawOconee
Spartanburg 02Anderson 01
DarlingtonMean or Average
GeorgetownLexington 02
Greenwood 50Spartanburg 05
CherokeeYork 02
Spartanburg 07Chesterfield
Orangeburg 05Newberry
Laurens 55ColletonYork 01
Spartanburg 01Chester
Marion 10Median
Dillon 04Marlboro
UnionAnderson 02Williamsburg
Orangeburg 04Lexington 04Florence 03
EdgefieldLaurens 56
Abbeville 60Spartanburg 04
Clarendon 02Spartanburg 03
Anderson 04Fairfield
Orangeburg 03Anderson 03
JasperSaluda
Dorchester 04Hampton 01Barnwell 45
Lexington 03Lee
CalhounDillon 03
Greenwood 52Bamberg 01
Clarendon 03Florence 05Florence 02
AllendaleGreenwood 51
Barnwell 29Clarendon 01Hampton 02McCormick
Bamberg 02Florence 04Barnwell 19
Figure 5.1.2 depicts the district rank by
student enrollment from the largest to smallest school district. The
distribution is skewed to the right. Therefore, the mean or average is greater than the median.
This implies that the district’s enrollment is skewed right, i.e., the large values are clustered to
the left of the normal curve with a long right tail (as an example, see image in center of front cover of this report). Statistically, the large values have a tendency
to drag the mean right. Because more than 73 percent of the student population statewide are in districts with more than 10,000 students, the computed average of 9,409 pupils per district
is probably an accurate representation of the statewide distribution in this
situation. See Table 2.1.1 and Figure 1.1.1.
Approximately 80 percent of South Carolina student
enrollment is clustered into 30 districts out of 82.
Approximately 20 percent of South Carolina student
enrollment is clustered into 52 districts out of 82.
Figure 5.1.1 Enrollment in descending order by school district size.Source: South Carolina Department of Education
Median
Mean
*The enrollment size in this report is 771,501 active students based on 82 school districts (South Carolina 2018–2019 45-Day Headcount)
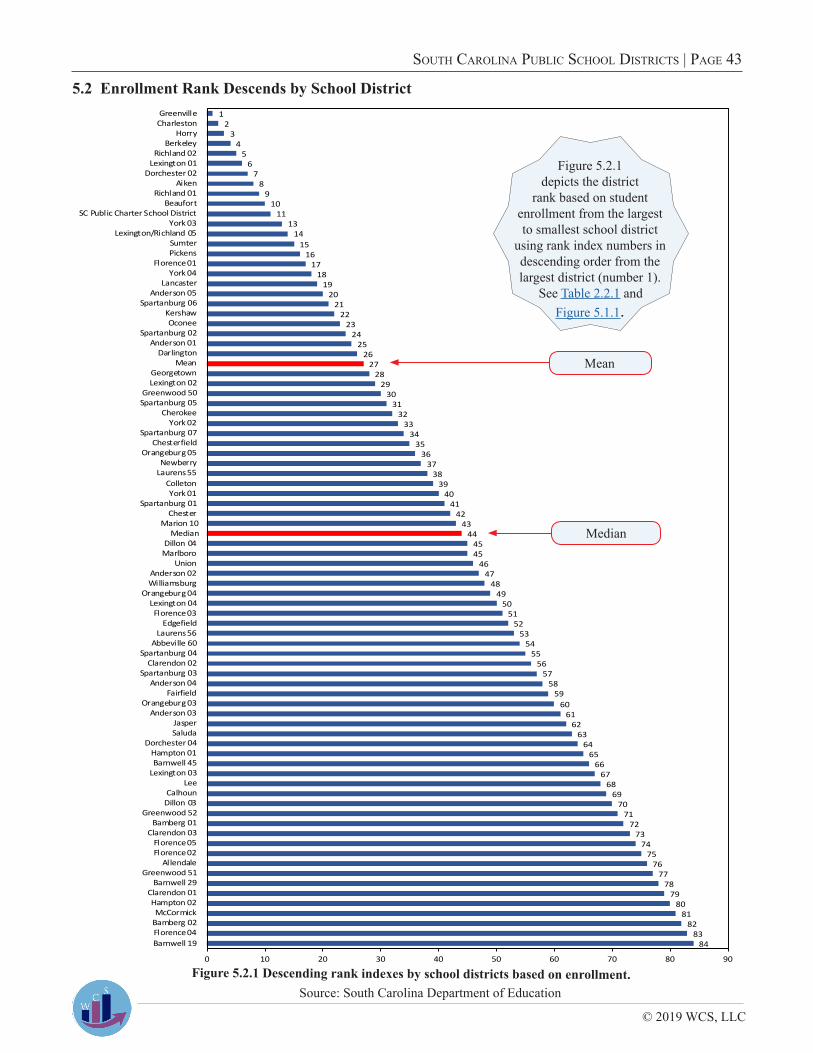
© 2019 WCS, LLC
south Carolina PubliC sChool distriCts | Page 43
5.2 Enrollment Rank Descends by School District
Figure 5.2.1 Descending rank indexes by school districts based on enrollment.Source: South Carolina Department of Education
12
34
56
78
910
1113
1415
1617
1819
2021
2223
2425
2627
2829
3031
3233
3435
3637
3839
4041
4243
444545
4647
4849
5051
5253
5455
5657
5859
6061
6263
6465
6667
6869
7071
7273
7475
7677
7879
8081
8283
84
0 10 20 30 40 50 60 70 80 90
GreenvilleCharleston
HorryBerkeley
Richland 02Lexington 01
Dorchester 02Aiken
Richland 01Beaufort
SC Public Charter School DistrictYork 03
Lexington/Richland 05SumterPickens
Florence 01York 04
LancasterAnderson 05
Spartanburg 06KershawOconee
Spartanburg 02Anderson 01
DarlingtonMean
GeorgetownLexington 02
Greenwood 50Spartanburg 05
CherokeeYork 02
Spartanburg 07Chesterfield
Orangeburg 05Newberry
Laurens 55ColletonYork 01
Spartanburg 01Chester
Marion 10Median
Dillon 04Marlboro
UnionAnderson 02Williamsburg
Orangeburg 04Lexington 04Florence 03
EdgefieldLaurens 56
Abbeville 60Spartanburg 04
Clarendon 02Spartanburg 03
Anderson 04Fairfield
Orangeburg 03Anderson 03
JasperSaluda
Dorchester 04Hampton 01Barnwell 45
Lexington 03Lee
CalhounDillon 03
Greenwood 52Bamberg 01
Clarendon 03Florence 05Florence 02
AllendaleGreenwood 51
Barnwell 29Clarendon 01Hampton 02McCormick
Bamberg 02Florence 04Barnwell 19
Figure 5.2.1
depicts the district rank based on student
enrollment from the largest to smallest school district
using rank index numbers in descending order from the largest district (number 1).
See Table 2.2.1 and Figure 5.1.1.
Median
Mean
Page 44
It must be demonstrated . . .
Section VIPerformance and Enrollment
Statistics Relative to Race/Ethnicity on Academic Outcomes
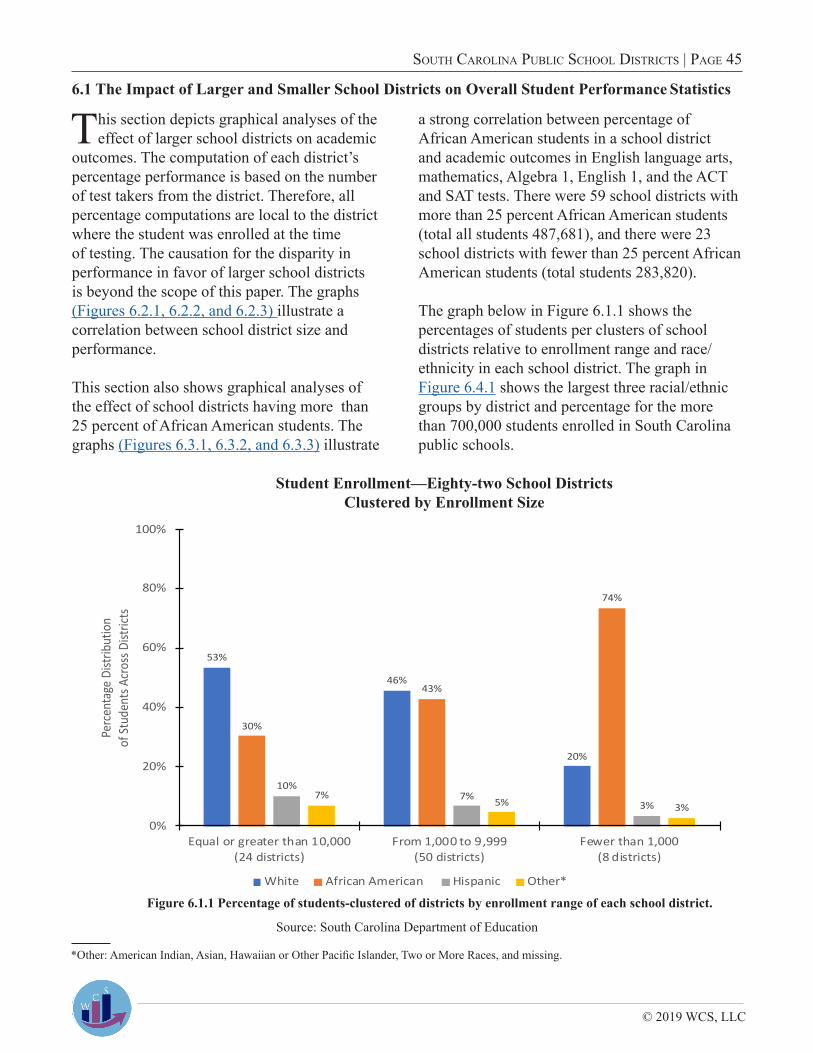
© 2019 WCS, LLC
south Carolina PubliC sChool distriCts | Page 45
This section depicts graphical analyses of the effect of larger school districts on academic
outcomes. The computation of each district’s percentage performance is based on the number of test takers from the district. Therefore, all percentage computations are local to the district where the student was enrolled at the time of testing. The causation for the disparity in performance in favor of larger school districts is beyond the scope of this paper. The graphs (Figures 6.2.1, 6.2.2, and 6.2.3) illustrate a correlation between school district size and performance.
This section also shows graphical analyses of the effect of school districts having more than 25 percent of African American students. The graphs (Figures 6.3.1, 6.3.2, and 6.3.3) illustrate
a strong correlation between percentage of African American students in a school district and academic outcomes in English language arts, mathematics, Algebra 1, English 1, and the ACT and SAT tests. There were 59 school districts with more than 25 percent African American students (total all students 487,681), and there were 23 school districts with fewer than 25 percent African American students (total students 283,820).
The graph below in Figure 6.1.1 shows the percentages of students per clusters of school districts relative to enrollment range and race/ethnicity in each school district. The graph in Figure 6.4.1 shows the largest three racial/ethnic groups by district and percentage for the more than 700,000 students enrolled in South Carolina public schools.
6.1 The Impact of Larger and Smaller School Districts on Overall Student Performance Statistics
Figure 6.1.1 Percentage of students-clustered of districts by enrollment range of each school district.
Student Enrollment—Eighty-two School Districts Clustered by Enrollment Size
Source: South Carolina Department of Education
*Other: American Indian, Asian, Hawaiian or Other Pacific Islander, Two or More Races, and missing.
53%
46%
20%
30%
43%
74%
10%7%
3%7%
5% 3%
0%
20%
40%
60%
80%
100%
Equal or greater than 10,000(24 districts)
From 1,000 to 9,999(50 districts)
Fewer than 1,000(8 districts)
Perc
enta
ge D
istrib
utio
n of
Stud
ents
Acr
oss D
istric
ts
White African American Hispanic Other*

© 2019 WCS, LLC.
Page 46 | ComParative analysis of PerformanCe and enrollment Patterns
6.2 Graphical Analysis: Enrollment Size of District Relative to PerformanceSCREADY—English Language Arts and
Mathematics Performance versus District Size
EOCEP: Algebra 1 and English 1 Performance versus District Size
Figure 6.2.1 ELA and math performance versus size.
Figure 6.2.2 Algebra 1 and English 1 performance versus size.
Figure 6.2.3 ACT and SAT composite performance versus size.
ACT and SAT: Performance versus District Size
Figure 6.2.1 depicts the percentage distribution of students’ performance
in English language arts and mathematics relative to the size of school district. Students attending large school districts outperformed those attending small districts by 30 percent. The difference increased to 60 percent between students in districts of 10,000 or more and those in districts with fewer than 1,000 students.
Figure 6.2.2 shows the percentage distribution of students’ performance
in Algebra 1 and English 1 relative to the size of school district. Students attending large districts outperformed those attending small districts by 32 percent. The difference increased to 51 percent between students in districts of 10,000 or more and those in districts with fewer than 1,000 students.
Figure 6.2.3 displays the percentage distribution of students’ performance
on the ACT and SAT tests relative to the size of school district. Students attending large districts and small districts of fewer than 1,000 students were at the 39th and 20th percentiles, respectively. For the SAT, students from large districts performed at the 58th percentile compared to students from small districts (fewer than 1,000 students) who performed at the 16th percentile.
Source: South Carolina Department of Education
45% 44% 46%
33% 31%35%
24% 23% 25%
0%
20%
40%
60%
80%
100%
ELA and Math ELA Math
Perc
enta
ge M
et o
r Ex
ceed
ed E
xpec
tatio
ns
Equal or greater than 10,000 From 1,000 to 9,999 Fewer than 1,000
56%46%
65%
40%31%
49%
33%
22%
43%
0%
20%
40%
60%
80%
100%
Algebra 1 and English 1 Algebra 1 English 1
Perc
enta
ge
Grad
e of
“C” o
d Hi
gher
Equal or greater than 10,000 From 1,000 to 9,999 Fewer than 1,000
18.216.6 15.3
10661005
908
0
9
18
27
36
400
600
800
1000
1200
1400
1600
Equal or greater than10,000
From 1,000 to 9,999 Fewer than 1,000
ACT
Com
posi
te S
core
SAT
Com
posi
te S
core
ACT SAT
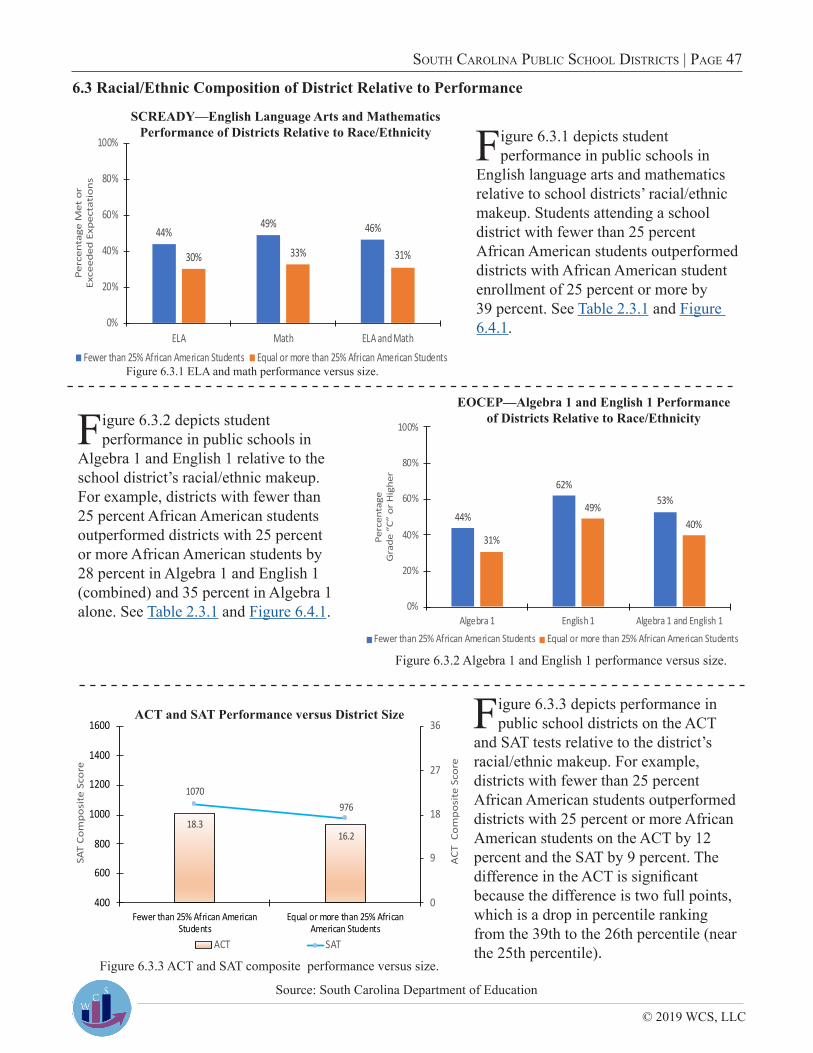
© 2019 WCS, LLC
south Carolina PubliC sChool distriCts | Page 47
6.3 Racial/Ethnic Composition of District Relative to Performance
Figure 6.3.1 ELA and math performance versus size.
Figure 6.3.2 Algebra 1 and English 1 performance versus size.
Figure 6.3.3 ACT and SAT composite performance versus size.
ACT and SAT Performance versus District Size
Figure 6.3.1 depicts student performance in public schools in
English language arts and mathematics relative to school districts’ racial/ethnic makeup. Students attending a school district with fewer than 25 percent African American students outperformed districts with African American student enrollment of 25 percent or more by 39 percent. See Table 2.3.1 and Figure 6.4.1.
Figure 6.3.2 depicts student performance in public schools in
Algebra 1 and English 1 relative to the school district’s racial/ethnic makeup. For example, districts with fewer than 25 percent African American students outperformed districts with 25 percent or more African American students by 28 percent in Algebra 1 and English 1 (combined) and 35 percent in Algebra 1 alone. See Table 2.3.1 and Figure 6.4.1.
Figure 6.3.3 depicts performance in public school districts on the ACT
and SAT tests relative to the district’s racial/ethnic makeup. For example, districts with fewer than 25 percent African American students outperformed districts with 25 percent or more African American students on the ACT by 12 percent and the SAT by 9 percent. The difference in the ACT is significant because the difference is two full points, which is a drop in percentile ranking from the 39th to the 26th percentile (near the 25th percentile).
SCREADY—English Language Arts and Mathematics Performance of Districts Relative to Race/Ethnicity
EOCEP—Algebra 1 and English 1 Performance of Districts Relative to Race/Ethnicity
Source: South Carolina Department of Education
44%49% 46%
30% 33% 31%
0%
20%
40%
60%
80%
100%
ELA Math ELA and Math
Per
cen
tage
Met
or
Exce
eded
Exp
ecta
tio
ns
Fewer than 25% African American Students Equal or more than 25% African American Students
44%
62%53%
31%
49%40%
0%
20%
40%
60%
80%
100%
Algebra 1 English 1 Algebra 1 and English 1
Perc
enta
geG
rade
“C”
or
Hig
her
Fewer than 25% African American Students Equal or more than 25% African American Students
18.316.2
1070976
0
9
18
27
36
400
600
800
1000
1200
1400
1600
Fewer than 25% African AmericanStudents
Equal or more than 25% AfricanAmerican Students
ACT
Com
posi
te S
core
SAT
Com
posi
te S
core
ACT SAT
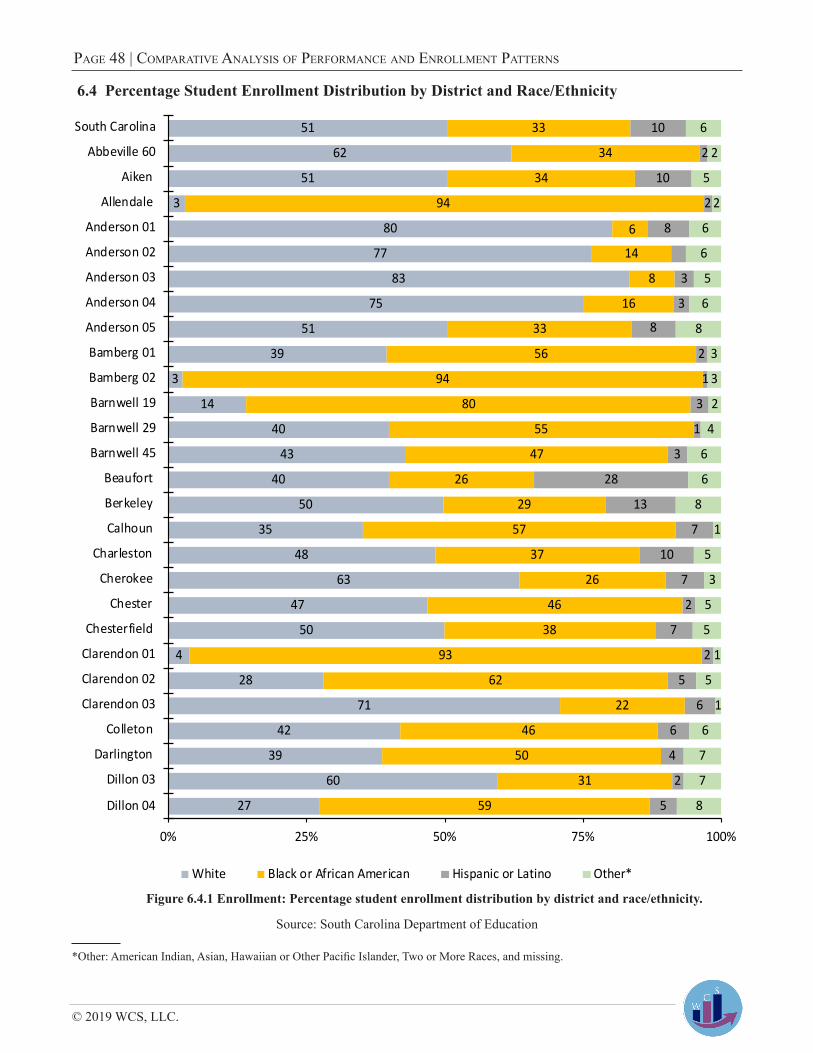
© 2019 WCS, LLC.
Page 48 | ComParative analysis of PerformanCe and enrollment Patterns
6.4 Percentage Student Enrollment Distribution by District and Race/Ethnicity
Figure 6.4.1 Enrollment: Percentage student enrollment distribution by district and race/ethnicity.
Source: South Carolina Department of Education
51
62
51
3
80
77
83
75
51
39
3
14
40
43
40
50
35
48
63
47
50
4
28
71
42
39
60
27
33
34
34
94
6
14
8
16
33
56
94
80
55
47
26
29
57
37
26
46
38
93
62
22
46
50
31
59
10
2
10
2
8
3
3
8
2
1
3
1
3
28
13
7
10
7
2
7
2
5
6
6
4
2
5
6
2
5
2
6
6
5
6
8
3
3
2
4
6
6
8
1
5
3
5
5
1
5
1
6
7
7
8
0% 25% 50% 75% 100%
South Carolina
Abbeville 60
Aiken
Allendale
Anderson 01
Anderson 02
Anderson 03
Anderson 04
Anderson 05
Bamberg 01
Bamberg 02
Barnwell 19
Barnwell 29
Barnwell 45
Beaufort
Berkeley
Calhoun
Charleston
Cherokee
Chester
Chesterfield
Clarendon 01
Clarendon 02
Clarendon 03
Colleton
Darlington
Dillon 03
Dillon 04
White Black or African American Hispanic or Latino Other*
*Other: American Indian, Asian, Hawaiian or Other Pacific Islander, Two or More Races, and missing.
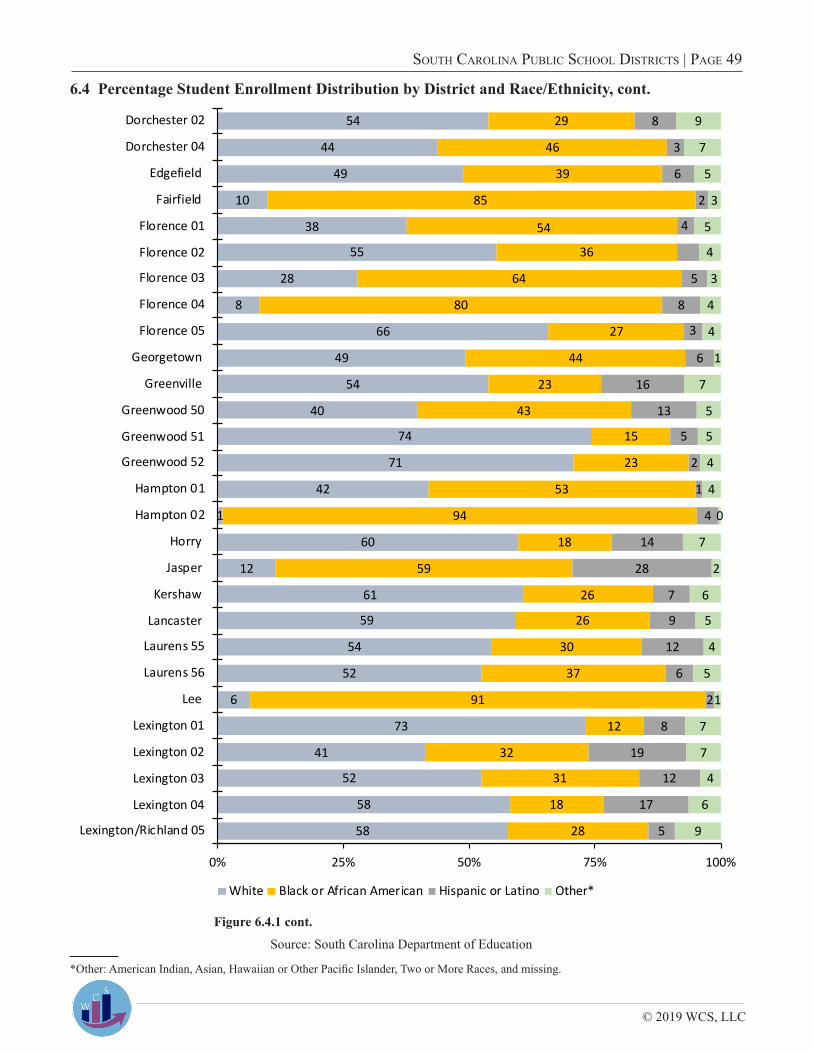
© 2019 WCS, LLC
south Carolina PubliC sChool distriCts | Page 49
6.4 Percentage Student Enrollment Distribution by District and Race/Ethnicity, cont.
Figure 6.4.1 cont.
Source: South Carolina Department of Education
54
44
49
10
38
55
28
8
66
49
54
40
74
71
42
1
60
12
61
59
54
52
6
73
41
52
58
58
29
46
39
85
54
36
64
80
27
44
23
43
15
23
53
94
18
59
26
26
30
37
91
12
32
31
18
28
8
3
6
2
4
5
8
3
6
16
13
5
2
1
4
14
28
7
9
12
6
2
8
19
12
17
5
9
7
5
3
5
4
3
4
4
1
7
5
5
4
4
0
7
2
6
5
4
5
1
7
7
4
6
9
0% 25% 50% 75% 100%
Dorchester 02
Dorchester 04
Edgefield
Fairfield
Florence 01
Florence 02
Florence 03
Florence 04
Florence 05
Georgetown
Greenville
Greenwood 50
Greenwood 51
Greenwood 52
Hampton 01
Hampton 02
Horry
Jasper
Kershaw
Lancaster
Laurens 55
Laurens 56
Lee
Lexington 01
Lexington 02
Lexington 03
Lexington 04
Lexington/Richland 05
White Black or African American Hispanic or Latino Other*
*Other: American Indian, Asian, Hawaiian or Other Pacific Islander, Two or More Races, and missing.
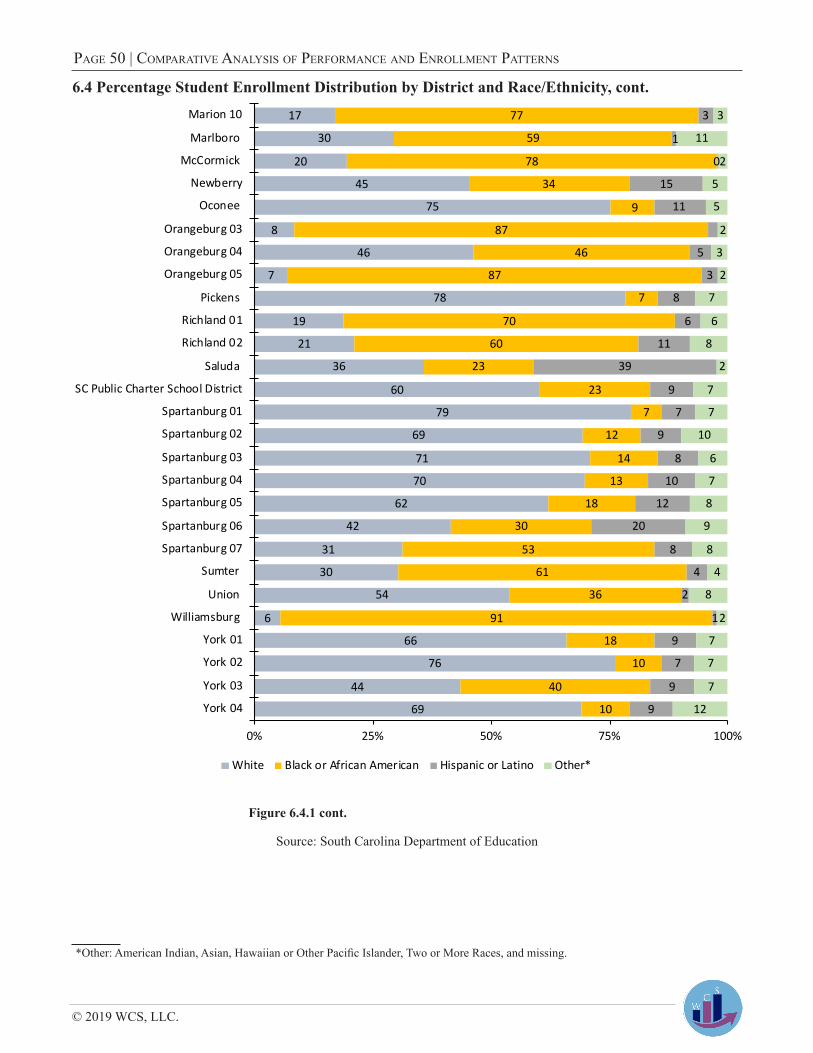
© 2019 WCS, LLC.
Page 50 | ComParative analysis of PerformanCe and enrollment Patterns
6.4 Percentage Student Enrollment Distribution by District and Race/Ethnicity, cont.
Figure 6.4.1 cont.
Source: South Carolina Department of Education
17
30
20
45
75
8
46
7
78
19
21
36
60
79
69
71
70
62
42
31
30
54
6
66
76
44
69
77
59
78
34
9
87
46
87
7
70
60
23
23
7
12
14
13
18
30
53
61
36
91
18
10
40
10
3
1
0
15
11
5
3
8
6
11
39
9
7
9
8
10
12
20
8
4
2
1
9
7
9
9
3
11
2
5
5
2
3
2
7
6
8
2
7
7
10
6
7
8
9
8
4
8
2
7
7
7
12
0% 25% 50% 75% 100%
Marion 10
Marlboro
McCormick
Newberry
Oconee
Orangeburg 03
Orangeburg 04
Orangeburg 05
Pickens
Richland 01
Richland 02
Saluda
SC Public Charter School District
Spartanburg 01
Spartanburg 02
Spartanburg 03
Spartanburg 04
Spartanburg 05
Spartanburg 06
Spartanburg 07
Sumter
Union
Williamsburg
York 01
York 02
York 03
York 04
White Black or African American Hispanic or Latino Other*
*Other: American Indian, Asian, Hawaiian or Other Pacific Islander, Two or More Races, and missing.

Page 51
It must be demonstrated . . .
Section VIIReport Summary
© 2019 WCS, LLC.
Page 52 | ComParative analysis of PerformanCe and enrollment Patterns
This report analyzed and compared the student benchmark assessments for each public
school district in South Carolina. To that end, this report included student performance scores for every school district in South Carolina. Aside from overall performance, this report included academic outcomes for selected fundamental subject areas and comparative analysis across eighty-two public school districts.
Although the report showed that these test results are a comparative analysis of the 2018 test performance and some districts may have seen an increase or decrease in performance from year to year, the overall differences in most situations were within the margin of error. Therefore, the performance and pattern shown among school districts were statistically consistent year after year.
For example, York School District Four outperformed South Carolina in English language arts and mathematics by 47 percent and the lowest-performing school district in these subjects by 140 percent. The following are some examples of large variations within the same county in English language arts and mathematics: (1) York School District Four outperformed York School District Three by 53 percent, and (2) Florence School District Five outperformed Florence School District Four by 91 percent. Economics is most likely a factor; however, the differences might suggest other significant underlying causes, such as a lack of parental involvement, behavioral or apathy for these disparities.
There is a lot of discussion for and against too much technology in the classrooms; however, school boards and administrators should be mindful of the fact that technology is only a productivity tool used to help educate children, and it is not a substitute for human cognition and maturity. All of the efforts to put more technology in front of children to improve their learning
does not conform with the results in this paper. It seems that improvement in productivity is being conflated with improvement in learning.
The two most notable statistics from this report involve school districts whose enrollment consists of more than 25 percent of African American students and small school districts that are underperforming compared to other school districts. To that end, closing the academic achievement gap of African American students is paramount to moving South Carolina from the bottom tier of states with the nation’s lowest academic outcomes in public school. The second item is to determine why small school districts are underperforming compared to large school districts. Addressing these issues with an open and honest discussion should be of the highest priority.
In closing, let me ask this question: Will South Carolina forever remain in the bottom among a group of a six states relative to public education outcomes? The most challenging question is “What should be done to improve the situation?” Obviously, past efforts have failed catastrophically. Although race and economics are often discussed and mentioned in this letter, the question remains: Are they the only cause of the dangerously low performance of students, especially African American students? Clearly, there is a need to focus more on other causes for low performance such as parental apathy, student study habits, student behavior, and the community. A lot of money and effort have been placed on what parents, some educators, and political leaders perceive to be the overwhelming causes of low performance, whereas not enough attention has been given to other causes. This change of focus can and will help improve the situation significantly. Because of the complexity associated with race and economics, it is difficult to dissect and separate the two. They are interwoven with many factors and underlying behaviors. ■
Summary
Page 53
South Carolina Department of EducationMean ACT Scores for 2018 Graduation Seniorshttps://ed.sc.gov/data/test-scores/national-assessments/act/
South Carolina Department of EducationMean SAT Scores for 2018 Graduation Seniorshttps://ed.sc.gov/data/test-scores/national-assessments/sat/
South Carolina Department of EducationSouth Carolina College- and Career-Ready Assessments (SCREADY) Test Scores, 2018.https://ed.sc.gov/data/test-scores/state-assessments/sc-ready/2018/
South Carolina Department of EducationSouth Carolina End-of-Course Examination Program (EOCEP)https://ed.sc.gov/data/test-scores/state-assessments/end-of-course-examination-program-eocep/ eocep-scores/?year=2018
South Carolina Department of Education2018-2019 5-Day Active Headcount (2018-19)https://ed.sc.gov/data/other/student-counts/active-student-headcounts/
Wilson, David C. 2016. Distributions of Administrators and Teachers Relative to Race/Ethnicity: United States, South Carolina, and Horry County Schools http://www.wilsonconsultingservices.net/wcs_teachers_16.pdfWilson, David C. 2011. Comparative Analysis of Race/Ethnicity Performance Patterns in South Carolina/Horry County Schools http://www.wilsonconsultingservices.net/hcspass_11.pdfWilson, David C. 2017 Improving Student Performance: Horry County Parents and the Church Community https://wilsonconsultingservices.net/wcshcs_ps17.pdfWilson, David C. 2017. A Statistical Analysis of Student Benchmarks https://www.wilsonconsultingservices.net/wcs-sc-hcs-benchmarks_17.pdfWilson, David C. 2018 Profile of the South Carolina Student: Horry and Georgetown Counties Public Schools—https://wilsonconsultingservices.net/wcs_profile_sc_18.pdfWilson, David C. 2018 An Analysis of the 2018 test Scores: South Carolina—Public Schools of Horry, Georgetown, Marion, and Dillon Counties https://www.wilsonconsultingservices.net/wcs_2018testscores_sc_18.pdf
References

Page 54
WILSON CONSULTING SERVICES, LLC is a limited liability company that provides consulting in measurement processes, statistical analyses, mathematics education, and family history research.
Our core values are integrity, quality, and customer satisfaction.
Our mission is to provide each client with the most effective and ethical service possible, and to preserve and promote evidence-based decision making for our clients.
An Analysis of the 2018 Test Scores: South Carolina—Public Schools of Horry, Georgetown, Marion, and Dillon Countieshttps://wilsonconsultingservices.net/wcs_2018testscores_sc_18.pdf
Profile of the South Carolina Student: Horry and Georgetown Counties Public Schoolshttps://wilsonconsultingservices.net/wcs_profile_sc_18.pdf
STEM Workers: Shortage or Skill Set Mismatch?https://wilsonconsultingservices.net/wcs_stem_17.pdf
A Statistical Analysis of Student Benchmarks 2016https://www.wilsonconsultingservices.net/wcs-sc-hcs-benchmarks_17.pdf
Improving Student Performance: Horry County Parents and the Church Communityhttps://wilsonconsultingservices.net/wcshcs_ps17.pdf
Poplar Training School (1940–1954): A High School for Black Students,Wampee, South Carolinahttps://www.wilsonconsultingservices.net/wcs_poplar_sch_17.pdf
A Statistical Analysis of Student Benchmarks 2016https://www.wilsonconsultingservices.net?wcs-sc-hcs-benchmarks_17.pdf
The Electoral College and Proportionalityhttps://www.wilsonconsultingservices.net/wcs_electoral_college_16.pdf
Distributions of Administrators and Teachers Relative to Race/Ethnicity: United States, South Carolina, and Horry County Schoolshttps://www.wilsonconsultingservices.net/wcs_teachers_16.pdf
Comparative Analysis of Race/Ethnicity Performance Patterns in South Carolina/Horry County Schoolshttps://www.wilsonconsultingservices.net/hcspass_11.pdf
Historical Facts: Poplar or Popular?https://www.wilsonconsultingservices.net/wcs_poplar_16.pdf
Learned Behaviors and Your Challenge: A Cause and Effect Analytical Approach to Improving Student Performancehttps://www.wilsonconsultingservices.net/Learned_Behaviors_wcs14.pdf
Normalizing Throughput Yieldhttps://www.wilsonconsultingservices.net/Normalizing_data.pdf
Application of the Weibull Model to Product Component Failurehttps://www.wilsonconsultingservices.net/wcs_diode.pdf
More papers by the author—click on the link below title to open or download
https//:www.wilsonconsultingservices.net
ABOUT WCS
David C. WilsonFounder / CEO

ISBN 9781943612048
Images of Publications—Click on image to open
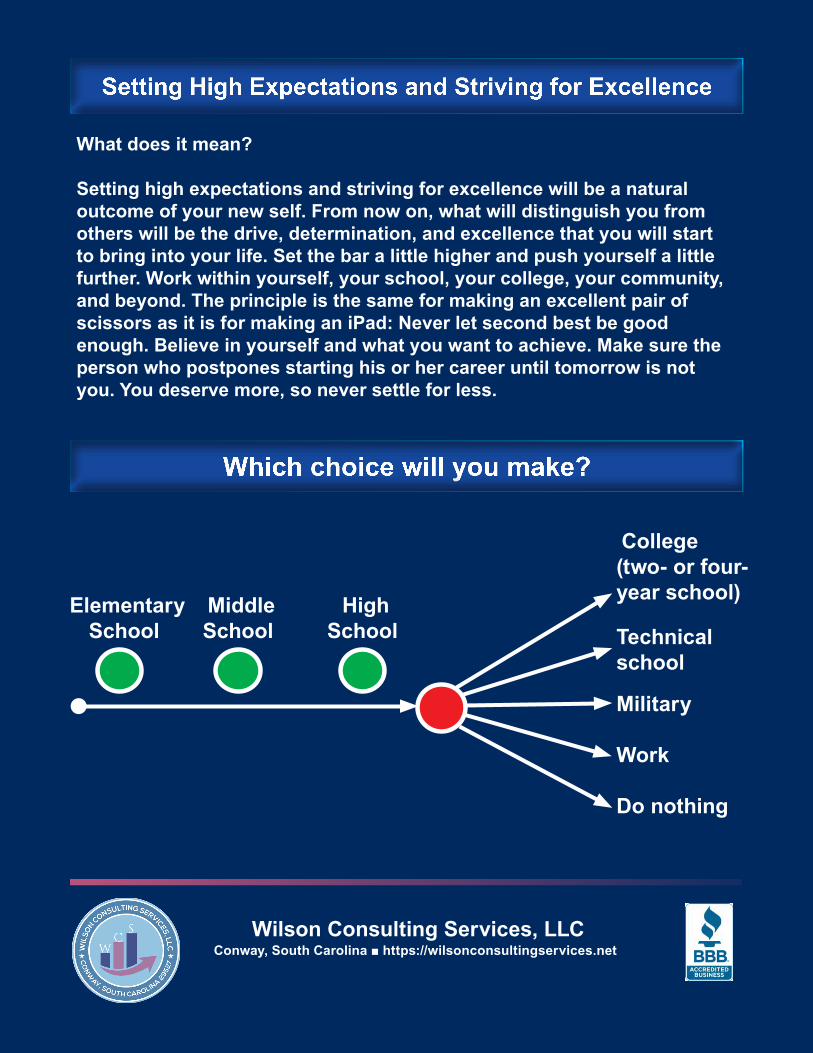
Wilson Consulting Services, LLCConway, South Carolina ■ https://wilsonconsultingservices.net
Elementary School
Middle School
High School
College (two- or four-year school)
Technical school
Military
Work
Do nothing
Setting High Expectations and Striving for Excellence
What does it mean?
Setting high expectations and striving for excellence will be a natural outcome of your new self. From now on, what will distinguish you from others will be the drive, determination, and excellence that you will start to bring into your life. Set the bar a little higher and push yourself a little further. Work within yourself, your school, your college, your community, and beyond. The principle is the same for making an excellent pair of scissors as it is for making an iPad: Never let second best be good enough. Believe in yourself and what you want to achieve. Make sure the person who postpones starting his or her career until tomorrow is not you. You deserve more, so never settle for less.
Which choice will you make?