Embed Size (px)
Citation preview

A report submitted to the School of Engineering and Energy,
Murdoch University in partial fulfilment of the requirements for
the degree of Bachelor of Engineering
Comparative Analysis and Energy Reduction Strategy for Nickel Mine Sites 2011
Jane Elizabeth Woodroof

I declare that this project is my own account of my research and contains as its main
content work, which has not previously been submitted for a degree at any tertiary
education institution.
…………………………………….
Jane Elizabeth Woodroof

We are satisfied with the progress of this internship project and that the attached report
is an accurate reflection of the work undertaken.
……………………………………. …………………………………….
Industry Supervisor: David Niven Academic Supervisor: Martin Anda

i
EXECUTIVE SUMMARY Energy is becoming an increasingly important issue and is receiving increased interest
due to the realization that the fossil fuel resources required for energy generation are
finite and that climate change is linked to carbon emissions (Baños, et.al 2010). The
Australian government has tried to address these issues by encouraging businesses to
reduce their energy usage and carbon emissions through participating in the Energy
Efficiencies Opportunities (EEO) program and by implementing financial incentives
such as the impending carbon tax.
The purpose of this project was to analyse the energy usage at Xstrata Nickel
Australasia’s (XNA’s) Cosmos and Sinclair Nickel operations then identify and evaluate
energy efficient opportunities, as required by the EEO program. In addition, GHGs
emitted by the sites were analysed to determine what would be required to move the
sites towards carbon neutrality.
Cosmos’ and Sinclair’s energy usage and carbon emissions were analysed using their
metering and data analysis information, which is summarized in the table below.
Cosmos Sinclair
Energy usage 964,338 GJ (0.96 PJ)
725,392 GJ (0.73 PJ) 238,945 GJ (0.24 PJ)
GHG emissions 60,665tCO2-e
44,058 tCO2-e 16,607 tCO2-e
Data Monitoring Power station report, fuel pricing spreadsheet, diesel EOM, gas trading invoice and energy mass balance (EMB)
Power station report, fuel pricing spreadsheet and diesel EOM
The potential opportunities for energy efficiency and carbon neutrality were identified
and analysed through a multi-criterion analysis (MCA) and marginal abatement cost
(MAC) curve. The outcomes of the MCA and MAC curve identified the top four
initiatives to be implemented at Cosmos and Sinclair and identified the opportunities to
be implemented for the recommended strategy. The top four initiatives and
recommended strategy and their energy savings, carbon abatement, net benefits and
payback periods are outlined in the following table.

ii

iii
A carbon neutrality strategy, outlined in the table below, was also developed, which
determined that the move towards carbon neutrality for Cosmos and Sinclair would not
be feasible based on high capital costs, the current life of the mine and long payback
periods.
Site Description Capex Payback period
Car
bon
Neu
tral
ity S
trat
egy
Cosmos Implementing energy efficiency opportunities first, then implementing renewable technologies (Solar PV – cheapest option)
$451 million 14 years
Cosmos Implementing energy efficiency opportunities first, then implementing offsetting opportunities (cheapest option)
$741,200
Sinclair Implementing energy efficiency opportunities first, then implementing renewable technologies (Solar PV – cheapest option)
$134 million 7 years
Sinclair Implementing energy efficiency opportunities first, then implementing offsetting opportunities (cheapest option)
$281,520 -
Since the EEO program is an ongoing process, Cosmos and Sinclair will need to
continue to assess their energy usage, to work towards improving their current data
analysis systems, to identify potential energy efficient opportunities and determine their
viability based on the energy savings and the net financial benefits and to report their
results from the EEO process annually.

iv
ACKNOWLEDGEMENTS
I would like to thank my academic supervisor, Martin Anda for his support, assistance
and for all of his suggestions he gave throughout my project. I also would like to thank
the support and assistance I received from Xstrata Nickel, in particular my industry
supervisor David Niven, the environmental teams at Cosmos and Sinclair and
numerous other employees who were willing to show me around and answer my
questions. The opportunity to gain hands on experience working on a mine site and
working with personnel and on the data rather than being external to the whole process
was invaluable. I am incredibly thankful to Mike and Marc from Energetics who gave
me the opportunity to work alongside them while they were on-site, to allow me to gain
insight to the EEO process and for giving me advice for my project. I would also like to
thank David Goodfield for his recommendations and assistance he gave throughout my
project as well as the companies who provided assistance on pricing and application of
technologies.

v
TABLE OF CONTENTS EXECUTIVE SUMMARY……………………………………………………………….
ACKNOWLEDGEMENTS………………………………………………………………
TABLE OF CONTENTS………………………………………………………………...
LIST OF FIGURES…………………………………………………………...…………
LIST OF TABLES……………………………………………….………………………
GLOSSARY OF ABBREVIATIONS AND TERMS..…………………………………
1.0 INTRODUCTION………………………………………………..………………
1.1 Project Background...……………………………………………….…
1.2 Company Background………………………………………………...
1.2.1 Cosmos Nickel Project………………...……………………...
1.2.2 Sinclair Nickel Project………………….……...………………
1.2.3 Business Strategy…………………...………………………...
1.3 Purpose & Objectives …………………………………………………
2.0 LITERATURE REVIEW………………………………………………………..
2.1 Energy Efficiency Opportunities……………………………………..
2.2 Case Studies………………………………….………………………..
2.2.1 Energy Efficiency………………………………….…………..
2.2.2 Renewable Energy……………………..……………………..
2.2.3 Carbon Neutrality……….……………………………………..
2.3 Site Information..…….………………………….………………………
2.3.1 Cosmos Nickel Project………………….…………………….
2.3.2 Sinclair Nickel Project………………….……………………..
3.0 METHODOLOGY……………………………………………………………….
3.1 Approach………………………………………………………………..
3.2 Scope……………………………………………………………………
3.3 Assumptions……………………………………………………………
3.4 Limitations………………………………………………………………
4.0 SITE ANALYSIS………………………………………………………………...
4.1 Energy Consumption Analysis………………………..………………
4.1.1 Cosmos Nickel Project………………..………………………
4.1.2 Sinclair Nickel Project…………………………………………
4.2 Metering and Data Analysis………………………..…………………
4.2.1 Cosmos Nickel Project………………………………………..
4.2.2 Sinclair Nickel Project…………………………………………
5.0 OPPORTUNITIES………………………………………………………………
5.1 Opportunity Analysis…………………………………………...……..
i
iv
v
vii
ix
x
1
1
2
2
3
4
5
7
7
8
8
9
10
10
10
11
12
12
13
13
13
14
14
15
23
31
33
33
34
34

vi
5.1.1 Multi-criterion Analysis…………………………………..……
5.1.2 Marginal Abatement Cost Curve..……………………………
5.2 Implementation of Opportunities...........…………………………….
5.2.1 Recommended Strategy……………………………………...
5.2.2 Carbon Neutrality Strategy....………………………………...
5.2.3 Metering and Data Collection Strategy.……………………..
6.0 EEO REPORTING……………………………………………………..............
7.0 CONCLUSION…………………………………………………………………..
8.0 RECOMMENDATIONS……………………………………………………...…
9.0 BIBLIOGRAPHY.………………………………………………………………..
10.0 APPENDICES…………………………………………………………………...
10.1 Energy Costs...........……………………………............…...............
10.2 Xstrata Sustainable Development (SD) Standards...........………..
10.3 Australia’s Energy Usage...........…………………………….……….
10.4 Additional Information...........…...........……………………………...
34
38
42
42
43
45
47
49
51
53
56
57
58
59
60

vii
LIST OF FIGURES
Figure 1: Location of the Cosmos and Sinclair Nickel Projects...………………….
Figure 2: SD Document Hierarchy from XNA SD Management System………….
Figure 3: Energy Usage for Cosmos Nickel Project for 2010/2011.……………….
Figure 4: Cosmos Electricity Consumption by Area for 2010/2011 Period….……
Figure 5: Cosmos Nickel Project Electricity Consumption by Area for 2010/2011
Period…..…………………………..…………………………..………………………….
Figure 6: Sankey Diagram for Cosmos Nickel Project for the 2010/2011 Period…
Figure 7: Cosmos Energy Consumed and Generated by the Power Station each
month for 2010/2011 Period…..……………………………………………..………….
Figure 8: Energy Consumed and Generated in each Genset of the Power Station
for a Typical Month (October 2010)…..………………………..……………………….
Figure 9: Sankey Diagram for Cosmos Power Station for the 2010/2011 Period...
Figure 10: Diesel Consumption by Equipment for Cosmos for the 2010/2011
Period…..………………………………………………………………..…………………
Figure 11: Diesel Consumption for Cosmos for the 2010/2011 Period…..………..
Figure 12: Estimates of Electricity Use for Mining Equipment…..………………….
Figure 13: Energy Usage for Sinclair Nickel Project for 2010/2011………………..
Figure 14: Sinclair Electricity Consumption by Area for 2010/2011 Period…..……
Figure 15: Sinclair Nickel Project Electricity Consumption by Area for 2010/2011
Period…..………………………………………………………………..………………...
Figure 16: Sankey Diagram for Sinclair Nickel Project for the 2010/2011 Period...
Figure 17: Sinclair Energy Consumed and Generated by the Power Station each
Month for 2010/2011 Period………………………..………………...…..………….....
Figure 18: Energy Consumed and Generated in each Genset of the Power
Station for a Typical Month (March 2010)………………………..………………........
Figure 19: Sankey Diagram for Sinclair Power Station for the 2010/2011 Period..
Figure 20: Diesel Consumption by Equipment for Sinclair for the 2010/2011
Period………………………..………………...………………………..……………….....
Figure 21: Diesel Consumption for Sinclair for the 2010/2011 Period……………..
Figure 22: Ranking of Energy Efficient Opportunities for Cosmos………………….
Figure 23: Ranking of Energy Efficient Opportunities for Sinclair…………………...
Figure 24: Ranking of Energy Source Opportunities…………………………………
Figure 25: Ranking of Offsetting Opportunities……………………………………….
Figure 26: Ranking of Metering and Data Collection Opportunities for Cosmos....
Figure 27: Ranking of Metering and Data Collection Opportunities for Sinclair…..
Figure 28: MAC Curve for Cosmos Opportunities…………………………………….
3
4
15
16
16
17
18
18
19
20
20
21
23
24
24
25
26
26
27
28
28
36
36
37
37
38
38
40

viii
Figure 29: MAC Curve for Sinclair Opportunities……………………………………..
Figure 30: MAC Curve for Recommended Cosmos Opportunities to be
Implemented............................................................................................................ Figure 31: MAC Curve for Recommended Sinclair Opportunities to be
Implemented............................................................................................................ Figure 32: Strategy for Carbon Neutrality................................................................ Figure 33: Variation in Unit Cost of Diesel over 2010/2011 period………....………
Figure 34: Variation in Unit Cost of Natural Gas over 2010/2011 period…………..
Figure 35: Variation in Unit Cost of Electricity (energy only) for Cosmos and
Sinclair over 2010/2011 period…………....……………....…………....………....…... Figure 36: Australia and OECD & World Averages per capita GHG emissions
(2005)…………….……………..…….……………..…….……………..….……………..
Figure 37: Emissions Attributable to Australian Industry by Sector……………......
Figure 38: Primary Energy Demand in WA by Sector……………..……………..….
41
42
43
44
57
57
57
59
59
59

ix
LIST OF TABLES Table 1: Assessment of Energy Usage for Cosmos and Sinclair for 2010/2011.......
Table 2: KPIs for Cosmos for the 2010/2011 Period including Targets for 2010
and 2011…………………………………………………………………………………....
Table 3: KPIs for Sinclair for the 2010/2011 Period including Targets for 2010 and
2011…………………………………………………………………………………...........
Table 4: Data Monitoring for Cosmos and Sinclair Nickel Projects..………………..
Table 5: XNA’s Weighting of Criteria…………………………………………………….
Table 6: XNA’s Public EEO Report..……………….…………..……….…………....... Table 7: XNA’s Government EEO Report..……………….…………....…………...... Table 8: Xstrata Sustainable Development Standards..……………….………….....
14
22
30
31
35
47
48
58

x
GLOSSARY OF ABBREVIATIONS AND TERMS
CO2 Carbon Dioxide
DRET Department of Resources, Energy and Tourism
EEO Energy Efficiency Opportunities
EMB Energy mass balance
EOM End of month
GHG Greenhouse gas
GJ Gigajoule
kL Kilo-litre
KPI Key Performance Indicator
kWh Kilo-watt hour
L Litre
MAC Marginal Abatement Cost
MCA Multi-criterion assessment PH Power house
PJ Petajoule
PV Photo-voltaic
SD Sustainable development
t Tonne
XNA Xstrata Nickel Australasia
XNAO Xstrata Nickel Australasia Operations
NOTE: The reporting periods mentioned in the report (i.e. 2010/2011) are from
the 1st July until 30th June.

1
1.0 INTRODUCTION
Energy is becoming an increasingly important issue and is receiving increased interest
due to the realization that fossil fuel resources required for energy generation are finite
and that climate change is linked to carbon emissions (Baños, et.al 2010). This
realization has led not only to increases in energy costs (refer to Appendix 10.1 for
rises in costs for XNA), but also to action to reduce energy consumption and
greenhouse gas (GHG) emissions. In Australia, action has already commenced with
the government agreeing to reduce Australia’s GHG emissions through the
international agreement of the Kyoto Protocol. This has subsequently led to the
implementation of government run energy and GHG reduction programs, as well as the
government implementing financial incentives for businesses to reduce their carbon
emissions through the impending carbon tax.
For businesses, these reduction programs, rising energy costs and impending carbon
tax are considerable reasons to become accountable for energy consumption and to
reduce their GHG emissions. Mining companies, as highly energy intensive activities
(Kenjile 2004), have even more reason to become accountable due to the significant
associated capital costs (Environment Australia 2002). A mining company that uses a
substantial amount of energy and therefore is interested in reducing their energy
consumption and GHG emissions is Xstrata Nickel Australasia (XNA) for their Cosmos
and Sinclair Nickel operations.
1.1 Project Background
The first step for businesses to reduce dependency on fossil fuels is to introduce an
energy efficiency program (Baños, et al 2010). Energy efficiency should be seen as a
top priority to ensure a more sustainable energy future (Milo, et al 2010) and the
Australian government has introduced the Energy Efficiencies Opportunities (EEO)
program to assist businesses to achieve these goals by requiring them to identify,
evaluate and report on cost-effective energy saving opportunities.
The EEO program is a statutory requirement under the Energy Efficiency Opportunities
Act 2006 (ComLaw 2006) and for businesses that use over 0.5 petajoules (PJ) of
energy it is a legislative requirement to participate in the program. In the 2007-2008
reporting period, XNA exceeded the 0.5 PJ threshold triggering legislative participation
in the program. 80% of the energy use by XNA must be assessed under the legislation

2
which includes both their Cosmos and Sinclair operations, but excludes their Perth
office. The EEO program operates on a five-year cycle which requires XNA to submit
annual assessments to the federal Department of Resources, Energy and Tourism
(DRET) by the 31 December each year. XNA submitted its first EEO report on
December 31, 2010 and is required to submit their next EEO report on December 31,
2011.
The second step for businesses to reduce their dependency on fossil fuels would be
looking towards carbon neutrality. Carbon neutrality is a total reduction of the net
carbon emissions to zero (DECC 2009) and may be achieved by changing from current
fossil fuel sources to renewable energy sources or through offsetting their carbon
emissions.
Through introducing energy efficiency programs to reduce current energy usage and
then looking towards carbon neutrality it can benefit businesses through cost savings, it
reduces their dependency on fossil fuels and the business risks associated with it, it
can contribute to better risk management and it can bring about better stakeholder
relations through improved public image (Niederberger, et.al 2005).
1.2 Company Background
XNA is a high-grade nickel sulphide producer that operates in Western Australia. They
own and operate two mining operations, Cosmos and Sinclair, and have an office
located in Perth.
1.2.1 Cosmos Nickel Project
The Cosmos Nickel Project is located in the Northern Eastern Goldfields approximately
40 kilometres north-west of Leinster (Figure 1).
Construction of the project began in October 1999 and it achieved first nickel
concentrate production in April 2000. The operations consist of two underground
mines, Prospero (Helene decline) and Cosmos (Ilias decline), and an ore processing
facility. Five high-grade massive sulphide deposits have been discovered to date within
the vicinity of the Cosmos Nickel Operation, including Cosmos, Cosmos Deeps, Alec
Mairs, Prospero and the Tapinos deposits. The bulk of production has been sourced
from the Prospero and Alec Mairs ore bodies (Xstrata Nickel 2011). Prospero is
currently being decommissioned and is expected to finish at the end of 2011. Cosmos
3
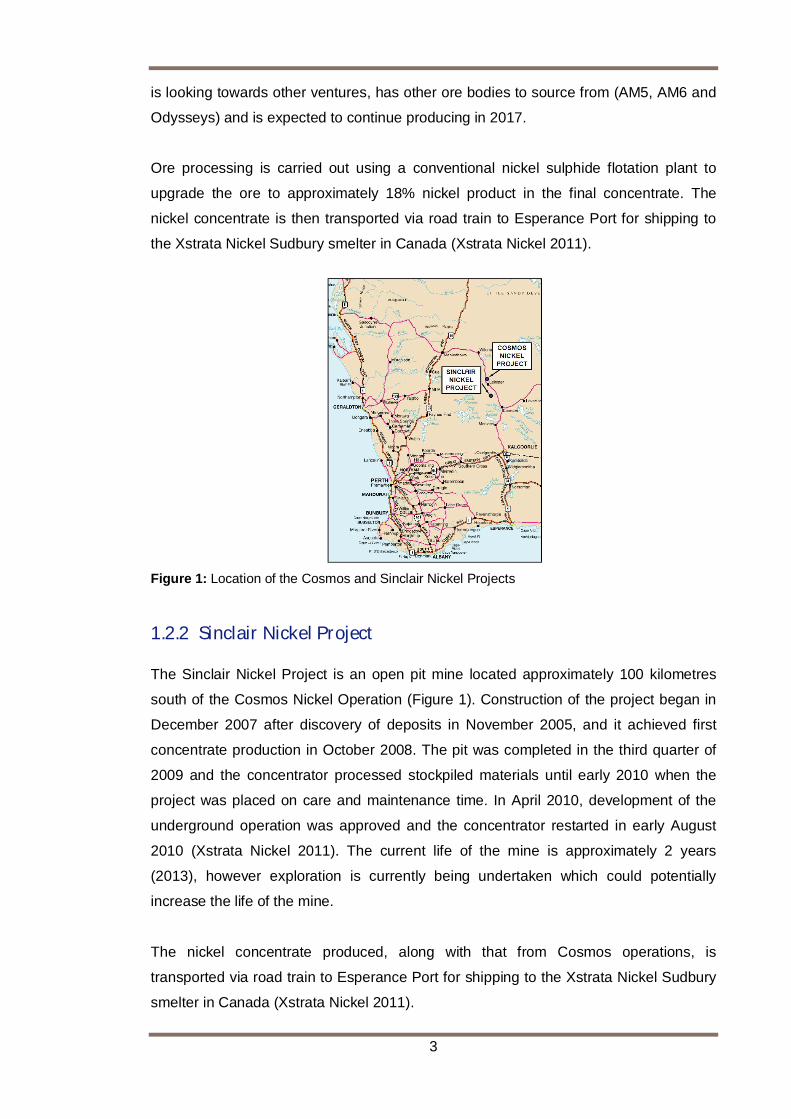
is looking towards other ventures, has other ore bodies to source from (AM5, AM6 and
Odysseys) and is expected to continue producing in 2017.
Ore processing is carried out using a conventional nickel sulphide flotation plant to
upgrade the ore to approximately 18% nickel product in the final concentrate. The
nickel concentrate is then transported via road train to Esperance Port for shipping to
the Xstrata Nickel Sudbury smelter in Canada (Xstrata Nickel 2011).
Figure 1: Location of the Cosmos and Sinclair Nickel Projects
1.2.2 Sinclair Nickel Project
The Sinclair Nickel Project is an open pit mine located approximately 100 kilometres
south of the Cosmos Nickel Operation (Figure 1). Construction of the project began in
December 2007 after discovery of deposits in November 2005, and it achieved first
concentrate production in October 2008. The pit was completed in the third quarter of
2009 and the concentrator processed stockpiled materials until early 2010 when the
project was placed on care and maintenance time. In April 2010, development of the
underground operation was approved and the concentrator restarted in early August
2010 (Xstrata Nickel 2011). The current life of the mine is approximately 2 years
(2013), however exploration is currently being undertaken which could potentially
increase the life of the mine.
The nickel concentrate produced, along with that from Cosmos operations, is
transported via road train to Esperance Port for shipping to the Xstrata Nickel Sudbury
smelter in Canada (Xstrata Nickel 2011).

4
1.2.3 Business Strategy
Xstrata’s business strategy is to continually work towards integrating sustainable
development (SD) into the way they manage their business. The SD Framework is
designed to ensure that each operation and project is managed consistently to the
highest international and leading practice standards (Xstrata 2011) and comprises of
Xstrata’s Statement of:
Business Principles – sets out the ethical framework for their activities globally
and applies to each operation (Xstrata 2011);
SD Policy – outlines Xstrata’s environmental, health and safety commitments,
as well as integrating commitment to communities and employees (Xstrata
2007); and
SD Standards – 17 standards (Appendix 10.2 – the standards in the white cells
align the Key Elements of EEO) that reflect Xstrata’s SD ambitions and
commitments (Xstrata 2008).
The hierarchy of the implementation of the SD framework from Xstrata plc through to
XNA and its operations is illustrated in Figure 2.
Figure 2: SD Document Hierarchy from XNA SD Management System
For XNA and its operations, looking at energy efficiency and reducing GHG emissions
aligns with Xstrata’s SD Policy (2007), in particular the goals to “continually improve the
efficiency with which we use raw materials, energy and natural resources” and to
“reduce our direct and indirect GHG emissions and work with other organisations,
governments and groups to address climate change” (Xstrata 2007). The EEO program

5
assists with achieving these goals by providing a process to continually assess and
improve energy consumption.
Another strategy XNA uses to reduce their energy consumption and carbon emissions
is through monitoring a range of key performance indicators (KPIs) to assess
performance against SD targets and objectives. XNA’s energy KPI targets, which are
based off the previous years performance, for the site are:
5% reduction in energy used per tonne of concentrate produced;
5% reduction in carbon intensity per tonne of concentrate produced; and
5% reduction in diesel use per tonne of concentrate produced.
To assist in these site KPI targets being reached, individual department have their own
KPI targets. By having targets for individual departments it encourages personnel
participation as well as providing a way to identify which areas are not reaching their
targets. The KPI targets for the individual departments are:
Mining
o 5% reduction in energy (PH) consumed per tonne hoisted; and
o 5% reduction in diesel consumed per tonne hoisted.
Mill
o 5% reduction in energy (PH) consumed per tonne of concentrate
produced.
Administration
o 5% reduction in energy (PH) consumed per man day.
1.3 Purpose & Objectives
The purpose of this project is to analyse the energy usage at XNA’s Cosmos and
Sinclair Nickel operations then identify and evaluate energy efficient opportunities, as
required by the EEO program. In addition, GHGs emitted by the sites will be analysed
to determine what would be required to move the sites towards carbon neutrality.
The objectives for the project, as requested by XNA, are:
Undertake site visits to Cosmos and Sinclair sites to access energy information
and engage with on-site personnel;
Follow up on actions and recommendations arising from the XNA 2009/2010
Energy Efficiency Opportunity (EEO) report;

6
Review the Energy mass balance tool developed and implemented by Energetics
that was used to monitor and report on energy key performance indicators (KPIs)
for Cosmos;
Investigate all identified energy efficiency opportunities and shortlist a minimum of
3 for further investigation and implementation;
Review site data gathering and metering equipment and provide a
recommendations report for optimizing the system suitable for costing; and
Complete government and public EEO report for the 2010/2011 period.
In addition to the objectives set by XNA, other objectives for the project are:
Analyse GHG emissions emitted from Cosmos and Sinclair operations
Investigate potential carbon neutrality options and suggest a strategy for moving
the sites towards carbon neutrality

7
2.0 LITERATURE REVIEW
There have been many studies on energy consumption, resource reduction and the
impact of climate change in Australia, including Garnaut’s Climate Change Review
(Garnaut 2008), Strategic Energy Initiatives Direction paper (Office of Energy 2011),
and McKinsey & Company Australian Cost Curve for GHG Reduction report (McKinsey
& Company 2008). These studies assist in acquiring a background understanding in
Australian sector consumption trends (Appendix 10.3), the need for a reduction in
energy usage and GHG emissions, and potential strategies for reduction.
Further information was sourced to gain a better understanding on EEO, to look at
case studies on energy efficiency, renewable energy and carbon neutrality, as well as
looking at specific data and studies done at Cosmos and Sinclair.
2.1 Energy Efficiency Opportunities
The DRET provides resource materials to businesses to assist them through the EEO
process and to help them to understand their obligations. These documents are
practical to obtain background information on EEO and energy mass balances (EMBs)
in order to understand the requirements of the program and understand the EMB tool
developed by Energetics. The register also is useful as it can be used to identify
opportunities that could be applied at Cosmos and Sinclair Nickel projects
The key EEO documents include:
EEO Assessment Handbook (DRET a 2010) – A guideline on planning, identifying
and investigating opportunities and making business decisions throughout the
EEO process;
EEO Industry Guidelines (DRET a 2008) – Provides background information on
EEO and assistance in the assessment process. The Industry Guidelines outlines
key elements that are required during the EEO process which include: 1.
Leadership, 2. People, 3. Information, Data and Analysis, 4. Opportunity
Identification and Evaluation, 5. Decision Making, and 6. Communicating
Outcomes. These key elements are vital for businesses to consider and
implement during the EEO process. For XNA these key elements are already part
of their business plan and are being implemented. The key elements can be
linked to their SD Standards, which are outlined in Appendix 10.2 (with exception
to the standards highlighted in the grey cells);

8
EEO Energy Mass Balance: Mining (DRET b 2010) – A guidance document
outlining key considerations and potential approaches for the development of an
EMB for a mining operation in order to meet the requirements of the EEO
program. Although the EMB has already been developed for Cosmos, it provides
background information on how to develop an EMB and the information that
needs to be included, so that a better understanding on how Cosmos’ EMB works
can be achieved;
Energy Savings Measurement Guide: How to Estimate, Measure, Evaluate and
Track Energy Efficiency Opportunities (DRET b 2008) – A guideline on
determining potential opportunities and the potential energy savings associated
with them; and
Significant Opportunities Register: Mining (DRET d 2010)– A register that lists
opportunities identified by mining operations who have participated in the EEO
program between 2008 and 2009. Some of these opportunities may be able to be
implemented at XNA’s Cosmos and Sinclair operations.
2.2 Case Studies
2.2.1 Energy Efficiency
Whilst many of the potential opportunities will be identified from talking to personnel on
site, since they are already aware of potential opportunities that should be
implemented, other energy efficiency opportunities will be initially investigated to
determine if they are applicable to Cosmos or Sinclair. Some of the resources that will
be used are:
Energy Efficiency Processes and Measurement: Ausenco’s Perspective (Daniel
and Lane 2008) – Discusses the efforts of a company to achieve energy
efficiency, with particular focus on the milling process, and trying to create a
business case for the application of the opportunities identified;
Energy Efficiency: Strategies for a Large Mining Operation in Western Australia
(Kenijle 2004) – The dissertation identifies strategies and potential opportunities
for moving a large mining operation in Western Australia towards energy
efficiency;
Energy Efficiency in China: the Business Case for Mining an Untapped Resource
(Niederberger, et. al 2005) – A study, in the context of the Chinese energy
system, on how businesses can utilise energy efficient resources to gain
competitive advantages and explains how to create a business case for energy
efficiency; and

9
Energy Efficiency: Policy Measures to Reduce GHG Emissions (Insight
Economics 2006) – The article explores potential opportunities to improve energy
efficiency in mine sites, including exploration, management, digital control of
machinery, electricity generation efficiency, using alternative fuels and advanced
mining approaches.
These resources provide insight into how to identify potential opportunities, they
discuss common opportunities that exist and the importance of creating business
cases to ensure that they are implemented. Another resource that was used was
discussions with the consulting company, Energetics, to understand how to better
create a business case and to ensure that the EEO program has a better chance of
success when implemented
2.2.2 Renewable Energy
With rising energy costs and uncertainty surrounding future energy supply there has
been numerous studies undertaken on renewable energy. A large number of these
studies have been around the well established renewable technologies of solar PV and
wind. These studies on the well established renewable technologies include Zahedi’s
(2010) study on solar PV and battery systems, Edward’s (2010) thesis on the Murdoch
PV system and Fidock’s (2010) thesis on the stability of generation of a wind farm.
Thesse studies look at how to optimise the current systems and identify potential
issues with their operation.
A recent study that encompassed the majority of renewable technologies was CSIRO’s
“Unlocking Australia’s Energy Potential” (2011), which expanded on the information in
the “Australian Energy Resource Assessment” (Geoscience Australia and ABARE
2010). The “Australian Energy Resource Assessment” examined Australia’s potential
energy resources, including fossil fuels, uranium and renewable technologies, and
CSIRO’s study expanded on this through investigating the affordability,
competitiveness and environmental standing of renewable technologies in Australia
and the development stage that the technologies are at.
A study that specifically focussed on renewable energy technologies applied in mine
sites, was undertaken by Nathan and Grano (n.d.) who researched emerging
renewable energy technologies for a OZ mining in South Australia and whether they
would be short term or long term alternatives compared to fossil fuels. A mine site that
has currently implemented renewable technologies to supplement their energy usage is

10
Galaxy Resources at their Mt Caitlin mine site in Western Australia (Galaxy Resources.
2011). Many initial reports have described the hybrid, solar photo-voltaic (PV) and wind
turbine, renewable energy system implemented at Mt Caitlin and reported Galaxy
Resources’ intentions to expand the renewable technologies to account for 100% of
their energy usage to reduce their dependency on fossil fuels and the business risks
associated with it (Martin 2011;Rampling 2011; Scanlon 2011; Thompson. 2011).
2.2.3 Carbon Neutrality
In Australia, the majority of the studies on carbon neutrality have been surrounding
households or cities, and have investigated reducing of carbon emissions from a range
of sources including electricity usage, waste production and transportation. Some of
these studies on carbon neutrality have included Berry’s (2010) thesis that investigated
retrofitting a house and Sinclair’s (2008) study that explored the effectiveness of carbon
neutral projects in Australian environments.
In Australia, carbon neutral projects that are being implemented include the carbon
neutral apartments at the Carlton Brewery site in Sydney (Jenkins 2011) and the
management plan outlined by Maribyrnong council (2008) for trying to move the
Melbourne suburb towards carbon neutrality. Internationally, there has been many
examples of carbon neutrality including the Zero Carbon House project in Britain (Rea
2006), the Beddinton Zero Energy Development in Sutton and the Dongtan Eco-city in
Shanghai (Sinclair 2008). All of these projects investigate different ways to reduce
energy consumption and to account for carbon emissions.
2.3 Site Information
Data on energy usage was sourced from both Cosmos and Sinclair, including their
power station reports, gas invoices, diesel reports and metallurgical data. The following
outlines energy assessments that have been undertaken at the sites and the outcomes
from those assessments.
2.3.1 Cosmos Nickel Project
At Cosmos, work has already been undertaken to identify energy usage and potential
energy efficiency opportunities as required by EEO. In September 2009 a Level 1
energy audit was conducted by consulting company Climate Changers Now from 2007
until 2009. After reviewing Cosmos’ energy usage the audit identified that XNA
exceeded the 0.5PJ threshold and therefore was required to participate in the EEO

11
program. The audit also investigated potential energy efficient opportunities that could
be implemented to reduce their energy usage.
Following the identification of participation in the EEO program by Climate Changers
Now in 2009, the consulting company Energetics developed an energy mass balance
(EMB) for Cosmos for 2010. The EMB was developed to assist in identifying energy
flows and major energy users on site. The site usage for the 2009/2010 period was
then assessed and 26 potential energy efficiency opportunities were identified, which
were analysed according to the accuracy of their net energy savings and financial
benefits. Following the assessment conducted by Energetics XNA submitted its first
EEO report to DRET on 31 December 2010. The potential opportunities that were
identified from the assessment are being reassessed due to significant changes in
operations.
2.3.2 Sinclair Nickel Project
Sinclair was not assessed in the 2009/2010 EEO report as it was during a period of
care and maintenance. In the third quarter of 2011, Sinclair assessed their energy
usage and potential energy efficiency opportunities, with the assistance of Energetics,
as required by the EEO program and will be included in the EEO report to be submitted
on 31 December 2011.

12
3.0 METHODOLOGY
3.1 Approach
The approach that will be taken in this project is to utilise a number of research and
data analysis techniques. The techniques that were used and the process involved in
the completion of the report are:
Literature Review – Review information on the EEO program, energy
efficiency, renewable energy and carbon neutrality through journals, books and
internet databases;
Data Analysis – Review metering data, EMBs and audits undertaken at
Cosmos and Sinclair and collaborate with Energetics during their assessment
of Sinclair in August. The information sourced from metering data and audits at
Sinclair will be compared to the information obtained by Energetics in their
assessment of Sinclair for the 2010/2011 period to check for inconsistencies;
Interpretation of Data – Develop appropriate graphs, flow diagrams and tables
to effectively display energy consumption for Cosmos and Sinclair;
Identify Potential Opportunities – Identify opportunities from literature reviews,
through discussions with personnel and through the EEO workshop that will be
held by Energetics. The energy efficient opportunities will be based on
preliminary findings from Energetics;
Analyse Opportunities – Opportunities will be analysed for their feasibility
through a multi-criterion assessment (MCA) and through a MAC (marginal
abatement cost) curve. The multi-criterion assessment will investigate the
opportunities based on economic, environmental, social and technical criteria
and will involve XNAs Risk Assessment framework. The MAC curve will
investigate the opportunities based on their financial and carbon abatement
benefits;
Recommend Strategy – Determine a strategy for the recommended
opportunities to implement, a strategy for the sites to achieve carbon neutrality
and a strategy for improving data metering and analysis;
EEO Reporting – Complete the EEO report that is required for the second
report for the 2010/2011 period. Also complete a government report which
outlines in further detail the information in the public report;
Conclusion and Recommendations – Provide a summary of the project and
recommendations for further study for the project.

13
3.2 Scope
The scope of this project is to look at energy usage and GHG emissions at Cosmos
and Sinclair, which will be limited towards energy used and emissions from electricity
generation and energy used in diesel. Emissions from the waste water treatment plant
and energy usage from transporting goods or employees to site have not been
included in the scope for this project.
3.3 Assumptions
The assumptions that have been made in this project are that the data calculated from
the information sourced is a reasonably accurate representation of the energy usage at
Sinclair and Cosmos. Implementation costs for opportunities has not been included as
it is assumed that personnel on site will be able to do the fittings themselves.
Transportation costs has also not been included as it was assumed that items can be
backlogged onto trucks that are already travelling from Perth to Cosmos or Sinclair.
3.4 Limitations
Due to the complex nature of the mine sites there are some limitations to the project
and in the analysis of the potential opportunities. The limitations for the project are that
the analysis of energy consumption is limited to the information available, the potential
opportunities investigated will be limited to ones that are past the development stage
and the opportunities investigated are only an initial analysis therefore further
evaluation of the opportunities will need to be investigated for their viability.
Factors that are difficult to include in the analysis of the opportunities include future
structural changes to the operations and cost increases/decreases to energy.

14
4.0 SITE ANALYSIS
4.1 Energy Consumption Analysis
An energy assessment was undertaken at Cosmos and Sinclair through an analysis of
metering information (as outlined in Table 4), energy mass balance tools and KPI
spreadsheets. Both sites have similarities in their operation, however Cosmos is a
bigger site and therefore uses more energy and they also have natural gas as one of
their energy sources. The energy usage, electricity generation and consumption,
vehicles and equipment diesel use and GHG emissions for Cosmos and Sinclair is
summarised in Table 1, and the differences between energy use is evident.
A detailed analysis of energy usage for each site is outlined in section 4.1.1 Cosmos
Nickel Project and section 4.1.2 Sinclair Nickel Project.
Table 1: Assessment of Energy Usage for Cosmos and Sinclair for 2010/2011
Cosmos Sinclair
Energy
Energy usage 964,338 GJ (0.96 PJ)
725,392 GJ (0.73 PJ) 238,945 GJ (0.24 PJ)
Sources
Natural Gas – supplied by Gas Trading directly to power station
Diesel Fuel – supplied by tanker trucks into the Cosmos and Prospero fuel farms
Diesel Fuel – by tanker trucks into the fuel farm
Electricity
Generation & Supply
12 x 1,000kW (1,250kVA) V16 diesel gensets generates and supplies electricity to the whole site.
9 gensets run on natural gas and diesel (approximately 70% and 30% respectively). 3 gensets which begun supplying electricity to the site in March and May 2011 run solely on diesel
Gensets are hired through a contract with KPS - costs $239,135/month
8 x 1,000kW (1,250kVA) V16 diesel gensets generates and supplies electricity to the whole site.
All gensets run on diesel, since that is only energy source. Gensets are through a contract with KPS - costs $137,120/ month
Generation for 2010/2011 period
47.0GWh of electric0ity
(169,364GJ of energy) 17.8GWh of electricity
(63,993GJ of energy)
Energy consumption
Diesel: 4,311,150L Natural Gas: 349,869 GJ Diesel: 4,629,776L
Powerhouse Efficiency 32% 36%

15
Vehicles & Equipment
Vehicle types
Heavy vehicles (Haul trucks, dump trucks, excavators, graders, loaders, service trucks)
Light vehicles Drill rigs and jumbos Other (bus, forklift, crusher, dewatering pumps, compressor, charge up,
screen)
Usage for 2010/2011 period 5,417,445 L (209,113 GJ) 1,560,523 L (60,236 GJ)
GHG Emissions Total emissions for 2010/2011 period
60,665tCO2-e Potential cost with impending carbon tax ($23/tCO2-e) = $1,395,295
Emissions for 2010/2011 period 44,058 tCO2-e 16,607 tCO2-e
Emissions for 2009/2010 period 40,245 tCO2-e 9,717 tCO2-e
4.1.1 Cosmos Nickel Project
Cosmos Nickel Project is the bigger energy user with a total energy use of 0.73 PJ
which makes up 75% of the total usage between sites. The site uses energy for
electricity generation (natural gas and diesel) and for equipment (diesel). Figure 3
illustrates the breakup of energy usage and it is evident that there is approximately
equal split between total diesel and gas usage on site. From the energy usage in
Figure 3, 29% of energy usage is attributed to equipment and 71% is for electricity
usage.
Figure 3: Energy Usage for Cosmos Nickel Project for 2010/2011
The main areas that are supplied energy as identified through the metering within the
site are the underground mines (Prospero and Cosmos), the processing plant, the

16
village and administration. The distribution of electricity consumption between these
areas are shown in Figure 4. From this figure it is evident that the Cosmos and
Prospero mines and the processing plants are large energy users with the village and
administration collectively accounting for only 7% of the energy usage. Unaccounted
power accounts for 6% of the energy usage, which occurred through metering and sub-
metering (Plant feeder is meter and the sub-meters are Village, plant and
administration). The fluctuations for electricity consumption for each month during the
2010/2011 period for the different areas for Cosmos is illustrated in Figure 5.
Figure 4: Cosmos Electricity Consumption by Area for 2010/2011 Period
Figure 5: Cosmos Nickel Project Electricity Consumption by Area for 2010/2011 Period
The energy flows around the site are illustrated in the Sankey diagram (Figure 6),
which includes mass flows (ore, concentrate, tails and scats). From this diagram there
is also evidence of unaccounted power between the meters and sub-meters which may
be due to distribution losses.

17
Figure 6: Sankey Diagram for Cosmos Nickel Project for the 2010/2011 Period

18
For electricity generation on site, Cosmos has 12 diesel gensets that run on diesel and
natural gas, with the exception of 3 generators that recently were commissioned and
run on diesel. The energy consumed and generated, and the efficiency of the
generators for each month over the 2010/2011 period is illustrated in Figure 7, and
Figure 9 shows the flows for of energy and outlines the load of each genset. Figure 8
illustrates each genset for a typical month (October 2010). From these figures it is
evident that there are major losses from the gensets which are mainly in the form of
lost heat, load shifting and some minor friction and transmission losses. The efficiency
of the power station is approximately 32% which is within the expected range for this
type of power station.
Figure 7: Cosmos Energy Consumed and Generated by the Power Station each Month for
2010/2011 Period
Figure 8: Energy Consumed and Generated in each Genset of the Power Station for a Typical
Month (October 2010)

19
Figure 9: Sankey Diagram for Cosmos Power Station for the 2010/2011 Period

20
For equipment use on site, Cosmos uses vehicles for hauling and filling, light vehicles
for general access around site, service vehicles, drills and other equipment, as shown
in Figure 10. From Figure 10 it is apparent that the majority of the energy usage is for
haulage and filling, which accounts for 58% of equipment diesel usage. Light vehicles
accounts for a small percentage of the total equipment diesel usage at 9%. Figure 11
illustrates the fluctuations in diesel, between 379kL and 502kL over the 2010/2011
period.
Figure 10: Diesel Consumption by Equipment for Cosmos for the 2010/2011 Period
Figure 11: Diesel Consumption for Cosmos for the 2010/2011 Period

21
For equipment on site there are no individual meters that indicate where the large
electricity users are. Since underground accounts for a large percentage of the total
site electricity use, estimates were made on electricity use based off the kilo-watt rating
of the equipment underground, as shown in Figure 12. This figure shows that the
primary and secondary fans and the pumps account for a large percentage of energy
usage.
Figure 12: Estimates of Electricity Use for Mining Equipment
The KPIs for Cosmos over the 2010/2011 are shown in Table 2 where it can be seen
from the orange highlighted cells that Cosmos is not reaching their targets for energy
reduction and highlights the importance of energy efficiency projects to reduce their
energy usage. The reason for not reaching their targets may be attributed towards the
changes in the operations with changes from massive to disseminated ore which
resulted in less concentrate in the ore hauled and the addition of a ball mill to the sag
mill in the processing plant.

22
Table 2: KPIs for Cosmos for the 2010/2011 Period including Targets for 2010 and 2011
23
4.1.2 Sinclair Nickel Project
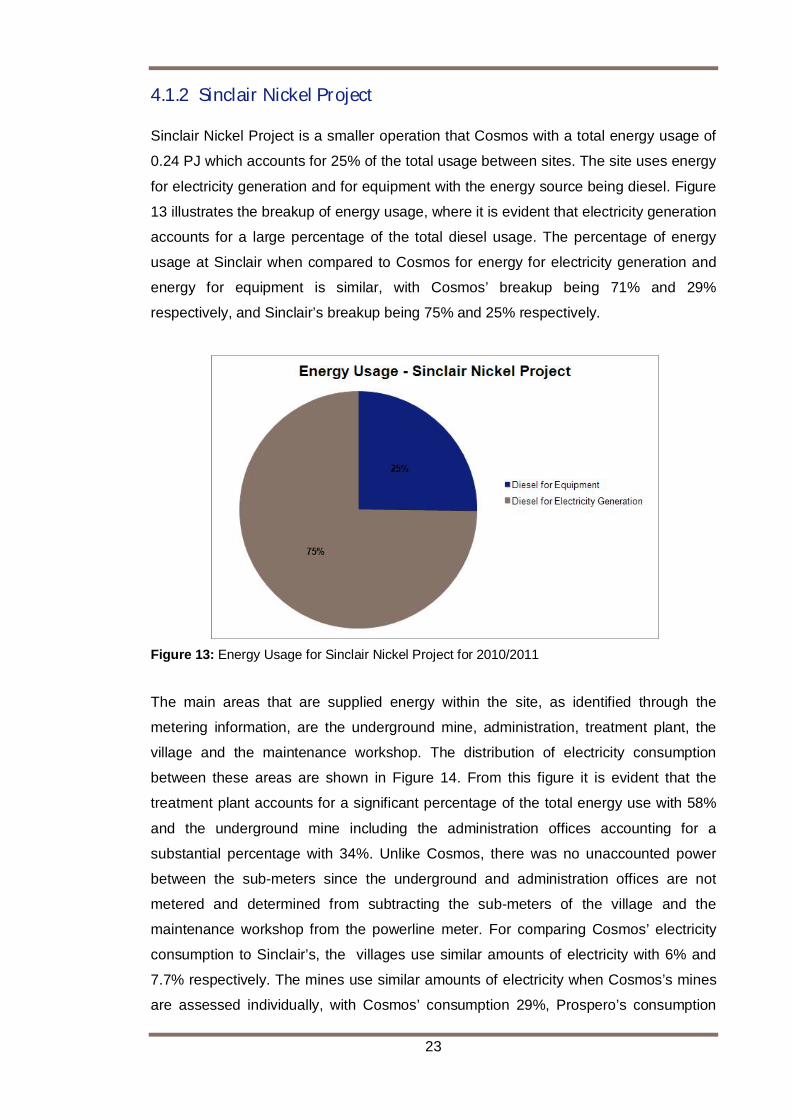
Sinclair Nickel Project is a smaller operation that Cosmos with a total energy usage of
0.24 PJ which accounts for 25% of the total usage between sites. The site uses energy
for electricity generation and for equipment with the energy source being diesel. Figure
13 illustrates the breakup of energy usage, where it is evident that electricity generation
accounts for a large percentage of the total diesel usage. The percentage of energy
usage at Sinclair when compared to Cosmos for energy for electricity generation and
energy for equipment is similar, with Cosmos’ breakup being 71% and 29%
respectively, and Sinclair’s breakup being 75% and 25% respectively.
Figure 13: Energy Usage for Sinclair Nickel Project for 2010/2011
The main areas that are supplied energy within the site, as identified through the
metering information, are the underground mine, administration, treatment plant, the
village and the maintenance workshop. The distribution of electricity consumption
between these areas are shown in Figure 14. From this figure it is evident that the
treatment plant accounts for a significant percentage of the total energy use with 58%
and the underground mine including the administration offices accounting for a
substantial percentage with 34%. Unlike Cosmos, there was no unaccounted power
between the sub-meters since the underground and administration offices are not
metered and determined from subtracting the sub-meters of the village and the
maintenance workshop from the powerline meter. For comparing Cosmos’ electricity
consumption to Sinclair’s, the villages use similar amounts of electricity with 6% and
7.7% respectively. The mines use similar amounts of electricity when Cosmos’s mines
are assessed individually, with Cosmos’ consumption 29%, Prospero’s consumption

24
38% and Sinclair’s mine using 34%. For the processing plant, the percentage
consumptions are significantly different with Cosmos’ plant accounting for 20% of
electricity consumption and Sinclair’s accounting for 58%.
The fluctuations for electricity consumption for each month during the 2010/2011 period
for the different areas for Sinclair is illustrated in Figure 15.
Figure 14: Sinclair Electricity Consumption by Area for 2010/2011 Period
Figure 15: Sinclair Nickel Project Electricity Consumption by Area for 2010/2011 Period
The energy flows around the site are illustrated in the Sankey diagram (Figure 16),
which includes mass flows (ore, concentrate, tails and waste rock). There was
unaccounted power identified from the electricity coming out of the power station and
power accounted to each of the meters, similar to Cosmos, which may also be
accounted to distribution losses.

25
Figure 16: Sankey Diagram for Sinclair Nickel Project for the 2010/2011 Period

26
For electricity generation on site, Sinclair has 8 diesel gensets that run on diesel. The
energy consumed and generated, and the efficiency of the generators for each month
over the 2010/2011 period is illustrated in Figure 17 (diesel consumption for August is
missing due to data not being recorded), and Figure 19 shows the flows for of energy
and outlines the load of each genset. Figure 18 shows each genset for a typical month
(March 2010). Similar to Cosmos, it is evident from these figures that there are major
losses from the gensets which are similarly due to lost heat, load shifting and some
minor friction and transmission losses. The efficiency of the Sinclair power station is
approximately 36% which is within the expected range for this power station. From
Figure 18, it can also be noted that only half of the genset capacity appears to be used,
which is due to the power station being sized larger than what was required at Sinclair.
Figure 17: Sinclair Energy Consumed and Generated by the Power Station each Month for
2010/2011 Period
Figure 18: Energy Consumed and Generated in each Genset of the Power Station for a Typical
Month (March 2010)

27
Figure 19: Sankey Diagram for Sinclair Power Station for the 2010/2011 Period

28
For equipment use on site, Sinclair uses vehicles for hauling and filling, light vehicles
for general access around site, service vehicles, drills and other equipment, as shown
in Figure 20. From Figure 20, it is apparent that the majority of the energy usage is for
haulage and filling, which accounts for 58% of equipment diesel usage. A difference
between the data for Cosmos and Sinclair is that Sinclair has a significantly larger
percentage of diesel usage for light vehicles with 24%, as opposed to Cosmos which
only had light vehicles accounting for 9% of the total usage. Figure 21 illustrates the
fluctuations in diesel, between 79kL and 242kL over the 2010/2011 period. In February
2010 there was a drop of diesel usage due to flooding at that time which meant a
restriction of getting the diesel trucks to site, and in July 2010 the site was in a period of
care and maintenance and no concentrate was produced in that month.
Figure 20: Diesel Consumption by Equipment for Sinclair for the 2010/2011 Period
Figure 21: Diesel Consumption for Sinclair for the 2010/2011 Period

29
The KPIs for Sinclair over the 2010/2011 are shown in Table 3 where it can be seen
that similar to Cosmos there is a fair amount of orange highlighted cells which indicates
that the for the month they exceeded their goal. It should be noted however that
Sinclair are in the process of collecting their baseline data and the baseline data that
was used from 2010 for their 2011 goal only used 5 months due to the period of care
and maintenance. Despite the baseline data still being collected it is still important that
Sinclair develops strategies to reduce their energy usage.

30
Table 3: KPIs for Sinclair for the 2010/2011 Period including Targets for 2010 and 2011

31
4.2 Metering and Data Analysis
Data monitoring at Cosmos and Sinclair is undertaken through manually entering
information from meters into data sheets which is then entered into Excel
spreadsheets. These spreadsheets contain the metering information as well as other
calculations and summary information such as graphs. The spreadsheets for data
monitoring at Cosmos and Sinclair is outlined in Table 4.
For data analysis at Cosmos and Sinclair, they have both been assessed by the
consulting company, Energetics, who developed an EMB for Cosmos energy data
analysis and an energy snapshot for Sinclair. Cosmos and Sinclair also monitor their
energy performance through their KPI spreadsheets.
Table 4: Data Monitoring for Cosmos and Sinclair Nickel Projects
Cosmos Sinclair
Power station Report
Powerhouse KPS includes information on gensets (gas and diesel usage, electricity generation and run hours) and electricity supply to feeder lines (Cosmos mine, Prospero mine, Plant, Village and Administration). Reported annually - Information is entered daily
Power Consumption Spreadsheet includes information on gensets (diesel usage, electricity generation and run hours) and electricity supply to feeder lines (treatment plant, powerline, village main and Byrnecut main). Information is entered once a month
Fuel pricing Spreadsheet
Includes information on cost pert litre ($AU and $US), average cost per litre and fuel costs Reported annually -Entered weekly
Includes information on cost pert litre ($AU and $US), average cost per litre and fuel costs Reported annually -Entered weekly
Diesel EOM
Includes information on the types of vehicles used and the amount of diesel usage for each. Reported monthly
Includes information on the types of vehicles used and the amount of diesel usage for each. Reported monthly.
Gas Trading Invoice
Includes information on gas delivered to site and costs Reported monthly
-
EMB
The EMB consolidates information from all of the data monitoring spreadsheets above, as well as information from the production report. The data is copied across from the original spreadsheets and calculations are automatically undertaken. The EMB information is entered monthly.
-
Potential problems that are apparent at both Cosmos and Sinclair which were identified
from the current methods of data monitoring and data analysis are:
Manually entered information – Increases the likelihood of incorrect information
being entered through poor writing when recording readings, incorrectly entering
information or recording readings by the wrong factor (Beggs 2009). For example,

32
at Sinclair their diesel keys they have just manually allocated “LV” fuel to HV based
on the assumption that it went into a generator, which may create an issue if
audited by the government. The manual allocation may also account for Sinclair’s
large LV readings at 24%). Another example of problems that exists with Sinclair’s
data due to manually entered information is through their power station reports
where the numbers differ between the spreadsheets that are written manually to
those entered in the Excel spreadsheet, although these differences are quite
marginal;
Human Error – By manually entering the information it can increase the error in the
data, for example at Sinclair an email was sent around from one of the electricians
stating that the kWh reported in the spreadsheets was out by a factor of 10 due to a
decimal point and there was only one month where the correct values were
reported, where in fact the month that was thought to be correct was incorrect;
Data not collected consistently – Leads to inaccurate readings for the month when
the data is not collected consistently (e.g. Sinclair enters power station metering
information once a month and it is either around the end of the month or the start of
the following month);
Lack of meters – Unable to monitor specific areas within the site due to the lack of
meters. The problem is particularly prevalent at Sinclair where they only have four
meters, and the underground and administration areas energy usage is determined
through subtracting the other sub-meters from the powerline meter. It is vital that
this is addressed as it assists in identifying significant power consumers and
determining their load profiles;
Time to collect information – The length of time taken to collect information may
impact the data since it can take up to half an hour at Cosmos to collect just the
genset information; and
Structure of the EMB – The structure of the EMB led to problems of incorrect
information being entered when the Diesel EOM’s and Power station Reports.
These existed through not all of the information from the diesel EOM’s being
entered so there was fuel that was not being accounted for and with the power
station reports the values were not checked so information from reset meters was
being used. Another problem that existed with the structure of the EMB is that when
extra information was entered into the original spreadsheets (e.g. an extra ore body
was added to the production report and extra gensets were added to the power
station report) that information was not captured and the correct information was
not carried across in the EMB due to the calculations within the EMB.

33
Another issue that was identified with data at Cosmos and Sinclair was discrepancies
with diesel, which can be seen in the site Sankey diagram for Cosmos (Figure 6) and
Sinclair (Figure 16). These diesel discrepancies are discussed in more detail in
Sections 4.2.1 and 4.2.2 below.
4.2.1 Cosmos Nickel Project
The diesel discrepancies into the power station they are due to differences that were
identified through the two different data monitoring spreadsheets (Powerhouse KPS
and Diesel EOM) that recorded diesel for the power station. The Diesel EOM uses a
powerhouse meter where they record readings. Recently that powerhouse meter has
been faulty but they were able to determine readings for the diesel into the power
station through using the opening balance of the fuel farm, doing the dips, subtracting
the withdrawals for the months and then using the remaining value, attribute that
towards the power station. The Powerhouse KPS spreadsheet uses the diesel values
from the individual gensets and through summing those values it can be determined
the total amount of diesel that enters the power station. The difference between the two
monitoring spreadsheets is that the Powerhouse KPS spreadsheet under reports the
diesel EOM by 151,088L.
4.2.2 Sinclair Nickel Project
The diesel discrepancies into the power station they are due to differences that were
identified through the two different data monitoring spreadsheets (Power Consumption
Spreadsheet and Diesel EOM) that recorded diesel for the power station. With the
Diesel EOM spreadsheet the usage for diesel is estimated for the power station using
the opening balance, doing the dips, subtracting the withdrawals for the month and
attributing the remaining fuel to the power station. With the Power Consumption
Spreadsheet, it is similar to how the readings are done at Cosmos, however they also
use a pulse meters for the gensets. The maintenance personnel at Sinclair have little
confidence in the accuracy of their figures and only report that way as a requirement of
reporting to KPS. The difference in the two data monitoring spreadsheets is that the
power station over reports how much diesel is used compared to the diesel EOMs by
17,264L.

34
5.0 OPPORTUNITIES
Following the identification of energy usage on site the next stage is to identify and
assess the opportunities and then to recommend strategies for implementation.
5.1 Opportunity Analysis
The opportunities identified were compared based on a variety of criteria through a
multi-criterion assessment and then all of the opportunities were compared based on
financial savings and carbon abatement through a MAC curve.
5.1.1 Multi-criterion Analysis
A multi-criterion analysis (MCA) was created to assess the opportunities based on a
variety of environmental, social, technical and financial criteria. The MCA (Appendix 4:
Additional Information – MCA) was developed using Annandale and Lantze’s guide
(2000) on applying decision-aiding techniques and Taylor and Fletcher’s (2005) guide
on triple-bottom line assessments. For the environmental criteria, it included a version
of XNA’s risk register (Appendix 4: Additional Information – XNA Risk Register) which
determined potential environmental risks that may be associated with the opportunity.
In order to compare the opportunities, the potential opportunities were separated into
the categories of the potential opportunities are energy efficient technologies,
alternative energy source opportunities, offsetting opportunities and metering and data
collection equipment. The opportunities were then ranked and compared against
opportunities within the same category.
A weighting to the criteria was taken into consideration during the ranking of the MCA
which was based on XNA’s preferences. XNA’s weighting of criteria is presented in
Table 5, and is weighted based on 1 being the most important to XNA and 10 being the
least important to XNA.

35
Table 5: XNA’s Weighting of Criteria
Criteria Weighting 1-10
(Most Importance to least importance)
Environmental XNA Risk Assessment 5 Energy Savings (GJ) 4 CO2 Reduction (tCO2) 4
Social
Human Health Impacts 5 Local Involvement 6 Improve Stakeholder Relations 6 Lifestyle Change 7 Difficulty of Project Implementation 3
Technical
Disturbance to Operations 2 Training/Management Change 4 Maintenance Requirement 2 Safety Issues 1 Productivity Impact 2 Reliability 5
Financial Net financial Benefits 1 Estimated Payback Period 2
Energy efficient technologies were identified by personnel from different areas on site
through workshops held by Energetics. These opportunities are still in the process of
being assessed and the costs and energy savings presented in the MCA are being
reviewed. Whilst many energy efficient ideas were identified during the workshops, the
viable opportunities were the ones that were further assessed. Some of the
opportunities that were identified as not viable due to lack of energy savings or high
costs were power factor correction at Cosmos and Sinclair and connecting to the gas
pipeline at Sinclair.
Power factor correction was identified as a possible energy saving by electricians at
Sinclair. At Sinclair the power factor is 0.722 and at Cosmos it is 0.86. The power factor
correction opportunity was not considered feasible as an electrical engineer at Cosmos
determined that it would not achieve noticeable savings in fuel as it only reduces waste
heat generated in wires and most power correction projects are undertaken for other
reasons such as savings in the need for a larger distribution network capacity or the
elimination of a utility tariff. For the gas pipeline at Sinclair, it would be possible to
connect to the pipeline as it runs through the site and it would reduce diesel costs by
generating electricity with gas energy. This opportunity was determined as not feasible
as the fuel savings were marginal and the life of the mine was too short.
The technologies that were identified for further investigation and/or implementation at
Cosmos and Sinclair are shown in figures 22 and 23 respectively. From these figures it
can be seen that based on the criteria spinning reserve reduction for Cosmos and fuel
additives for Sinclair are the most favourable opportunities for implementation, with

36
timers in village rooms for Cosmos and campaigning primary crusher for Sinclair being
the least favourable opportunities for implementation.
Figure 22: Ranking of Energy Efficient Opportunities for Cosmos
Figure 23: Ranking of Energy Efficient Opportunities for Sinclair
The alternative energy source opportunities that were identified for Cosmos and
Sinclair were limited to ones that are not at the development stage, since it is vital for a
mine site to have constant, reliable supply of energy. The energy source opportunities
were sized to be able to supplement the energy produced by a 1MW generator. For
solar PV, solar thermal and wind turbines local information (Leinster temperature, wind
speed, peak sun hours and solar radiation) was used to determine the expected output
using the methods outlined in PEC390 Energy Supply (Murdoch University unit).
From figure 24, the most favourable energy source opportunity is geothermal with the
least favourable being waste gasification. It is important to note with both the most
favourable and least favourable opportunities that they may not be viable as there are

37
appears to minimal geothermal potential in the area and for waste gasification both
Cosmos and Sinclair do not produce enough waste to generate electricity.
Figure 24: Ranking of Energy Source Opportunities
Offsetting opportunities was investigated as a potential opportunity to compensate for
carbon emissions on site. The amount of offsetting units that would be bought were
determined based on the amount of carbon emissions from a 1 MW generator. The
ranking of the opportunities, as shown in figure 25, is similar, with forest sink being
slightly less favourable than the other two opportunities due to slightly higher
associated cost. It is important to note that with the impending carbon tax, carbon
offsetting would not reduce the associated tax costs as it is seen as an additional
voluntary option (Clean Energy Future a 2011).
Figure 25: Ranking of Offsetting Opportunities
For the analysis of metering and data collection equipment, the results of the MCA is
subjective. Due to the rankings for costs, carbon emissions and energy savings, the
opportunities determined as more favourable were the opportunities, such as fuel
management system, that had a direct saving. The other opportunities that had no
direct energy savings but would result in better identification of energy use were the
less favourable opportunities. Figure 26 and 27 show the metering and data collection

38
opportunities for Cosmos and Sinclair respectively. For Sinclair, the opportunity of
implementing more meters, which would be beneficial for energy analysis was not
included in the analysis as the electricians said they were in the process of installing
meters.
Figure 26: Ranking of Metering and Data Collection Opportunities for Cosmos
Figure 27: Ranking of Metering and Data Collection Opportunities for Sinclair
5.1.2 Marginal Abatement Cost Curve
A marginal abatement cost (MAC) curve (Appendix 4: Additional Information – MAC
Curve) was developed to indicate which opportunities should be put into place based
on their financial benefits and CO2 reductions. The aim of the MAC curve is to show the
relativity between the opportunities over a 4 year period. Figure 28 shows the MAC
curve for the opportunities at Cosmos and figure 29 shows the MAC curve for the
opportunities at Sinclair. From these graphs, the opportunities that have a greater width
indicate that there is a greater amount of CO2 that can be reduced, such as in figure 28
spinning reserve and in figure 29 fuel additives have high abatement potential. The
height of the graph indicates the average cost of avoiding 1 ton of CO2, with the
opportunities below the horizontal axis indicating a net benefit over the lifecycle of the
option. It should be noted that the opportunities with * (e.g. Solar PV *), have had the
abatement potential divided by 100 due to the relative width compared to the other

39
opportunities. These opportunities can still be compared financially though, since they
are above the horizontal axis and indicate that they would have a longer payback
period.
The four opportunities that have higher abatement potentials and a net benefit for
Cosmos are:
1. Spinning reserve reduction – Capex of $45,000, reduce energy usage by 6.34%
and GHG emissions by 5.93%;
2. Reactive load sharing – Capex of $360,000, reduce energy usage by 3.83%
and GHG emissions by 3.58%;
3. Ventilation telemetry – Capex of $126,240, reduce energy usage by 2.40% and
GHG emissions by 2.25%;
4. VSD on primary fans – Capex of $267,650, reduce energy usage by 1.24% and
GHG emissions by 1.16%.
The four opportunities that have higher abatement potentials and a net benefit for
Sinclair are:
1. Fuel additives – Capex of $45,000, reduce energy usage by 4.64% and GHG
emissions by 4.64%;
2. More cyclones – Capex of $75,000, reduce energy usage by 2.93% and GHG
emissions by 2.39%;
3. Guaranteed fuel economy – Capex of $0, reduce energy usage by 1.99% and
GHG emissions by 1.99%;
4. Backfill transport – Capex of $0, reduce energy usage by 1.83% and GHG
emissions by 1.83%.
These top four opportunities that were identified during the MAC curve analysis were
also ranked highly in the MCA analysis with Cosmos’ opportunities of spinning reserve
reduction ranked 1st, reactive load sharing ranked 3rd, ventilation telemetry ranked 8th
and VSD on primary fans ranked 6th; and Sinclair’s opportunities of fuel additives
ranked 1st, more cyclones ranked 11th, guaranteed fuel economy ranked 2nd and backfill
transport ranked 3rd. While it is good that the results from the MAC curve and the MCA
align, the opportunities for implementation are most likely to be from the opportunities
identified in the MAC curve, since finance is a major driver in business. The MAC
curve also indicates carbon abatement and with the impending carbon tax it provides
significant reasons for implementing the opportunities that offer the biggest carbon
abatement.

40
Figure 28: MAC Curve for Cosmos Opportunities

41
Figure 29: MAC Curve for Sinclair Opportunities

42
5.2 Implementation of Opportunities
5.2.1 Recommended Strategy
Based on the carbon abatement potential of the opportunities, all of the opportunities in
the MAC curve (Figures 28 and 29) below the horizontal line are recommended to be
implemented, however the top four opportunities identified in the opportunity analysis
should be initially implemented to provide a significant reduction in carbon emissions.
For Cosmos, the top four initiatives were spinning reserve reduction, reactive load
sharing, ventilation telemetry and VSD on primary fans. Currently all of the
opportunities at Cosmos are still being investigated. If the top four opportunities were to
be implemented it would result in a reduction of GHG emissions by 13% (5,688 tCO2-e)
and a reduction in energy usage by 14% (100,184 GJ). The capex requirement would
be $799,890 however the overall savings for a four year period would be $9,759,167
and the payback period for the top four opportunities is less than 11 months.
Figure 30: MAC Curve for recommended Cosmos Opportunities to be implemented
If all of the opportunities for Cosmos outlined in figure 30, with exception to solar hot
water (since heat pumps have a shorter payback period and similar benefits) were
implemented it would result in a reduction of GHG emissions by 16% (6,998 tCO2-e)
and a reduction in energy usage by 17% (121,203 GJ). The capex requirement would
be $2,021,514 however the overall savings for a four year period would be
$14,307,011. All of the opportunities have a payback period of less than 2 years,
except combine concentrate hoppers which has a payback period of 2.46 years.

43
For Sinclair the opportunities were fuel additives, more cyclones, guaranteed fuel
economy and backfill transport. Of these opportunities, guaranteed fuel economy has
been approved for implementation and more cyclones is currently in progress. Other
opportunities that are in progress or approved for implementation at Sinclair are control
loop tuning, secondary fans in inactive headings and primary fan management. If the
top four opportunities were to be implemented, and including the opportunities that are
currently being implemented, it would result in a reduction of GHG emissions by 12%
(1,982 tCO2-e) and a reduction in energy usage by 13% (30,384 GJ). The capex
requirement would be $132,000 however the overall savings for a four year period
would be $18,735,861. The payback period for the top four opportunities is less than 3
months.
Figure 31: MAC Curve for recommended Cosmos Opportunities to be implemented
If all of the opportunities for Sinclair outlined in figure 31, with exception to solar hot
water (since heat pumps have a shorter payback period and similar benefits) were
implemented it would result in a reduction of GHG emissions by 15% (2,531 tCO2-e)
and a reduction in energy usage by 17% (39,467 GJ). The capex requirement would be
$445,580 however with modelling in the village was implemented it would save
$534,900 resulting in a positive difference of $89,320. The overall savings for a four
year period would be $20,925,667. All of the opportunities have a payback period of
less than 2 years, except water recycling underground which has a payback period of
3.97 years.
5.2.2 Carbon Neutrality Strategy
As discussed in the project background the second step for reducing dependency on
fossil fuels would be to look towards carbon neutrality through the implementation of
alternative energy sources such as renewable technologies and through buying carbon

44
offsets. An important part of achieving carbon neutrality would be through raising
awareness and implementing energy efficient technologies which would not only
reduce energy use but reduce the amount of carbon emissions that need to be abated
through renewable technologies or carbon offsets which would also reduce the capex.
Figure 32 illustrates this strategy of initially having avoidance of energy usage, then
looking towards energy efficient behaviours, before the implementation of renewable
technologies or buying carbon offsets.
Figure 32: Strategy for Carbon Neutrality (Maribyrymong City Council 2008)
Based on this strategy for moving towards carbon neutrality, if Cosmos and Sinclair
were to firstly implement all of the energy efficiency opportunities outlined in the
Recommended Strategy before looking towards implementing renewable or offsetting it
would reduce the capex and payback periods making the potential for moving towards
carbon neutrality more viable. For Cosmos and Sinclair to become carbon neutral it
would cost $465 million and $155 million respectively. Taking into consideration the net
benefits of implementing the energy efficient technologies over a four year period, it
would then reduce the costs for Cosmos to $451 million with a payback period of 14
years and for Sinclair to $134 million with a payback period of 7 years. The costs were
determined using the costs from solar PV since it was the cheapest renewable
technology identified in the Option Analysis and included the costs saved and incurred
by paying out the contractor of the generators. If carbon tax was taken into
consideration also, it would result in further savings for Cosmos and Sinclair of

45
$2,557,140 and $971,244 respectively over the 3 year period that the carbon tax is to
be implemented (Clean Energy Future b 2011).
For implementing offsetting options the capex would be less than what would be
required for implementing renewable technologies, however there would be no long
term financial benefits and financial benefits from the carbon tax since it is seen as a
voluntary option. For implementing either of the cheaper offsetting options identified in
the Option Analysis over a four year period it would cost $741,200 for Cosmos and
$281,520 for Sinclair.
If Cosmos and Sinclair were to become carbon neutral, without implementing any
energy efficient technologies, the capex requirement would be significantly larger and
result in longer payback periods. For Cosmos and Sinclair, to become carbon neutral
using renewable technologies (solar PV) it would cost $557 million with a payback of
15 years and $185 million with a payback of 8 years respectively. Taking into
consideration the carbon tax it would result in savings for Cosmos and Sinclair of
$3,040,002 and $1,145,883 respectively. For implementing either of the cheaper
offsetting options identified in the Option Analysis over a four year period it would cost
$881,160 and $332,140 respectively. The percentage difference in costs between
implementing a carbon neutral strategy for renewable technologies with and without
using energy efficiency initially for Cosmos is 19% ($107 million) and for Sinclair 28%
($51 million).
A problem with implementing a carbon neutral strategy for Cosmos and Sinclair is that
the long payback periods exceed the current expected lifetime of the mines. If more ore
bodies are found at Cosmos or Sinclair, which would increase the life of the mine, it
may become feasible for XNA to look towards implementing renewable technologies.
5.2.3 Metering and Data Collection Strategy
The metering and data collection strategy for Cosmos and Sinclair would be to initially
look towards improving the current data analysis systems through developing a
spreadsheet or database that combines all of the information from KPIs, the EMB and
GHG emissions rather than triple handling the information. For Cosmos’ current EMB it
is important that data validation checks are undertaken to ensure that all of the
information is carried across properly, and potentially the spreadsheet could be altered
to have a cell that checked for data abnormalities.

46
For Sinclair, it is vital that Sinclair install their extra meters and begin recording so that
they better capture the energy flows around the site. Sinclair would also benefit from
more frequent and consistent meter reading, similar to what is currently done at
Cosmos where the meters are read once a day.
A fuel management system would be beneficial for both Cosmos and Sinclair to ensure
that fuel keys were being entered correctly and reduce spills which would result in total
energy savings of 3,100 GJ for Cosmos and 1,240 GJ for Sinclair. There would be a
negative net benefit for the implementation of the systems, which may make it difficult
to create a business case for implementing the system, since it would cost Cosmos
$40,256 and Sinclair $116,102 over a four year period.
Another issue that is currently being addressed onsite, but it is important that it is
carried through, is identifying the diesel discrepancies in the Diesel EOM and Power
station report and the unaccounted power between the meters and sub-meters. The
diesel discrepancies are believed to be more accurate from the information in the
Diesel EOM however, it needs to be further investigated for the difference in the Power
Station report. For Cosmos it would be to further investigate why the meters were faulty
and for Sinclair it would be to further investigate why they have little confidence in their
power station fuel meters, particularly since they are reporting these fuel values to
KPS.
In the future it would be beneficial, on an analysis basis, for both Cosmos and Sinclair
to look towards a automated data acquisition system, as analysed in the opportunity
analysis. By moving towards an automated data acquisition system it would help to
better identify energy flows around site, it would reduce the current problems with the
data monitoring system that were identified in the metering and data collection
analysis, such as inconsistent data collection, time taken to collect information and
human error.

47
6.0 EEO REPORTING
As per the requirements of the EEO program, XNA is required to submit an annual
report for the results from their 2010/2011 energy analysis. These reports encompass
energy efficient opportunities that were identified at both Cosmos and Sinclair, and do
not include the opportunities identified for renewable energy sources, offsetting
opportunities and metering and data analysis equipment. For their second report XNA
is only required to submit a public EEO report by 31 December 2011, which is required
to be available through their website and is shown in Table 6.
Table 6: XNA’s Public EEO Report
XNA is required to submit their second government report for the 2012/2013 analysis
by 31 December 2013. The government report is submitted to DRET and includes
more detailed information that the public report. The structure of the government report
has been included (Table 7) to illustrate the differences in reporting requirements from
the public and government report. The public EEO report provides a summary of the
opportunities identified based on their accuracy (<30% or >30%). The information
includes the number of opportunities, the estimated energy savings and the payback
period for the opportunities. The government EEO report expands on this information
by specifying the energy type of the opportunities and includes the annual net financial
benefits of implementing the opportunities.

48
Table 7: XNA’s Government EEO Report

49
7.0 CONCLUSION
The purpose of this report was to analyse the energy usage at XNA’s Cosmos and
Sinclair Nickel operations and then to identify and evaluate energy efficient
opportunities as required by the EEO program. In addition, the GHGs emitted by the
sites were also analysed to determined what would be required to move the sites
towards carbon neutrality.
Cosmos and Sinclair’s energy usage was determined using the available metering and
data analysis information that was obtained through site visits to Cosmos and Sinclair.
The carbon emissions from both Cosmos and Sinclair were also analysed for
determining what would be required for moving the sites towards carbon neutrality. The
energy usage was analysed using graphical representations and Sankey diagrams to
illustrate energy flows. During the analysis of Cosmos’ and Sinclair’s energy usage the
metering and data analysis information, which included Cosmos’ EMB, was also
analysed to determine how these systems could be improved.
Following the data analysis, potential energy efficient opportunities were identified as
required by the EEO program through engaging with on-site personnel, renewable
energy source and offsetting opportunities were investigated for moving the sites
towards carbon neutrality, and improvements to the current metering and data analysis
equipment were also analysed. These opportunities were then assessed of their
feasibility for implementation through a multi-criterion analysis and marginal abatement
cost curve. Four opportunities were identified at Cosmos and Sinclair based on their
high abatement potentials and net benefits which were spinning reserve reduction,
reactive load sharing, ventilation telemetry and VSD on primary fans for Cosmos, and
fuel additives, more cyclones, guaranteed fuel economy and backfill transport for
Sinclair.
Three strategies were outlined which included the strategy recommended for
implementation, a strategy for moving towards carbon neutrality and a strategy for
metering and data analysis. The recommended strategy, which included the top four
initiatives, would reduce the energy usage and carbon emissions for both sites and
also provide a net benefit for their implementation. The carbon neutrality strategy was
determined to have high capex and payback periods and it would be difficult to create a
business case for the move towards carbon neutrality based on the current life of the
mines. A few opportunities were outlined for the metering and data analysis strategy

50
since better metering and data analysis does not result in any direct energy savings so
initial opportunities with no costs were recommended with the recommendation for
looking in the future to implementing better data analysis systems.
Finally, the public and government EEO reports for XNA were included as per their
reporting requirements for EEO for the 2010/2011 period which outlined the energy
efficient opportunities that were identified and summarised the potential energy savings
and net benefits from those opportunities.

51
8.0 RECOMMENDATIONS
Since the EEO program is an ongoing process, Cosmos and Sinclair will need to
continue to assess their energy usage, to identify potential energy efficient
opportunities, to determine if the options are viable for implementation based on the
energy savings and the net financial benefits and report annually to DRET. Further
work needs to be undertaken at both Cosmos and Sinclair on the initial opportunities
that were identified to determine their viability for implementation, which is currently
being re-analysed by Energetics and then requires analysis by XNA personnel.
To ensure that there is better energy data analysis, Sinclair will need to ensure that
their extra meters are fitted and more frequent and consistent metering reading is
undertaken.
Both Cosmos and Sinclair would benefit from developing a spreadsheet or database
that incorporates the energy information for calculating their KPI information, their EMB
and their GHG emissions to prevent triple handling of information and ensures that the
calculations are more consistent. For Cosmos, two problems that were identified with
their EMB, was that the final diesel value calculated in the EMB didn’t align with the
Diesel EOM often due to the reconciliation value, and the total kWh for the gensets
were too high when the meters were reset in the power station report. This problem
could be overcome, to prevent inaccurate information being entered, by manually
checking if the fuel values aligned in the EMB and the diesel EOM and if the genset
efficiency which indicated if the meter was reset if the values were too high or through
entering in a cell in the spreadsheet to check for abnormalities in the spreadsheet.
While the potential of moving Cosmos and Sinclair to carbon neutrality was identified
as not feasible due to financial reasons and the life time of the mine as illustrated in the
table below, further research could be done since renewable technologies are
continually reducing in price and for the potential of further ore bodies being found on-
site which would increase the life of the mine and mean the move to carbon neutrality
would be financially beneficial for XNA.

52
Site Description Capex Payback period Considerations
Car
bon
Neu
tral
ity S
trat
egy
Cosmos
Implementing energy efficiency opportunities first, then implementing renewable technologies (Solar PV – cheapest option)
$451 million
14 years
Mine expected to be running in 2017 (6 years)
Cosmos
Implementing energy efficiency opportunities first, then implementing offsetting opportunities (cheapest option)
$741,200 Voluntary investment
Sinclair
Implementing energy efficiency opportunities first, then implementing renewable technologies (Solar PV – cheapest option)
$134 million 7 years Life of mine 2
years
Sinclair
Implementing energy efficiency opportunities first, then implementing offsetting opportunities (cheapest option)
$281,520 - Voluntary investment

53
9.0 BIBLIOGRAPHY
Annandale, David and Ross Lantzke. 2000. Making Good Decisions: A Guide to Using Decision-Aiding Techniques in Waste Facility Siting. Perth, WA: Murdoch University.
Baños, R., F. Manzano-Agugliaro, F.G. Montoya, C. Gil, A. Alcayde and J. Gómez. 2010. Optimisation methods applied to renewable and sustainable energy: A review”. Renewable and Sustainable Energy Reviews 15: 1753-1766.
Beggs, Clive. 2009. Energy: Management, Supply and Conservation. Oxford, UK: Elsevier.
Berry, Stephen. 2010. “Towards net zero carbon homes”. Master of Science in Renewable Energy Dissertation, Murdoch University.
Clean Energy Future a. Australian Government. 2011. Additional Action Beyond our National Targets. Accessed 20 October 2011. http://www.cleanenergyfuture.gov.au/additional-action-beyond-our-national-targets/.
Clean Energy Future b. Australian Government. 2011. How a Carbon Price Works. Accessed 6 November 2011. http://www.cleanenergyfuture.gov.au/clean-energy-future/carbon-price/how-a-carbon-price-works/.
Climate Changers Now. 2009. Xstrata Nickel Australasia Cosmos Nickel Project West Perth Office: Energy Audit (Level 1): Report – September 2009. Perth, WA: Climate Changers Now.
Climate Changers Now. 2009. Xstrata Nickel Australasia Cosmos Nickel Project West Perth Office: Energy Audit (Level 1): Report – September 2009. Perth, WA: Climate Changers Now.
ComLaw. Australian Government. 2006. Energy Efficiency Opportunities Act 2006. Accessed 20 October 2011. http://www.comlaw.gov.au/Details/C2006A00031.
CSIRO. 2011. Unlocking Australia’s Energy Potential. Newcastle, NSW: CSIRO. Daniel, Mike and Greg Lane. 2008. Energy Efficiency Processes and Measurement:
Ausenco’s Perspective. Accessed online 18 July 2011, http://www.ceecthefuture.org/abstracts/energy-efficiency-processes-and-measurement-ausencos-perspective.
Department of Climate Change. 2009. National Greenhouse Accounts (NGA) Factors. Barton, ACT: Department of Climate Change.
Department of Energy & Climate Change (DECC). 2009. Guidance on Carbon neutrality. London, England: Department of Energy & Climate Change.
Department of Resources, Energy and Tourism a. 2008. Energy Efficiency Opportunities: Industry Guidelines. Barton, ACT: Australian Government.
Department of Resources, Energy and Tourism a. 2010. Energy Efficiency Opportunities: Assessment Handbook. Barton, ACT: Department of Resources, Energy and Tourism.
Department of Resources, Energy and Tourism b. 2008. Energy Savings Measurement Guide: How to Estimate, Measure, Evaluate and Track Energy Efficiency Opportunities. Barton, ACT: Department of Resources, Energy and Tourism.
Department of Resources, Energy and Tourism b. 2010. Energy Efficiency Opportunities: Energy Mass Balance: Mining. Barton, ACT: Australian Government.
Department of Resources, Energy and Tourism c. 2010. Energy Savings Measurement

54
Guide: How to Estimate, Measure, Evaluate and Track Energy Efficiency Opportunities. Barton, ACT: Department of Resources, Energy and Tourism.
Department of Resources, Energy and Tourism d. 2010. Significant Opportunities Register – Mining. Accessed 16 June 2011, http://www.ret. gov.au/energy/ efficiency/eeo/ resmaterial/ Pages/ default.aspx.
Edwards, Reginald. 2010. “Electrical Design for a 10kW Photovoltaic Trough Concentrator System installed at the Murdoch University South Street Campus”. Bachelor of Engineering Thesis, Murdoch University.
Energetics. 2010. Cosmos Energy mass balance tool. Perth, WA: Energetics. Energetics. 2010. Cosmos Mine Xstrata Nickel Australasia Energy Efficiency
Opportunities (EEO) Assessment Outcomes. Perth, WA: Energetics. Environment Australia. 2002. Energy Efficiency: Best Practice Environmental
Management in Mining. Canberra, ACT: Environment Australia. Fidock, Brendan. 2010. “The A1 Wind Farm: An investigation into the voltage control,
network support capability and stability of the A1 distribution network”. Bachelor of Engineering Thesis, Murdoch University.
Galaxy Resources. 2011. Mt Cattlin. Accessed 17 June 2011, http://www.galaxyresources.com.au/pro_raven_mt_cattlin.shtml.
Garnaut, Ross. 2008. The Garnaut Climate Change Review. Port Melbourne, VIC: Cambridge University Press.
Insight Economics. 2006. Energy Efficiency – Policy Measures to Reduce Greenhouse Gas Emissions. Melbourne, VIC: Insight Economics.
International Mining. 2010. Galaxy Resources to use solar and wind energy at Australian lithium mine. Accessed 17 June 2011, http://www.im-mining.com/2010/05/12/galaxy-resources-to-use-solar-and-wind-energy-at-australian-lithium-mine/.
Jenkins, Melissa. 2011. First carbon-neutral apartments coming to the Carlton Brewery site in Sydney. Accessed 21st June 2011, http://www.news.com.au/money/property/first-carbon-neutral-apartments-coming-to-the-carlton-brewery-site-in-sydney/story-e6frfmd0-1226013210736.
Kenjle, Vikram Dhanaji. 2004. “Energy Efficiency: Strategies for a large mining operation in Western Australia”. Master of Science Dissertation, Murdoch University.
Maribyrnong City Council. 2008. Becoming Carbon Neutral Action Plan Report. Melbourne, VIC.: Maribyrnong City Council.
Martin, James. 2011. West Australia’s first 100% renewable-powered mine: Wind and Solar. Accessed 30 June 2011, http://www.solarchoice.net.au/blog/west-australias-first-100-renewable-powered-mine-wind-and-solar/.
McKinsey & Company. 2008. An Australian Cost Curve for Greenhouse Gas Reduction. Sydney, N.S.W.: McKinsey & Company.
Milo, Aitor, Haizea Gaztañaga, Ion Etxeberria-Otadui, Seddik Bacha and Pedro Rodriguez. 2010. “Optimal Economic Exploitation of Hydrogen Based Grid-friendly zero
energy buildings”. Renewable Energy 36: 197-205. Nathan, Graham and Stephen Grano. n.d. Emerging Renewable Energy Technologies
for Remote Mine Sites. Adelaide, SA: The University of Adelaide. Niederberger, Anne Arquit, Condrad Brunner, Kejun Jiang and Ying Chen. 2005.
“Energy Efficiency in China: The Business Case for Mining an Untapped Resource”. Greener Management International 50: 25-41.
Office of Energy. 2011. Strategic Energy Initiative Directions Paper. Perth, WA:

55
Government of Western Australia. Rampling, Joshua. 2011. Galaxy utilizes renewables in mining. Accessed 17 June
2011, http://www.sciencewa.net.au/Minerals-and-Resources/Minerals-and-Resources/Galaxy-utilises-renewables-in-mining.html.
Rea, Michael. 2006. Zero Carbon House Project. Accessed 26th June 2011, http://www.zerocarbonhouse.com/Home.aspx.
Scanlon, Joel. 2011. Galaxy Resources Receives Recognition for Sustainable Energy at Mt. Cattlin Lithium Mine. Accessed 17 June 2011, http://www.azomining.com/news.aspx?newsID=3804.
Seidl, Reinhard. 2010. “A Scalable Approach to Energy Improvements: Using Energy Management and Control Systems.” Strategic Planning for Energy and the Environment 29 (3): 6-25.
Sinclair, Hamish. 2008. “Carbon Neutral Cities: The need for more sustainable development options in response to climate change”. Thesis project, University of New South Wales.
Taylor, A. C. and T. D. Fletcher. 2005. Triple-Bottom Line Assessment of Urban Stormwater Projects. Victoria, Australia: Monash University.
Thompson, Andrew. 2011. A miner moves to renewables to power its site. Accessed 17 June 2011, http://www.abc.net.au/news/stories/2011/04/05/3.
Xstrata Nickel Australasia. 2011. Xstrata Nickel Australasia 2011 Energy Overview. Perth, WA: Xstrata Nickel.
Xstrata Nickel Holdings Pty Limited. 2010. Energy Efficiency Opportunities Government & Public Report. Perth, WA: Xstrata Nickel Holdings Pty Limited.
Xstrata Nickel. 2011. Xstrata Nickel Brochure. Accessed 18 July 2011. http://www.xstratanickel.com/EN/Publications/Publications/Xstrata%20Nickel%20Brochure_English.pdf.
Xstrata. 2007. Sustainable Development Policy. Accessed 18 July 2011. http://www.xstrata.com/sustainability/ourapproach/policy/.
Xstrata. 2008. Sustainable Development Standards. Accessed 18 July 2011. http://www.xstrata.com/content/assets/pdf/x_sus_sdstandards2008.en.pdf.
Xstrata. 2011. Business Principles. Accessed 18 July 2011. http://www.xstrata.com/sustainability/downloads/businessprinciples/.
Zahedi, A. 2010. “Maximizing Solar PV Energy Penetration Using Energy Storage Technology”. Renewable and Sustainable Energy Reviews 15: 866-870.

56
10.0 APPENDICES

57
10.1 Energy Costs
Throughout the 2010/2011 reporting period there have been increases with the energy
costs for diesel and natural gas. Figure 33 shows a slight rise in diesel costs with an
increase of $0.10/L, and Figure 34 shows a significant rise in the cost of natural gas of
$2.23/GJ for the year. Despite the significant rise in natural gas, the overall unit cost for
electricity cost for Cosmos was lower than Sinclair, as shown in Figure 35, with an
overall increase over the year of $0.03/kWh for Cosmos and $0.02/kWh for Sinclair.
Figure 33: Variation in Unit Cost of Diesel over 2010/2011 Period
Figure 34: Variation in Unit Cost of Natural Gas over 2010/2011 Period
Figure 35: Variation in Unit Cost of Electricity (energy only) for Cosmos and Sinclair over
2010/2011 Period

58
10.2 Xstrata Sustainable Development (SD) Standards
Sustainable development (SD) can be defined as “development that meets the needs of the present without compromising the ability of future generations to meet their own needs” (Brundtland Commission 1987). We can also say it is where the economic, social and environmental needs are met. Xstrata has 17 SD standards: Table 8: Xstrata Sustainable Development Standards
Xstrata Standard Description
Std 1: Leadership, Strategy and Accountability
Proactive leadership, SD incorporated at all levels of organisation, Performance plans for all employees, Defined roles and responsibilities
Std 2: Planning and Resources
Annual SD plans: consultation, targets, documented, reviewed quarterly.
Std 3: Behaviour, Awareness and Competency
All employees have identified roles and are aware of SD and safety responsibilities.
Std 4: Communication and Engagement
Internal and external stakeholders are to be involved in the development and review of the SD program. Group Sustainability Report to be prepared annually.
Std 5: Risk and Change Management SD risks identified, including during changes in operations.
Std 6: Catastrophic Hazards Assess, plan and review Catastrophic changes in operations Std 7: Legal Compliance and Document Control Keep up to date with legal requirements.
Std 8: Operational Integrity Maintain operational integrity of plant, equipment, structures, processes and protective systems, including assessments and reviews.
Std 9: Health and Occupational Hygiene
Health assessments (pre-employment and throughout employment), hazard identification and appropriate health care for employees
Std 10: Environment, Biodiversity and Landscape Functions
Impact assessment, minimise harm, conserve resources, education and awareness programs.
Std 11: Contractors, Suppliers and Partners
SD must be considered when selecting Contractors – SD targets and responsibilities are to be specified. Consider local contractors as part of sustainable community development.
Std 12: Social and Community Engagement
Social involvement plan and community strategy to be developed to enhance socio-economic capability and sustainability
Std 13: Life Cycle Management – Projects and Operations
SD to be considered during all phases of projects, including exploration, operation and mine closure. SD risks from new plant equipment & infrastructure to be assessed.
Std 14: Product Stewardship SD impacts from Xstrata’s products and services to be assessed, including recycling and disposal.
Std 15: Incident Management Incident management via investigation, corrective actions, documentation and communication
Std 16: Monitoring and Review
Annual management review of all SD plans and policies, SD inspections and audits.
Std 17: Emergencies, Crises and Business Continuity
HSEC emergency and business crises planned for, people trained in emergency response

59
10.3 Australia’s Energy Usage
Compared to other OECD countries, Australia’s emissions per person is significantly
higher and even more so when compared to the World Average, as shown in Figure
36. When assessing industries within Australia (Figure 37), mining does account for a
reasonable percentage of emissions. In terms of energy demand, in Western Australia,
mining is one of the higher demanding sectors which is evident in Figure 38.
Figure 36: Australia and OECD & World Averages per capita GHG emissions 2005 (Garnaut
2008)
Figure 37: Emissions Attributable to Australian Industry by Sector 2006 (Garnaut 2008)
Figure 38: Primary Energy Demand in WA by Sector 2008-2009 (Office of Energy 2011)

60
10.4 Additional Information
Attached CD includes Excel spreadsheets:
MAC Curve;
MCA; and
XNA Risk Register.