Embed Size (px)
Citation preview

Comparable Outcomes: Scourge or Scapegoat? Tom Benton
Cambridge Assessment Research Report 12th September 2016
2
Author contact details: Tom Benton ARD Research Division Cambridge Assessment 1 Regent Street Cambridge CB2 1GG [email protected] http://www.cambridgeassessment.org.uk/ Cambridge Assessment is the brand name of the University of Cambridge Local Examinations Syndicate, a department of the University of Cambridge. Cambridge Assessment is a not-for-profit organisation. How to cite this publication: Benton, T. (2016). Comparable Outcomes: Scourge or Scapegoat? Cambridge Assessment Research Report. Cambridge, UK: Cambridge Assessment.
3
Table of contents Introduction ................................................................................................................................. 4
What is the comparable outcomes approach and what is its real effect? ................................. 4 Ofsted requirements .................................................................................................................... 6 The effect of added leniency in grading ..................................................................................... 14 Conclusion ................................................................................................................................ 17 References ............................................................................................................................... 18

4
Introduction On the face of it the paradox is straightforward. Two arms of government (the DfE and Ofsted) attempt to drive improvement in schools and want to see this recognised in improved GCSE results. Meanwhile another arm of government, the exams regulator Ofqual, has expressed concerns about “grade inflation” damaging public confidence in the examination system, and has implemented an approach known as comparable outcomes to ensure that exam results will remain stable at a national level. This leads to understandable concern about the coherence of government strategy towards the use of GCSE data. Such concerns were expressed in an article in the TES by the general secretary of the Association of Teachers and Lecturers, Dr Mary Bousted. She wrote that improving GCSE results year-on-year “seems a reasonable expectation until you realise that it is impossible for secondary schools to do so, because schools in England are cursed by the yoke of comparative outcomes”1. This report explores these concerns in more detail and, in particular, looks at the relationship between changes in GCSE results and the ratings given to schools by Ofsted.
What is the comparable outcomes approach and what is its real effect? The “comparable outcomes” approach was first (officially) applied to new GCSEs introduced in 20112 (see Ofqual, 2011). This means that, under usual circumstances, the aim is that “roughly the same proportion of students will achieve each grade as in the previous year.” (Ofqual, 2012, page 2). In theory this would mean that if any individual school improves its results then this must be balanced out by another school’s results deteriorating somewhere else. In practice, the way in which comparable outcomes is applied is somewhat complicated (see Benton and Sutch, 2014, for further details). Specifically it should be noted that the calculations are based only on:
Candidates who are in year 113
Candidates in maintained non-selective schools. Pupils in selective or independent schools are not used within calculations.
Candidates with matching prior attainment data from Key Stage 2 (KS2) tests in English and Maths.
Typically this means that only around 80 per cent of 16 year old candidates are retained within calculations for most GCSEs, with this percentage often dropping below 60 per cent for GCSEs offered by the Welsh Awarding Organisation (AO) WJEC. Further details on match rates can be found in Appendix 4 of Benton and Sutch (2014). Using the historical KS2 data from these matched candidates enables AOs to predict what percentage of their candidates they would expect to achieve each grade within the current year for each GCSE. Grade boundaries are then identified on each GCSE that will yield percentages of candidates achieving each grade close to these predictions. Although KS2 is heavily used to determine the grade distribution at a national level this, of course, does not directly translate to individual pupils – the grade they receive depends upon the effort they put in and the number of marks they achieve in GCSE examinations and is not pre-determined by their prior attainment It should also be noted that the above selection criteria for inclusion in calculations do not mean that independent and selective schools gain an unfair advantage or that comparable outcomes
1 TES article on 8
th December 2015. https://www.tes.com/news/school-news/breaking-views/englands-secondary-heads-and-
teachers-are-stuck-a-zero-sum-game. 2 Similar techniques were applied (perhaps less rigorously) for many years before this and the precise methodology has doubtless
been amended since 2011. An updated version of Ofqual’s approach can be found in Ofqual (2012). 3 Identified by date of birth these pupils will have their sixteenth birthday within the academic year.

5
does not apply to them. Within an AO, the same exam papers and grade boundaries are applied to all candidates from all schools. Thus, although the comparable outcomes calculations are based upon non-selective maintained schools only, the same grade boundaries derived thus will also affect other schools. Because of this, although results for maintained non-selective schools are kept stable, if these schools narrow the gap (in terms of actual examination marks) with selective and independent schools the latter will see their results in terms of grades fall. On the other hand, if the gap widens then independent and selective schools will see more pupils achieving higher grades. It should be noted that the baseline against which outcomes are to be made “comparable” is also a matter of judgement. Typically this will use results from pupils taking exams in June in previous years. However, in order to account for changing entry patterns, sometimes a different baseline will be used. For example:
In 2014, for GCSE Maths the official procedures stated that predictions should be based on historical achievement “in the academic year 2012/13” (see Ofqual 2014, page 6, emphasis added). Thus predictions were based on achievement of pupils across an entire academic year rather than restricted to achievement of pupils in June. This change was applied to account for the removal of the January session and the fact that many high ability pupils now had to wait until June to take GCSE Mathematics.
Similarly, in 2015, for GCSE English the official procedures stated that predictions should be based on historical achievement “in the academic year 2013/14” (see Ofqual 2015a, page 7, emphasis added). This change was applied to account for the decrease in the numbers of pupils entering GCSE English in the November of Year 11 rather than waiting until the end of the academic year4.
Finally it should be noted that the predictions derived from comparable outcomes are not absolutely binding. To begin with, AOs’ final awards may differ from predictions up to a defined tolerance (typically +/- 1 percentage point for large entry GCSEs) without the need to justify the decision to the regulator. Awards may also differ from predictions by more than this amount but the AO involved must provide a written justification. This is not particularly unusual and occurred for 1 in 6 of the GCSE awards where comparable outcomes were applied in 2015 (37 out of 220 awards, see Ofqual, 2015b). The majority of these out of tolerance awards allowed a larger number of higher grades than suggested by comparable outcomes5. When all of the above considerations are taken into account it can be seen that the proportion of candidates awarded higher grades and above is not precisely fixed. In fact, reviewing the JCQ’s publication of GCSE results for June 20156 reveals several striking changes in GCSE results. For example:
Large changes in the percentage of candidates achieving C or above can be seen in GCSE English and GCSE Leisure and Tourism. In GCSE English the percentage of all candidates achieving C and above rose from 61.7 in 2014 to 65.4 in 2015. In Leisure and Tourism the change was from 33.8 per cent to 41.4 per cent.
On a smaller scale, for GCSE Mathematics the percentage of all candidates achieving C and above rose from 62.4 in 2014 to 63.3 in 2015. This last rise is obviously very small but is not very different from the kind of rises that were seen before comparable outcomes were officially applied (see JCQ GCSE results statistics for 2009 and 2010).
4 This decrease probably related to changes that were announced in the way in which results from early entries would be used within
school performance measures (see https://www.gov.uk/government/news/changes-to-early-entry-at-gcse). Although these changes were announced prior to November 2013 (the 2013/14 academic year) the number of November entries only dropped substantially in November 2014. 5 See https://ofqual.blog.gov.uk/2015/10/16/trends-in-out-of-tolerance-awards/.
6 http://www.jcq.org.uk/examination-results/gcses/2015.

6
The above examples are included to encourage a sense of perspective. GCSE awarding is a complex process and, even if the philosophy of comparable outcomes implies that results won’t rise, in reality they may do. Nonetheless, it is certainly true that the regulator is actively attempting to keep any such rises under control. As such, it is worth further exploring what the impact is upon individual schools and in particular, the extent to which potentially increased difficulty in improving their results may impact upon a school’s Ofsted rating.
Ofsted requirements To begin with we examine the notion that comparable outcomes limits the number of schools who can achieve good Ofsted ratings. This impression has not always been helped by the way in which Ofsted has used GCSE data in its annual reports. In particular, the 2014 annual report (Ofsted, 2014) seemed not to notice the use of comparable outcomes when stating that “improvement in secondary schools has stalled” with part of the evidence for this statement being that “GCSE results have not risen over the last three years” (page 4). That Ofsted used GCSE results statistics in this way is all the more surprising since Glenys Stacey (the head of Ofqual at the time) wrote to Michael Wilshaw (the current head of Ofsted) in September 2012 stating that “one consequence of this [comparable outcomes] approach is that it is less likely that schools as a whole will be able to evidence improvement with better exam results, year after year. Unlike in past years we do not expect to see year-on-year increases in attainment” (emphasis added)7. The same letter goes on to say that comparable outcomes “will have implications for you [Ofsted], given that exam results are part of the evidence base that you use in inspecting and reporting on schools”. Despite these warnings, a lack of any rise in GCSE results at the national level was used by Ofsted as indicating a problem with the secondary school system. Having said this, it should be noted that Ofsted’s most recent annual report (Ofsted, 2015) does not repeat this error and instead focusses upon regional variation in GCSE results – an issue that is not affected by comparable outcomes. However, a potentially more pressing problem is the impact of comparable outcomes on inspection results for individual schools. As part of Ofsted’s Common Inspection Framework, Ofsted inspectors need to make judgements about schools in the following areas:
effectiveness of leadership and management,
quality of teaching, learning and assessment
personal development, behaviour and welfare, and
outcomes for pupils. Each of these areas is judged on a four point scale (outstanding, good, requires improvement and inadequate). These judgements then feed into the overall rating given to a school on the same scale with ratings of good or outstanding only likely to be awarded if ratings of good or outstanding are achieved in all four areas (Ofsted, 2015, pages 34 to 37). The criteria for making judgements in each area make several references to the extent of progress made by pupils as evidenced in examinations. In a few places within the School Inspection Handbook (Ofsted, 2015) explicit reference is made to whether progress is rising. These instances are listed below:
As one of the grade descriptors used to identify outstanding effectiveness of leadership and management is the statement that “The school’s actions have secured substantial improvement in progress for disadvantaged pupils. Progress is rising across the
7 http://webarchive.nationalarchives.gov.uk/20141031163546/http:/www.ofqual.gov.uk/files/2012-09-06-letter-to-sir-michael-
wilshaw.pdf?Itemid=145.
7
curriculum, including in English and mathematics.” (page 43, emphasis added). Note that the grade descriptors are “not a checklist” (page 42) and that inspectors are looking for the description that is the best fit to the school. Thus, it is possible that a school could achieve an outstanding rating for effective leadership and management even if GCSE results (measured in terms of pupils’ progress since KS2) were not rising. It should also be noted that the descriptors for a good rating on this scale do not include a requirement that results are rising overall. Instead the descriptors state that “Leaders and governors are ambitious for all pupils and promote improvement effectively. The school’s actions secure improvement in disadvantaged pupils’ progress, which is rising, including in English and mathematics.” (page 43, emphasis added). This descriptor does not require that results are improving overall - only that they are improving for disadvantaged pupils. It should be noted that such improvement is by no means ruled out by the comparable outcomes approach which only fixes the grade distribution overall (for certain pupils). A national reduction in the gap between disadvantaged pupils and the rest, and a concomitant improvement in results for disadvantaged pupils is perfectly possible within this framework. Similar comments could be made about the descriptors for an inadequate school in this area which state that “Leaders are not aware of, or are not taking effective action to stem, the decline in the progress of disadvantaged pupils” (page 44) but do not include any requirements about trends in the school’s results overall.
In the general description of how inspectors will make judgements about outcomes for pupils the Handbook notes that inspectors will “give most weight to the progress of pupils currently in the school, taking account of how this compares with the progress of recent cohorts, where relevant” (page 54). This certainly indicates that inspectors should be aware of trends in a school’s GCSE results but, at this point in the Handbook, does not specifically state how this will impact upon the rating they are given.
More specifically, amongst the eight grade descriptors for schools with outstanding outcomes for pupils are included two statements that “From each different starting point, the proportions of pupils making and exceeding expected progress in English and in mathematics are high compared with national figures. The progress of disadvantaged pupils matches or is improving towards that of other pupils nationally” and that “The attainment of almost all groups of pupils is broadly in line with national averages or, if below these, it is improving rapidly” (page 57, emphases added). Again it is worth noting that the grade descriptors are not a checklist and it is possible for schools to achieve an outstanding rating without meeting every one of them. It is also worth noting that the requirements for improvement in results only relate to disadvantaged pupils or to “almost all groups of pupils” if their attainment is not even broadly in line with national averages.
Two descriptors amongst the seven listed for schools with good outcomes for pupils relate to improvements. The first of these8 is unproblematic for comparable outcomes as it relates to the gaps between groups of pupils and is essentially unaffected by the approach taken towards deciding upon grade boundaries. However, the second descriptor states that “Pupils’ progress is above average or improving across most subject areas. Overall progress of disadvantaged pupils, disabled pupils and those with special educational needs is above average or improving.” As such, it is potentially directly relevant. Having said this, even this statement allows that progress may be “above average” or “improving”. In other words, improvement is only expected amongst schools that are performing below expectations. Obviously, by the definition of average, some schools need to be performing below this but the implication here is that in a good school this should not be a long term situation. In contrast, the grade descriptors for inadequate schools state that “the proportions of pupils in different year groups making or exceeding expected progress in English or in mathematics are consistently low and show little or no improvement.” (page 58).
8 “In a wide range of subjects, the progress of disadvantaged pupils, disabled pupils and those with special educational needs
currently on roll is close to or is improving towards that of other pupils with the same starting points.”, page 58 of the Handbook.
8
To summarise the above we can see that:
1. Improvement is never an absolute requirement for a particular rating but may be listed amongst the other descriptors inspectors use to find the best fit to a rating for a school.
2. Statements requiring improvements in the gaps between groups of pupils, such as between disadvantaged pupils and others, are more frequent than those requiring absolute improvement in school results. Such reductions in gaps are not prohibited by the use of comparable outcomes in awarding.
3. Even where absolute improvements are mentioned in a grade descriptor these are generally only required for schools that are not already performing above average. The Handbook does not require that good schools should be consistently improving the results for all pupils year on year.
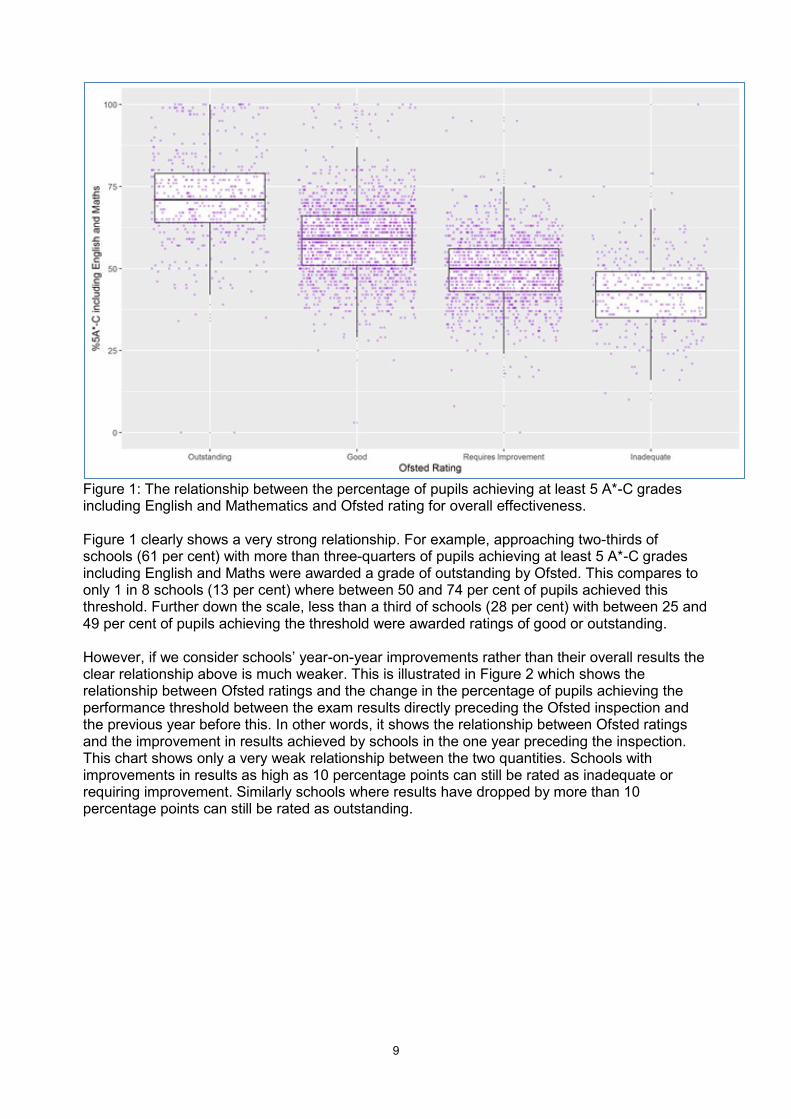
Notwithstanding the unfortunate use of GCSE results in the Ofsted 2014 annual report, the above inspection of the Handbook does not appear to reveal any particular clash between the approach of comparable outcomes and requirements of school inspectors in terms of the evidence they expect schools to show. Despite the above analysis we might legitimately ask whether improvements in school results appear strongly related to the Ofsted grades they are awarded in practice. This question was analysed empirically by matching grades from Ofsted inspections9 to information published on exam results within the DfE’s performance tables10. To begin with we can see that there is indeed a very strong relationship between overall exam performance and the grades awarded by Ofsted. Figure 1 shows the relationship between the percentage of students in a school achieving 5 or more A*-C grades including English and Maths, and the grade for overall effectiveness awarded by Ofsted. Analysis is based on all inspections between September 2010 and December 201511. The summer exam results directly preceding the inspection are used for analysis and only schools with at least 100 pupils completing KS4 at the relevant time are included meaning that a total of 3,873 inspections are included within analysis. Each point in Figure 1 represents a school, the boxes indicate the inter-quartile range of results within each rating, and the centre lines indicate the median.
9 Downloaded from .gov.uk websites such as https://www.gov.uk/government/statistics/maintained-schools-and-academies-
inspections-and-outcomes-as-at-31-december-2015 (and similar for most recent inspections at end of 2011, 2012, 2013, and 2014). 10
Data downloaded from https://www.compare-school-performance.service.gov.uk/download-data. Ofsted results are matched to
DfE data using URNs. 11
Schools may be counted more than once if they were inspected multiple times within this period.
9
Figure 1: The relationship between the percentage of pupils achieving at least 5 A*-C grades including English and Mathematics and Ofsted rating for overall effectiveness. Figure 1 clearly shows a very strong relationship. For example, approaching two-thirds of schools (61 per cent) with more than three-quarters of pupils achieving at least 5 A*-C grades including English and Maths were awarded a grade of outstanding by Ofsted. This compares to only 1 in 8 schools (13 per cent) where between 50 and 74 per cent of pupils achieved this threshold. Further down the scale, less than a third of schools (28 per cent) with between 25 and 49 per cent of pupils achieving the threshold were awarded ratings of good or outstanding. However, if we consider schools’ year-on-year improvements rather than their overall results the clear relationship above is much weaker. This is illustrated in Figure 2 which shows the relationship between Ofsted ratings and the change in the percentage of pupils achieving the performance threshold between the exam results directly preceding the Ofsted inspection and the previous year before this. In other words, it shows the relationship between Ofsted ratings and the improvement in results achieved by schools in the one year preceding the inspection. This chart shows only a very weak relationship between the two quantities. Schools with improvements in results as high as 10 percentage points can still be rated as inadequate or requiring improvement. Similarly schools where results have dropped by more than 10 percentage points can still be rated as outstanding.

10
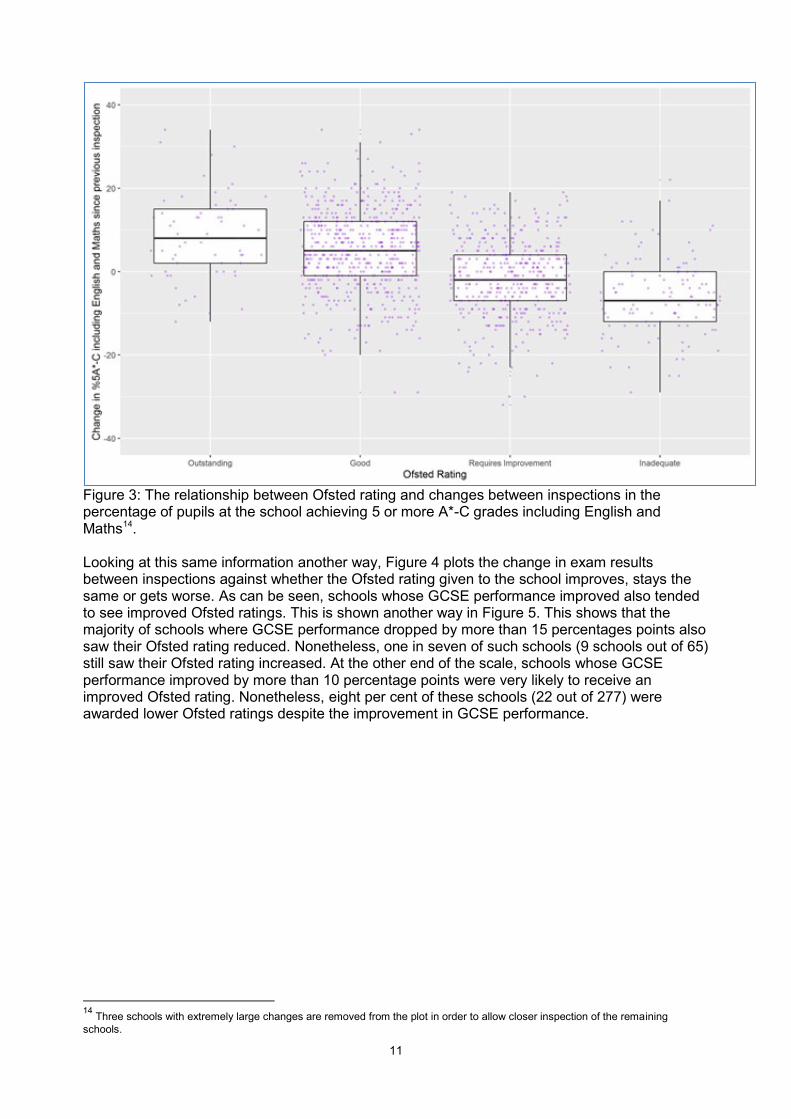
Figure 2: The relationship between Ofsted ratings and the one-year improvement in the percentage of pupils achieving at least 5 A*-C grades including English and Maths12. However, Figure 2 only considers the relationship with improvements over the one year leading up to the inspection. A more realistic way of looking at this is perhaps to consider improvements in results since the last time the school was inspected by Ofsted. In order to explore this, analysis is restricted to schools with two Ofsted inspections (in different academic years) between September 2010 and December 201513. A total of 1,173 schools are included in this analysis and the relationship between their Ofsted rating and the change in results since the last inspection is shown in Figure 3. As can be seen, when viewed in this way, a slightly stronger relationship emerges. In particular, good and outstanding schools have a tendency to have improved their results between inspections whilst those in the lower two categories generally haven’t. Nonetheless, more than a quarter of schools rated as good have decreased performance between inspections and almost half rated as requiring improvement have improved their results. As might be expected given what is written in the Handbook, improvements in results appear to feed in to Ofsted judgements but are not an absolute requirement.
12
Analysis restricted to schools with published exam results for both years required for analysis going back to 2010. A total of 3,091
inspections are included in analysis. 13
Restricted to schools where this was easily identifiable using their URN. Schools that have changed their URN will be excluded
from analysis. Schools are only included once in Figure 3 based on their two most recent inspections.
11
Figure 3: The relationship between Ofsted rating and changes between inspections in the percentage of pupils at the school achieving 5 or more A*-C grades including English and Maths14. Looking at this same information another way, Figure 4 plots the change in exam results between inspections against whether the Ofsted rating given to the school improves, stays the same or gets worse. As can be seen, schools whose GCSE performance improved also tended to see improved Ofsted ratings. This is shown another way in Figure 5. This shows that the majority of schools where GCSE performance dropped by more than 15 percentages points also saw their Ofsted rating reduced. Nonetheless, one in seven of such schools (9 schools out of 65) still saw their Ofsted rating increased. At the other end of the scale, schools whose GCSE performance improved by more than 10 percentage points were very likely to receive an improved Ofsted rating. Nonetheless, eight per cent of these schools (22 out of 277) were awarded lower Ofsted ratings despite the improvement in GCSE performance.
14
Three schools with extremely large changes are removed from the plot in order to allow closer inspection of the remaining
schools.

12
Figure 4: Relationship between changes in the percentage of pupils achieving 5 or more A*-C grades including English and Maths and changes in Ofsted ratings15.
Figure 5: Relationship between changes in the percentage of pupils achieving 5 or more A*-C grades including English and Maths and changes in Ofsted ratings
15
Three schools with extremely large changes are removed from the plot to allow closer examination of the remaining schools. Note
that this plot remains virtually identical if schools whose original rating was outstanding or inadequate are removed (so that both improved and worse Ofsted ratings are possible).

13
Overall therefore, the analysis in this section shows that although improved performance is not a prerequisite of a good Ofsted rating, the two are clearly associated. Indeed the empirical results are consistent with what we might expect given the information provided in the inspections Handbook. The Handbook certainly states that improvements in results are something that inspectors should consider in reaching a judgement. However, they are not absolutely necessary – particularly amongst schools where achievement is already high. Thus, it is clear that there is no glaring inconsistency between the use of comparable outcomes in GCSE awarding and the use of GCSE results data by Ofsted. Comparable outcomes concerns results at an aggregate level for all students. In contrast, Ofsted place most emphasis on reducing the gap between disadvantaged and other pupils and only explicitly looks for improvements for all pupils in schools that are already performing below expectations. Of course, whether GCSE results provide a reliable basis on which to judge the quality of schools and teaching at all is an open question16. However, if GCSE results are to be used for this purpose in the ways suggested by Ofsted, comparable outcomes does not in itself invalidate this.
16
See for example, Goldstein and Leckie (2008) for one view on this debate.
14
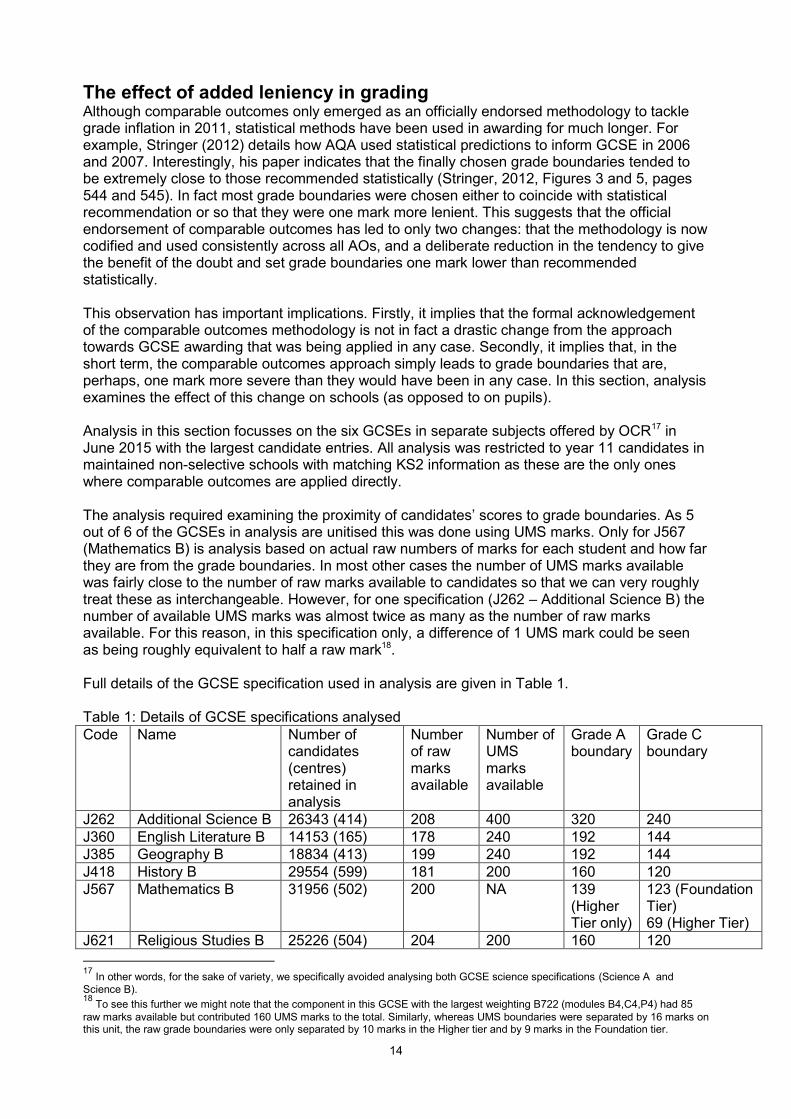
The effect of added leniency in grading Although comparable outcomes only emerged as an officially endorsed methodology to tackle grade inflation in 2011, statistical methods have been used in awarding for much longer. For example, Stringer (2012) details how AQA used statistical predictions to inform GCSE in 2006 and 2007. Interestingly, his paper indicates that the finally chosen grade boundaries tended to be extremely close to those recommended statistically (Stringer, 2012, Figures 3 and 5, pages 544 and 545). In fact most grade boundaries were chosen either to coincide with statistical recommendation or so that they were one mark more lenient. This suggests that the official endorsement of comparable outcomes has led to only two changes: that the methodology is now codified and used consistently across all AOs, and a deliberate reduction in the tendency to give the benefit of the doubt and set grade boundaries one mark lower than recommended statistically. This observation has important implications. Firstly, it implies that the formal acknowledgement of the comparable outcomes methodology is not in fact a drastic change from the approach towards GCSE awarding that was being applied in any case. Secondly, it implies that, in the short term, the comparable outcomes approach simply leads to grade boundaries that are, perhaps, one mark more severe than they would have been in any case. In this section, analysis examines the effect of this change on schools (as opposed to on pupils). Analysis in this section focusses on the six GCSEs in separate subjects offered by OCR17 in June 2015 with the largest candidate entries. All analysis was restricted to year 11 candidates in maintained non-selective schools with matching KS2 information as these are the only ones where comparable outcomes are applied directly. The analysis required examining the proximity of candidates’ scores to grade boundaries. As 5 out of 6 of the GCSEs in analysis are unitised this was done using UMS marks. Only for J567 (Mathematics B) is analysis based on actual raw numbers of marks for each student and how far they are from the grade boundaries. In most other cases the number of UMS marks available was fairly close to the number of raw marks available to candidates so that we can very roughly treat these as interchangeable. However, for one specification (J262 – Additional Science B) the number of available UMS marks was almost twice as many as the number of raw marks available. For this reason, in this specification only, a difference of 1 UMS mark could be seen as being roughly equivalent to half a raw mark18. Full details of the GCSE specification used in analysis are given in Table 1. Table 1: Details of GCSE specifications analysed
Code Name Number of candidates (centres) retained in analysis
Number of raw marks available
Number of UMS marks available
Grade A boundary
Grade C boundary
J262 Additional Science B 26343 (414) 208 400 320 240
J360 English Literature B 14153 (165) 178 240 192 144
J385 Geography B 18834 (413) 199 240 192 144
J418 History B 29554 (599) 181 200 160 120
J567 Mathematics B 31956 (502) 200 NA 139 (Higher Tier only)
123 (Foundation Tier) 69 (Higher Tier)
J621 Religious Studies B 25226 (504) 204 200 160 120
17
In other words, for the sake of variety, we specifically avoided analysing both GCSE science specifications (Science A and
Science B). 18
To see this further we might note that the component in this GCSE with the largest weighting B722 (modules B4,C4,P4) had 85
raw marks available but contributed 160 UMS marks to the total. Similarly, whereas UMS boundaries were separated by 16 marks on this unit, the raw grade boundaries were only separated by 10 marks in the Higher tier and by 9 marks in the Foundation tier.
15
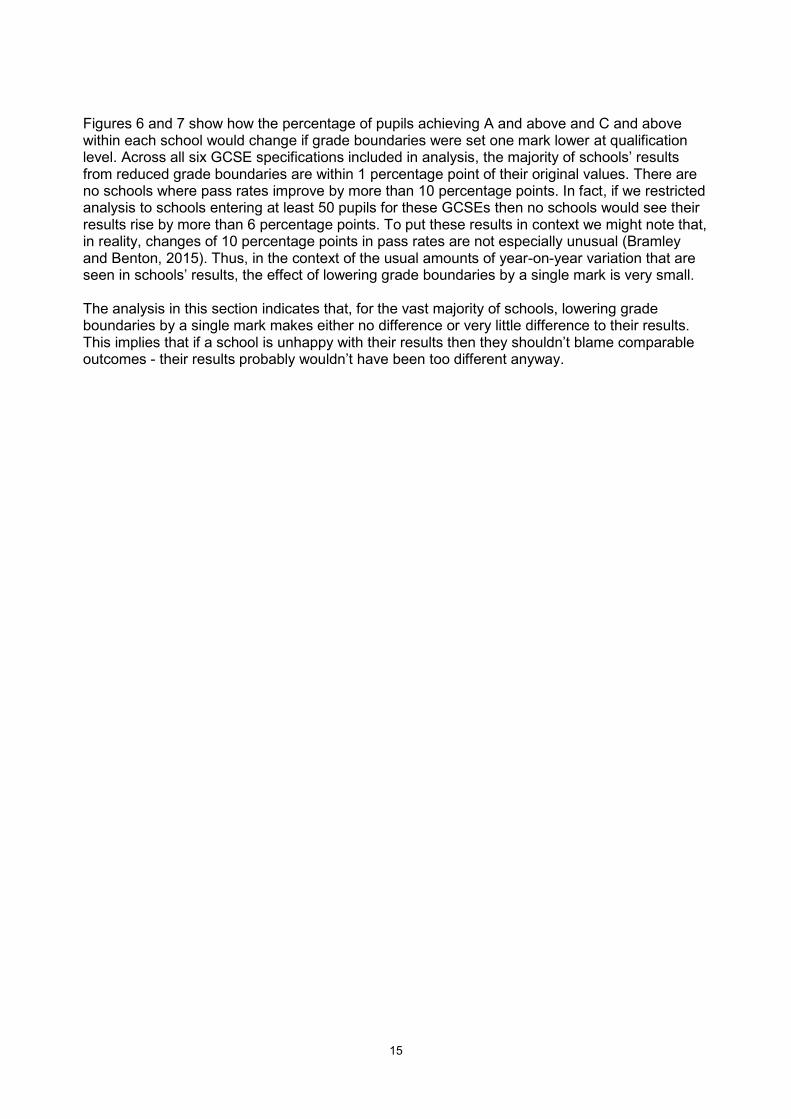
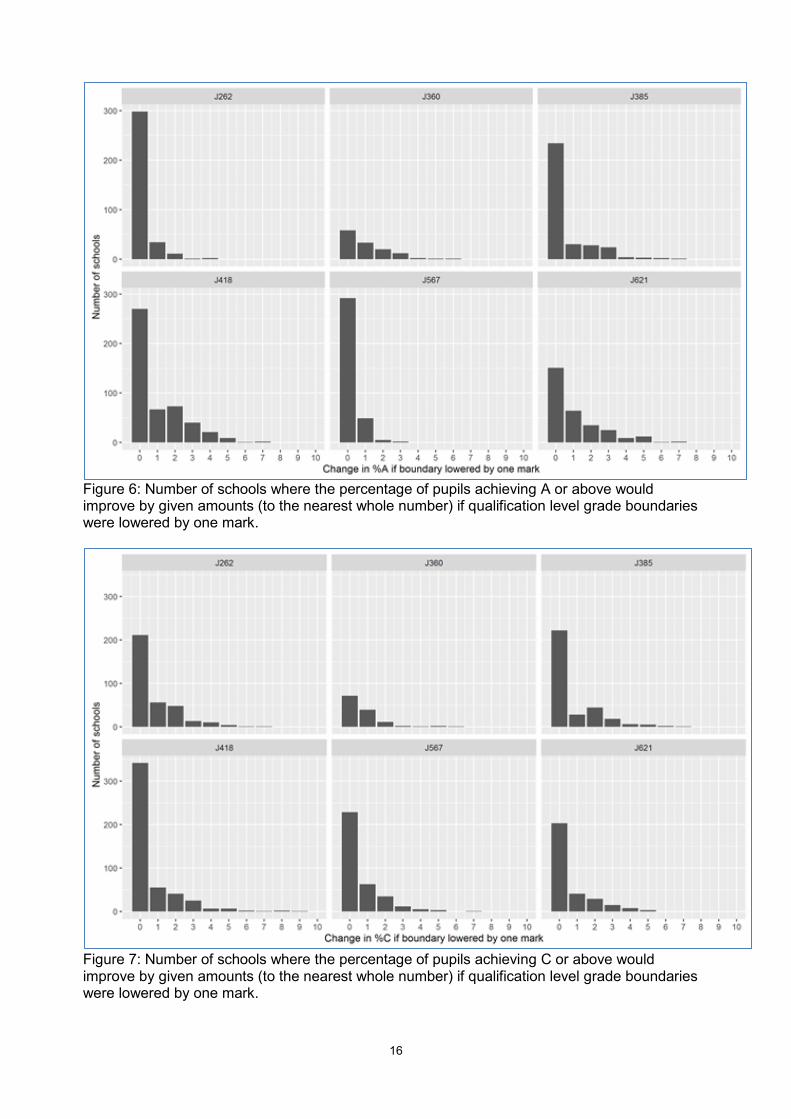
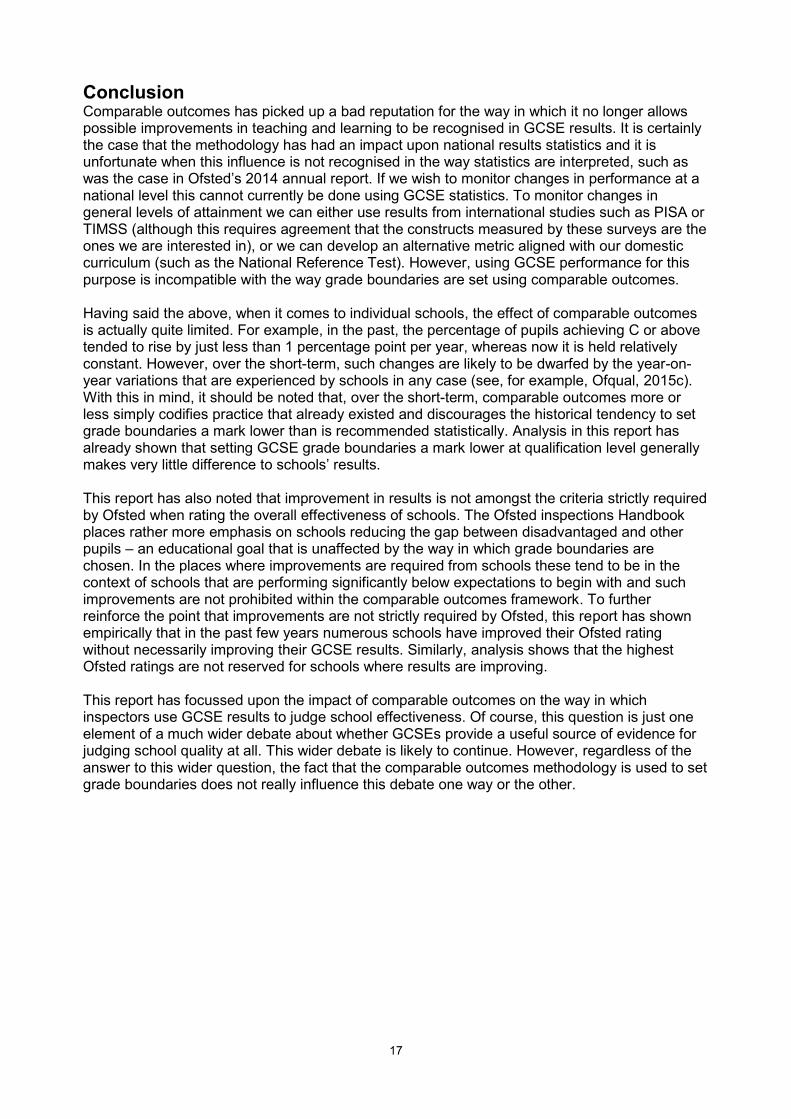
Figures 6 and 7 show how the percentage of pupils achieving A and above and C and above within each school would change if grade boundaries were set one mark lower at qualification level. Across all six GCSE specifications included in analysis, the majority of schools’ results from reduced grade boundaries are within 1 percentage point of their original values. There are no schools where pass rates improve by more than 10 percentage points. In fact, if we restricted analysis to schools entering at least 50 pupils for these GCSEs then no schools would see their results rise by more than 6 percentage points. To put these results in context we might note that, in reality, changes of 10 percentage points in pass rates are not especially unusual (Bramley and Benton, 2015). Thus, in the context of the usual amounts of year-on-year variation that are seen in schools’ results, the effect of lowering grade boundaries by a single mark is very small. The analysis in this section indicates that, for the vast majority of schools, lowering grade boundaries by a single mark makes either no difference or very little difference to their results. This implies that if a school is unhappy with their results then they shouldn’t blame comparable outcomes - their results probably wouldn’t have been too different anyway.
16
Figure 6: Number of schools where the percentage of pupils achieving A or above would improve by given amounts (to the nearest whole number) if qualification level grade boundaries were lowered by one mark.
Figure 7: Number of schools where the percentage of pupils achieving C or above would improve by given amounts (to the nearest whole number) if qualification level grade boundaries were lowered by one mark.
17
Conclusion Comparable outcomes has picked up a bad reputation for the way in which it no longer allows possible improvements in teaching and learning to be recognised in GCSE results. It is certainly the case that the methodology has had an impact upon national results statistics and it is unfortunate when this influence is not recognised in the way statistics are interpreted, such as was the case in Ofsted’s 2014 annual report. If we wish to monitor changes in performance at a national level this cannot currently be done using GCSE statistics. To monitor changes in general levels of attainment we can either use results from international studies such as PISA or TIMSS (although this requires agreement that the constructs measured by these surveys are the ones we are interested in), or we can develop an alternative metric aligned with our domestic curriculum (such as the National Reference Test). However, using GCSE performance for this purpose is incompatible with the way grade boundaries are set using comparable outcomes. Having said the above, when it comes to individual schools, the effect of comparable outcomes is actually quite limited. For example, in the past, the percentage of pupils achieving C or above tended to rise by just less than 1 percentage point per year, whereas now it is held relatively constant. However, over the short-term, such changes are likely to be dwarfed by the year-on-year variations that are experienced by schools in any case (see, for example, Ofqual, 2015c). With this in mind, it should be noted that, over the short-term, comparable outcomes more or less simply codifies practice that already existed and discourages the historical tendency to set grade boundaries a mark lower than is recommended statistically. Analysis in this report has already shown that setting GCSE grade boundaries a mark lower at qualification level generally makes very little difference to schools’ results. This report has also noted that improvement in results is not amongst the criteria strictly required by Ofsted when rating the overall effectiveness of schools. The Ofsted inspections Handbook places rather more emphasis on schools reducing the gap between disadvantaged and other pupils – an educational goal that is unaffected by the way in which grade boundaries are chosen. In the places where improvements are required from schools these tend to be in the context of schools that are performing significantly below expectations to begin with and such improvements are not prohibited within the comparable outcomes framework. To further reinforce the point that improvements are not strictly required by Ofsted, this report has shown empirically that in the past few years numerous schools have improved their Ofsted rating without necessarily improving their GCSE results. Similarly, analysis shows that the highest Ofsted ratings are not reserved for schools where results are improving. This report has focussed upon the impact of comparable outcomes on the way in which inspectors use GCSE results to judge school effectiveness. Of course, this question is just one element of a much wider debate about whether GCSEs provide a useful source of evidence for judging school quality at all. This wider debate is likely to continue. However, regardless of the answer to this wider question, the fact that the comparable outcomes methodology is used to set grade boundaries does not really influence this debate one way or the other.

18
References Benton, T. and Sutch T. (2014). Analysis of the use of Key Stage 2 data in GCSE predictions. Ofqual, Ofqual/14/5471, Coventry. Downloaded from https://www.gov.uk/government/uploads/system/uploads/attachment_data/file/429074/2014-06-16-analysis-of-use-of-key-stage-2-data-in-gcse-predictions.pdf on 28th June 2016. Bramley, T. and Benton, T. (2015). Volatility in exam results. Cambridge Assessment Research Report Cambridge, UK: Cambridge Assessment. Downloaded from http://www.cambridgeassessment.org.uk/Images/208853-volatility-in-exam-results.pdf on 28th June 2016. Goldstein, H., and Leckie, G. (2008). School league tables: what can they really tell us? Significance, 5(2), 67-69. Downloaded from http://onlinelibrary.wiley.com/doi/10.1111/j.1740-9713.2008.00289.x/full on 28th June 2016. Ofqual (2011). Maintaining standards in GCSEs and A levels in summer 2011. Downloaded from http://webarchive.nationalarchives.gov.uk/20110718105952/http://www.ofqual.gov.uk/files/2011-05-16-maintaining-standards-gcses-and-alevels-summer-2011.pdf on 23rd June 2016. Ofqual (2012). GCSEs and A Levels in Summer 2012: Our approach to maintaining standards. Downloaded from http://ofqual.gov.uk/documents/gcses-and-a-levels-in-summer-2012-our-approach-to-setting-and-maintaining-standards/ on 3 December 2013. Ofqual (2012). GCSEs and A Levels in Summer 2012: Our approach to maintaining standards. Downloaded from http://ofqual.gov.uk/documents/gcses-and-a-levels-in-summer-2012-our-approach-to-setting-and-maintaining-standards/ on 3 December 2013. Ofqual (2014). Summer 2014 Data Exchange Procedures: GCE, GCSE and Level 1/2 Certificates. Downloaded from http://webarchive.nationalarchives.gov.uk/20140807103743/http://ofqual.gov.uk/documents/summer-2014-data-exchange-procedures-gce-gcse-level-12-certificates/ on 23rd June 2016. Ofqual (2015a). Summer 2015 Data Exchange Procedures: GCE, GCSE and Level 1/2 Certificates. Downloaded from http://dera.ioe.ac.uk/23164/1/Summer_2015_Data_Exchange_Procedures.pdf on 23rd June 2016. Ofqual (2015b). Summer 2015 awards: Out of tolerance summary. Downloaded from https://www.gov.uk/government/uploads/system/uploads/attachment_data/file/468359/Out_of_tolerance_report_GCSE__AS_and_A_level__summer_2015_15-10-15.pdf on 22nd June 2016. Ofqual (2015c). Variability in GCSE Results for Individual Schools and Colleges 2012 to 2015. Downloaded from https://www.gov.uk/government/uploads/system/uploads/attachment_data/file/454912/2015-08-20-variability-in-gcse-results-for-individual-schools-and-colleges.pdf on 29th June 2016. Ofsted (2015). School inspection handbook. Downloaded from https://www.gov.uk/government/uploads/system/uploads/attachment_data/file/458866/School_inspection_handbook_section_5_from_September_2015.pdf on 24th June 2016. Ofsted (2014). The report of Her Majesty’s Chief Inspector of Education, Children’s Services and Skills 2013/14: Schools. Downloaded from https://www.gov.uk/government/publications/ofsted-annual-report-201314-schools-report on 23rd June 2016.

19
Ofsted (2015). The Annual Report of Her Majesty’s Chief Inspector of Education, Children’s Services and Skills 2014/15: education and skills. Downloaded from https://www.gov.uk/government/uploads/system/uploads/attachment_data/file/483347/Ofsted_annual_report_education_and_skills.pdf on 23rd June 2016. Stringer, N. S. (2012). Setting and maintaining GCSE and GCE grading standards: the case for contextualised cohort-referencing. Research Papers in Education, 27(5), 535-554. Downloaded from http://www.tandfonline.com/doi/abs/10.1080/02671522.2011.580364 on 29th June 2016.