Embed Size (px)
Citation preview
Company UpdatePT Waskita Beton Precast Tbk
October 2018

Establishment of Precast Division
Establishment of PT Waskita Beton Precast as subsidiary
October 2014
2013
20142015
2016
IPO PT Waskita Beton Precast Tbk
September 2016
0.62
0.80
1.80
2.65
5x
Public
59.99% 40.01%
2017
3.25
MSCIMay 2017
Buyback 7%Jul – Dec 2017
X
3.50
2018
Precast Division
Production Capacity (Million Ton per Year)
2
IDX 30July 2018
Milestones
Total Asset (in IDR Billion)
LQ-45 & Kompas 100January 2018
1.203
4.332
13.734 14.920
3.104
13.586
15.796 16.378
2014A 2015A 2016A 2017A 2018
FY 9M

Company Group Structure
3
PT Waskita Beton Precast Tbk
Koperasi Waskita0.00005%
PT Waskita Karya (Persero) Tbk59.99995%
Public33.12144%
Treasury Stock6.87861%
PT Waskita Karya (Persero) Tbk
59.99%
PT Waskita Beton Precast Tbk
99.99%
PT Waskita Karya Realty
77.11%
PT Waskita Toll Road PT Waskita Karya Energi
99.99%
Waskita Group
Shareholders Structure

4
To Become Leading Company In Indonesia InManufacturing Sector of Precast, Readymix, Quarry,Construction Service And Post-tension Precast Concrete.
1. Making the product continuously, meeting thecustomer’s requirements as well as be innovative inproduct development and in gaining recognitionfrom customers.
2. Creating competent human resources and experts inthe Precast, Ready Mix, Quarry, ConstructionServices and Posttension Precast ConcreteIndustries.
3. Establishing mutually beneficial relationships withparties that contribute to the company’sadvancement.
3. Employing information technology to increasecompetitiveness.
Vision:
Mission:
Vision & Mission

Precast Readymix
Construction Services
Cibitung(350,000 ton)
Sidoarjo(400,000 ton)
Palembang(200,000 ton)
Kalijati (250,000 ton)
Karawang(450,000 ton)
Bojonegara (350,000 ton)
Subang(350,000 ton)
Klaten(150,000 ton)
Sadang(375,000 ton)
Gasing(350,000 ton)
Legundi (275,000 ton)
Plant (11) : 3.500.000 Ton/Year Batching Plant (73)
Jabodetabek1. Becakayu2. Cakung3. Desari4. Karawaci5. Bocimi 2,36. Japek 1,37. Kunciran – serpong8. Kunciran – parigi9. Cinere – serpong10. Cctw 211. Cibitung – cilincing
Grup PPKA1. Sedomulyo2. Kayuagung 1,2
Sumatera1. Lampung2. Jakabaring 2,33. Bandar agung4. Gunung batin5. Wonokerto
Grup PPTR1. Balamoa 2
Grup PBTR1. Petarukan2. Bojong3. Warung Asem
Grup BSTR1. Kandeman2. Tulis3. Gringsing4. Sumberagung5. Pegandon6. Rejosari7. Kaliwungu 1,28. Ngaliyan
Grup Soker1. Masaran2. Banaran3. walikukun
Grup Paspro1. Muneng 1,22. Tongas3. Grati 14. Leces
Grup Salboy1. Tingkir2. Ampel3. Boyolali4. Banyudono
Grup Legundi1. Legundi2. Tanjung3. boboh4. Tebaloan
5
6. Menggala7. Bujung dewa8. Gilang tunggal9. Wonorejo10. Bumi harapan11. Srigedungmulya12. Simpang
pematang
Line of Business

6
Plant Location
Gasing
Palembang
Bojonegara
Karawang Kalijati
Cibitung
Subang
Sadang Klaten
Sidoarjo
Legundi

7
Line of ProductP
reca
st
L GUTTERU DITCH CCSP U GUTTER DIAFRAGMA WALLFCSP
BOX GIRDER PCI GIRDER
PCU GIRDER
PCT GIRDER SPUN PILE 60cmSQUARE PILE
RC PLATE BARRIER HALF SLABFULL SLAB VOIDED SLAB
SPUN PILE 1,2m
K100 – K1000
Rea
dym
ix
SPRIG WP RC PIPE RAILWAY SLEEPER ELECTRIC POLE
New
Pro
du
cts

Quarry
Truck Mixer
Location
Bojanegara, Cilegon
Pasuruan, Lumbang
Rumpin, Bogor
Salatiga, Boyolali
Talun, Pekalongan
8
Laboratory
Operational Support

9
Becakayu LRT PalembangJakarta - Cikampek Legundi - Bunder
Solo Kertosono Batang - SemarangCCTW I & II Bocimi
Major Projects
10
*
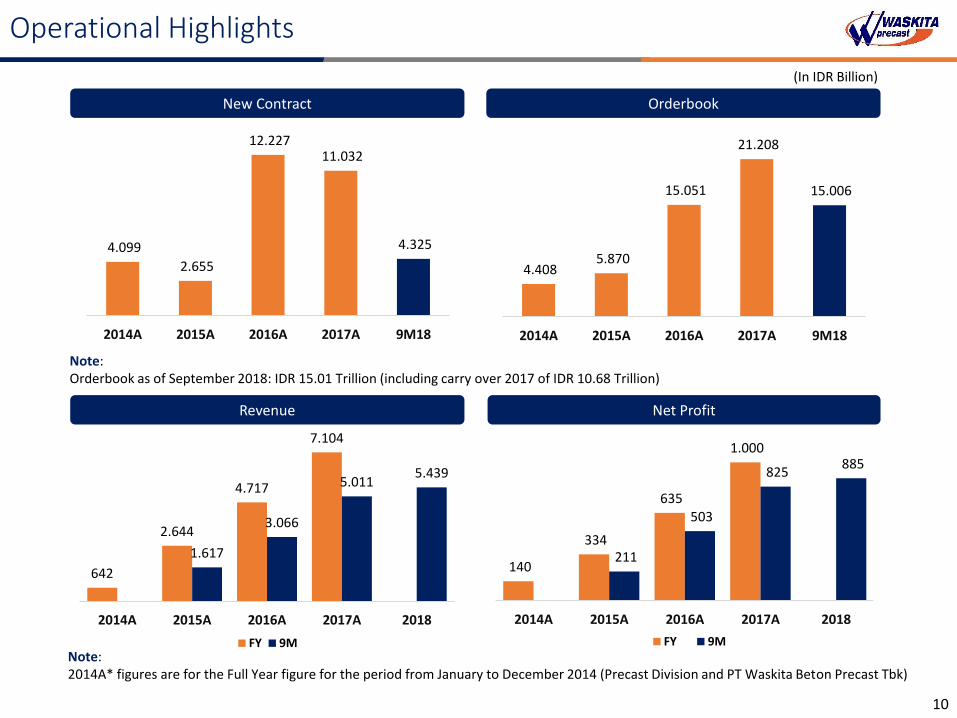
Operational Highlights
New Contract
4.099
2.655
12.227 11.032
4.325
2014A 2015A 2016A 2017A 9M18
4.408 5.870
15.051
21.208
15.006
2014A 2015A 2016A 2017A 9M18
Orderbook
Revenue Net Profit
(In IDR Billion)
Note: 2014A* figures are for the Full Year figure for the period from January to December 2014 (Precast Division and PT Waskita Beton Precast Tbk)
Note: Orderbook as of September 2018: IDR 15.01 Trillion (including carry over 2017 of IDR 10.68 Trillion)
642
2.644
4.717
7.104
1.617
3.066
5.0115.439
2014A 2015A 2016A 2017A 2018
FY 9M
140
334
635
1.000
211
503
825 885
2014A 2015A 2016A 2017A 2018
FY 9M

11
Financial Highlights
Total Equity
Total Asset Total Liabilities
(In IDR Billion)
1.203
4.332
13.734 14.920
3.104
13.586
15.796 16.378
2014A 2015A 2016A 2017A 2018
FY 9M
500
3.002
6.329
7.603
1.991
6.411
7.603
8.927
2014A 2015A 2016A 2017A 2018
FY 9M
702 1.331
7.406 7.317
1.113
7.175 7.516 7.451
2014A 2015A 2016A 2017A 2018
FY 9M

12
Financial Highlights: Financial Position Statements
(In IDR Billion)
Description FY16 FY17 FY17/16 9M17 9M18 9M18/17
Cash and Cash Equivalents 4.205.820 1.028.346 -76% 1.345.846 384.837 -71,4%
Account Receivables 5.626.188 6.627.124 18% 7.920.948 3.776.183 -52,3%
Inventory 231.947 858.693 270% 220.288 2.931.591 1230,8%
Gross Amount 583.726 2.090.744 258% - 4.186.040 -
Fixed Assets 1.932.852 3.148.701 63% 2.731.853 3.469.984 27,0%
Other Assets Account 1.153.733 1.165.940 1% 3.576.983 1.629.706 -54,4%
Total Assets 13.734.267 14.919.548 9% 15.795.918 16.378.340 3,7%
Interest Bearing Debt 3.355.985 4.988.008 48,6% 3.977.557 5.615.738 41,2%
Account Payables 2.433.503 2.318.210 -4,7% 2.830.877 2.781.596 -1,7%
Other Liabilities Account 539.278 296.675 -45,0% 1.471.652 529.746 -64,0%
Total Liabilities 6.328.766 7.602.893 20,1% 8.280.086 8.927.080 7,8%
Total Equity 7.405.501 7.316.655 -1,2% 7.515.832 7.451.261 -0,9%

13
Financial Highlights: Profit and Loss Statements
(In IDR Billion)
Description FY16 FY17 FY17/16 9M17 9M18 1H18/17
Revenues 4.717.150 7.104.158 50,6% 5.011.380 5.438.690 8,5%
Gross Profit 1.219.218 1.948.191 59,8% 1.346.387 1.560.409 15,9%
Operating Profit 1.112.827 1.533.676 37,8% 1.229.053 1.404.101 14,2%
EBITDA 1.229.953 1.908.480 55,2% 1.430.624 1.773.428 24,0%
Other Income/Expenses 52.111 88.120 69,1% 93.198 -34.358 -136,9%
Financial Charges (214.310) (462.208) 115,7% (259.064) (239.153) -7,7%
Net Profit 634.819 1.000.330 57,6% 825.176 884.852 7,2%
Gross Margin 25,8% 27,4% 26,9% 28,7%
Operating Margin 23,6% 21,6% 24,5% 25,8%
EBITDA Margin 26,1% 26,9% 28,5% 32,6%
Net Profit Margin 13,5% 14,1% 16,5% 16,3%
DisclaimerThis material is for information only, and we are not soliciting any action based upon it. This report is not to be construed as an offer to sell or thesolicitation of an offer to buy any security in any jurisdiction where such an offer or solicitation would be illegal. The information herein has beenobtained from sources believed to be reliable, but we do not warrant that it is accurate or complete, and it should not be relied upon as such.Opinion expressed is our current opinion as of the date appearing on this material only, and subject to change without notice. It is intended for theuse by recipient only and may not be reproduced or copied/photocopied or duplicated or made available in any form, by any means, orredistributed to others without written permission of PT Waskita Beton Precast Tbk.
Thank You
Head Office: Gedung Teraskita Jakarta, 3 & 3A Floor Jl. MT. Haryono Kav. No. 10A Cawang, Jakarta 13340Ph. (+6221) 22892999Website: www.waskitaprecast.co.id