Embed Size (px)
Citation preview
Company UpdateFull Year Financial Results28th February 2018
TPI Enterprises LtdABN 26 107 872 453
2
Table of Contents
TPI Background 3
2H 2017 Highlights and Key Priorities 8
2018 Group Outlook 12
Financial Summary 14
Business Unit Focus & Outlook 19
Appendices - GAAP v non-GAAP reconciliation and disclaimer 22
TPI Background
4
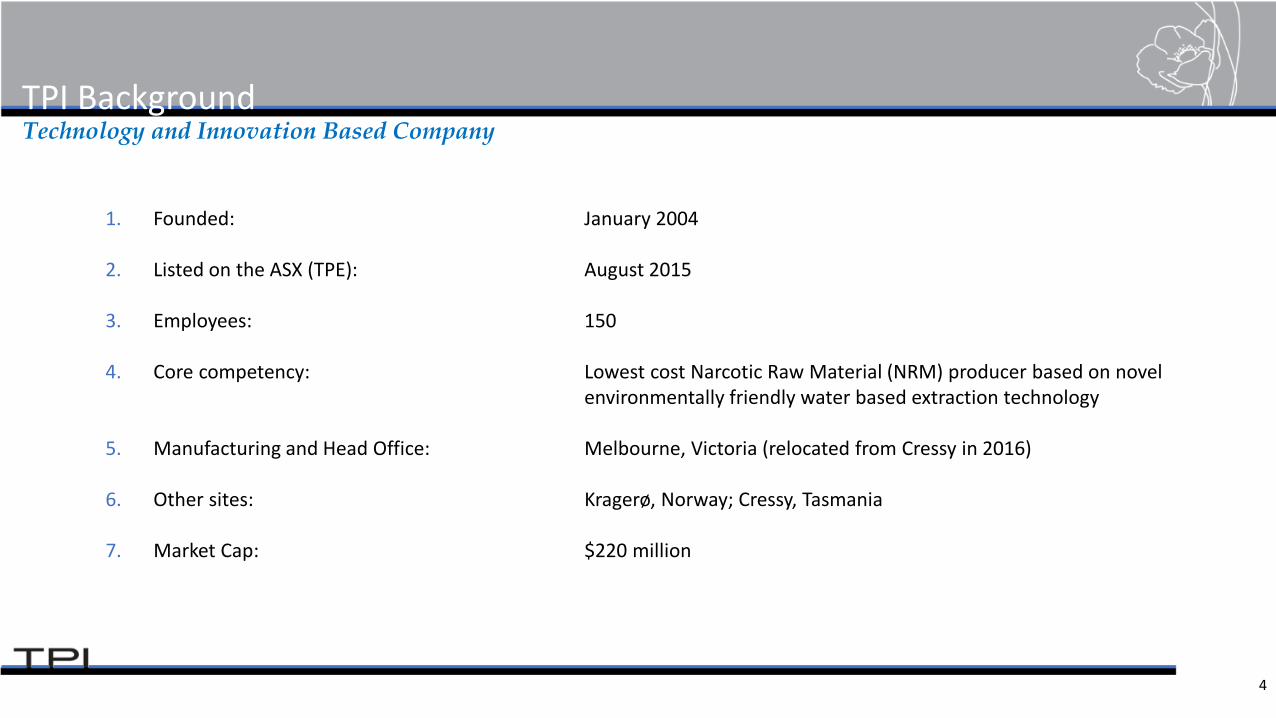
TPI BackgroundTechnology and Innovation Based Company
1. Founded: January 2004
2. Listed on the ASX (TPE): August 2015
3. Employees: 150
4. Core competency: Lowest cost Narcotic Raw Material (NRM) producer based on novel environmentally friendly water based extraction technology
5. Manufacturing and Head Office: Melbourne, Victoria (relocated from Cressy in 2016)
6. Other sites: Kragerø, Norway; Cressy, Tasmania
7. Market Cap: $220 million

5
What We DoOne of Four Fully Integrated Pain Relief Suppliers Globally
1. Source Raw Material (Opium Poppies) globallya. Only company to source in both hemispheres.
2. Extract, isolate and purify and sell Narcotic Raw Material (NRM) at our Melbourne based facilitya. Morphine b. Codeine c. Oripavined. Thebaine
3. Convert NRM into Active Pharmaceutical Ingredients (API) at our Norwegian facility (Codeine Phosphate and Pholcodine) and sell globally
4. Convert to API into Finished Dosage Formulation (FDF) at our Norway facility selling within Scandinavia and the UK
5. Sell poppy seed for culinary purposes globally
6
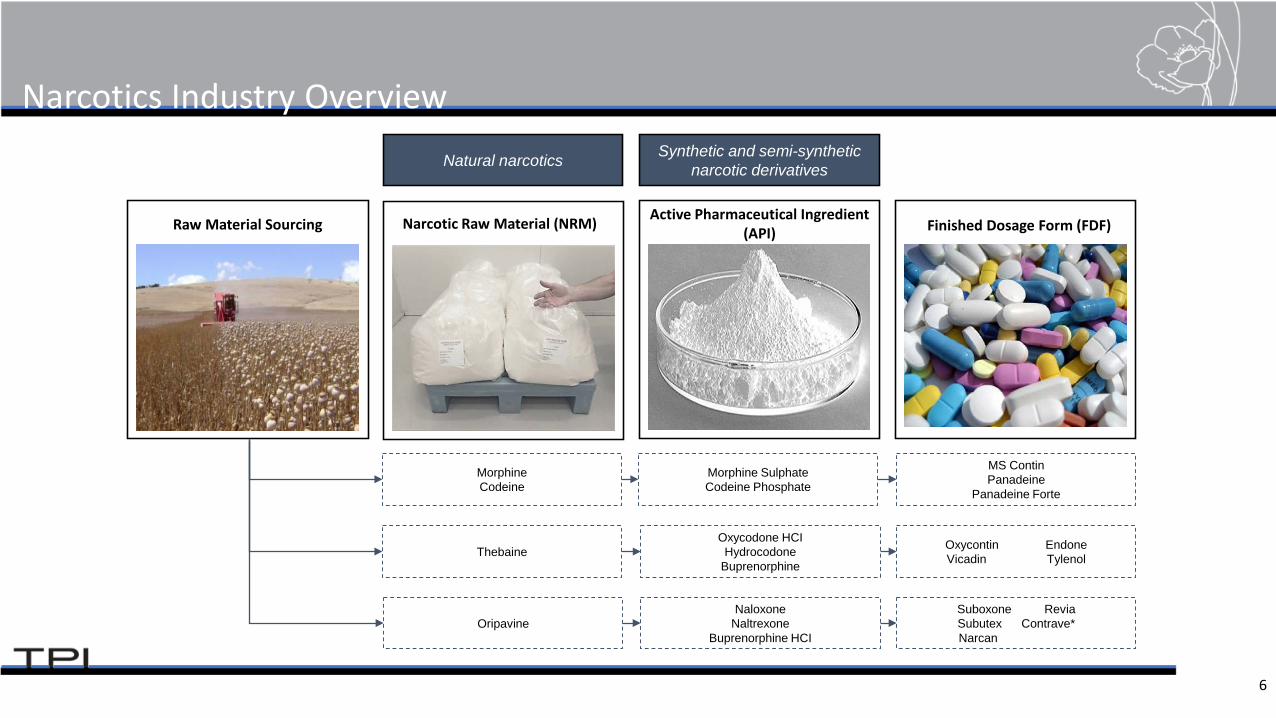
Narcotics Industry Overview
MorphineCodeine
Morphine SulphateCodeine Phosphate
MS ContinPanadeine
Panadeine Forte
ThebaineOxycodone HCIHydrocodone
Buprenorphine
Oxycontin EndoneVicadin Tylenol
OripavineNaloxone
NaltrexoneBuprenorphine HCI
Suboxone ReviaSubutex Contrave*Narcan
Natural narcotics Synthetic and semi-synthetic narcotic derivatives
Finished Dosage Form (FDF)Active Pharmaceutical Ingredient
(API)Raw Material Sourcing Narcotic Raw Material (NRM)
7
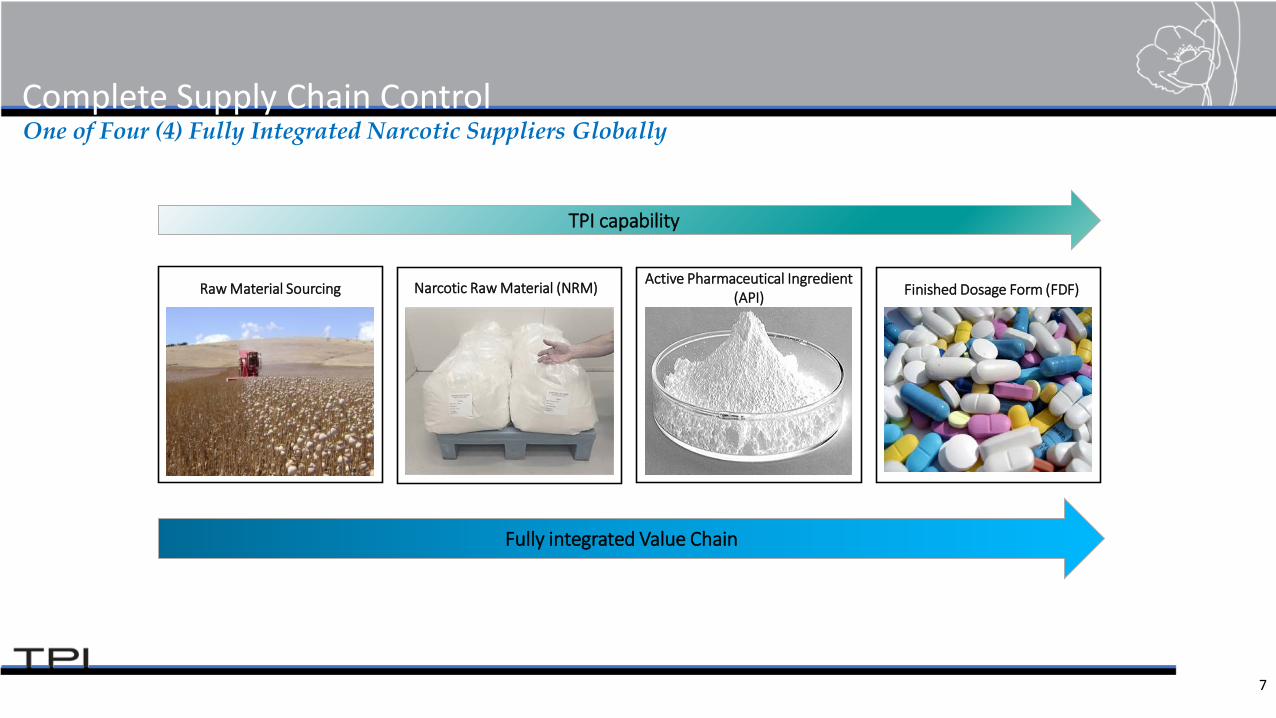
Complete Supply Chain ControlOne of Four (4) Fully Integrated Narcotic Suppliers Globally
Finished Dosage Form (FDF)Active Pharmaceutical Ingredient
(API)Raw Material Sourcing Narcotic Raw Material (NRM)
TPI capability
Fully integrated Value Chain
2nd Half 2017 Highlights & Key Priorities
9
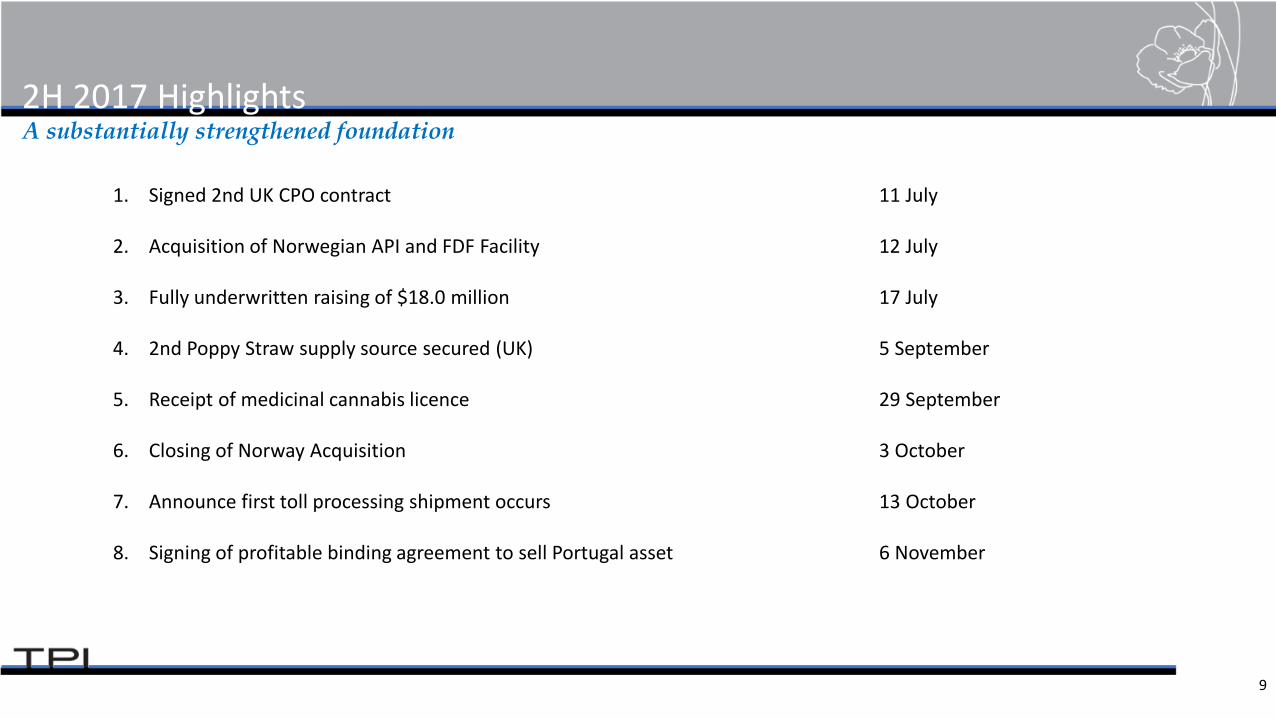
2H 2017 HighlightsA substantially strengthened foundation
1. Signed 2nd UK CPO contract 11 July
2. Acquisition of Norwegian API and FDF Facility 12 July
3. Fully underwritten raising of $18.0 million 17 July
4. 2nd Poppy Straw supply source secured (UK) 5 September
5. Receipt of medicinal cannabis licence 29 September
6. Closing of Norway Acquisition 3 October
7. Announce first toll processing shipment occurs 13 October
8. Signing of profitable binding agreement to sell Portugal asset 6 November

10
2H 2017 Financial performance versus expectationStraw delivery delays impacted 2H 2017 positive EBITDA projection
1. TPI was targeting a positive 2H 2017 operating EBITDA contribution, subject to FX, seed pricing and normal commercial risks.
2. 2H 2017 operating EBITDA of -$3.6m fell short of target.
3. Key drivers of the shortfall were:
a. External straw delays: customs and shipping delays on remaining tolling contract volume and Hungary straw.
b. Additional operating costs: increased labour in anticipation of greater straw volumes through 4Q 2017 which didn’t eventuate.
c. Lower Contract Manufacturing Organisation (‘CMO’) volumes: CPO tablets into the UK.
d. Unplanned plant downtime: Norway API production downtime due to unresolved maintenance issue from prior owner impacted first 6 weeks post acquisition.
4. Tolling contract will continue to be delivered into April 2018.
2H17EBITDAforecast
Strawdelays
Additionaloperating
costs
Lower CMOvolume
Unplannedplant
downtime
2H17EBITDAactual
11
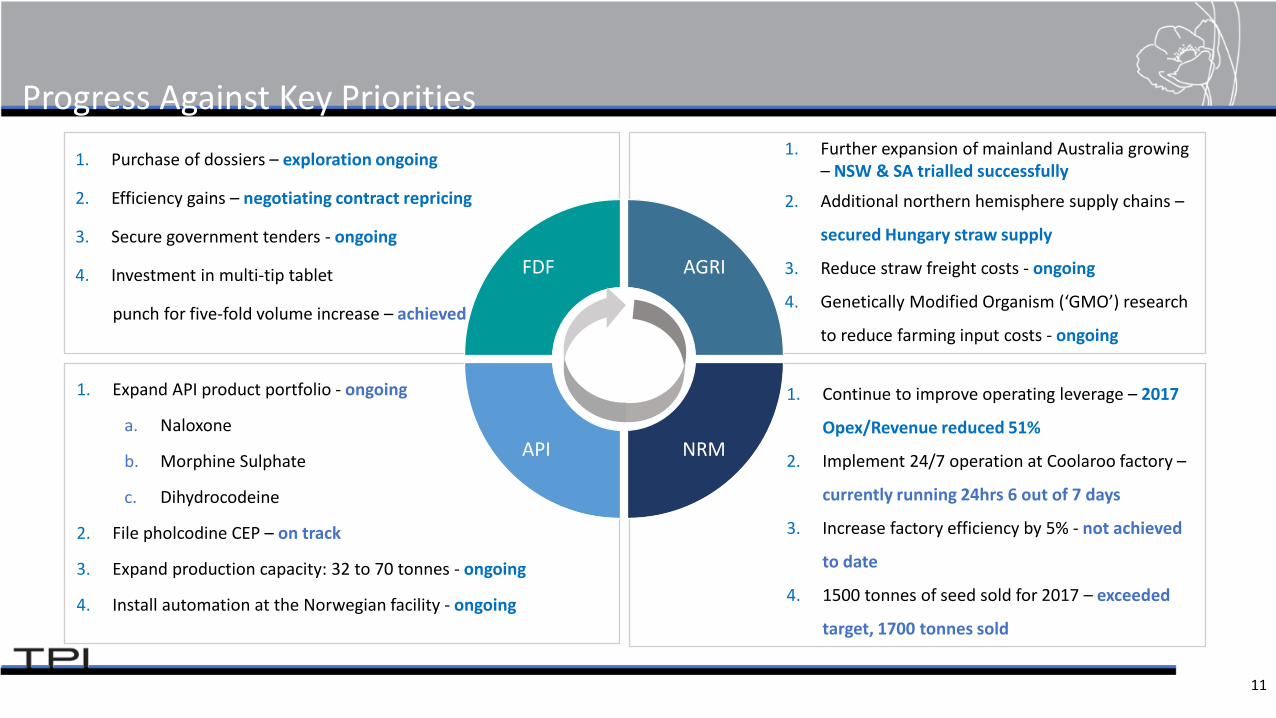
Progress Against Key Priorities1. Purchase of dossiers – exploration ongoing
2. Efficiency gains – negotiating contract repricing
3. Secure government tenders - ongoing
4. Investment in multi-tip tablet
punch for five-fold volume increase – achieved
1. Continue to improve operating leverage – 2017
Opex/Revenue reduced 51%
2. Implement 24/7 operation at Coolaroo factory –
currently running 24hrs 6 out of 7 days
3. Increase factory efficiency by 5% - not achieved
to date
4. 1500 tonnes of seed sold for 2017 – exceeded
target, 1700 tonnes sold
1. Expand API product portfolio - ongoing
a. Naloxone
b. Morphine Sulphate
c. Dihydrocodeine
2. File pholcodine CEP – on track
3. Expand production capacity: 32 to 70 tonnes - ongoing
4. Install automation at the Norwegian facility - ongoing
FDF AGRI
NRMAPI
1. Further expansion of mainland Australia growing – NSW & SA trialled successfully
2. Additional northern hemisphere supply chains –
secured Hungary straw supply
3. Reduce straw freight costs - ongoing
4. Genetically Modified Organism (‘GMO’) research
to reduce farming input costs - ongoing
2018 Group Outlook

13
2018 Group OutlookDelivering material profit growth
1. Forecasting revenue of at least $50m.
2. Expect material operating EBITDA improvement and positive operating EBITDA 1H 2018.
3. Produce and sell at least 45 tonnes of API. Expect direct NRM sales to remain slow, with majority of NRM volume supplied downstream to Norway for further value add.
4. Toll processing at least 10 tonnes of NRM.
5. Sell at least 1,000 tonnes of poppy seed .
6. Expect to more than double Norwegian API production capacity.
7. Implementing an Operational Excellence program for API and FDF.
8. Optimise inventory levels through balancing the NRM supply chain.
9. Explore the acquisition of dossiers to utilise significant granulation, tableting and packaging capacity in Norway for FDF.
Financial Summary
15
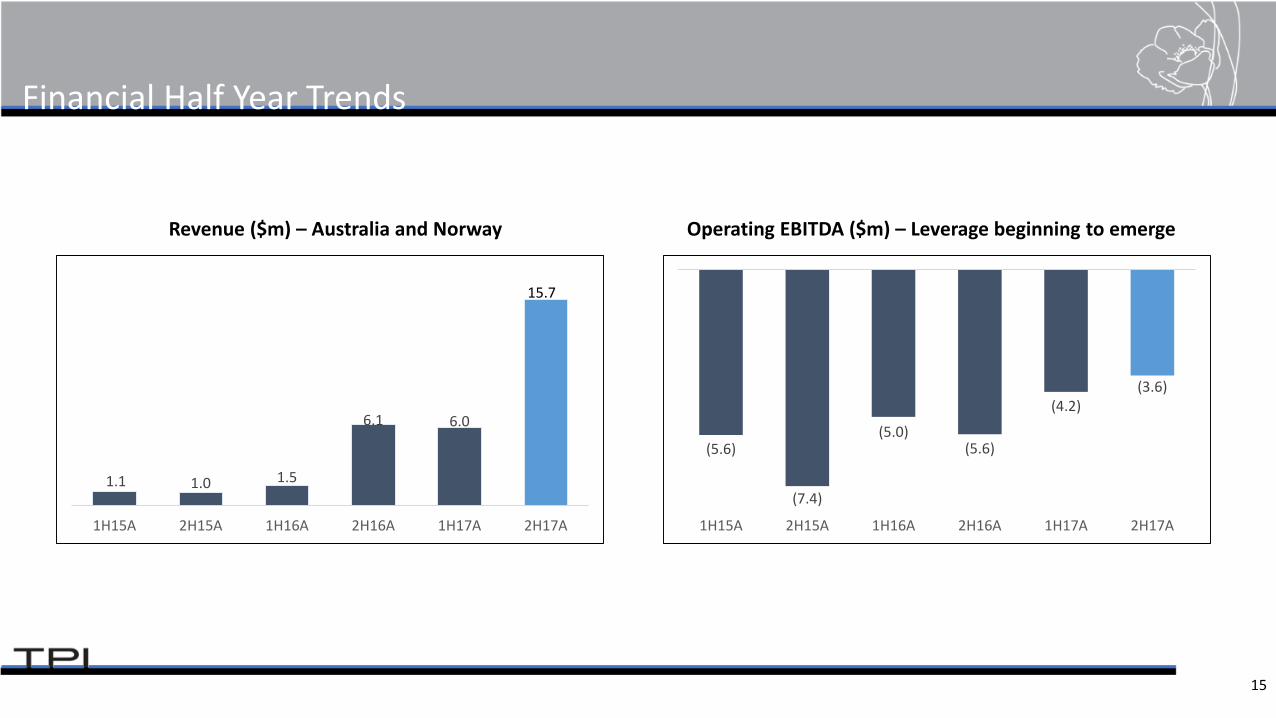
Financial Half Year Trends
Revenue ($m) – Australia and Norway Operating EBITDA ($m) – Leverage beginning to emerge
1.1 1.0 1.5
6.1 6.0
1H15A 2H15A 1H16A 2H16A 1H17A 2H17A
15.7
(5.6)
(7.4)
(5.0)(5.6)
(4.2)(3.6)
1H15A 2H15A 1H16A 2H16A 1H17A 2H17A

16
Group Profit and Loss Summary
2017 Profit and Loss Highlights:
1. Revenue growth both organic and by acquisition of TPI Norway: total revenue growth of +280% y-y, +63% from organic growth through further NRM market penetration.
2. Full year Operating EBITDA loss improved to -$7.7m from -$10.6m.
3. Gross margins and operating leverage benefitting from higher manufacturing throughput, further improvement expected in 2018.
4. Strong cost control and positive margin mix contributed to an improved Operating EBITDA loss.
5. One-off expenses predominantly relate to acquisition and integration costs ($2.0m), agricultural trials and impaired stock-on-hand ($2.4m), partially offset by other income.
6. Impairment of inventories relates to further analysis having been completed of legacy mother liquors showing a lower alkaloid concentration than previously expected.
Profit & Loss Summary (A$'000)
FY2017 FY2016
Operating revenueCMO, API, NRM, seed sales 21,666 7,615
Cost of goods sold 17,188 6,940 Gross profit 4,478 675 Gross profit (%) 20.7% 8.9%
Overhead costs 12,223 11,264 Operating EBITDA (7,745) (10,589)
Less: acquisition and transaction integration costs 2,043 - Less: inventory impairments and agricultural trialling costs 2,391 737 Less: discontinued operation 298 - Add: other income 597 2,942 Reported EBITDA (11,880) (8,384) Depreciation and amortisation 2,763 2,859 Net finance expenses 2,050 2,778 Net Profit/(Loss) (16,693) (14,021)
17
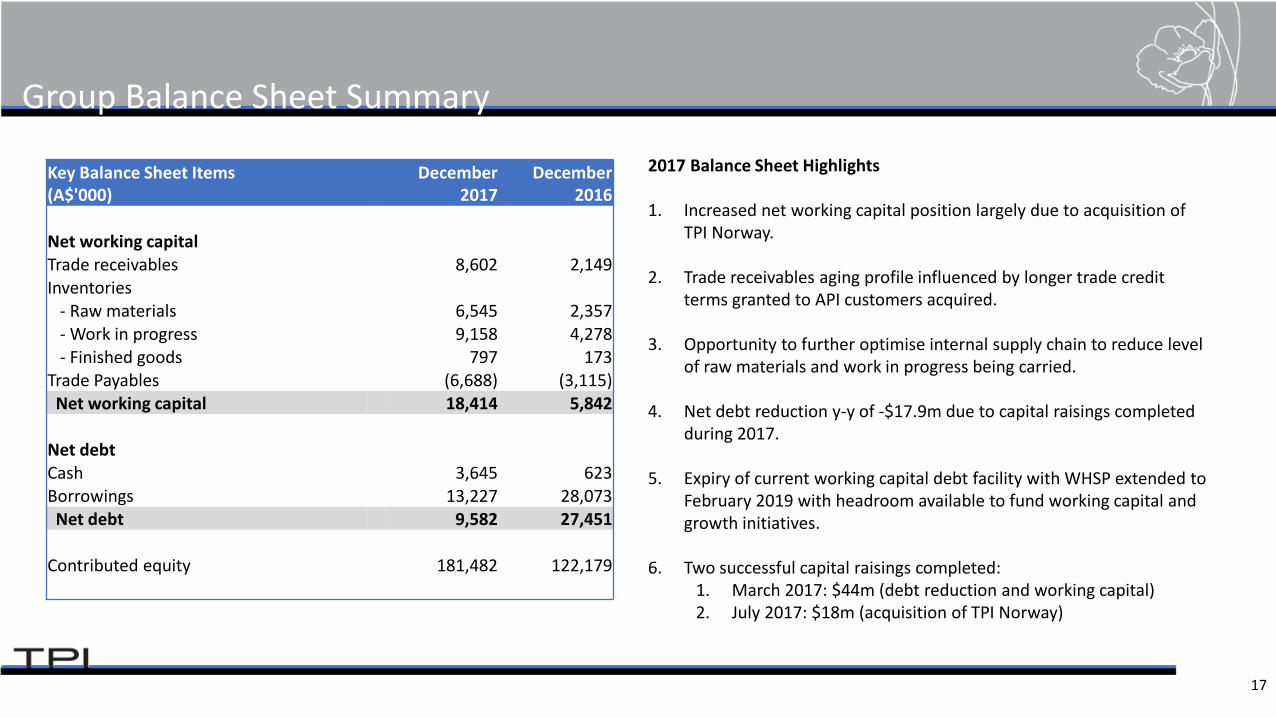
Group Balance Sheet Summary
2017 Balance Sheet Highlights
1. Increased net working capital position largely due to acquisition of TPI Norway.
2. Trade receivables aging profile influenced by longer trade credit terms granted to API customers acquired.
3. Opportunity to further optimise internal supply chain to reduce level of raw materials and work in progress being carried.
4. Net debt reduction y-y of -$17.9m due to capital raisings completed during 2017.
5. Expiry of current working capital debt facility with WHSP extended to February 2019 with headroom available to fund working capital and growth initiatives.
6. Two successful capital raisings completed:1. March 2017: $44m (debt reduction and working capital)2. July 2017: $18m (acquisition of TPI Norway)
Key Balance Sheet Items (A$'000)
December 2017
December 2016
Net working capitalTrade receivables 8,602 2,149 Inventories
- Raw materials 6,545 2,357 - Work in progress 9,158 4,278 - Finished goods 797 173
Trade Payables (6,688) (3,115)Net working capital 18,414 5,842
Net debtCash 3,645 623 Borrowings 13,227 28,073 Net debt 9,582 27,451
Contributed equity 181,482 122,179
Business Unit Focus & Outlook
19
NRM 2018 Focus and OutlookGreater throughput, margins and profits
1. TPI expects to improve on 2017’s result with improved throughput in 2018.
2. This will drive greater manufacturing efficiencies, improving both the gross and EBITDA margins.
3. Targeting NRM production of 65 tonnes.
4. Outlook for NRM prices currently subdued and factored in to current EBITDA calculations.
5. Targeting seed sales in excess of 1,000 tonnes.
6. Outlook for seed pricing currently greater than €1,400 per tonne.
7. Targeting 6,000 ha contracted for straw, including 2,000 ha for planting in NSW.
20
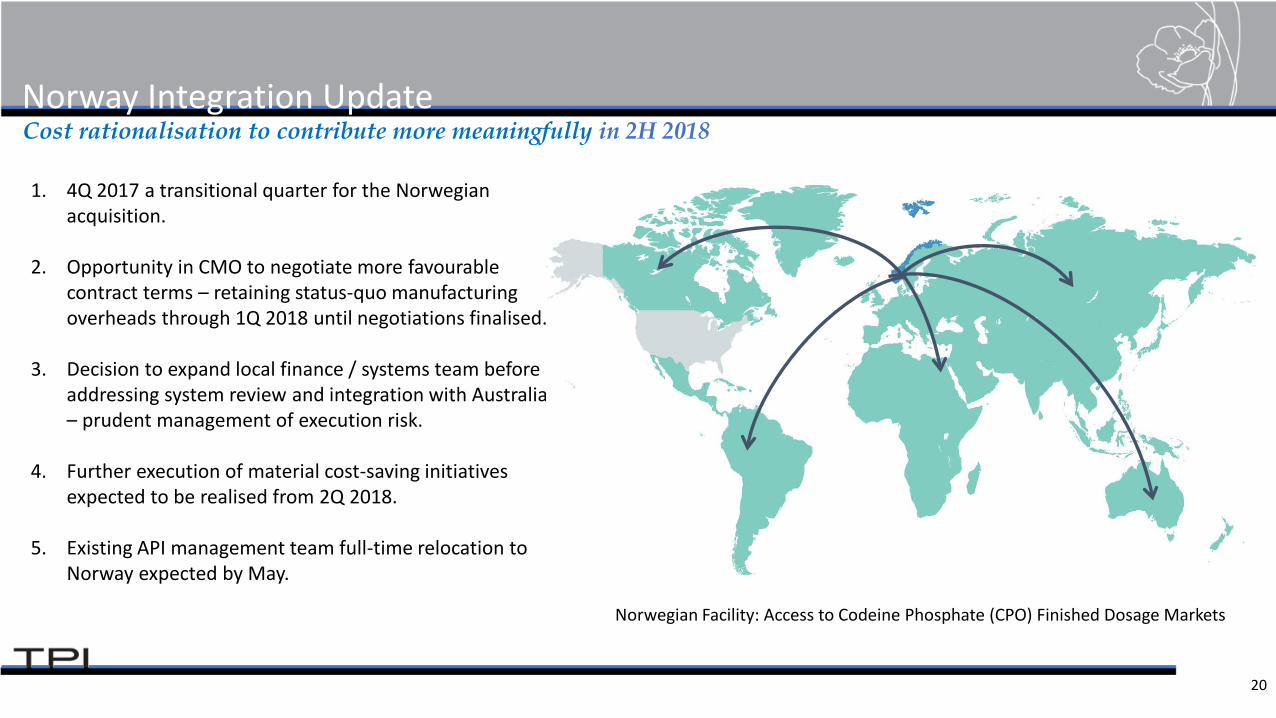
Norway Integration UpdateCost rationalisation to contribute more meaningfully in 2H 2018
1. 4Q 2017 a transitional quarter for the Norwegian acquisition.
2. Opportunity in CMO to negotiate more favourable contract terms – retaining status-quo manufacturing overheads through 1Q 2018 until negotiations finalised.
3. Decision to expand local finance / systems team before addressing system review and integration with Australia – prudent management of execution risk.
4. Further execution of material cost-saving initiatives expected to be realised from 2Q 2018.
5. Existing API management team full-time relocation to Norway expected by May.
Norwegian Facility: Access to Codeine Phosphate (CPO) Finished Dosage Markets
21
API/FDF 2018 Focus and OutlookTightened operating procedures, realised efficiency gains and additional volumes
1. Implementing an Operational Excellence program in API/FDF.
2. Expect to drive additional cost efficiencies in 2018.
3. Expect to grow existing API production capacity by 100% by end-2018.
4. Renegotiating key CMO contract pricing.
5. CEP submission for production of additional APIs.
6. FDF Dossier acquisition to grow FDF addressable market, utilise NRM cost advantage
Appendices
23
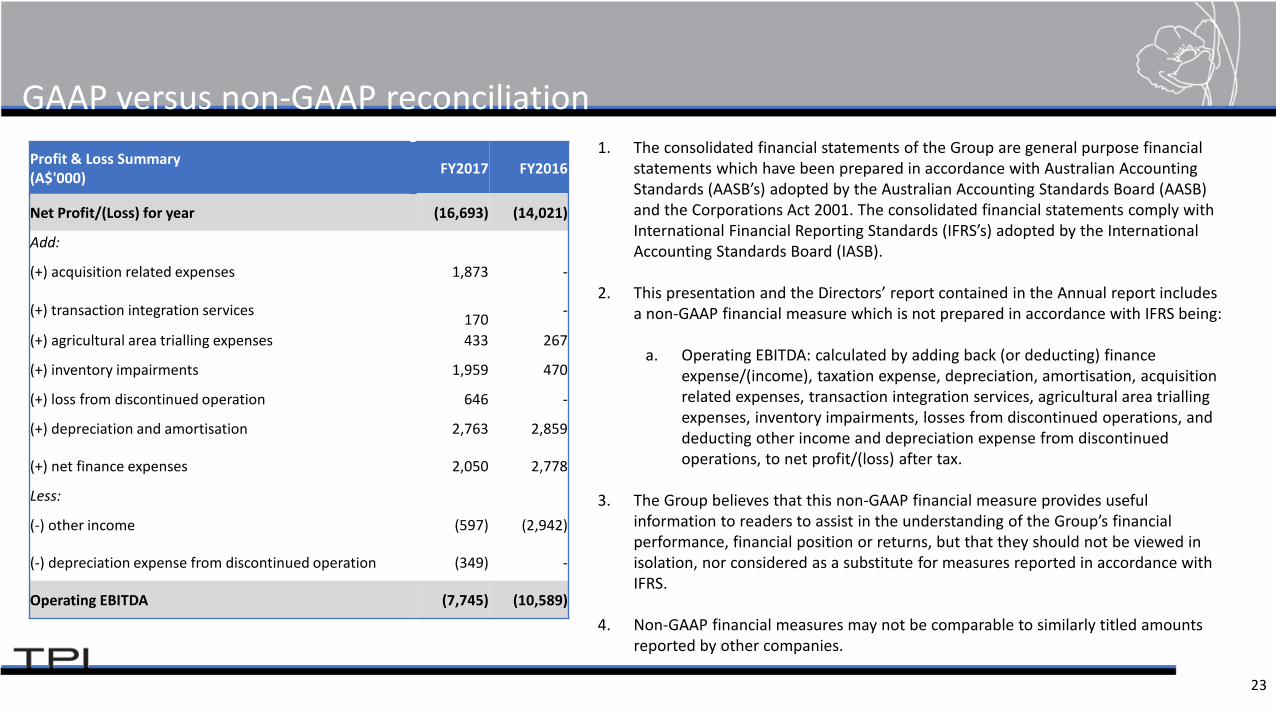
GAAP versus non-GAAP reconciliation1. The consolidated financial statements of the Group are general purpose financial
statements which have been prepared in accordance with Australian Accounting Standards (AASB’s) adopted by the Australian Accounting Standards Board (AASB) and the Corporations Act 2001. The consolidated financial statements comply with International Financial Reporting Standards (IFRS’s) adopted by the International Accounting Standards Board (IASB).
2. This presentation and the Directors’ report contained in the Annual report includes a non-GAAP financial measure which is not prepared in accordance with IFRS being:
a. Operating EBITDA: calculated by adding back (or deducting) finance expense/(income), taxation expense, depreciation, amortisation, acquisition related expenses, transaction integration services, agricultural area trialling expenses, inventory impairments, losses from discontinued operations, and deducting other income and depreciation expense from discontinued operations, to net profit/(loss) after tax.
3. The Group believes that this non-GAAP financial measure provides useful information to readers to assist in the understanding of the Group’s financial performance, financial position or returns, but that they should not be viewed in isolation, nor considered as a substitute for measures reported in accordance with IFRS.
4. Non-GAAP financial measures may not be comparable to similarly titled amounts reported by other companies.
Profit & Loss Summary (A$'000) FY2017 FY2016
Net Profit/(Loss) for year (16,693) (14,021)
Add:
(+) acquisition related expenses 1,873 -
(+) transaction integration services 170 -
(+) agricultural area trialling expenses 433 267
(+) inventory impairments 1,959 470
(+) loss from discontinued operation 646 -
(+) depreciation and amortisation 2,763 2,859
(+) net finance expenses 2,050 2,778
Less:
(-) other income (597) (2,942)
(-) depreciation expense from discontinued operation (349) -
Operating EBITDA (7,745) (10,589)
24
Disclosures and DisclaimersSummary informationThe following disclaimer applies to this document and any information provided regarding the information contained in this document (the “Information”). The Information has beenprepared by TPI Enterprises Ltd and relates to the TPI group (including, without limitation, Purplebay Pty Ltd and TPI’s Portuguese subsidiaries or any new entity subsequently incorporatedfollowing the date on which this Information is provided) (collectively “TPI”). The Information in this presentation is of general background and does not purport to be complete. You areadvised to read this disclaimer carefully before reading or making any other use of this document or any information contained in this document. In accepting this document, you agree tobe bound by the following terms and conditions including any modifications to them.
Not financial or product adviceThis presentation is for information purposes only and is not financial product or investment advice or a recommendation to acquire securities in TPI without taking into account theobjectives, financial situation or needs of individuals. You are solely responsible for forming your own opinions and conclusions on such matters and the market and for making your ownindependent assessment of the Information. TPI is not licensed to provide financial product advice.
Financial dataAll dollar values are in Australian dollars (A$) unless stated otherwise.
Past performancePast performance information given in this presentation is given for illustrative purposes only and should not be relied upon as (and is not) an indication of future performance.
Future performanceThe presentation includes forward-looking statements regarding future events and the future financial performance of TPI. Forward looking words such as “expect”, “should”, “could”,“may”, “predict”, “plan”, “will”, “believe”, “forecast”, “estimate”, “target” or other similar expressions are intended to identify forward-looking statements. Any forward looking statementsincluded in this document involve subjective judgment and analysis and are subject to significant uncertainties, risks and contingencies, many of which are outside the control of, and areunknown to, TPI and its officers, employees, agents or associates. In particular, factors such as variable climatic conditions and regulatory decisions and processes may affect the futureoperating and financial performance of TPI. This may cause actual results to be materially different from any future results, performance or achievements expressed or implied by suchstatements. The Information also assumes the success of TPI’s business strategies. The success of the strategies is subject to uncertainties and contingencies beyond control, and noassurance can be given that the anticipated benefits from the strategies will be realised in the periods for which forecasts have been prepared or otherwise. Given these uncertainties, youare cautioned to not place undue reliance on any such forward looking statements. TPI is providing this information as of the date of this presentation and does not assume any obligation toupdate any forward-looking statements contained in this document as a result of new information, future events or developments or otherwise.


![Results Press Release & Investor Update [Company Update]](https://img.dokumen.tips/doc/110x75/577cb4891a28aba7118c8067/results-press-release-investor-update-company-update.jpg)


