Embed Size (px)
Citation preview

COMPANY UPDATE3 MONTHS 2018
PT INDUSTRI JAMU DAN FARMASI SIDO MUNCUL TBK

This presentation is made to provide information. No representation or warranty ismade as to the fairness, accuracy, completeness or correctness of the information,opinions and conclusions contained within this presentation. All information includingbusiness forward plans in this presentation should not be considered as arecommendation in relation to holding purchasing or selling shares in any jurisdiction.No copy or use of this presentation should occur without the permission of PT INDUSTRIJAMU DAN FARMASI SIDO MUNCUL TBK.
Disclaimer
INTRODUCTION

FINANCIAL HIGHLIGHT
DESCRIPTION Q1'17 Q1'18 ∆UNAUDITED UNAUDITED
Net Sales 603,486 620,846 2.9%Operating Income 159,122 209,949 31.9%
% margin 26.4% 33.8%Net Income 127,545 169,082 32.6%
% margin 21.1% 27.2%
Total Assets 3,089,973 3,332,038 7.8%Total Liabilities 202,136 267,091 32.1%Total Equity 2,887,837 3,064,947 6.1%
Working Capital 1,640,599 1,494,647 -8.9%
Current Ratio 9.7 8.0 -1.7Debt to Equity 0.0% 0.0% 0.0%

PROFILE
VISIONTo become a leading herbal medicine, health food & drinks, and herbal ingredient
processing company which can benefit the community and environment
MISSION To develop rational, safe and honest herbal-based products based on research. To continuously develop research in herbal medicines. To assist and encourage the government, education institutions, and medical sector to
play a more important role in research and development of herbal medicines andmedication .
To increase community awareness of them importance of maintaining health throughhealthy living pattern, use of natural substance, and naturopathy medication.
To implement intensive corporate social responsibility (CSR) To manage an environmental-oriented company. To become a world class herbal medicine company
BUSINESS FIELDSHerbal Medicine & Pharmaceutical

MILESTONES
1970A limited
partnership wasestablished
under the nameCV. Industri Jamu
& Farmasi SidoMuncul
1975PT. Industri Jamu& Farmasi Sido
Munculestablished
1984The factory was
moved toKaligawe,Semarang
2000Inaugurated anew factory in
Klepu, Ungaran
2010Herbal extraction
factory groundbreaking
2013IPO on the
Indonesia StockExchange
2014Acquisition of PT
Berlico MuliaFarma
1951A small businesswas establishedunder the name
Sido Munculwhich has the
meaning of“Dream Comes
True”

EVENT: 2017 - NOW

CORPORATE STRUCTURE
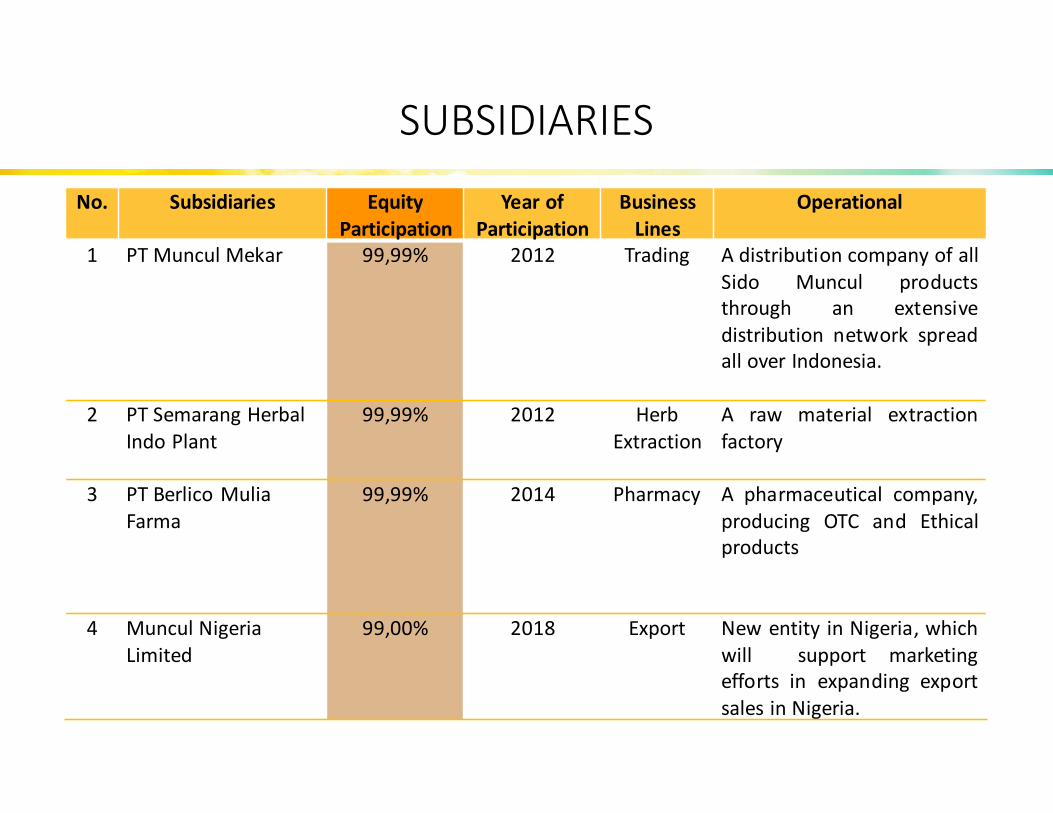
SUBSIDIARIES
No. Subsidiaries EquityParticipation
Year ofParticipation
BusinessLines
Operational
1 PT Muncul Mekar 99,99% 2012 Trading A distribution company of allSido Muncul productsthrough an extensivedistribution network spreadall over Indonesia.
2 PT Semarang HerbalIndo Plant
99,99% 2012 HerbExtraction
A raw material extractionfactory
3 PT Berlico MuliaFarma
99,99% 2014 Pharmacy A pharmaceutical company,producing OTC and Ethicalproducts
4 Muncul NigeriaLimited
99,00% 2018 Export New entity in Nigeria, whichwill support marketingefforts in expanding exportsales in Nigeria.

BOARD MEMBERS
BOARD OF DIRECTORS
Jonatha Sofyan Hidayat President DirectorIrwan Hidayat DirectorDavid Hidayat DirectorVenancia Sri Indrijati W. DirectorCarlo Lukman Windarto Independent Director
BOARD OF COMMISSIONERS
Sigit Hartojo Hadi Santoso President Commissioner
Johan Hidayat CommissionerEric Marnandus Independent CommissionerRonnie Behar Independent Commissioner
BUSINESS OVERVIEW

PRODUCT PORTFOLIO
HERBAL&
SUPPLEMENT
FOOD&
BEVERAGES
PHARMACEUTICAL

DISTRIBUTION NETWORK

INTERNATIONAL BUSINESS
SIDO MUNCUL PRODUCTS ARE EXPORTEDTO SEVERAL COUNTRIES Malaysia Singapore Brunei Darussalam Hong Kong Taiwan Korea Selatan Australia Saudi Arabia Pakistan Nigeria Togo USA Canada
FINANCIAL OVERVIEW
Q1'17 Q1'18
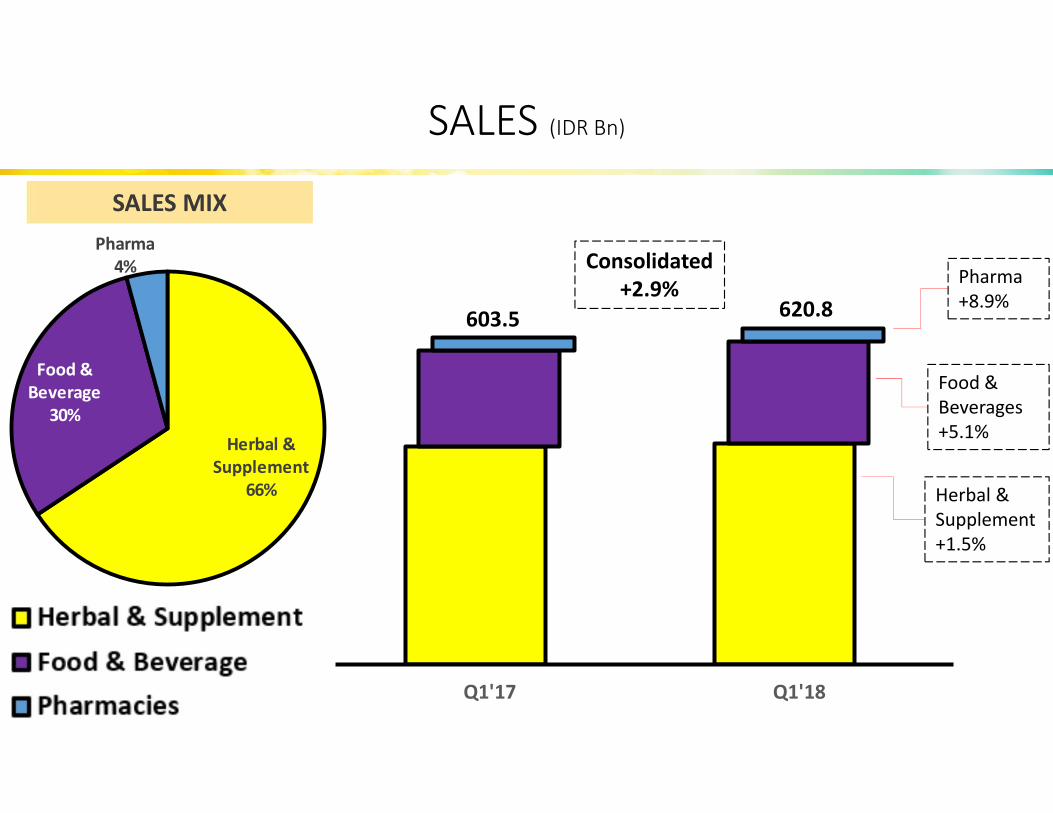
SALES (IDR Bn)
SALES MIX
Consolidated+2.9%
Herbal &Supplement+1.5%
Food &Beverages+5.1%
Pharma+8.9%
603.5 620.8
Herbal &Supplement
66%
Food &Beverage
30%
Pharma4%

159210
26.4%33.8%
Q1'17 Q1'18
Op. Profit % to NS12.2% 9.4%
4.9%6.6%
Q1'17 Q1'18
%OPEX to NSMarketing Exp. G&A Exp.
260306
43.0% 49.3%
Q1'17 Q1'18Gross Profit % to NS
OPERATING PERFORMANCE (IDR Bn)
GROSS PROFIT
OPEX to Net Sales
OPERATING PROFIT
Consolidated+31.9%
Consolidated+17.8%
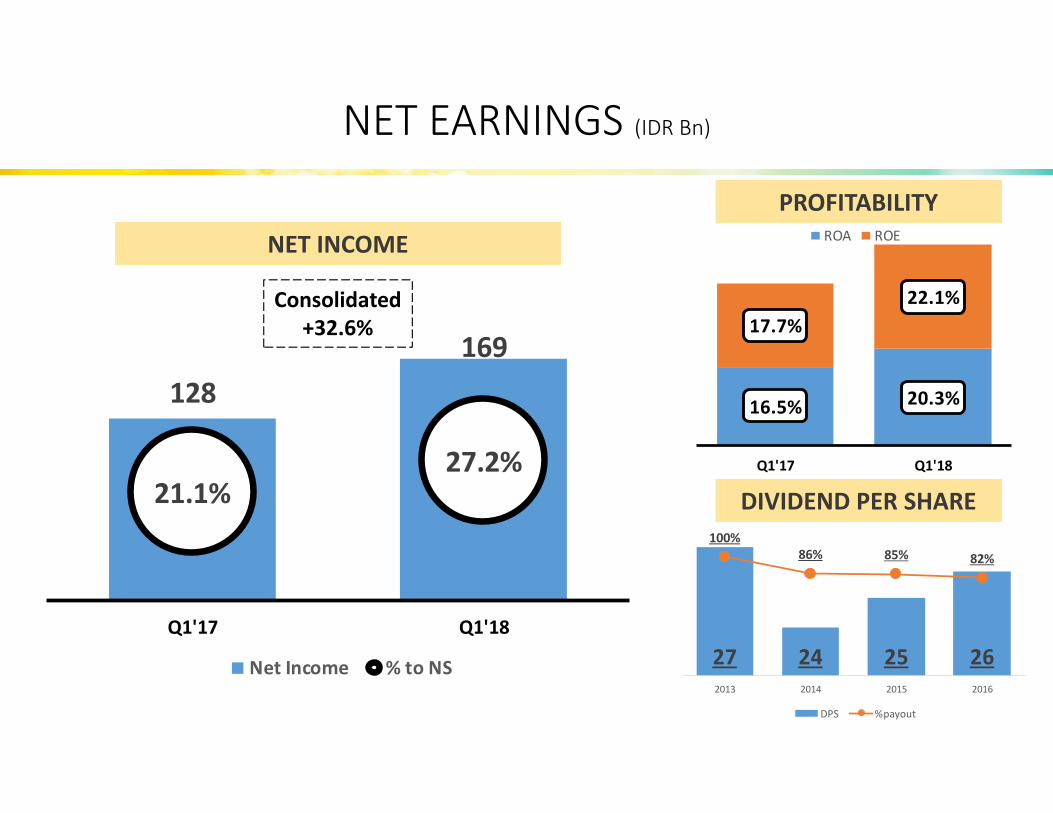
27 24 25 26
100%86% 85% 82%
2013 2014 2015 2016
DPS %payout
16.5% 20.3%
17.7%22.1%
Q1'17 Q1'18
ROA ROE
128169
21.1%27.2%
Q1'17 Q1'18
Net Income % to NS
NET EARNINGS (IDR Bn)
NET INCOME
Consolidated+32.6%
PROFITABILITY
DIVIDEND PER SHARE

FINANCIAL POSITION (IDR Bn)
ASSETS & EQUITY DEBT POITION
2,820 2,796 2,988 3,158 3,332
2,625 2,598 2,758 2,896 3,065
2014 2015 2016 2017 Q1'18
ASSETS EQUITY
0.0 0.0 0.0 0.0 0.0
2014 2015 2016 2017 Q1'18

BUSINESS PROSPECTS

BUSINESS PROSPECTS
In early of 2018, Muncul NigeriaLimited established to increase thepotential export market in Africaarea.
New production facility of liquid herbalmedicine, very modern and fullyautomated.
Production capacity will rise 100% whichwill be used to produce other kinds ofherbal products.
PT INDUSTRI JAMU DAN FARMASISIDO MUNCUL TBK.
HEAD OFFICE:Gedung Menara Suara Merdeka, Lt. 16Jalan Pandanaran No. 30Semarang - Indonesia
FACTORY:Jl. Soekarno Hatta, Km. 28Kec. Bergas – KlepuSemarang – Indonesia
BRANCH OFFICE:
Grha Muncul MekarJl. Panjang Arteri Kelapa Dua, No. 27Kebon JerukJakarta Barat - Indonesia
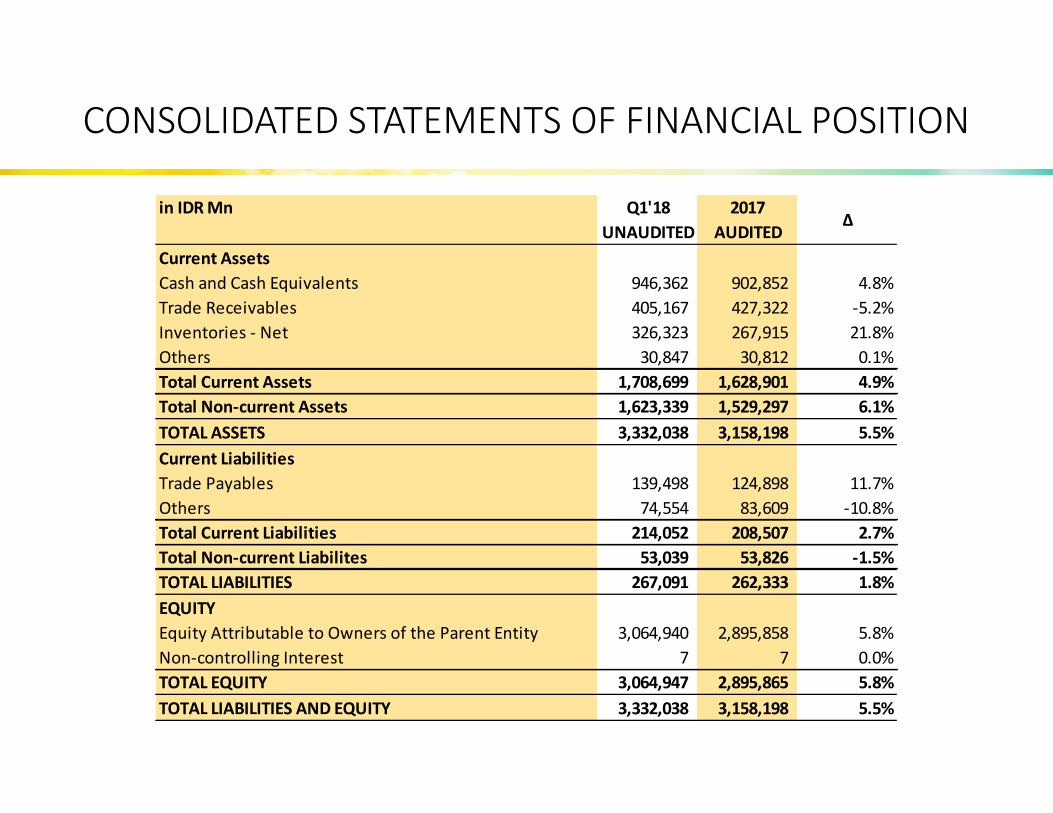
CONSOLIDATED STATEMENTS OF FINANCIAL POSITION
in IDR Mn Q1'18 2017UNAUDITED AUDITED
Current AssetsCash and Cash Equivalents 946,362 902,852 4.8%Trade Receivables 405,167 427,322 -5.2%Inventories - Net 326,323 267,915 21.8%Others 30,847 30,812 0.1%Total Current Assets 1,708,699 1,628,901 4.9%Total Non-current Assets 1,623,339 1,529,297 6.1%TOTAL ASSETS 3,332,038 3,158,198 5.5%Current LiabilitiesTrade Payables 139,498 124,898 11.7%Others 74,554 83,609 -10.8%Total Current Liabilities 214,052 208,507 2.7%Total Non-current Liabilites 53,039 53,826 -1.5%TOTAL LIABILITIES 267,091 262,333 1.8%EQUITYEquity Attributable to Owners of the Parent Entity 3,064,940 2,895,858 5.8%Non-controlling Interest 7 7 0.0%TOTAL EQUITY 3,064,947 2,895,865 5.8%TOTAL LIABILITIES AND EQUITY 3,332,038 3,158,198 5.5%
∆
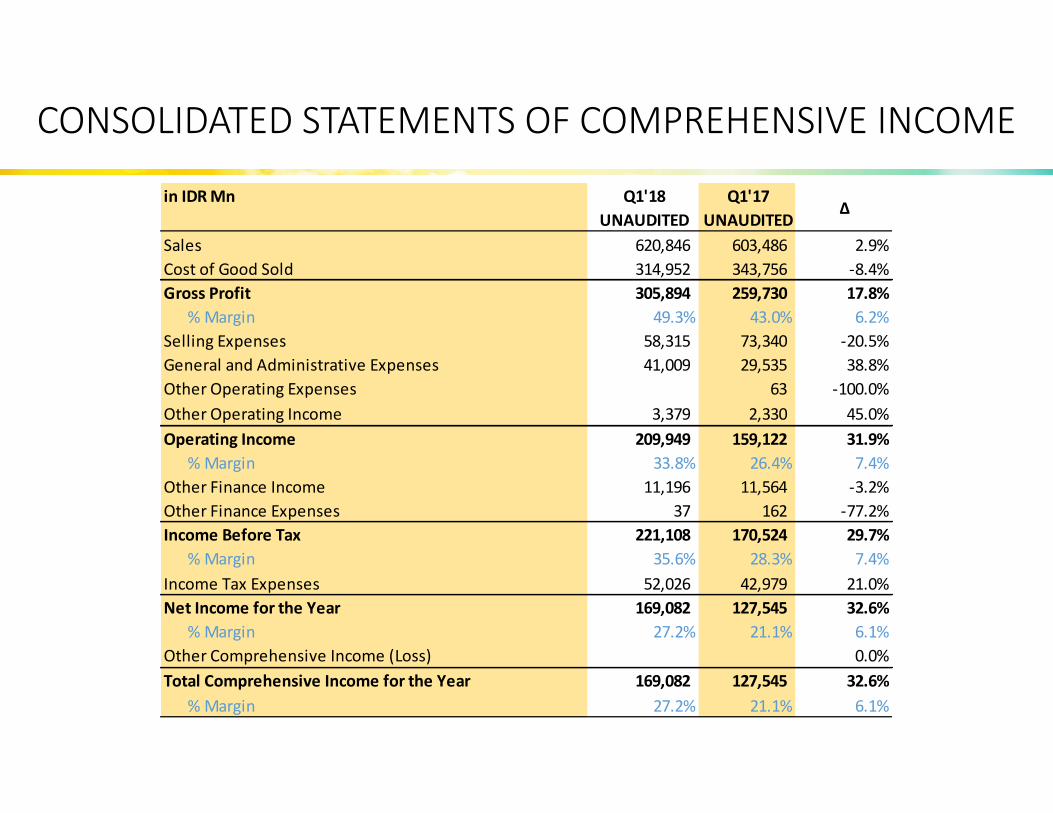
CONSOLIDATED STATEMENTS OF COMPREHENSIVE INCOME
in IDR Mn Q1'18 Q1'17UNAUDITED UNAUDITED
Sales 620,846 603,486 2.9%Cost of Good Sold 314,952 343,756 -8.4%Gross Profit 305,894 259,730 17.8%
% Margin 49.3% 43.0% 6.2%Selling Expenses 58,315 73,340 -20.5%General and Administrative Expenses 41,009 29,535 38.8%Other Operating Expenses 63 -100.0%Other Operating Income 3,379 2,330 45.0%Operating Income 209,949 159,122 31.9%
% Margin 33.8% 26.4% 7.4%Other Finance Income 11,196 11,564 -3.2%Other Finance Expenses 37 162 -77.2%Income Before Tax 221,108 170,524 29.7%
% Margin 35.6% 28.3% 7.4%Income Tax Expenses 52,026 42,979 21.0%Net Income for the Year 169,082 127,545 32.6%
% Margin 27.2% 21.1% 6.1%Other Comprehensive Income (Loss) 0.0%Total Comprehensive Income for the Year 169,082 127,545 32.6%
% Margin 27.2% 21.1% 6.1%
∆

CONSOLIDATED STATEMENTS OF CASH FLOWS
in IDR Mn Q1'18 Q1'17UNAUDITED UNAUDITED
Cash Flows From Operating Activities 153,980 41,395Cash Flows From Investing Activities (110,517) (76,426)Cash Flows From Financing Activities 2,223
Net Increase (Decrease) in Cash and Cash Equivalents 43,463 (32,808)Effect of Changes in Foreign Exchange Rate 47 (17)Cash and Cash Equivalents At the Beginning of the Year 902,852 997,135Cash and Cash Equivalents At the End of the Year 946,362 964,310