Embed Size (px)
Citation preview

Company specific adjustments to the WACC A review of company representations
December 2014

Company specific adjustments to the WACC - A review of company representations
PwC 2
1. Introduction and Summary
1.1. Background
In ‘Setting price controls for 2015-20 – risk and reward guidance’, Ofwat set out the two criteria for a company-
specific uplift to the weighted average cost of capital (WACC):
“To justify a company-specific uplift to the WACC, companies will need to demonstrate both that they
face a higher cost of raising finance and that there is an offsetting benefit to customers.”1
The first criterion - demonstrating that they face a higher cost of financing - is called ‘Test 1’. The second
criterion - demonstrating that there is an offsetting benefit to customers - is called ‘Test 2’.
In August 2014, we published a report, ‘Company specific adjustments to the WACC: A report prepared for
Ofwat’2 which reviewed the evidence regarding Test 1 (hereafter referred to as our “First Report”). We
concluded that the cost of debt finance for small ‘Water Only Companies’ (WoCs) was approximately 25bps
higher than the industry notional cost of debt benchmark, and also concluded that there should be no cost of
equity adjustment for either large or small WoCs. Informed by our recommendations, Ofwat’s PR14 Draft
Determinations applied this cost of debt uplift to those small WoCs who also passed Test 2 – Portsmouth Water
and Sembcorp Bournemouth Water.
Subsequent to the publication of our report alongside Ofwat’s Draft Determinations, Bristol Water, Dee Valley
Water, South East Water and Sutton and East Surrey Water made representations to Ofwat regarding our
conclusions from the application of ‘Test 1’3. The two companies who passed both tests, in addition to South
Staffordshire Cambridge Water, did not comment upon the conclusions of our First Report.
In their representations, five of seven companies reduced the size of uplift to the industry WACC they requested
relative to June submissions. This is shown in figure 1 below.
Figure 1 WACC premium requested in June submissions and representations
Source: Company submissions
1 Ofwat (2014), ‘Setting price controls for 2015-20 – risk and reward guidance’.
2 PwC (2014), ‘Company specific adjustments to the WACC: A report prepared for Ofwat’.
3 Oxera prepared a note on behalf of Bristol Water, and Frontier Economics prepared documents on behalf of Dee Valley Water, South East Water and Sutton and East Surrey Water.
0.0%
0.2%
0.4%
0.6%
0.8%
1.0%
1.2%
1.4%
BRL(Jun)
BRL(Oct)
DVW(Jun)
DVW(Oct)
PRT(Jun)
PRT(Oct)
SBW(Jun)
SBW(Oct)
SES(Jun)
SES(Oct)
SEW(Jun)
SEW(Oct)
SSC(Jun)
SSC(Oct)
Siz
e o
f p
rem
ium
to
WA
CC
Equity uplift (Jun) Debt uplift (Jun) Equity uplift (Oct) Debt uplift (Oct)
The 25bps premium to the cost of debt - allowed for companies which pass test 2 - translates approximately into a 15bps premium on the WACC

Company specific adjustments to the WACC - A review of company representations
PwC 3
As Figure 1 highlights, Portsmouth Water, Sembcorp Bournemouth Water, South Staffordshire Cambridge
Water and Sutton and East Surrey Water have aligned their representations with Ofwat’s proposals on company
specific adjustments to the WACC. In short, they have included 15bps uplift to the industry WACC – which is
consistent with the recommended 25bps premium on the cost of debt. Despite this, Sutton and East Surrey
Water and Dee Valley Water continued to present arguments for a cost of equity premium in their
representations.
Section 1.2 below sets out the views raised in representations regarding both the cost of debt and the cost of
equity.
1.2. Scope of this report
Ofwat has asked us to review all the representations submitted regarding ‘Test 1’. In doing so, we have grouped
representations into fourteen topic areas. These are set out in Table 1 below; along with which respondents
commented on particular issues and which section of the report address them.
Table 1 Respondents and topics covered in representations regarding Test 1
Issue topic Respondents Section of this report
Cost of Equity
Treatment of the cost of equity for WoCs in PR09 DVW, SES 2.1.1
Implications of RoRE analysis for the cost of equity BRL 2.1.2
Operational gearing DVW, BRL, SES 2.1.3
Use of Dimson beta calculation DVW, SES 2.1.4
PAYG ratios DVW, SES 2.1.5
Consistency between debt and equity costs DVW, BRL, SES 2.1.6
Cost of Debt
Previous regulatory decisions on embedded debt costs SEW 2.2.1
Bank debt issuance costs BRL 2.2.2
Frequency of debt raising and timing risk DVW, BRL, SEW 2.2.3
Efficiency of Artesian finance DVW 2.2.4
Benefits of long-term debt DVW 2.2.5
Comparators for bond analysis SEW 2.2.6
Time period and scope of assessment for cost of debt SEW 2.2.7
Costs of carry SEW 2.2.8
In Section 2 of this report, we discuss the views of respondents on each of these topic areas, conduct
supplementary analyses where necessary, and set out our view on each area in turn. Our conclusions are
summarised in Section 1.3 below.

Company specific adjustments to the WACC - A review of company representations
PwC 4
1.3. Summary
Table 2 below presents our conclusions on each of the topics set out in Table 1 above.
Table 2 Conclusions on issue topics raised in company representations
Issue topic Conclusion
Cost of Equity
Treatment of the cost of equity for WoCs in PR09
The adjustment to the cost of capital for small WoCs in PR09 was not intended to suggest the cost of equity, or asset betas, for WoCs are different to WaSCs.
Implications of RoRE analysis for the cost of equity
Historical analysis shows higher RORE variation for WoCs compared to WaSCs, but these differences are much smaller on a forward looking basis. We retain the view held by Ofwat in PR09 - that any remaining differences in business risk between WaSCs and WOCs are specific in nature. As a consequence of the increase in financial gearing for WoCs since PR09, we do not recommend Ofwat sets a different financial gearing assumption for WoCs (as it did in PR09). Rather we recommend a different cost of debt assumption is used for WoCs, as supported by market evidence.
Operational gearing
We maintain our view that there is insufficient conceptual validity to show that WoCs face a higher cost of equity than WaSCs. This is supported by the empirical analysis of water company betas. Any residual differences can be managed through water company calibration of outcome delivery incentives and totex (total expenditure) menu choices.
Use of Dimson beta calculation
Our First Report found that beta analysis did not suggest a difference in the systematic risk between WaSCs and WoCs. After testing different formulations of the Dimson beta, our finding does not change. We conclude that the Dimson beta estimated in our First Report is robust.
PAYG ratios Despite likely cost structure differences between WoCs and WaSCs over the course of AMP6 (Asset Management Period 6), we do not consider there to be sufficient evidence that this requires a higher cost of equity for WoCs.
Consistency between debt and equity costs
We consider there is both a theoretical basis and empirical evidence to support an uplift to the cost of debt and no uplift to the cost of equity.
Cost of Debt
Previous regulatory decisions on embedded debt costs
We recommend Ofwat continues with its approach of setting an industry-wide cost of capital, with the only adjustment being for small WoCs in relation to their debt finance costs. We recommend this adjustment is set for the WoC group, as a whole, rather than being set for individual companies.
Bank debt issuance costs
Even with higher amortised issuance costs for bank finance, the average issuance cost across all WoC financing does not exceed 10bps. This is because bank finance represents a relatively small portion of WoC debt finance (c.9%) and issuance costs on larger parts of WoC debt finance are less than 10bps.
Frequency of debt raising and timing risk
We acknowledge that WoCs access bond markets less frequently, although average debt maturity profiles for WaSCs and WoCs are broadly similar. Higher timing risk borne by WoCs can be taken into account through the assessment of WoC debt finance costs across a range of finance types (including a higher proportion of bank debt finance), and can be managed through water company calibration of outcome delivery incentives and totex menu choices.
Efficiency of Artesian finance
We consider that water companies are best able to manage the timing of their debt issuance and hence should be able to benefit from any out-performance, or bear the risk of under-performance. Our analysis suggests that the timing of Artesian finance issuance is the biggest contributory factor to under-performance.
Benefits of long-term debt
We consider it is in the long-term interests of consumers that companies are incentivised to raise debt finance efficiently. The use of a long-term debt benchmark in the calculation of allowed returns supports such incentives. Any move to allow the recovery of actual debt finance costs could reduce such incentives.

Company specific adjustments to the WACC - A review of company representations
PwC 5
Comparators for bond analysis
We have reviewed suggestion for different bond comparators in the assessment of cost of debt differences between large WoCs and WaSCs. We retain the view that the large WoCs do not require an uplift to the cost of debt.
Time period and scope of assessment for cost of debt
The addition of one extra data point for a large WoC bond issue in 2003 shows that large WoC bond financing costs are within the range of WaSC bond financing costs.
Costs of carry We consider that an uplift to the cost of capital to compensate for the cost of carry is not required as there are offsetting factors, which are not separately incorporated into Ofwat’s WACC framework.
1.4. Conclusion
Overall, we find there are no substantive reasons to change the conclusions set out in our First Report. As a
result, our recommendation to Ofwat remains unchanged. We continue to recommend that Ofwat applies 25bps
uplift to the cost of debt for small WoCs, and that no WoCs should receive an uplift to the cost of equity.
Company specific adjustments to the WACC - A review of company representations
PwC 6
2. Respondents views and responses
In this section, we set out the issues raised in representations to Ofwat, summarise the views of respondents
and set out our view on each issue. Section 2.1 covers topics regarding the cost of equity, section 2.2 covers
topics regarding the cost of debt.
2.1. Cost of equity
2.1.1. Treatment of the cost of equity for WoCs in PR09
Issue context
In its PR14 Draft Determinations, Ofwat did not allow an uplift to cost of equity in its assessment of the higher
(efficient) financing costs for WoCs.
Respondents’ views A number of respondents suggested this approach was inconsistent with the approach adopted in PR09.
PwC view In PR09 Ofwat concluded that there was insufficient evidence to show that WoCs faced different systematic risk
to WaSCs4. However, it acknowledged that credit rating agencies require WoCs to achieve higher credit ratios,
compared to WaSCs, to attain a given rating, and concluded there were higher specific risks for WoCs. For this
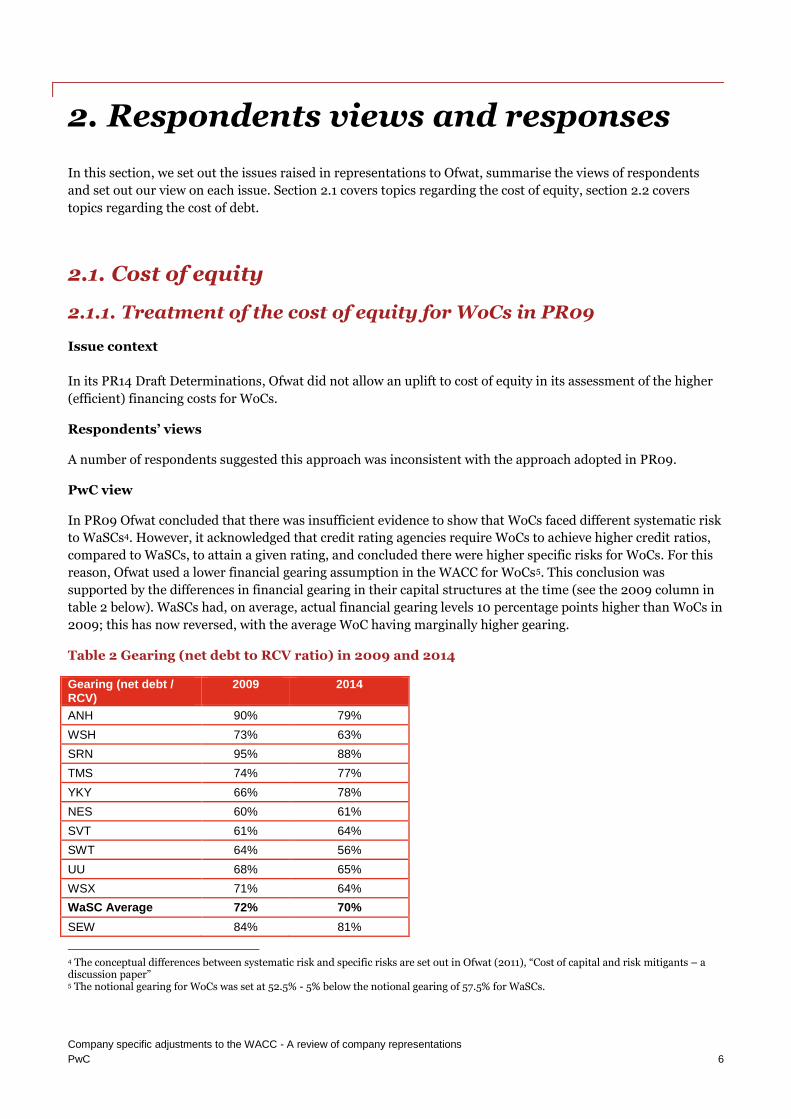
reason, Ofwat used a lower financial gearing assumption in the WACC for WoCs5. This conclusion was
supported by the differences in financial gearing in their capital structures at the time (see the 2009 column in
table 2 below). WaSCs had, on average, actual financial gearing levels 10 percentage points higher than WoCs in
2009; this has now reversed, with the average WoC having marginally higher gearing.
Table 2 Gearing (net debt to RCV ratio) in 2009 and 2014
Gearing (net debt / RCV)
2009 2014
ANH 90% 79%
WSH 73% 63%
SRN 95% 88%
TMS 74% 77%
YKY 66% 78%
NES 60% 61%
SVT 61% 64%
SWT 64% 56%
UU 68% 65%
WSX 71% 64%
WaSC Average 72% 70%
SEW 84% 81%
4 The conceptual differences between systematic risk and specific risks are set out in Ofwat (2011), “Cost of capital and risk mitigants – a discussion paper” 5 The notional gearing for WoCs was set at 52.5% - 5% below the notional gearing of 57.5% for WaSCs.

Company specific adjustments to the WACC - A review of company representations
PwC 7
BRL 81% 71%
CAM 52% -
DVW 65% 77%
PRT 76% 81%
SBW 55% 58%
SST 86% -
SES 77% 76%
VWC 40% -
VWE 23% -
VWSE 46% -
AFW - 80%
SSC - 64%
WoC Average 62% 74%
Source: Regulatory accounts
Ofwat’s application of the lower financial gearing assumption in PR09 was treated as follows. As the lower
gearing assumption was intended to increase allowed revenues, the cost of equity was kept the same for both
WaSCs and WoCs, with the lower proportion of debt finance increasing the overall cost of capital for WoCs. This
was explained as follows:
“We have maintained the cost of equity that we have used at the industry level in our cost of capital
calculation to improve the cash flows of the water only companies. This cost of equity is higher than it
might otherwise be under a CAPM approach at 52.5% gearing, as we have not adjusted the equity
beta for the water only companies.”6
It is clear from this that the PR09 adjustment was not intended to suggest the cost of equity, or asset betas, for
WoCs are different to WaSCs – instead it highlighted the impact of different gearing on the WACC. In
particular, Ofwat note some of the challenges of using a less than fully specified CAPM and varying the gearing
assumption. This is because a lower gearing assumption can result in a lower cost of equity, and if debt betas
and cost of debt relationships are not fully specified, then a lower gearing assumption can result in a lower
overall WACC7, which would have been counter to Ofwat’s policy intention.
We continue to consider that there is insufficient evidence that shows the systematic risk of WaSCs and WoCs is
different, and hence the cost of equity should be the same for both WaSCs and WoCs.
2.1.2. Implications of RoRE analysis for the cost of equity
Issue context
In its January 2014 risk and reward guidance, Ofwat set out the historical variation in the return on regulated
equity (“RoRE”). This showed greater RoRE variation in WoCs than in WaSCs. Ofwat also showed forward-
looking RoRE ranges for all companies in the PR14 Draft Determinations. These showed less variation between
WoCs and WaSCs compared to the past.
6 PR09 Final Determination, Pg. 135. 7 For a given asset beta, and where no debt beta is applied, the equity beta calculated is positively related to the level of gearing. Therefore, holding all else equal, lower gearing reduces the equity beta and hence the cost of equity.

Company specific adjustments to the WACC - A review of company representations
PwC 8
Respondents’ views
Respondents suggested that the historic variation in RoRE showed that WoCs have higher risk. They also
suggested Ofwat should place more reliance on historical analysis which captures the impact of past events,
rather than business plans which merely incorporate expected risks.
Respondents also challenged Ofwat’s view that any additional risks in WoCs are specific in nature (as opposed
to systematic).
Furthermore, Dee Valley Water and Sutton and East Surrey Water, advised by Frontier Economics, suggested
that financeability tools (such as varying the pay-as-you-go (PAYG) ratio and RCV run-off) do not impact the
risk profile of the business.
PwC view
We consider there are changes to the PR14 methodology which provide companies with greater ability to
manage risks. This includes the ability of companies to propose different mixes of risk in their packages of
regulatory incentives which Ofwat reviews via analysis of RoRE ranges. Ofwat has also provided guidance
around the typical RoRE range which they consider represents a reasonable balance of risks and rewards
between water company investors and customers. Companies can also make totex menu choices in response to
Ofwat’s Final Determinations which influence their risk profile.
The differences between the forward-looking risk profiles for WaSCs and WoCs is minimal and much smaller
than suggested by the historical RoRE analysis. These forward-looking risk profiles are shown in Figure 2
below.
Figure 2 PR14 final determination RORE ranges
Source: Ofwat Final determinations
The use of outcome incentive calibration (and totex menu choices after Final Determinations) can therefore
narrow overall risk differences between WaSCs and WoCs. While we agree that the tools for managing
financeability do not reduce the risk in the operations of the business, they are intended to help manage
financing risk (for example where companies have different levels of new capital to raise within a five year
0.0%
2.0%
4.0%
6.0%
8.0%
10.0%
12.0%
Guid
ance
AN
H
NE
S
SR
N
SV
T
SW
T
TM
S
UU
WS
H
WS
X
YK
Y
AF
W
BR
L
DV
W
PR
T
SB
W
SE
S
SE
W
SS
C
RO
RE
ran
ge
Financing SIM Totex ODI ODI Totex SIM Financing

Company specific adjustments to the WACC - A review of company representations
PwC 9
control period), and will, over time, influence the long-term development of the RCV and therefore cost
structure of the company8.
The empirical evidence on betas (see Figure 12 in our First Report), current levels of financial gearing (see Point
2.1 above) and WOC company transaction values (see Figure 13 in our First Report) also show limited evidence
of a difference in systematic risk between WaSCs and WoCs.
We retain the view held by Ofwat in PR09 - that any remaining differences in business risk between WaSCs and
WOCs are specific in nature. This could be due to factors such as a lower degree of asset and customer
diversification, or a greater dependence on key infrastructure and human resources. As a consequence of the
increase in financial gearing for WoCs, we do not recommend Ofwat sets a different financial gearing
assumption for WoCs (as it did in PR09). Rather we recommend a different cost of debt assumption is used for
WoCs, as supported by market evidence.
2.1.3. Operational gearing
Issue context
Some WOCs continue to suggest that WOCs have higher operational gearing due to their smaller size of RCV
relative to revenues and costs, and higher proportion of operating costs to revenues. This builds on the
approach adopted by the Competition Commission (CC) in the Bristol Water appeal in PR09.9
Respondents’ views In a report prepared for Bristol Water10, Oxera challenges PwC’s conclusions regarding operational gearing and
its impact on the cost of equity. It states that the value of a firm can be viewed as the difference between the
present value of its revenue and costs. Following from this, they acknowledge that in the water industry a firm’s
value is more likely to change as a result of volatility in costs than revenues. Oxera agrees with the logic of our
argument that firm profits will fluctuate counter cyclically (implying a negative equity beta) if costs are
procyclical, given fixed revenue. But Oxera refers to observed equity betas being positive (greater than zero)
which support its argument that it is the combination of revenue and cost volatility that contributes positively
to beta risk.
PwC view Our First Report set out a number of conceptual situations or illustrations which show potential flaws in the
conceptual basis of the operational gearing arguments proposed by WoCs11. One illustration considered revenue
risks, one considered operational risks and one considered capital expenditure risks.
The second illustration considered how fixed revenues combined with operational costs exposed to systematic
risk would, in theory, lead to a countercyclical or negative beta. Oxera acknowledge this. Given the empirical
evidence of a positive beta for the water sector, this illustration is not likely to be representative of the actual
risks facing the sector. This means that water companies must be exposed to some demand or revenue risk (the
first illustration), despite the use of the Revenue Correction Mechanism in AMP5 and previous price controls
and the use of revenue controls in AMP6. Such demand risk could come from bad debt, industrial demand or
long-term growth which is not fully borne by customers through the regulatory framework. The fact that
observed betas are low suggests that any demand risk is small.
8 As indicated by ratio such as totex/RCV, opex/revenue and revenue/RCV. 9 Competition Commission (2010), ‘Bristol Water plc - A reference under section 12(3)(a) of the Water Industry Act 1991’, Appendix N 10 Oxera (2014), ‘Review of PwC’s evidence on the small-company premium: Note prepared for Bristol Water’ 11 PwC (2014), “Company specific adjustments to the WACC”

Company specific adjustments to the WACC - A review of company representations
PwC 10
So while Oxera suggest that a water company’s value is more likely to change in response to costs, we consider it
more constructive to consider variation in revenues, or demand risk. Despite potential for some demand risk,
we consider the conceptual basis of the operational gearing effects is still inconclusive. One reason is because
there is scope for management to vary operational costs and therefore mitigate demand risks. This is certainly
possible during a price control period and more so in the medium term as revenues and operational costs are
automatically recalibrated at each price control. The ability to flex operational costs may mitigate, and in some
cases, eliminate any difference in the impact of demand risks on companies with a different magnitude of
revenues in relation to the size of their assets.
The inconclusive conceptual basis of any adjustment means that it is important to review the empirical evidence
on the differences in risk for WaSCs and WoCs. As shown previously:
There is no tendency for WoCs to have lower valuation ratios in equity transactions, which suggests that
shareholders do not perceive a difference in risk (see Figure 13 in our First Report).
There is no significant difference between the level of gearing of WaSCs and WOCs, which suggests that
investors do not perceive a difference in overall risk (see Point 2.1 above).
The PwC analysis of the asset betas of DVW, SVT, SWT and UU shows that DVW’s beta is not
demonstrably different, which suggests that there is no difference in systematic risk (see Figure 12 in our
First Report).
Furthermore, if there were any difference in risk, Ofwat has given all companies the ability to propose different
mixes of risk in their packages of regulatory incentives and, after Final Determination, totex menu choices to
mitigate any underlying risk differences.
We maintain our view that there is insufficient conceptual validity and empirical evidence to show that WoCs
face a higher cost of equity than WaSCs.
2.1.4. Use of Dimson beta calculation
Issue context
In our First Report, we used a calculation of Dee Valley’s beta using a Dimson technique, which includes lagged
observations to allow for the illiquidity in Dee Valley’s share trading. We then used this empirical evidence to
show that the systematic risk in the one publicly listed WoC is little different to that of the three publically listed
WaSCs.
Respondents’ views
Dee Valley Water and Sutton and East Surrey Water, advised by Frontier Economics, challenged the basis of
PwC’s Dimson beta calculation, and hence its use as evidence of there being no discernible difference in the
degree of systematic risk comparing WoCs and WaSCs. Assuming that PwC has used daily data, Frontier
highlighted how Dee Valley’s stock price often does not change for multiple days at a time, leading to Frontier’s
concerns over the level of illiquidity in Dee Valley’s equity. They also raised concern around the large increase in
beta in 2007, along with the possibility of statistical insignificance of the beta estimates.

Company specific adjustments to the WACC - A review of company representations
PwC 11
PwC view
Our First report stated that monthly data and a 1-month lag were used in the calculation of Dee Valley’s Dimson
beta.12
Dee Valley’s shares are not traded every day. However, there are price changes during most months. For the
period January 1995 to September 2014, Dee Valley’s share price changed from one month to the next in 213
out of 237 months. Where liquidity is low, it is preferable to use the Dimson beta because of the risk that
movements in the company’s share value are masked by illiquidity of share trading.
Our analysis includes a one month lag in calculating the Dimson beta (using monthly data over a 5 year period).
Because there is trading in Dee Valley shares in most months, this single lag should be sufficient to correct for
any illiquidity effects13.
We also tested the use of higher (monthly) lags. These are insignificant in the OLS beta regression we used. This
suggests we should not use estimates which include higher lags. Because the impact of higher lags is statistically
insignificant, the impact on the estimate of beta is small. Purely for the illustration of this point, we include
higher lags in Figure 3 and 4 below, which show minimal impact and, if anything, the beta estimates tend to rise
as more lags are used. Figure 3 shows the equity beta for Dee Valley for different numbers of lags; Figure 4
show the equivalent asset beta for Dee Valley versus those of WaSC comparators.
Figure 3 Dee Valley Dimson Equity Beta (5 year monthly, Blume adjusted)
12 Footnote 48 13 For further details on our Dimson beta estimation see appendix A
0
0.2
0.4
0.6
0.8
1
1.2
1.4
Jan
03
Ma
y 0
3
Se
p 0
3
Jan
04
Ma
y 0
4
Se
p 0
4
Jan
05
Ma
y 0
5
Se
p 0
5
Jan
06
Ma
y 0
6
Se
p 0
6
Jan
07
Ma
y 0
7
Se
p 0
7
Jan
08
Ma
y 0
8
Se
p 0
8
Jan
09
Ma
y 0
9
Se
p 0
9
Jan
10
Ma
y 1
0
Se
p 1
0
Jan
11
Ma
y 1
1
Se
p 1
1
Jan
12
Ma
y 1
2
Se
p 1
2
Jan
13
1 Lag 2 Lag 3 Lag 4 Lag

Company specific adjustments to the WACC - A review of company representations
PwC 12
Figure 4 Dee Valley Dimson Asset Beta (5 year monthly, Blume adjusted)
Source: Datastream, Capital IQ
Our First Report found that beta analysis did not suggest a difference in the systematic risk between WaSCs and
WoCs. After testing different formulations above, this finding does not change. We conclude that the Dimson
beta estimated in our First Report is robust.
2.1.5. PAYG ratios
Issue context New flexibility of PAYG ratios does not mitigate the risk arising from historical cost structure differentials
between WaSCs and WoCs.
Respondents’ views Frontier Economics state that PAYG flexibility will only have a minimal impact on historical cost structure
differences. On behalf of Dee Valley, they state that even if Dee Valley adopted a PAYG of 0%, its RCV ratios14
would still be significantly different from WaSCs over the PR14 period.
Oxera, in their report on behalf of Bristol Water, also comment upon the impact of PAYG for equity risk. They
suggest that it is total cash costs that affect the present value of costs, which means CAPEX and OPEX matter in
terms of their contribution to risk, but the remuneration of CAPEX and OPEX in the regulatory framework is
less relevant.
PwC view The use of PAYG ratios is primarily a cash flow profiling tool. It can be used to improve short-term
financeability, but can also be used to achieve a sustainable longer term balance between operational and
financing cash flows. This means the impact on cost structures will be slow and that historic cost structure
differences are likely to persist during AMP6.
14 RCV ratios refer to the ratios of totex and revenues to RCV.
0
0.1
0.2
0.3
0.4
0.5
0.6
Jan
03
Ma
y 0
3
Se
p 0
3
Jan
04
Ma
y 0
4
Se
p 0
4
Jan
05
Ma
y 0
5
Se
p 0
5
Jan
06
Ma
y 0
6
Se
p 0
6
Jan
07
Ma
y 0
7
Se
p 0
7
Jan
08
Ma
y 0
8
Se
p 0
8
Jan
09
Ma
y 0
9
Se
p 0
9
Jan
10
Ma
y 1
0
Se
p 1
0
Jan
11
Ma
y 1
1
Se
p 1
1
Jan
12
Ma
y 1
2
Se
p 1
2
Jan
13
1 Lag 2 Lag 3 Lag 4 Lag
Pennon Group Severn Trent United Utilities
Company specific adjustments to the WACC - A review of company representations
PwC 13
Despite likely cost structure differences between WoCs and WaSCs over the course of AMP6, we do not consider
there to be sufficient evidence that this requires a higher cost of equity for WoCs, for the reasons set out in
Points 2.1.3 and 2.1.4 above.
We agree that the characteristics of CAPEX and OPEX influence the risk profile of water companies, rather than
the remuneration through the regulatory framework. In our First Report we compared the variability of revenue
and costs for WaSCs and WoCs and concluded there was no conclusive evidence that the inherent variability
was any greater for WoCs.
2.1.6. Consistency between equity and debt costs
Issue context Ofwat allowed for a 25bps increase in the cost of debt, in its assessment of the finance costs for a WoC, but did
not allow any increase in the cost of equity.
Respondents’ views
Respondents suggested that Ofwat had been inconsistent in allowing a higher cost of debt for small WoCs, but
not a higher cost of equity.
PwC view Our assessment of the cost of debt uplift is based upon market observations for the typical differences in
financing costs between small WOCs and WaSCs. Our assessment of the cost of equity considered the
conceptual and empirical basis for an increase to the cost of equity.
There is no theoretical requirement that the uplift on the cost of debt and the uplift on the cost of equity are
necessarily linked, particularly when arguments for any uplift relate to different parts of the cost of debt and
cost of equity calculation methodology.
Two particular drivers of the cost of debt are (i) the size of issuers (e.g. RCV); and (ii) exposure to specific risks.
Neither of these drivers impact the cost of equity using the Capital Asset Pricing Model. These two effects are
explained below.
Firstly, size effects can explain an increase in the cost of debt, but not necessarily in the cost of equity. Whereas
there is empirical evidence to suggest smaller companies can’t typically achieve debt finance costs as low as
larger companies, the academic evidence on whether smaller companies require a higher equity return is very
mixed, and has been discounted by sector regulators and the CMA.15
Secondly, specific risk factors can affect the contracted cost of debt. This is because debt finance providers set
their return requirements on the basis of the probability of default. Any specific risk which increases the
probability of default will therefore increase cost of debt, as reflected in the coupon rate when a new bond is
issued. In contrast, equity investors can diversify specific risks when equity investments are held as part of a
diversified portfolio. This means that equity investors do not require compensation for bearing specific risks.
Examples of specific risk factors include asset, resource and customer diversification. In the case of higher
specific risks for WoCs, which are relevant to debt financing costs, the appropriate treatment is to set a lower
financial gearing assumption or higher cost of debt assumption in the WACC; we recommend the latter.
We therefore consider there is both a theoretical basis and empirical evidence to support an uplift to the cost of
debt and no uplift to the cost of equity. 15 This point was previously addressed in Section 3.3 of our First Report.

Company specific adjustments to the WACC - A review of company representations
PwC 14
2.2. Cost of debt
2.2.1. Previous regulatory decisions on embedded debt costs
Issue context Ofwat has previously allowed the recovery of efficiently incurred embedded debt costs.
Respondents’ views Respondents suggested that the approach taken in the PR14 Draft Determinations is inconsistent with past
regulatory decisions from Ofwat (PR99 and PR04), where they argue that actual debt costs were considered to
some degree. Respondents also highlight that a partial pass through of actual debt costs can still provide
incentives for efficient financing. A number of respondents have also suggested that Ofwat’s approach is
inconsistent with that of the CC and more recently the CMA. The CC/CMA used an assessment of the embedded
debts costs for the relevant company, rather than a broader industry benchmark, in both the Bristol Water
PR09 appeal and the Northern Ireland Electricity price determinations.
PwC view
The issue of embedded debt costs is relevant to the assessment of the industry-wide notional cost of capital, but
has a particular impact on a number of the WoCs with high actual embedded debt costs. Therefore, we address
this issue in this report, but our views are also applicable to the assessment of the industry-wide cost notional of
capital which we set out in, ‘Updated evidence on the WACC for PR14: A report prepared for Ofwat’.
In PR04 Ofwat made no explicit allowance for embedded debt, but did cross check its cost of debt estimate
against a company which requested an embedded debt premium. The determination stated that:
“In our assessment of the cost of debt we have placed greater emphasis on longer term historic
averages for the risk-free rate and the debt premium. Our cost of capital assumes a cost of debt
towards the high end of the range (as shown in table 45). Consequently, the arguments for an
embedded debt premium are much weaker. A limited number of companies put forward a case for
embedded debt premiums in their final business plans. We have reviewed these. In most cases the
evidence did not support such a premium but one company did set out a justification. However, its
overall cost of debt in its business plan (including the high coupon fixed rate element) was lower than
our assumption. Consequently, we have concluded that no additional premium is required.”
In PR09 Europe Economics16
, on behalf of Ofwat, set out three approaches which could be taken to the issue of
embedded debt:
a. Making full allowance for embedded debt on a company-by-company basis;
b. Applying an embedded debt adjustment based on average embedded debt costs across the industry;
c. Making no allowance for embedded debt.
They concluded that option ‘b’ provided “better incentive properties” for efficient financing than ‘a’, and that
option ‘c’ provided the strongest incentives.
Ofwat’s Final Determination for PR09 stated that, “Consistent with our draft determinations we have assumed
a real cost of debt of 3.6%. In doing so, we have drawn on direct observations from companies’ existing debt
16 http://www.ofwat.gov.uk/pricereview/pr09phase3/rpt_com_20091126fdcoc.pdf

Company specific adjustments to the WACC - A review of company representations
PwC 15
portfolios and forward projections. The cost we have assumed for existing debt is 3.4%.” Therefore, the PR09
approach was more similar to option ‘b’ set out above.
Consistent with PR09, Ofwat has allowed embedded debt costs incurred as a consequence of debt finance which
companies have previously issued, but which is still outstanding as part of the package of assumptions used for
deriving the allowed WACC for an efficient company with a notional capital structure. The applicable debt
finance costs for such debt finance is a historical issuance cost. Ofwat has considered a range of evidence of
both historical issuance costs for water company bonds and benchmark yields for investment grade corporate
debt with a rating in the A/BBB range. Rather than taking water company bond issues directly, they have placed
more weight on investment grade corporate debt benchmarks, but allow for typical water company out-
performance in relation to these benchmarks. Using this approach, Ofwat ensures that debt timing risks are
managed by companies, which may not be the case by relying only on industry-specific benchmarks to set
efficient embedded debt benchmarks, as in “b” above.
Ofwat has regularly stated that it will use a single notional industry-wide cost of capital. This was supported by
our report on the methodology for assessing the cost of capital for PR1417. A single notional industry-wide cost
of capital encourages regulated water companies to finance their activities efficiently, whereas allowing
companies to recover their own actual embedded debt costs risks blunting incentives for efficient financing. We
apply the same principle when assessing the cost of financing for small WOCs. We conclude that as a group,
small WoCs typically have higher debt finance costs, and set a single uplift to the relevant notional cost for the
group. We do not generate company-specific uplifts based upon their actual debt finance costs.
We consider it important to preserve incentives for WaSCs and WoCs to finance themselves efficiently. This is
because water companies are best placed to manage the timing of debt issuance and choice of debt finance
market and instrument. Hence, we consider that Ofwat should use a benchmark for efficient financing, but
should expect some water companies to outperform this benchmark and some companies to underperform this
benchmark.
In past determinations, the CC has taken into account actual embedded debt costs. However, we consider that
the CC has not suggested that use of an industry-wide notional cost of debt is inappropriate. The CC stated that:
“We estimate the real cost of Bristol Water’s existing debt at 3.53 per cent (see Annex 3). If we add
issuing costs for a company of Bristol Water’s size (which we estimate to be about 0.1 per cent) and
allow for minimum cash balances of about £10 million (about 0.2 per cent), we arrive at 3.83 per cent,
which is very close to Ofwat’s projected cost of existing debt of 3.8 per cent [based on 3.4% with a small
company uplift of 0.4%]. In this case, therefore, the approach to existing fixed-rate debt makes little
difference to the WACC.”18
We recommend Ofwat continues with its approach of setting an industry-wide cost of capital, with the only
adjustment being for small WoCs in relation to their debt finance costs. We recommend this adjustment reflect
an assessment of the relevant debt costs for the WoC group, as a whole, rather being individually set for
individual companies.
17 PwC (2013), “Cost of capital for PR14: Methodological considerations” 18 Competition Commission (2010), ‘Bristol Water plc - A reference under section 12(3)(a) of the Water Industry Act 1991’

Company specific adjustments to the WACC - A review of company representations
PwC 16
2.2.2. Bank debt issuance costs
Issue context There are arguments that transaction costs and fees associated with bank financing have not been fully
accounted for.
Respondents’ views
Respondents stated that PwC’s estimate of the cost of debt was incomplete. This is because it had not factored
in transaction costs and fees associated with bank financing, which will be proportionally higher on a per-
annum basis than transaction costs of longer-term bond financing.
PwC view Our First Report also concluded that the cost of bank financing was higher for WoCs than for WaSCs, when
financed at the same time (although those WoCs which have bank financing are currently benefitting from low
short-term interest rates).
We validated the 10 bps industry-wide issuance cost assumption by reviewing the issuance cost for Artesian
debt issues, which constitute around 80% of WoC debt financing.
Our calculation of the average amortised issuance costs for Artesian issues – compromising the majority of
WoC debt - was 6bps. The cost of issuance fees for bank debt is likely to be higher, largely because of the typical
maturity of bank debt finance, which is shorter than most bond issuance. Interviewees from banks who provide
debt finance to the water sector informed us that arrangement fees can be around 50 bps, or 10 bps amortised
over 5 years. Commitment fees can add a similar amount, suggesting an overall annual 20 bps figure for overall
debt issuance and maintenance costs.
Even with higher amortised debt issuance and maintenance costs for bank finance, the average issuance cost
across all WoC financing still does not exceed 10bps. This is because bank finance represents a relatively small
portion of WoC debt finance (c.9%).We therefore recommend Ofwat continue to use a 10 bps assumption for
amortised debt issuance costs for WoCs.
2.2.3. Frequency of debt raising and timing risk
Issue context On average, WoCs access bond markets less frequently than WaSCs. This is partly a function of their borrowing
requirements and the minimum size required to access bond markets. This exposes them to a greater degree of
timing risk relative to WaSCs who frequently issue bonds.
Respondents’ views Respondents have raised concerns about having to fully bear timing risk in relation to embedded debt. They are
concerned that setting the WACC without an allowance for actual embedded debt costs will jeopardise
financeability. Additionally, WoC respondents think it is inappropriate to penalise them for the timing of debt
issuance as they have no way of mitigating these timing risks. This is because smaller issuance sizes are not
possible for WoCs as bonds need to meet minimum size thresholds to be viable, and short-term bank loans
involve substantial costs associated with issuance and facilities. Respondents suggested that efficiently issued
debt should be allowed for to some degree, regardless of timing.

Company specific adjustments to the WACC - A review of company representations
PwC 17
PwC view In our earlier report for Ofwat, we set out our views of the appropriate methodology for assessing the cost of
capital for PR14. We suggested that water companies are best placed to manage the timing and frequency of
debt financing, as opposed to passing this risk onto customers. This means that companies should be able to
benefit from out-performance, or bear the risk of under-performance of debt finance costs in relation to debt
issuance timing19. Different companies at different times have both benefitted and suffered from such an
approach where they bear finance timing risk.
We note that Europe Economics in their analysis on behalf of Ofwat at PR09 stated that, “In PR09 Ofwat is
facing the situation that some water companies have taken out significant volumes of debt in the period up to
mid-2007 at low rates. If Ofwat were to take account of this embedded debt, in line with its approach at PR
99, this may reduce price limits below what they would otherwise be.” Had Ofwat taken account of actual
embedded debt more directly in PR09, the WACC would have been lower. This means that companies have
benefited from bearing finance timing risks in the past. This helps to show that timing risks can be both
beneficial and detrimental to regulated water companies.
Figure 5 below demonstrates that previous determinations by Ofwat have allowed a real cost of debt
significantly above the real cost of Artesian debt. Therefore, WoCs have previously benefitted from the timing of
from this type of financing prior to PR14.
Figure 5 Artesian effective interest cost and the allowed cost of debt
Source: Ofwat final determinations, company submissions
We acknowledge WoCs access bond markets less frequently, although average debt maturity profiles for WaSCs
and WoCs are broadly similar (see appendix B). This means that WoCs are exposed to more timing risk, but not
debt maturity profile risk. Higher timing risk can be taken into account in two ways:
We have assessed WoC debt finance costs across a range of finance types which they use, partly as a
consequence of their smaller size and timing risks. This means we include bank finance in our
assessment of debt finance costs.
The use of outcome incentive calibration (and totex menu choices after Final Determinations) can narrow
overall risk differences between WaSCs and WoCs.
19 PwC (2013), “Cost of capital for PR14: Methodological considerations”
2.0%
2.5%
3.0%
3.5%
4.0%
4.5%
5.0%
5.5%
Ap
r 0
0
Oct 0
0
Ap
r 0
1
Oct 0
1
Ap
r 0
2
Oct 0
2
Ap
r 0
3
Oct 0
3
Ap
r 0
4
Oct 0
4
Ap
r 0
5
Oct 0
5
Ap
r 0
6
Oct 0
6
Ap
r 0
7
Oct 0
7
Ap
r 0
8
Oct 0
8
Ap
r 0
9
Oct 0
9
Ap
r 1
0
Oct 1
0
Ap
r 1
1
Oct 1
1
Ap
r 1
2
Oct 1
2
Ap
r 1
3
Oct 1
3
Ap
r 1
4
Oct 1
4
Rea
l c
os
t o
f d
eb
t
Ofwat WaSC allowed cost of debt Ofwat WoC allowed cost of debt (lower)
Ofwat WoC allowed cost of debt (upper) Artesian yields at issuance
PR99 PR04 PR09

Company specific adjustments to the WACC - A review of company representations
PwC 18
2.2.4. Efficiency of Artesian finance
Issue context WoCs issued long term Artesian debt20 from 2002 to 2005 and it remains a key source of their outstanding
borrowings.
Respondents’ views
Respondents suggest that Artesian debt was issued to enable WoCs to increase their gearing towards Ofwat’s
guideline on “efficient company” gearing levels. Respondents have shared additional advisor reports which
suggest that Artesian debt was efficiently priced compared to other debt benchmarks at the time of issue.
Respondents believe that efficiently incurred debt costs should be recoverable.
PwC view We do not opine on the efficiency of individual company debt financing. Given an efficient debt finance cost
benchmark using a range of industry-wide evidence, we expect that some historic water company issuance may
be above this benchmark and some issuance may be below this benchmark. One reason why some water
companies have higher embedded debt costs is due to the timing of their issuances, and much of the Artesian
debt was issued over the period 2002 to 2005, when long-term interest rates were higher than they currently
are.
We consider that water companies are best able to manage the timing of their debt issuance and hence should
be able to benefit from any out-performance, or bear the risk of under-performance. Where a water company
decides to finance a large proportion of its business at one point in time, then companies should recognize that
this exposes them to both upside and downside finance risk, depending upon the evolution of debt finance
costs.
2.2.5. Benefits of long term debt
Issue context Water companies typically use long-term debt finance for the majority of their debt finance needs. This enables
them to finance long-term assets and limits liquidity/re-financing risk.
Respondents’ views Dee Valley states that long-term debt is a benefit to customers, as it protects them from ‘cliff-face’ and ‘cliff-
edge’ bill changes between regulatory periods. It also protects them from short-term financing decisions. Dee
Valley suggests companies should be allowed to recover all efficiently incurred long-term debt finance from
customer bills.
PwC view We use a long-term debt finance cost benchmark in assessing our efficient cost of debt. Companies are best able
to manage the term, issuance timing, debt instruments and debt market and may therefore out-perform this
benchmark. We consider it is in the long-term interests that companies are incentivised to raise debt finance
efficiently and any move to allow the recovery of actual debt finance costs could reduce such incentives.
20 In 2002, the Royal Bank of Scotland (RBS) created the first Artesian Finance facility with the purpose of pooling the debt financing needs of small water companies and, in doing so, reducing the higher financing costs typically associated with small debt issuances. Between June 2002 and December 2005 six WoCs, and one WaSC, borrowed through the Artesian financing facilities.

Company specific adjustments to the WACC - A review of company representations
PwC 19
Furthermore, any ‘cliff-face’ or ‘cliff-edge’ bill profiles can be managed through the use of financeability levers
introduced for PR14.
2.2.6. Comparators for bond analysis
Issue context Our First Report used a range of comparators bonds to test whether WoCs face a higher debt finance cost
compared to WaSCs.
Respondents’ views Frontier Economics, on behalf of South East Water, found that one of the comparator bonds used in PwC’s
analysis of the cost of new debt for large WoCs was unsuitable. Frontier’s inspection of the bond showed that
the ‘Thames Water 2030’ bond has a variable coupon rather than a fixed coupon. A call option also exists on the
bond, and therefore it could not be compared with South East Water’s bond on a like-for-like basis. Removing
this bond from the analysis would show that South East’s bonds do have a positive spread over other WaSC
comparator bonds (i.e. a higher yield). Frontier calculates that South East’s bond has a spread of 28bps over an
alternative set of WaSC comparators.
PwC view We confirm the bond issued by Thames Water Utilities Cayman Finance Limited has a variable coupon and call
option, meaning it should not have been compared directly to the yields on the fixed coupon South East Water
bond. Removing the Thames bond from the analysis would result in South East Water’s bond yield having a
positive spread over that the Wessex Water and Severn Trent bond yields (the other WaSC comparators we
used in our first report) – see figure 6 below for traded yields with the Thames Water bond removed.
However, evidence from another bond issued by Affinity Water (another large WoC) has very similar yields to
WaSC comparators (see Figure 7 below for traded yields).
Furthermore, we estimate Affinity Water to have a cost of embedded debt of 2.1% and South East Water 3.1%.21
This shows that Affinity Water’s embedded cost of debt was comfortably below Ofwat’s notional industry
embedded debt benchmark of 2.65%, whereas South East Water was above. On average, the large WoCs are
therefore close to the WaSC embedded debt benchmark.
Therefore, we retain the view that the large WoCs do not require an uplift to the cost of debt.
21 Based on A21 tables from March 2013 and applies a 2.8% inflation assumption. Real coupons on South East Water’s Artesian index-linked loans adjusted following July query – consistent with the figures used in our previous report.

Company specific adjustments to the WACC - A review of company representations
PwC 20
Figure 6 Yield on to maturity on South East Water 2029 bond and WaSC comparators
Figure 7 Yield on to maturity on Affinity Water 2022 bond and WaSC comparators
Source: Capital IQ, Datastream
2.2.7. Time period and scope of assessment for cost of debt
Issue context The time frame used to assess the embedded cost of debt was too narrow.
Respondents’ views
On behalf of South East Water, Frontier Economics stated that the period of embedded debt cost analysis for
bond issuance was arbitrary, and had no particular justification. Therefore, they extend the analysis back to
2002 (previously 2008), in line with PwC’s analysis of Artesian debt. Whereas PwC’s analysis showed that large
WoC bond issuances did not include a premium over those of WaSCs, Frontier’s extended period shows a
spread of 7bps above those of WaSCs (Figure 8 below shows Frontier’s analysis of the extended time period).
Frontier states that they still do not consider this as a robust statistical analysis, because of the small number of
observations.
2.0
3.0
4.0
5.0
6.0
7.0
8.0 M
ar
09
Se
p 0
9
Ma
r 1
0
Se
p 1
0
Ma
r 1
1
Se
p 1
1
Ma
r 1
2
Se
p 1
2
Ma
r 1
3
Se
p 1
3
Ma
r 1
4
Yie
ld (
%)
South East Water 2029 Severn Trent Water 2029
Wessex Water 2028 Thames Water 2030
2.0
2.5
3.0
3.5
4.0
4.5
Feb
13
Ma
r 1
3
Ap
r 1
3
Ma
y 1
3
Ju
n 1
3
Ju
l 13
Au
g 1
3
Se
p 1
3
Oct 1
3
No
v 1
3
De
c 1
3
Ja
n 1
4
Feb
14
Ma
r 1
4
Yie
ld (
%)
Affinity Water 2022 Wessex Water 2021
Anglian Water 2022 Northumbrian Water 2023
Excluded Thames Water
bond

Company specific adjustments to the WACC - A review of company representations
PwC 21
PwC view Our First Report acknowledged that bond issuances by WoCs have been limited and for this reason placed more
emphasis on the analysis of Artesian debt (which accounts for 80% of WoC debt financing). The extension of
the time period, from 2008 back to 2002 by Frontier, allows the addition of one extra data point for a large
WoC bond issue in 2003 (see Figure 8 below). An inspection of this additional data point shows that large WoC
bond financing costs are within the range of WaSC bond financing costs. Consequently there is insufficient
evidence to show that the large WoCs incur higher debt finance costs. This analysis does provide evidence of
high debt financing costs for small WoCs.
Figure 8 Frontier Economics extended debt cost analysis
Source: Frontier Economics
2.2.8. Costs of carry
Issue context PwC’s analysis does not account for the costs of carry faced by small water companies.
Respondents’ views
Costs of carry are incurred when a water company needs to raise more debt finance than it immediately needs,
so that the issuance is of sufficient size. These costs may be more pronounced for smaller WoCs because their
financing needs are not as large. This results in a temporary loss of the difference between the borrowing rate
and the cash deposit rate until the cash resources are deployed in the business. Frontier Economics on behalf of
South East water calculate a cost of carry premium for a WaSC of 0.2%. They then also make further additions
to this amount for additional transaction costs and costs of carry for a large WoC compared to a WaSC.
Extended evidence of
large WoC issuance
costs

Company specific adjustments to the WACC - A review of company representations
PwC 22
PwC view The water company with a notional financing structure is assumed to have efficient treasury management. We
recognize that companies need to maintain a prudent level of cash balances and may be required to hold cash
balances for other requirements such as borrowing covenants. This means that a proportion of borrowings are
not invested in regulated assets and instead earn only the return offered by banks on short term cash deposits.
Alternatively, companies may arrange debt facilities which provide access to short-term funding, but such debt
facilities also incur costs.
The Competition Commission accepted that these costs add to the cost of the business and allowed an uplift to
the cost of capital in its review of the PR09 determination for Bristol Water.22
The impact of this additional cost on the overall cost of debt depends upon both the relative size of cash
balances and the magnitude of the differential between deposit rates and borrowing rates. WoCs on average
have cash balances close to 5% of total debt (based on 2014 regulatory accounts). The average cash balances
across the WaSC group are very similar – 5% on average for 2014 - suggesting the impact of carry costs is
comparable for WaSCs and WoCs.
We assess the broad impact of carry costs using the following assumptions. Current nominal yields on short-
term deposits are low, and assumed to be equal to 6 month Libor. We assume a nominal cost of debt of 5.5%23.
We calculate the ‘cost of carry’ as the difference between the short-term deposit rate and the nominal cost of
debt; this is currently 4.8%. Applying this cost of carry to the proportion of debt that is cash balances, we
estimate that this cost is an equivalent to an uplift of around 14bps on the WACC for a typical WoC.
However, current low nominal short-term interest rates have other, offsetting financing cost benefits which are
not separately adjusted for in Ofwat’s estimate of WACC. Water companies typically have exposure to some
floating rate debt and/or short-term debt - WoCs on average have approximately 5% floating debt - and
therefore benefit from a lower cost of debt than that assessed by reference to long-term borrowing costs.
Allowing for a margin on floating rate debt of approximately 1.1% above LIBOR24, we calculate that the current
cost of floating debt is approximately 3.70% below the assumed nominal cost of debt. Applying this discount to
the portion of debt which is floating lowers the overall WACC by approximately 12bps.
Figure 9 below shows the relationship between these two offsetting impacts. In this analysis, we fix the long-
term real cost of debt and inflation assumptions, but vary the short-term nominal interest rate. We also hold
constant the proportion of cash balances and the proportion of floating debt.
22 Competition Commission (2010) Bristol Water plc - A reference under section 12(3)(a) of the Water Industry Act 1991, Appendix N, para. 48. 23 This is the implied nominal cost of debt allowed in PR14 assuming Ofwat sets a real cost of debt of approximately 2.6% and applies an inflation assumption of 2.8%. 24 Based on interview evidence with banks.

Company specific adjustments to the WACC - A review of company representations
PwC 23
Figure 9 Comparative impact on WACC of carry cost and floating debt assumptions
Source: PwC analysis
This analysis shows how these two factors have offsetting impacts on the overall cost of capital as short term
nominal rates vary. On this basis, we consider that an uplift to the cost of capital to compensate for the cost of
carry is not required as there are offsetting factors, which are not separately incorporated into Ofwat’s WACC
framework.
This analysis also shows the benefit of using a simple long-term debt financing cost for regulatory purposes, by
avoiding the need to replicate or opine on the efficiency of short-term treasury management approaches, which,
in our opinion, should be left to water company management.
-0.2%
-0.1%
0.0%
0.1%
0.2%
0.0% 0.5% 1.0% 1.5% 2.0% 2.5% 3.0% 3.5% 4.0%
Imp
ac
t o
n W
AC
C
Short-term nominal interest rate
Impact of carry costs Impact of floating debt

Company specific adjustments to the WACC - A review of company representations
PwC 24
3. Conclusion
Overall, we find there are no substantive reasons to change the conclusions set out in our First Report. As a
result, our recommendation to Ofwat remains unchanged. We continue to recommend that Ofwat applies 25bps
uplift to the cost of debt for small WoCs, and maintain that no WoCs should receive an uplift to the cost of
equity.

Company specific adjustments to the WACC - A review of company representations
PwC 25
Appendix A. - Dimson beta
Notes on the Dimson Beta analysis
The beta is calculated using 5-years of monthly returns.
The Dimson beta calculation uses a single lag and no leads. This is the recommended approach for
Dimson betas as additional lags result in an estimate that is less statistically robust.
To be consistent with the calculation of the other equity betas in the Figure 12 of our First Report, the raw
Dimson beta was Blume adjusted.
The sharp increase in beta in 2007 is due to a change in the correlation of returns between the FTSE All
Share and Dee Valley's share prices – in mid-2002 steep rises in Dee Valley’s share price associated with
their restructuring announcements had a large negative correlation with the significant downward
movements in the FTSE All share – the beta coefficient rose as these data points left the beta estimation
sample.
In terms of the liquidity of Dee Valley's shares, the monthly trading volumes are relatively low but there
is at least some trading in most months. In contrast, the daily data indicates that there are periods of
multiple days without trading or price changes. This supports the use of the monthly Dimson beta, as the
daily data is probably too static and would therefore require multiple lags in the beta calculation.

Company specific adjustments to the WACC - A review of company representations
PwC 26
Appendix B. - Debt maturity profiles
The debt maturity profile for WoCs and WaSCs is currently very similar as shown in the figure below.
Figure 10 Weighted average years to maturity on outstanding debt
Source: Company submissions
0
5
10
15
20
25
30
TMS UU SVT ANH YKY WSH SRN NES SWT WSX SEW AFW BRL SSC SES SBW PRT DVW
Ye
ars
Weighted average years to maturity WASC Average WOC Average

This report has been prepared for and only for Ofwat in accordance with the terms of our Service Order dated 6 August 2013 and for no other purpose. We do not accept or assume any liability or duty of care for any other purpose or to any other person to whom this report is shown or into whose hands it may come save where expressly agreed by our prior consent in writing. In the event that, pursuant to a request which Ofwat has received under the Freedom of Information Act 2000 or the Environmental Information Regulations 2004 (as the same may be amended or re-enacted from time to time) or any subordinate legislation made thereunder (collectively, the “Legislation”), Ofwat is required to disclose any information contained in this report, it will notify PwC UK promptly and will consult with PwC UK prior to disclosing such report. Ofwat agrees to pay due regard to any representations which PwC UK may make in connection with such disclosure and to apply any relevant exemptions which may exist under the Legislation to such report. If, following consultation with PwC UK, Ofwat discloses this report or any part thereof, it shall ensure that any disclaimer which PwC UK has included or may subsequently wish to include in the information is reproduced in full in any copies disclosed. © 2014 PricewaterhouseCoopers LLP. All rights reserved. In this document, "PwC" refers to PricewaterhouseCoopers LLP (a limited liability partnership in the United Kingdom), which is a member firm of PricewaterhouseCoopers International Limited, each member firm of which is a separate legal entity 130625-101207-CL-OS