Embed Size (px)
Citation preview

Company presentation
September 2019

First choice for anyone who wants to shop convenient,
smart, big and at low price
3

Europris – a growth story
4
NOK million
0
1 000
2 000
3 000
4 000
5 000
6 000
1992 1993 1994 1995 1996 1997 1998 1999 2000 2001 2002 2003 2004 2005 2006 2007 2008 2009 2010 2011 2012 2013 2014 2015 2016 2017 2018
25 years of
growth
Store #250
Listing
on
Oslo
Børs
JV with
Tokmanni
and opened
Shanghai
sourcing
officeAcquired by
Nordic Capital
Central
warehouse
opened in
FredrikstadStore
#150
Acquired by
IK
Investment
Partners
Store #100
Founded by
Wiggo
Erichsen
Wholesale
agreement with
Terje Høili AS

Customers
Logistics• More than 40 years of wholesaler experience
• Efficient set-up and nationwide reach
• New modern central warehouse from Q2 2019
Marketing
5
Sourcing
Stores
• From more than 30 countries
• Pan-Nordic agreement with ÖoB and Tokmanni
• Over 1 million leaflets in distribution
• More than 300 000 subscribers to digital newsletter
• Cost-efficient locations and operations
• 224 of 238 like-for-like (LFL) stores profitable in 2018
• Track-record of 15 new or relocated stores p.a.
• 31 million customer transactions in 2018
• Widely recognised brand and price position1
1 Mediacom annual market survey
Norway’s #1 discount variety retailer
264Stores

With a strong brand
Source: Mediacom annual market survey
Ranking among wide variety retailers (Biltema, Clas Ohlson, Coop OBS,
Europris, Jernia, Jula, Jysk, Nille, Plantasjen, Rusta)
100% #1Recognition Price perception
6

Sustainability is an integrated part of the strategy
1 MediaCom – barriere survey 2018 7
Sustainable value
chain
Resource efficient
business modelResponsible
employer
Palm-oil-free products
Supporting plastic waste
reduction with a plastic bag fee
Increased share of sourcing to
>85% from certified factories
(BSCI, Sedex, ICTI)
Energy consumption reduced
by 23% since 2014
65% waste sorting, moving
towards target of 80%
Energy efficient and
environment-friendly new
warehouse
Well-being and job satisfaction at
all-time high
Interactive training of all
employees
Guidelines and training for ethical
businesses conduct, anti-
corruption and whistleblowing
routines
In-house testing and control to
improve product safety
Customer satisfaction increased
18% since 20141
Support for Church City Mission,
work training and sponsorships
Selected
initiatives
Satisfied customers
and local
communities
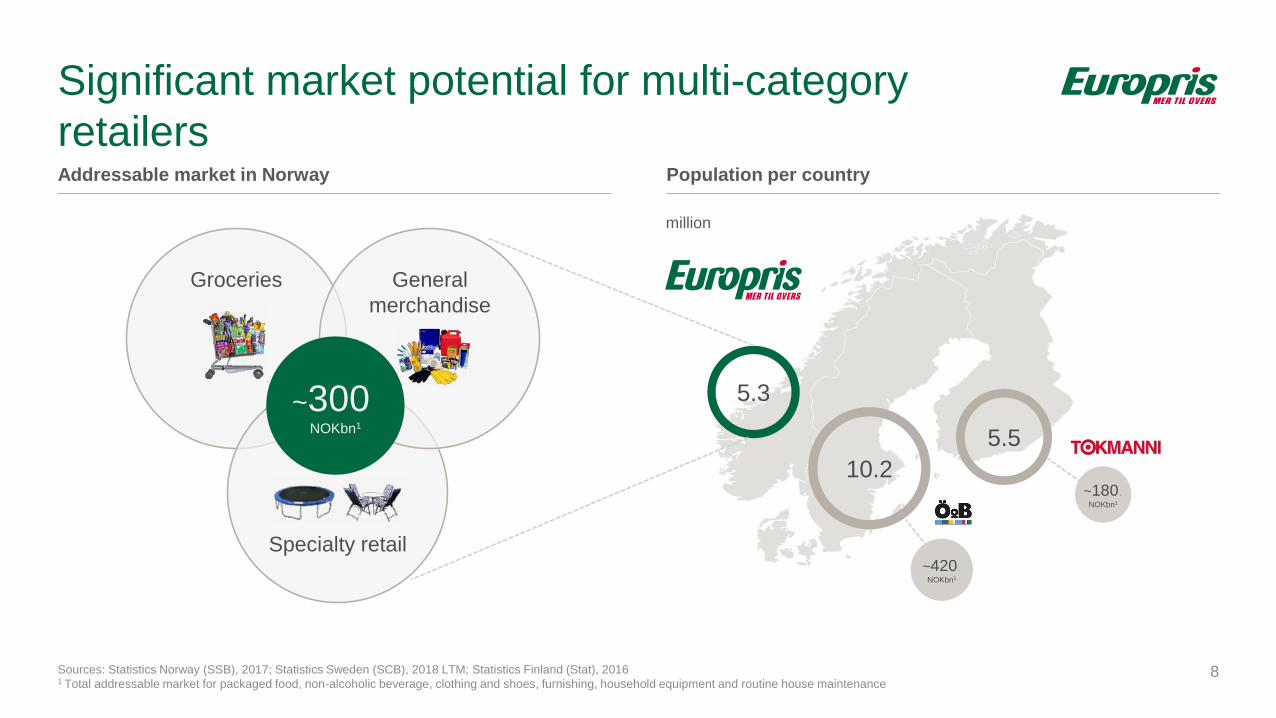
Addressable market in Norway
Significant market potential for multi-category
retailers
Sources: Statistics Norway (SSB), 2017; Statistics Sweden (SCB), 2018 LTM; Statistics Finland (Stat), 20161 Total addressable market for packaged food, non-alcoholic beverage, clothing and shoes, furnishing, household equipment and routine house maintenance
8
Population per country
million
Groceries
Specialty retail
General
merchandise
~300. NOKbn1
5.3
10.2
5.5
~420.NOKbn1
~180.NOKbn1

In a world of winners and losers, variety
retail is thriving
1 General retailers with wide discount range.
Source: Euromonitor International; see appendix for full presentation9
While online is challenging bricks-and-mortar… Variety retail has grown ~twice the speed of all retail
Online share of retail salesPercent
Sales growth total vs. variety retailCAGR 2012-17, constant
14
16
4
0
12
2
8
6
10
20172007 2012
+3.9 p.p.
+5.4 p.p.
+5.0 p.p.
+10.8 p.p.
+7.5 p.p.
3%
5.7%
6.5%
2%
4.7%
0.5%
2%
3%
6.5%
3%
Variety retail1
Total retail
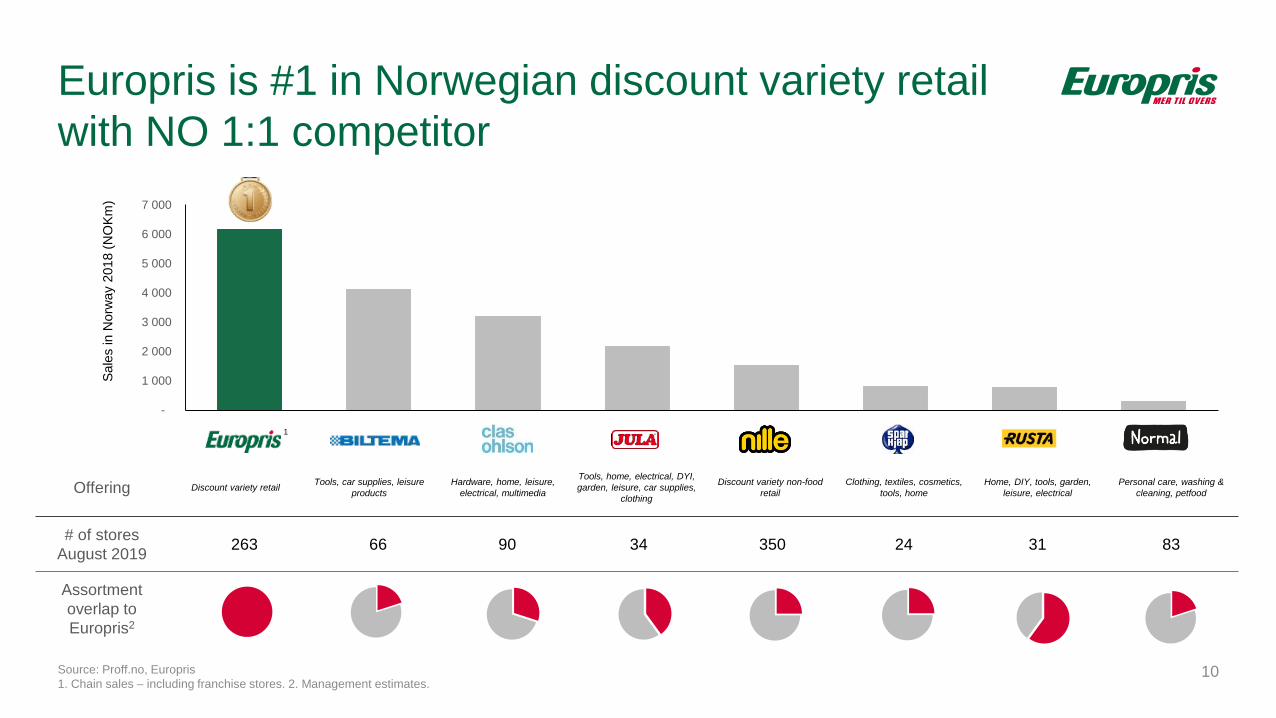
Europris is #1 in Norwegian discount variety retail
with NO 1:1 competitor
10
Offering Discount variety retailTools, car supplies, leisure
products
Hardware, home, leisure,
electrical, multimedia
Tools, home, electrical, DYI,
garden, leisure, car supplies,
clothing
Discount variety non-food
retail
Clothing, textiles, cosmetics,
tools, home
Home, DIY, tools, garden,
leisure, electrical
Personal care, washing &
cleaning, petfood
# of stores
August 2019263 66 90 34 350 24 31 83
Assortment
overlap to
Europris2
Sale
s in N
orw
ay
2018 (
NO
Km
)
Entered in
2014
1
-
1 000
2 000
3 000
4 000
5 000
6 000
7 000
Source: Proff.no, Europris
1. Chain sales – including franchise stores. 2. Management estimates.

Track record of above-market growth
1 Europris group figures2 Europris chain figures3 Kvarud Analyse: Norwegian shopping centre index
11
Revenue and EBITDA margin1 Total growth for Europris and market2,3
4,3
4,6
5,1
5,4
5,8
13%14%
13%12% 12%
2014 2015 2016 2017 2018
Revenue EBITDA margin
9,3%
8,4%
7,7%
6,0%
5,3%
2014 2015 2016 2017 2018
Europris Kvarud
NOK billion

Be the best discount variety retailer in Europe
12Fogra Reklamefoto

Strategic focus areas
Strengthen price
and cost position
Drive customer
growth
Improve customer
experience
13

Strengthen price and cost position
Strengthen price
and cost position
Drive customer
growth
Improve customer
experience
14

No compromise on low prices
15
Unbeatable price on frontpage products in the weekly leaflet
Compete for the lowest prices on other weekly leaflet products
and feature and profile products
Always lower prices than
specialty stores on all other
products
Competitive prices on all other
products compared to
discount variety retailers
10-12%
of sales
15-17%
of sales
70-75%
of sales

Significant economics of scale from Nordic sourcing
16

Securing lower costs through sourcing
agreements with Tokmanni and ÖoB
17
2013
Tokmanni sourcing
agreement
2018
Europris acquires
20% of ÖoB
2020
Option to acquire
remaining shares in ÖoB

ÖoB – a perfect partner
18
90% category overlap
Mutual value best practice:
ÖoB: living in a lower price
market environment
Europris: seasons and
inspiration
Strong cultural fit
Europris version 5.1 ÖoB new concept store

Launching the first Nordic
private label
19
• Strong position in Norway within
Washing & Cleaning
• Annual sales above NOK 100m
across multiple categories
• Driver for gross margin
• Pan-Nordic brand
• ÖoB set to launch in 2019
• Scale and best practice to
improve margins
Today
In the future
Value to customers
• Increased offering of price points
(good, better, best)
• Top level quality product at
significant lower price points
than A-brands

20
Futureproofing distribution

75 40070 900
100 700
62 000
No of pallets Rented area m2
Old set-up with five warehouses New warehouse
Moving from five warehouses to one
21
• New, modern and purpose-built facility
• Enables efficient personnel and system operations
• Single-site logistics
• Fully automated high-bay storage
• Automated order-picking stations
• 15-year lease with extension right1
• Open book principle based on agreed project yield (subject to
cap on annual rent)2
• Lease with Fabritius Gruppen AS
• Prepared for future expansions to support long-term
growth ambitions
• Partly operational from 2019, fully from 2020
• Øra warehouse to provide backup capacity
Total
capacity
+34%
Rental area
-13%
1 Extension rights of five, five and ten years consecutively 2 Changes in construction costs will only be subject to yield when calculating rent. No further charges/margins

- Main production sites
- Buffer storage
- 3PL handling
Warehouse automation in low bay storageTaking it one step further
From inefficiency (2019) To efficiency (2020/2021) To Nordic retail best practice (2021/2022)
22

Continued development and strengthening
of concept
Strengthen price
and cost position
Drive customer
growth
Improve customer
experience
23

Has generally low prices
Has a wide selection of products
Has good products to reasonable prices
Has products of good quality
A place where one can make a bargain
Has a good seasonal assortment
A place I shop often
A nice place to shop
Using customer feedback to improve offering
Source: Mediacom annual market survey
Ranking among wide variety retailers (Biltema, Clas Ohlson, Coop OBS,
Europris, Jernia, Jula, Jysk, Nille, Plantasjen, Rusta)
24
Customer survey questions Perception development 2014-2018 (indexed)
1 +10%
+34%
+33%
+63%
+35%
+64%
+50%
+61%
2
3
4
5
6
7
8
#1
#4
#4
#8
#1
#2
#1
#4

New concepts improve the customer experience
25
From Today In future
More distinct shops-in-shops
Customer need-based flow
Improved lay-out of dedicated
seasonal area
Simplification of in-store
communication
Europris 6.0 concept focus
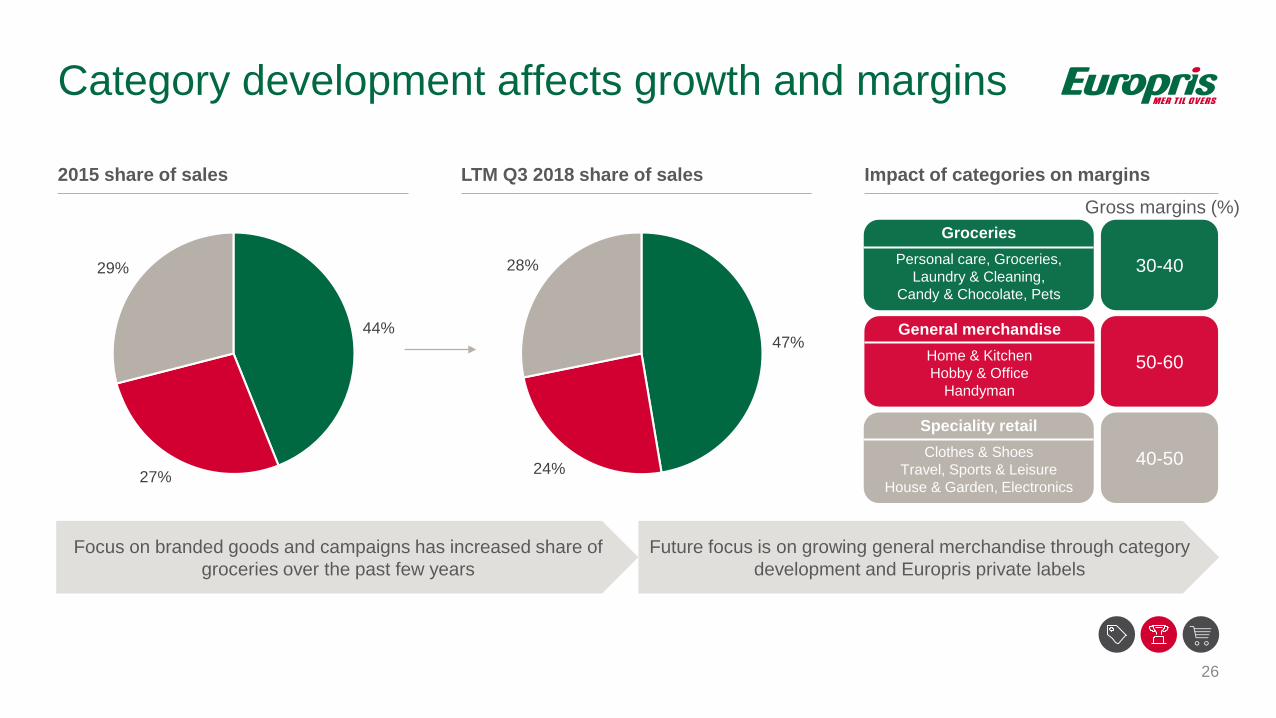
44%
27%
29%
47%
24%
28%
Category development affects growth and margins
2015 share of sales LTM Q3 2018 share of sales Impact of categories on margins
Gross margins (%)
Focus on branded goods and campaigns has increased share of
groceries over the past few years
Future focus is on growing general merchandise through category
development and Europris private labels
26
Groceries
Personal care, Groceries,
Laundry & Cleaning,
Candy & Chocolate, Pets
Speciality retail
Clothes & Shoes
Travel, Sports & Leisure
House & Garden, Electronics
General merchandise
Home & Kitchen
Hobby & Office
Handyman
30-40
40-50
50-60

Constant category evaluation and refining
27
Assortment optimisation
Redesigned packaging
Campaign development
Revitalised marketing
Improved in-store
communication
In-store optimisation
Our proven
category
management
tools

Digital strategies to drive physical sales
Strengthen price
and cost position
Drive customer
growth
Improve customer
experience
28

Bridging digital opportunities and physical stores
29
• Digital channels are an increasingly important
supplement to the physical store
• Reach new and younger customer groups
• Be relevant and build loyalty
• Take ownership of the customer’s purchase process
• Stepwise roll-out of cost-effective digital platform and
shift towards omnichannel strategy
• Online is increasingly driving the whole purchase
process from discovery to delivery
• Price, selection, delivery, payment, support and service
Europris’ 360⁰ customer vision
OUR CHANNELS
E-COMMERCE
ONLINE ADVERTISING
CRMCONTENT MARKETING
SOCIAL MEDIA
PR
POSITIVE PRODUCT DIALOGUE
STORE CUSTOMER SERVICE
SEARCH ENGINE
WEB CAMPAIGN
LEAFLET

A complementary source for revenue growth
1 Europris internal estimates 30
2018 2025E
75%
25%
Click & collect Home delivery
Share of group revenue from digital channels1 2025E revenue from digital channels by source1
>0.5% 5-10%
• Strong growth expected in e-commerce
• Complementary to the store offering
• Driver for traffic to stores and add-on sales
• Click & collect is the main revenue driver
• Leveraging Europris’ unique store network
• Wider range available in all stores

Drive customer growth by utilising physical
opportunities alongside digital presence
31Fogra Reklamefoto

Developing the store estate
• Six new stores opened in 2019• Five more store in pipeline for 2020 and beyond
• One of the stores are subject to local authority planning
processes
• Promising Europris City concept in Oslo may open up for
additional City concept stores
• Closing of the store at Grini postponed - awaiting final
decision from the court
32
Opening of Europris City, Gunerius

Creating shareholder value
33

Long-term financial and operational ambitions
34
Growth
Number of new stores
EBITDA
Dividend
Continue to deliver like-for-like growth above the market over time
Target to open on average 5 new stores net per year, depending on availability of locations which meet
strict return requirements, potential for relocations, expansion and refurbishment activities
Increased EBITDA margin over time from improved sourcing and more cost-effective value chain
Dividend policy of 50%-60% pay-out of net profit while maintaining an efficient balance sheet

Why invest in Europris
35
1
2
3
4
5
6
Significant untapped market potential in thriving discount variety retail segment
Norway’s #1 discount variety retailer with unrivalled store network, brand recognition and price perception
More than two decades of consecutive growth and high profitability fuelled by continuous concept development
Clearly defined strategic priorities: strengthening price and cost position, improve customer experience and driving customer
growth by bridging the physical and online stores
Target above-market growth over time and increased EBITDA margin from pan-Nordic sourcing, automated warehouse and
lower supply chain costs
Committed to returning excess cash to shareholders

Q&A
Next event: Q3 presentation 1 November 2019
36
Retail is changing,
discount variety is thriving

Appendix

Analytical info1
1 All figures are approximations and subject to change without further notice 38
Seasonality • As rule-of-thumb, the Easter impact is approximately NOK 50 million in revenue and NOK 10 million of
EBITDA
Quarterly OPEX• As rule-of-thumb, OPEX in year ago quarter + inflation + NOK 1.5 – 1.6 million per extra directly
operated store (DOS)
CAPEX
• New store – NOK 2.3 million per store (5 per year)
• Relocation – NOK 1.5 million per store (10 per year)
• Modernisation – NOK 1.0 million per store (10 per year)
• Category development – NOK 10 million per year
• IT & Maintenance – NOK 35 million per year
Estimated one-time
CAPEX items 2019• New warehouse and new head office of approximately NOK 30 million (IT, system integration, fixtures
and fittings)

Analytical info: New warehouse
39
NOK million Q1 2019 Q2 2019 Q3 2019 Q4 2019 2019 2020 2021 2022
Investments
IT, office equipment and other
(CAPEX) 6 16 ~5 ~27 ~5
Automation, part 1 (lease)9 28 ~30 ~40 ~107 ~5
Automation, part 2 (CAPEX)18 ~10 ~35 ~63 ~50
OPEX items
Ordinary rent 14 19 ~18 ~18 ~69 ~70 ~52 ~39
Redundant warehouse capacity in
2019 and Øra lease from H2 2021
(lease ends March 2022)
1 ~4 ~2 ~8 ~4 ~0-13 ~0-5
Non-recurring moving costs 7 ~8-10 ~3-5 ~3-5

Alternative performance measures (APMs)
40
APMs are used by Europris for annual and periodic financial reporting in order to provide a better understanding of
Europris’ financial performance and are also used by management to measure operating performance. APMs are
adjusted IFRS figures defined, calculated and used in a consistent and transparent manner.
Gross profit represents group revenue less the cost of goods sold excluding unrealised foreign
currency effects.
Working capital is the sum of inventories, trade receivables and other receivables less the sum
of accounts payable and other current liabilities
Opex is the sum of employee benefits expense and other operating expenses.Capital expenditure is the sum of purchases of fixed assets and intangible assets
EBITDA (earnings before interest, tax, depreciation and amortisation) represents gross profit
less Opex.Net debt is the sum of term loans and financial leases less bank deposits and cash
Adjusted EBITDA is EBITDA adjusted for nonrecurring expenses. Directly operated store means a store owned and operated by the group
Adjusted profit before tax is net profit before tax adjusted for non-recurring itemsFranchise store means a store operated by a franchisee under a franchise agreement with the
group
Adjusted net profit is net profit adjusted for non-recurring items Chain means the sum of directly operated stores and franchise stores
Adjusted earnings per share is adjusted net profit divided by the current number of shares
Like-for-like are stores which have been open for every month of the current calendar year and
for every month of the previous calendar year
![[PPT]PowerPoint Presentation · Web viewSays Vignesh B, consulting analyst at Euromonitor International . India – Glass bottle market growing. Segment. ... PowerPoint Presentation](https://img.dokumen.tips/doc/110x75/5b2684ad7f8b9a53228b4664/pptpowerpoint-web-viewsays-vignesh-b-consulting-analyst-at-euromonitor-international.jpg)


![[PPT]PowerPoint Presentation · Web viewPresentation outline Presentation of the University of Ljubljana and Faculty of economics Presentation of Central ... EMERALD Fulltext EUROMONITOR](https://img.dokumen.tips/doc/110x75/5b2684ad7f8b9a53228b469c/pptpowerpoint-web-viewpresentation-outline-presentation-of-the-university.jpg)
![[PPT]PowerPoint Presentation · Web viewOther online resources for FE APA – psychology resources Emerald Euromonitor Passport and Research Monitor Working ... PowerPoint Presentation](https://img.dokumen.tips/doc/110x75/5b2684ad7f8b9a53228b466b/pptpowerpoint-presentation-web-viewother-online-resources-for-fe-apa-psychology.jpg)
![[PPT]PowerPoint Presentation 2015.pptx · Web viewPassport (Euromonitor) Political Risk Yearbook. Bloomberg Professional. Equities, securities, companies. ... PowerPoint Presentation](https://img.dokumen.tips/doc/110x75/5b2684ad7f8b9a53228b4691/pptpowerpoint-presentation-2015pptx-web-viewpassport-euromonitor-political.jpg)


![[PPT]PowerPoint Presentation · Web view*Euromonitor “Colour cosmetics usage trends, 2014 ... PowerPoint Presentation Last modified by: Emilie-Marie Vanmarcke](https://img.dokumen.tips/doc/110x75/5b2684ad7f8b9a53228b4688/pptpowerpoint-web-vieweuromonitor-colour-cosmetics-usage-trends-2014.jpg)

![1Q13 Earnings Release Presentation 1 [Read-Only]s22.q4cdn.com/191330061/files/doc_presentations/145693.pdfFirst Quarter 2013 Earnings Release Presentation ... contained in this presentation,](https://img.dokumen.tips/doc/110x75/600e268854641351b4532224/1q13-earnings-release-presentation-1-read-onlys22q4cdncom191330061filesdocpresentations.jpg)

![[PPT]PowerPoint Presentation · Web viewFuente: Forrester, Euromonitor and Economist Intelligence Unit . Fuente: Economist Intelligence Unit . 2013 = $10T. ... PowerPoint Presentation](https://img.dokumen.tips/doc/110x75/5b2684ad7f8b9a53228b4693/pptpowerpoint-web-viewfuente-forrester-euromonitor-and-economist-intelligence.jpg)