Embed Size (px)
Citation preview
OR
G0
26
A
Roadshow presentation │ July 2015 │ p. 1
Company
Presentation July 2015

OR
G0
26
A
Roadshow presentation │ July 2015 │ p. 2
Agenda
Leifheit at a glance
Business development 2015 and Outlook
Strategy “Leifheit 2020”
Leifheit Share
Investment case
Annex

OR
G0
26
A
Roadshow presentation │ July 2015 │ p. 3
Leifheit Group is a leading company in the European
market of branded goods for selected household areas
Brand Business
(~80% turnover)
Volume Business
(~20% turnover)
Project
Business
Distribution in international markets
Product categories: Cleaning, Laundry Care, Kitchen goods, Wellbeing
Leifheit-Group
Leifheit at a glance
High-quality branded products with a high degree of
consumer benefit, mid to upper price segment
Consistent brand management
Systematic processes for innovation and market launch
Products in mid-price range
Customer-specific product
development
Strong service component

OR
G0
26
A
Roadshow presentation │ July 2015 │ p. 4
Wellbeing Under the Soehnle brand we offer an assortment of
scales that always cut a good figure - in the kitchen
and the bathroom.
Laudry care Whether it’s laundry dryers for the house or rotary
dryers for the garden, an ironing board or a steam
ironing system – Leifheit ensures fresh, clean and well-
kept laundry.
Cleaning Leifheit has an easy and convenient solution
for every cleaning demand. Our high quality
cleaning products can be flexible
combined.
Our product categories
Leifheit at a glance
Kitchen goods Opening, cooking, cutting or storing – Leifheit’s kitchen
accessories simplify work and keep hands and the
kitchen clean.

OR
G0
26
A
Roadshow presentation │ July 2015 │ p. 5
La Loupe/F (Herby)
About 75 employees
Manufacturing of wall and
tower driers
Paris/F (Leifheit/Birambeau) About 100 employees
Marketing, sales and administration
Blatná/CZ (Leifheit) About 400 employees
Manufacturing of tower driers, wall driers as well as floor wipers
Zuzenhausen (Leifheit) About 100 employees
Logistics center
Nassau (Leifheit/Soehnle) About 300 employees
Marketing, sales, development, quality assurance, central administration
Manufacturing of rotary driers, vacuum jugs, roll holders and floor wipers
Leifheit is active in more than 80 countries with
15 own branches
Caption
Head office and branches Sales regions
Leifheit at a glance

OR
G0
26
A
Roadshow presentation │ July 2015 │ p. 6
Board of Management
Thomas Radke
(53), CEO
Core competencies:
Driving growth via strategy and
business model analysis,
development and implementation
Marketing and Sales
M&A and post-merger integration
Previous experience:
CEO Herlitz AG
Member of the Board of Directors
Pelikan Holding AG
General Management, Marketing
and Sales positions at Carl Zeiss
Vision, Procter & Gamble/Wella,
Effem/Mars and Henkel KGaA
Dr Claus-O. Zacharias
(61), CFO
Core competencies:
Performance management,
process optimisation and
value creation concepts
Controlling, Finance and Operations
M&A and post-merger integration
Previous experience:
CFO NICI GmbH
CFO Lehnkering GmbH
CFO tegut… Gutberlet Stiftung & Co.
CFO Steilmann-Holding
CFO Eismann International GmbH
Controlling/Finance Suedzucker AG
Leifheit at a glance

OR
G0
26
A
Roadshow presentation │ July 2015 │ p. 7
Key Group development 2014
Leifheit at a glance
Group turnover
€ 220.7 m EBIT
€ 21.5 m
ROCE
20.3 %
Gross margin
47.7 % EBIT-Margin
9.8 %
Investments
€ 6.2 m
1) EBIT adjusted by positive effects from foreign currency results in the amount of € 5.1 m
Free Cash flow
€ 18.4 m Employees
1,055
EBIT adjusted1)
€ 16.4 m EBIT-Margin adjusted1)
7.4 %

OR
G0
26
A
Roadshow presentation │ July 2015 │ p. 8
Business development
2015 and Outlook

OR
G0
26
A
Roadshow presentation │ July 2015 │ p. 9
47.7%
40.6%
7.5% 4.2%
GermanyCentral EuropeEastern EuropeRest of the world
Q1: Successful start in the year 2015 with
turnover growth of 3.9 % in the first quarter
Group turnover Q1 2015 / by segment / in € m
Group turnover Q1 2015 / by region
47.0 49.5
8.9 8.6
58.1 55.9
0,0
25,0
50,0
75,0
Q1 2014 Q1 2015
Volume Business
Brand Business
Business development 2015 and Outlook
Varying regional market development.
Most dynamic growth in Germany.
Central Europe: Furthermore challenging
economic trend in some European markets,
Swiss economy loses impetus.
Eastern Europe: High dynamics in Poland,
Czech Republic and Slovakia. Furthermore
declines in Russia and Ukraine.

OR
G0
26
A
Roadshow presentation │ July 2015 │ p. 10
€ m Q1 2015 Q1 2014 +/- %
Turnover 58.1 55.9 3.9
Brand Business 49.5 47.0 5.1
Volume Business 8.6 8.9 -2.4
Gross margin 47.4 % 47.0 % 0.4 pps
Foreign currency results 3.2 0.1 3.1
EBIT 7.5 4,0 88.7
EBIT margin 12.9 % 7.1 % 5.8 pps
Earnings before income
taxes (EBT) 7.1 3.6 99.2
Net result for the period 5.0 2.5 98.6
Q1: EBIT improves to € 7.5 m partly due to
foreign currency effects
Brand Business once
again shows significant
growth of 5.1 %
Volume Business slightly
below previous year,
but only a comparatively
lower fall was recorded
Strong growth in EBIT,
partly due to foreign
currency effects
Net result for the period
at least double the
previous year's figure
Business development 2015 and Outlook
OR
G0
26
A
Roadshow presentation │ July 2015 │ p. 11
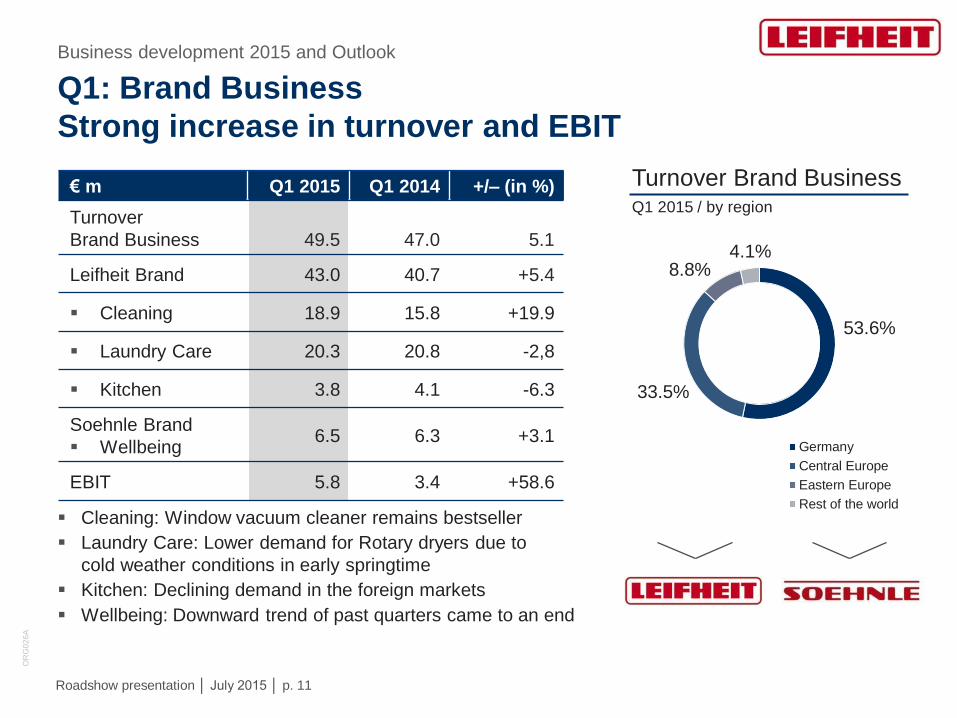
53.6%
33.5%
8.8% 4.1%
Germany
Central Europe
Eastern Europe
Rest of the world
Q1: Brand Business
Strong increase in turnover and EBIT
Turnover Brand Business Q1 2015 / by region
€ m Q1 2015 Q1 2014 +/– (in %)
Turnover
Brand Business
49.5
47.0
5.1
Leifheit Brand 43.0 40.7 +5.4
Cleaning 18.9 15.8 +19.9
Laundry Care 20.3 20.8 -2,8
Kitchen 3.8 4.1 -6.3
Soehnle Brand
Wellbeing 6.5 6.3 +3.1
EBIT 5.8 3.4 +58.6
Cleaning: Window vacuum cleaner remains bestseller
Laundry Care: Lower demand for Rotary dryers due to
cold weather conditions in early springtime
Kitchen: Declining demand in the foreign markets
Wellbeing: Downward trend of past quarters came to an end
Business development 2015 and Outlook

OR
G0
26
A
Roadshow presentation │ July 2015 │ p. 12
Q1: Volume Business
Brakes put on downward trend
Turnover Volume Business Q1 2015 / by region
Project
Business
€ m Q1 2015 Q1 2014 +/– (in %)
Turnover
Volume Business 8.6 8.9 -0.3
Cleaning 0.2 0.0 >+100.0
Laundry Care 3.5 3.0 +18.0
Kitchen 4.3 5.3 -18.4
Wellbeing 0.1 0.0 >+100.0
Contract
manufacturing 0.5 0.6 -3.8
EBIT 1.7 0.6 >+100.0
Laundry Care: Market consolidation in DIY sector
continues to have an effect
Kitchen: partial de-listing by French client
Planned decrease of contract manufacturing at Czech site
18.8%
81.5%
4.7%
Germany
Central Europe
Rest of the world
Business development 2015 and Outlook

OR
G0
26
A
Roadshow presentation │ July 2015 │ p. 13
Outlook 2015: Solid growth in Turnover, earnings forecast
increased, establishment of strategy ”Leifheit 2020“
Economic environment
2015
Increase of economic strength in parts of the Euro area,
but furthermore uncertainties in Southern Europe and difficult
economic environment in France and Switzerland
Risks in Eastern Europe/Russia in the light of the political
crisis in the Ukraine
German trade and industry is confident for 2015,
furthermore positive consumer sentiment
Group development
2015
Establish Group strategy ”Leifheit 2020” with new strategic guidelines
Group: slight growth by 2 % to 3 %
Brand business: solid growth by 3 % to 4 %
Volume business: stable development
EBIT of between € 19 and 20 m expected1)
Investments of € 9.0 m planned
Free cash flow of € 0.0 m estimated
Group development
until 2020
Sustainable and profitable organic growth of 5 % to 6 % CARG2)
External growth by M&A
Target EBIT margin of 8 %
1) Based on the assumption that the US dollar exchange rate remains at the level seen on 31 March 2015 (FX 1.10 dollar)
2) Compound Annual Growth Rate
Business development 2015 and Outlook

OR
G0
26
A
Roadshow presentation │ July 2015 │ p. 14
Strategy
“Leifheit 2020“
OR
G0
26
A
Roadshow presentation │ July 2015 │ p. 15
Strategy “Leifheit 2020” will elevate the Leifheit Group
to a significantly higher level of growth and excellence
Strategy “Leifheit 2020”
Based on a efficient platform, reasonable margins and a sharpened profile
Leifheit now focusses on growth via expansion of the product portfolio,
geographical footprint as well as on external growth:
Strengthening the position as the leading expert for solutions that
make the everyday life at home more easy and convenient to
achieve significant organic growth.
Addition of significant external growth to elevate the Leifheit Group
to a more compelling level of overall turnover/profit dimension:
2015 – 2017 starting in Europe
2018 – 2020 expanding to the US/Asia

OR
G0
26
A
Roadshow presentation │ July 2015 │ p. 16
Leifheit‘s vision for 2020
Strategy “Leifheit 2020”
We are your leading experts
for solutions that make your
everyday life at home
more easy and convenient.
“

OR
G0
26
A
Roadshow presentation │ July 2015 │ p. 17
Visionary growth targets – basic assumptions
Strategy “Leifheit 2020”
199 201 205 216 217 220 221
0
50
100
150
200
250
300
2008 2009 2010 2011 2012 2013 2014
€ m
Leifheit Group turnover
Turnover adjusted by bathroom division divested in 2010
Turnover adjusted by Dr Oetker Bakeware (termination of license agreement by 31 Dec 2012)
”Leifheit
2020“

OR
G0
26
A
Roadshow presentation │ July 2015 │ p. 18
Our strategic guidelines
Where and how we will grow
Strategy “Leifheit 2020”
… defines our segmentation approach
Derived from our vision 2020, Leifheit pursues 10 strategic guidelines
in order to strengthen competitiveness, enable growth and improved
sustained profitability.
… defines how we will grow
How
Where

OR
G0
26
A
Roadshow presentation │ July 2015 │ p. 19
Our strategic guidelines
Where we will grow:
3. Regions and countries
Develop and design for European markets
First, exploit European growth opportunities
(PL/Iberia/Nordics/UK/rest of EE), as of 2015
Second, become intentional in exploiting US / Asia
growth opportunities, as of 2018
4. Customers
Be distributed wherever our target group wants to
shop: globally and in all distribution channels
Further strengthen e-commerce position
2. Brands and categories
Focus Leifheit brand on Clean & Care in the middle
to upper price segment, cover additional basic price
points with (a) second brand(s), target: significant
growth
Deliver acquisitions in Clean & Care categories
Position Soehnle closer to the brand core, target:
significant growth
Revise Kitchen business model and search for
a new brand, target: moderate growth
1. Consumer
Target all females and males who use and/or shop
household products for in-home use (indoor/outdoor)
Address users who are prepared to buy brand
products in the middle to upper price segment as well
as value related users who are more price-conscious
Strategy “Leifheit 2020”

OR
G0
26
A
Roadshow presentation │ July 2015 │ p. 20
Our strategic guidelines
How we will grow:
6. Best in class user focus
Strengthen focus on consumer
needs and in depth understanding
of easiness and convenience
Define additional search fields
Deliver the “Design factory” for our
industries
7. Innovative and leading
solutions for target users
Deliver additional product systems
with easy and convenient “hero”
products in the center
Deliver products that are
characterized by a brand specific,
appealing design
5. Product quality
Ensure that product quality needed
to compete as a branded goods
supplier is always in place
9. Value chain efficiency
Continuous improvement of
value chain efficiency: Focus on
initiative development and order
generation/fulfillment processes
Ongoingly drive out all non-value
adding cost
10. Culture and employees
Drive appropriate cultural change
Properly develop our employees
8. Innovative and leading
solutions for dealers
Enable dealers to differentiate
with tailor-made solutions
Deliver a full category approach for
“Clean & Care”
Elevate POS-Excellence across all
distribution channels – online and
offline = Digitally led
Strategy “Leifheit 2020”

OR
G0
26
A
Roadshow presentation │ July 2015 │ p. 21
Company structure geared for growth:
structure for approx. € 280 m turnover
€ 10 m Turnover growth ~ € 2,0 m EBIT in € m
4,5
3,0 2,0
1,5
1,0
10,0
5,5
0
2,5
5
7,5
10
Turnover Cost of sales Gross profit Variablecosts
Profitcontribution
Fixed costs EBIT
Strategy “Leifheit 2020”

OR
G0
26
A
Roadshow presentation │ July 2015 │ p. 22
New Leifheit group strategy “Leifheit 2020” is set to drive towards an
organic turnover growth and additional external growth in a two step
approach
We will follow a full category approach in Clean & Care categories:
The Leifheit brand will be THE premium expert for the selected Clean & Care
categories at home, supplemented by (a) second brand(s) covering a more
basic price point.
The Soehnle brand will be significantly strengthened from the core.
The Kitchen products will be transferred into another brand.
We will strengthen our business model:
We are committed to user focus – consumer/user is boss
Innovation: We will deliver fewer but bigger initiatives (consumer and
trade) via increased R&D and Marketing power.
Digitalization: Digital will take the lead in future initiative and
go-to-market developments
Efficiency: Order generation and – fulfilment as well as initiative
development will be taken to the next efficiency level
Summary
Strategy “Leifheit 2020”

OR
G0
26
A
Roadshow presentation │ July 2015 │ p. 23
Summary
Our M&A strategy will deliver the following objectives:
Further elevate the Leifheit Group to more compelling level of overall
turnover/profit dimension
Expand our geographical footprint
1. Europe
2. US/Asia
External growth options in our core categories have
been examined quite intensively:
100 potential M&A targets, 50 targets further explored
Strategy “Leifheit 2020”

OR
G0
26
A
Roadshow presentation │ July 2015 │ p. 24
Leifheit Share
OR
G0
26
A
Roadshow presentation │ July 2015 │ p. 25
0%
100%
200%
300%
400%
500%
04.01.10 19.05.11 30.09.12 12.02.14 27.06.15
Leifheit SDAX
80%
100%
120%
140%
160%
180%
200%
01.01.14 01.07.14 29.12.14 28.06.15
Leifheit SDAX
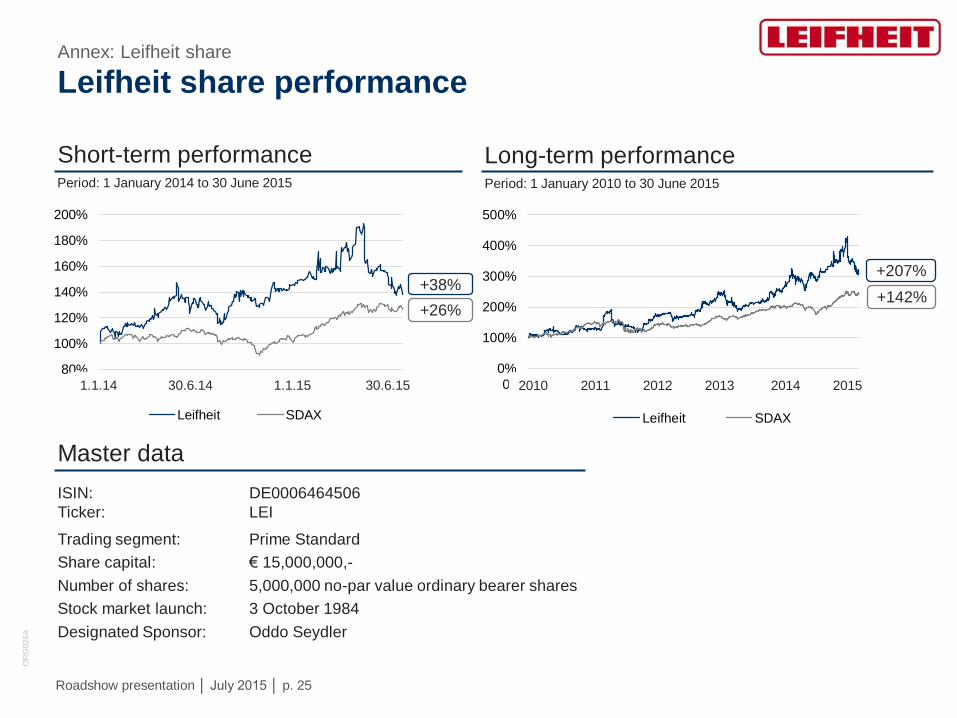
Period: 1 January 2014 to 30 June 2015
Long-term performance Period: 1 January 2010 to 30 June 2015
Leifheit share performance Annex: Leifheit share
+26%
+38% +207%
+142%
Short-term performance
Master data
ISIN: DE0006464506
Ticker: LEI
Trading segment: Prime Standard
Share capital: € 15,000,000,-
Number of shares: 5,000,000 no-par value ordinary bearer shares
Stock market launch: 3 October 1984
Designated Sponsor: Oddo Seydler
2010 2011 2012 2013 2014 2015 1.1.14 30.6.14 1.1.15 30.6.15

OR
G0
26
A
Roadshow presentation │ July 2015 │ p. 26
10,03%
8,26%
4,97%
5,60%
5,49%
4,00%
4,00% 3,30%
54,35%
MKV Verwaltungs GmbH, Grünwald (D)
Joachim Loh, Haiger (D)
Treasury Shares
Capital Income Builder, Los Angeles (USA)
Carmignac Gestion S.A., Paris (F)
Union Investment Privatfonds GmbH, Frankfurt (D)
MainFirst SICAV, Senningerberg (LUX)
Invesco Limited, Hamilton (BMU)
Share ownership under reporting threshold of 3 %
Shareholder structure
as at July 2015
Non free float shareholders1) 23.3 %
Free float1) 76.7 %
1) Definition of German stock exchange for indices
Free float significantly increased Annex: Leifheit share

OR
G0
26
A
Roadshow presentation │ July 2015 │ p. 27
0,00
0,50
1,00
1,50
2,00
2,50
3,00
198
4
198
5
198
6
198
7
198
8
198
9
199
0
199
1
199
2
199
3
199
4
199
5
199
6
199
7
199
8
199
9
200
0
200
1
200
2
200
3
200
4
200
5
200
6
200
7
200
8
200
9
201
0
201
1
201
2
201
3
201
4
201
5
Dividend Bonus/special dividend
-1
Dividend € 1.80 per share for business year 2014
Long-term dividend development Dividend per share in €
Leifheit at a glance
OR
G0
26
A
Roadshow presentation │ July 2015 │ p. 28
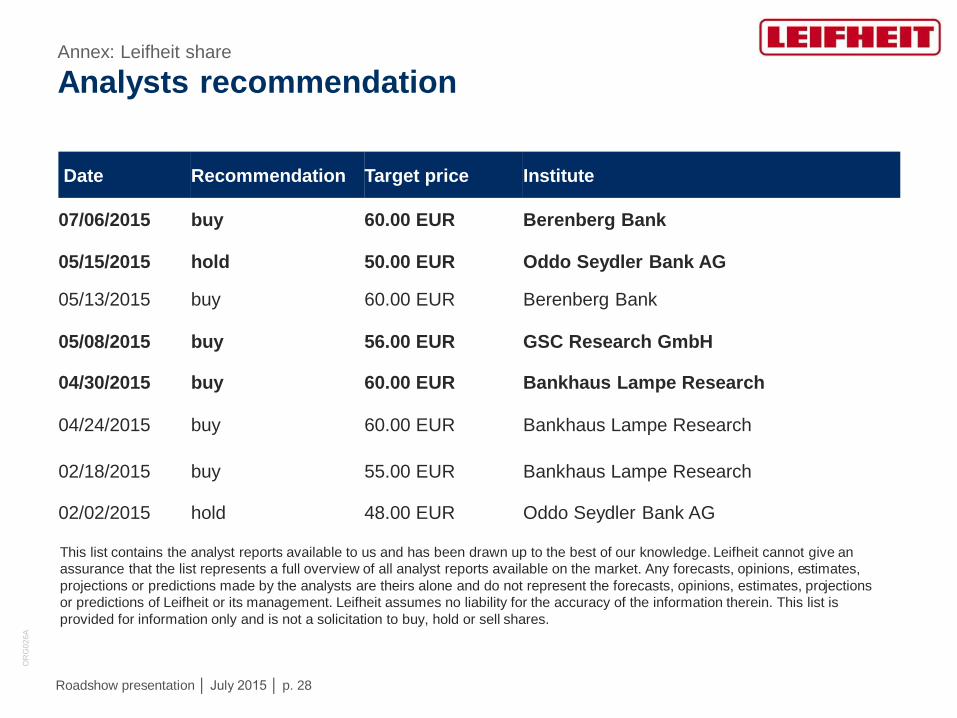
Analysts recommendation
This list contains the analyst reports available to us and has been drawn up to the best of our knowledge. Leifheit cannot give an
assurance that the list represents a full overview of all analyst reports available on the market. Any forecasts, opinions, estimates,
projections or predictions made by the analysts are theirs alone and do not represent the forecasts, opinions, estimates, projections
or predictions of Leifheit or its management. Leifheit assumes no liability for the accuracy of the information therein. This list is
provided for information only and is not a solicitation to buy, hold or sell shares.
Date Recommendation Target price Institute
07/06/2015 buy 60.00 EUR Berenberg Bank
05/15/2015 hold 50.00 EUR Oddo Seydler Bank AG
05/13/2015 buy 60.00 EUR Berenberg Bank
05/08/2015 buy 56.00 EUR GSC Research GmbH
04/30/2015 buy 60.00 EUR Bankhaus Lampe Research
04/24/2015 buy 60.00 EUR Bankhaus Lampe Research
02/18/2015 buy 55.00 EUR Bankhaus Lampe Research
02/02/2015 hold 48.00 EUR Oddo Seydler Bank AG
Annex: Leifheit share

OR
G0
26
A
Roadshow presentation │ July 2015 │ p. 29
Why is
Leifheit AG a good
equity investment?

OR
G0
26
A
Roadshow presentation │ July 2015 │ p. 30
Strong brands
► Well known, high consumer confidence
► Leading positions: Germany and many European countries
► High-quality supplier, middle and upper price range
Significant growth
potential
► Offline/online conversion of well suited assortment
► Strategy “Leifheit 2020” will transform the company on the next level of sales,
margin and growth:
organically by focus on core categories, consumers, innovation, digital, efficiency
externally by focus on core categories
Attractive dividend ► Distribution of ca. 75% of max (free cash flow, net income) planned
and backed by solid cash flows
Leifheit is known to deliver communicated goals
Solid set up
► Noncyclical business: Leifheit brands are used every day
► Well prepared to exploit e-commerce potential
► Efficient cost structure, sustainable margins, high equity ratio, no financial debt,
strong cash position, high cash flow
Brand, profitability, dividend plus next level of growth
Leifheit’s attractive offer

OR
G0
26
A
Roadshow presentation │ July 2015 │ p. 31
Annex
OR
G0
26
A
Roadshow presentation │ July 2015 │ p. 32
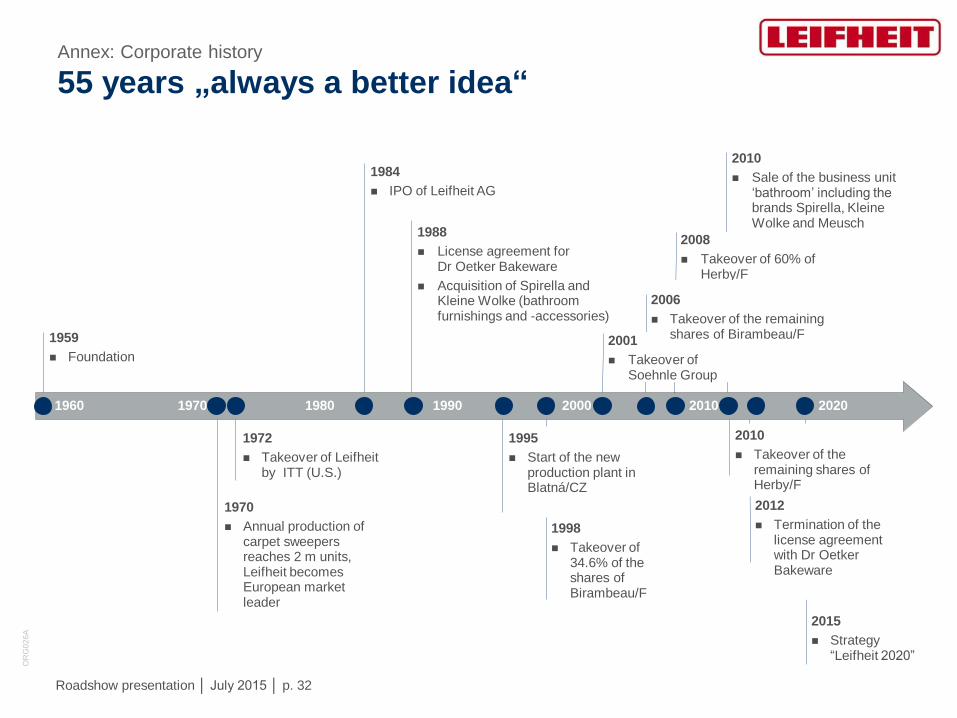
2010
Takeover of the remaining shares of Herby/F
2012
Termination of the license agreement with Dr Oetker Bakeware
1984
IPO of Leifheit AG
1970
Annual production of carpet sweepers reaches 2 m units, Leifheit becomes European market leader
1959
Foundation
1988
License agreement for Dr Oetker Bakeware
Acquisition of Spirella and Kleine Wolke (bathroom furnishings and -accessories)
1972
Takeover of Leifheit by ITT (U.S.)
2010
Sale of the business unit ‘bathroom’ including the brands Spirella, Kleine Wolke and Meusch
1970 1980 1990 2000 1960
1998
Takeover of 34.6% of the shares of Birambeau/F
1995
Start of the new production plant in Blatná/CZ
2010
2008
Takeover of 60% of Herby/F
2001
Takeover of Soehnle Group
2006
Takeover of the remaining shares of Birambeau/F
55 years „always a better idea“
Annex: Corporate history
2020
2015
Strategy “Leifheit 2020”

OR
G0
26
A
Roadshow presentation │ July 2015 │ p. 33
Successful restructuring led to efficiency, improvement
of margins and sharpened profile of product categories...
1 Company
positio
nin
g
3 Portfolio
optimization
5 Change
Management 6 Performance
orientation
2 4 Financial
stabilization
Focusing on
brand and
margin
- Cleaning
- Laundry Care
- Kitchen
- Wellbeing
- Sale of Soehnle
Professional
- Sale of the business
unit ‚bathroom‘
- Change of ladders
segment against
pressure steam ironing
- Termination of the
license agreement with
Dr Oetker Bakeware
- General Principle
- Leadership
- Transparency
- Employees
- Innovation
- Systems &
Processes
- Continuous
benchmarking
- Profitable growth
- Cost efficiency
- Capital efficiency
- Cash generation
- Solid cash flows
- No financial liabilities
Organic growth:
I. Convergence on
strategic focus markets
II. Intensify
E-commerce
III. Strengthening of
R&D/Innovation power
IV.Brand and
communication strategy
with a focus on POS
External growth:
V. M&A
20081) 2014
1) 2008 – today, settled and rolling processes
Brand provider with a
focus on clever and
innovative household
products in the core
categories:
Concentration of
resources on
strategic business
areas
Control of change
processes within the
organization
Standardized
management processes –
measurable, transparent
and success-oriented
Result of the group
positioning, portfolio
optimization, change
management and
performance orientation
Focus on Brand
Business
Annex: Group development until 2014

OR
G0
26
A
Roadshow presentation │ July 2015 │ p. 34
22,4
21,3
12,9
4,8
-0,8 0,5 -3,1 -0,8
3,1
8,8 11,4
13,0 14,9
21.5
255 241
224 216
207 199 196 199 201 205
216 217 220 221
0
50
100
150
200
250
-5
0
5
10
15
20
25
30
35
2001 2002 2003 2004 2005 2006 2007 2008 2009 2010 2011 2012 2013 2014
EBIT € m Turnover € m
-1
… and led to significant growth in earnings
Turnover and EBIT adjusted by bathroom division (divested in 2010),
Turnover adjusted by Dr Oetker Bakeware (termination of license agreement by 31.12.2012)
EBIT 2011 adjusted by one-off consolidation effects of € 2.5 m from obtaining control over Leifheit CZ a.s.
EBIT 2012 adjusted by one-off effects of € 1.2 m from sale of assets relating to termination of license agreement Dr Oetker Bakeware
EBIT 2014 includes positive effects from foreign currency results in the amount of € 5.1 m, EBIT margin 2014 adjusted by this effect
5.3% 6.0% 6.8% 7.4% -0.4% 1.5% 4.3% -0.4% 0,3% -1.6% 8.8% 5.8% 2.2% 8.8%
EBIT Margin %
16.4
Annex: Group development until 2014

OR
G0
26
A
Roadshow presentation │ July 2015 │ p. 35
43.0%
43.5%
8.8% 4.7%
GermanyCentral EuropeEastern EuropeRest of the world
Stable development of group turnover (+0.5 %)
Group turnover 2014 / by segment / in € m
Group turnover 2014 / by region
172.8 180.4
46.7 40.3
219.5 220.7
0,0
50,0
100,0
150,0
200,0
2013 2014
Volume Business
Brand Business
Varying regional market development.
Stable domestic demand in Germany.
Central Europe: Positive stimulus from Spain
and Italy. Challenging economic trend in France.
Eastern Europe: High dynamics in Poland,
Czech Republic and Slovakia. Declines in
Russia and Ukraine as expected.
Annex: Group development 2014
OR
G0
26
A
Roadshow presentation │ July 2015 │ p. 36
50.6%
35.3%
10.7% 3.4%
Germany
Central Europe
Eastern Europe
Rest of the world
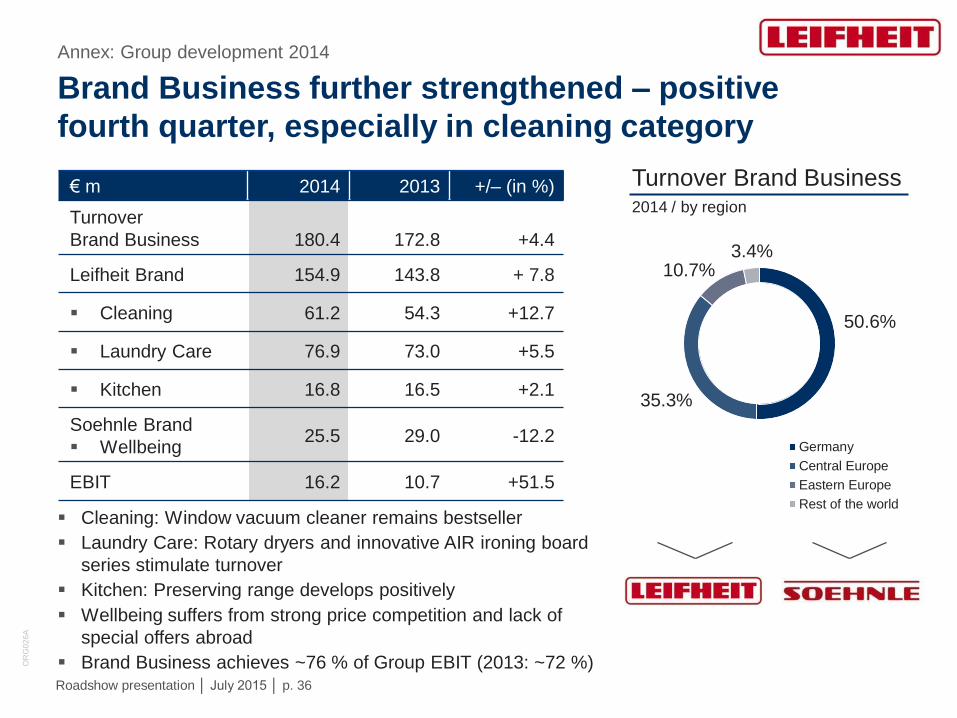
Brand Business further strengthened – positive
fourth quarter, especially in cleaning category
Turnover Brand Business 2014 / by region
€ m 2014 2013 +/– (in %)
Turnover
Brand Business 180.4 172.8 +4.4
Leifheit Brand 154.9 143.8 + 7.8
Cleaning 61.2 54.3 +12.7
Laundry Care 76.9 73.0 +5.5
Kitchen 16.8 16.5 +2.1
Soehnle Brand
Wellbeing 25.5 29.0 -12.2
EBIT 16.2 10.7 +51.5
Cleaning: Window vacuum cleaner remains bestseller
Laundry Care: Rotary dryers and innovative AIR ironing board
series stimulate turnover
Kitchen: Preserving range develops positively
Wellbeing suffers from strong price competition and lack of
special offers abroad
Brand Business achieves ~76 % of Group EBIT (2013: ~72 %)
Annex: Group development 2014

OR
G0
26
A
Roadshow presentation │ July 2015 │ p. 37
Volume Business: Decline reflects focus on
“brand and margin”
Turnover Volume Business 2014 / by region
Project
Business
in € m 2014 2013 +/– (in %)
Turnover
Volume Business 40.3 46.7 -13.8
Cleaning 0.4 0.1 >+100.0
Laundry Care 12.8 14.6 -12.2
Kitchen 25.3 28.8 -12.4
Wellbeing 0.1 1.0 -90.1
Contract
manufacturing 1.7 2.2 -22.8
EBIT 5.2 4.2 +25.7
As expected, strategic focus on “brand and margin” leads to
decline in turnover in Volume Business
Laundry Care: Market consolidation in DIY sector
continues to have an effect
Kitchen: partial de-listing by French client
Planned decrease of contract manufacturing at Czech site
9.3%
80.4%
10.3%
Germany
Central Europe
Rest of the world
Annex: Group development 2014

OR
G0
26
A
Roadshow presentation │ July 2015 │ p. 38
2014 2013 +/– %
Group turnover1) € m 220.7 219.5 +0.5
Gross margin % 47.7 44.9 +2.8 pps
EBIT € m 21.5 14.9 +44.3
Foreign currency result € m 5.1 -2.0 >100
EBIT adjusted2) € m 16.4 16.9 -2.6
EBIT margin % 9.8 6.8 +3.0 pps
EBIT margin adjusted2) % 7.4 7.7 -0.3 pps
Earnings before income taxes (EBT) € m 19.8 13.3 +48.7
Net result for the period € m 14.1 10.2 +37.7
ROCE % 20.3 12.6 +7.7 pps
Significant increase in profitability
1) Turnover 2013 adjusted by discontinued business with Dr. Oetker Bakeware,
2) Adjusted by foreign currency result
Annex: Group development 2014
Disproportional growth in earnings due to improved
gross margin and extraordinary high foreign currency results
Significant rise in ROCE by 7.7 pps mainly due to increased EBIT

OR
G0
26
A
Roadshow presentation │ July 2015 │ p. 39
in € m 2014 2013 +/-
Cash flow from operating activities 24.5 22.9 1.6
Cash flow from investment activities -9.1 0.5 -9.6
Cash flow from financing activities -7.8 -7.2 -0.6
Effects of exchange rate differences 0.2 1.0 -0.8
Net change in cash and cash equivalents 7.9 17.2 -9.3
Cash and cash equivalents at the end of the
reporting period 58.8 51.0 7.8
Short-term securities 4.0 1.0 3.0
Group liquidity 62.8 52.0 10.8
Free cash flow1) 18.4 19.5 -1.1
Strong rise in Group liquidity to € 62.8 m
Higher cash flow from operating activities due to higher net result for the period (€ 14.1 m), depreciations in the
amount of 6.3 Mio €, increase of receivables by 2.0 Mio €, increase of in inventories by € 1.8 m and the increase
of trade payables and other liabilities by € 8.5 m.
Reduced cash flow from investment activities particularly due to higher investments in tangible and intangible assets
of € 6.2 m (2013: € 3.6 m) and cash outflow for investments in financial assets of € 3.0 m (2013: € -2.3 m)
1) Sum of cash flow from operating activities and cash flows from investing activities, adjusted for deposits and withdrawals in financial assets and the sale of
division.
Annex: Group development 2014
OR
G0
26
A
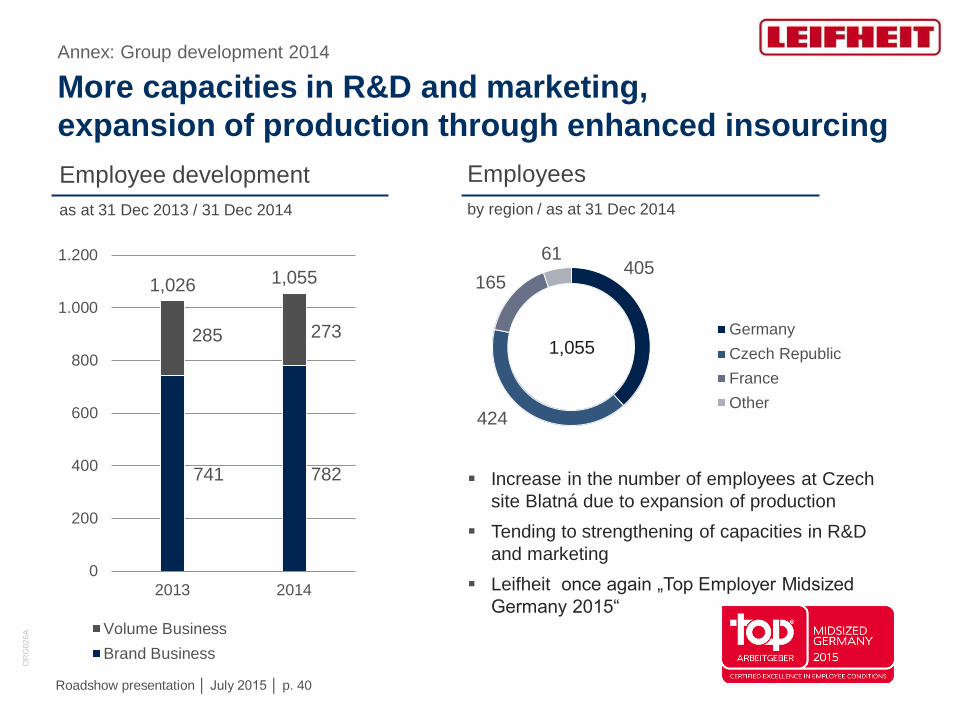
Roadshow presentation │ July 2015 │ p. 40
More capacities in R&D and marketing,
expansion of production through enhanced insourcing
Employee development
as at 31 Dec 2013 / 31 Dec 2014
Employees
by region / as at 31 Dec 2014
405
424
165
61
Germany
Czech Republic
France
Other
1,055
741 782
285 273
1,026 1,055
0
200
400
600
800
1.000
1.200
2013 2014
Volume Business
Brand Business
Increase in the number of employees at Czech
site Blatná due to expansion of production
Tending to strengthening of capacities in R&D
and marketing
Leifheit once again „Top Employer Midsized
Germany 2015“
Annex: Group development 2014
OR
G0
26
A
Roadshow presentation │ July 2015 │ p. 41
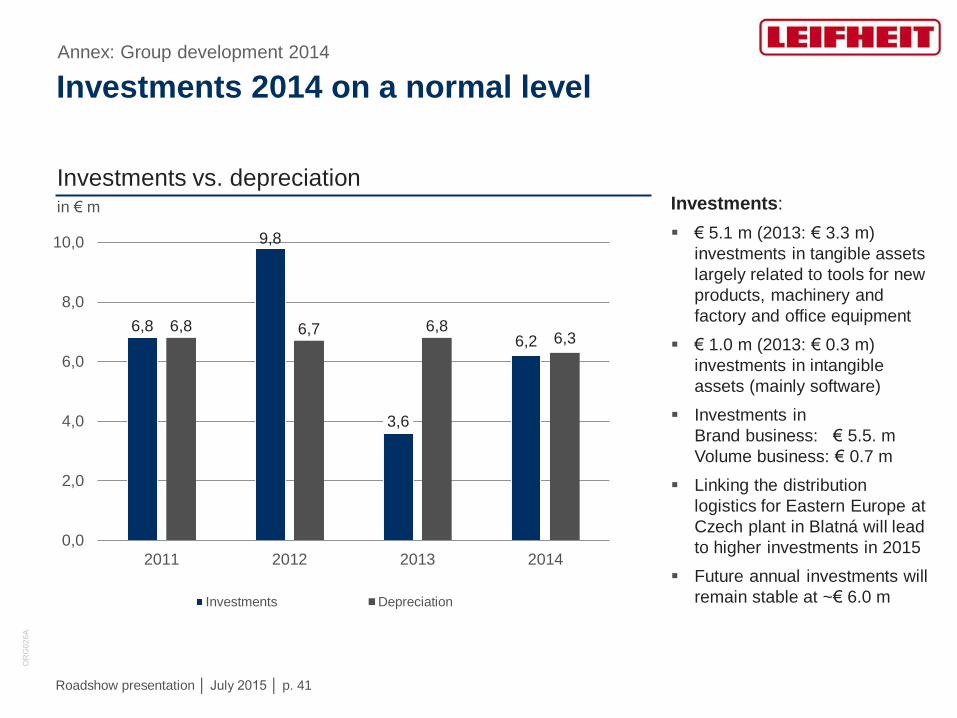
Investments vs. depreciation in € m
Investments 2014 on a normal level
Investments:
€ 5.1 m (2013: € 3.3 m)
investments in tangible assets
largely related to tools for new
products, machinery and
factory and office equipment
€ 1.0 m (2013: € 0.3 m)
investments in intangible
assets (mainly software)
Investments in
Brand business: € 5.5. m
Volume business: € 0.7 m
Linking the distribution
logistics for Eastern Europe at
Czech plant in Blatná will lead
to higher investments in 2015
Future annual investments will
remain stable at ~€ 6.0 m
6,8
9,8
3,6
6,2 6,8 6,7 6,8
6,3
0,0
2,0
4,0
6,0
8,0
10,0
2011 2012 2013 2014
Investments Depreciation
Annex: Group development 2014

OR
G0
26
A
Roadshow presentation │ July 2015 │ p. 42
92,8 94,7 94,8
45,0% 46,5%
42,5%
20%
25%
30%
35%
40%
45%
50%
70
80
90
100
110
120
31.12.12 31.12.13 31.12.14
Equity Equity ratio
Furthermore solid equity ratio
Equity/-ratio in € m
Cash, cash equivalents and
short-term financial assets in € m
37,0
52,0
62,8
0
10
20
30
40
50
60
70
2012 2013 2014
Annex: Group development 2014

OR
G0
26
A
Roadshow presentation │ July 2015 │ p. 43
Working Capital remains stable at a good level
16.1% 1)
18,8% 19,5%
18,0% 17,8%
0,0%
5,0%
10,0%
15,0%
20,0%
25,0%
31 Dec 10 31 Dec 11 31 Dec 12 31 Dec 13 31 Dec 14
Working Capital in percentage of turnover
1) 2010 ultimately without consolidation of Leifheit CZ a.s.
Working Capital remained
stable at a good level of
17.8 %
Receivables and inventories
above the year-end figures
2013 due to seasonal
factors
Liabilities rose relating to
the balance sheet date
Annex: Group development 2014
OR
G0
26
A
Roadshow presentation │ July 2015 │ p. 44
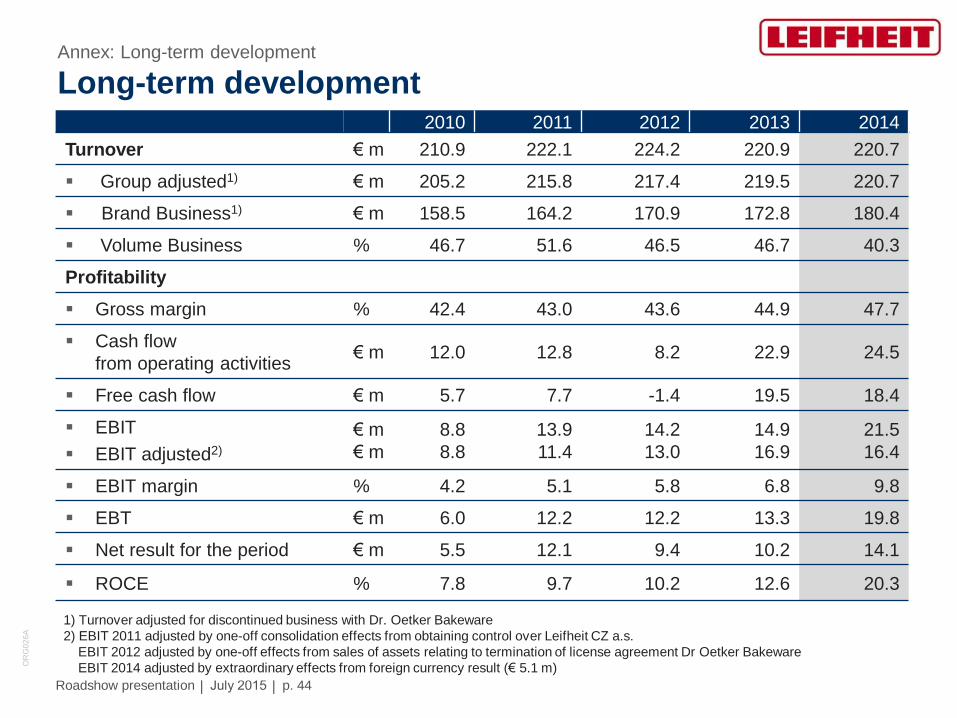
Long-term development
1) Turnover adjusted for discontinued business with Dr. Oetker Bakeware
2) EBIT 2011 adjusted by one-off consolidation effects from obtaining control over Leifheit CZ a.s.
EBIT 2012 adjusted by one-off effects from sales of assets relating to termination of license agreement Dr Oetker Bakeware
EBIT 2014 adjusted by extraordinary effects from foreign currency result (€ 5.1 m)
-1
2010 2011 2012 2013 2014
Turnover € m 210.9 222.1 224.2 220.9 220.7
Group adjusted1) € m 205.2 215.8 217.4 219.5 220.7
Brand Business1) € m 158.5 164.2 170.9 172.8 180.4
Volume Business % 46.7 51.6 46.5 46.7 40.3
Profitability
Gross margin % 42.4 43.0 43.6 44.9 47.7
Cash flow
from operating activities € m 12.0 12.8 8.2 22.9 24.5
Free cash flow € m 5.7 7.7 -1.4 19.5 18.4
EBIT
EBIT adjusted2)
€ m
€ m
8.8
8.8
13.9
11.4
14.2
13.0
14.9
16.9
21.5
16.4
EBIT margin % 4.2 5.1 5.8 6.8 9.8
EBT € m 6.0 12.2 12.2 13.3 19.8
Net result for the period € m 5.5 12.1 9.4 10.2 14.1
ROCE % 7.8 9.7 10.2 12.6 20.3
Annex: Long-term development

OR
G0
26
A
Roadshow presentation │ July 2015 │ p. 45
31.12.10 31.12.11 31.12.12 31.12.13 31.12.14
Employees
Group Pers. 1,141 1,032 1,025 1,026 1,055
Brand business Pers. 751 726 741 741 782
Volume business Pers. 390 306 284 285 273
Balance sheet total2) € m 207.0 198.9 205.9 203.8 223.3
Equity2) € m 101.5 98.9 92.8 94.7 94.8
Equity ratio2) % 49.0 49.7 45.0 46.5 42.5
Long-term development
-1
1) Not including treasury shares
2) from 2012 in accordance with IAS 19 (revised in 2011)
2010 2011 2012 2013 2014
Per Share
Net result 1) € 1.15 2.55 1.97 2.16 2.97
Free cash flow 1) € 1.20 1.63 -0.28 4.11 3.88
Dividend
Special dividend
€
€
1.00
2.00
1.30
--
1.50
--
1.65
--
1.80
--
Investments in tangible assets € m 4.4 5.4 9.3 3.3 5.2
Depreciation in tangible assets € m 5.4 5.3 5.3 5.5 5.3
Annex: Long-term development

OR
G0
26
A
Roadshow presentation │ July 2015 │ p. 46
Hyper-markets 32 (33)
Retail-/Whole sale/
Department stores 18 (18)
DIY 16 (14)
E-commerce 9 (8)
Importers/ exporters
9 (9)
Cash & Carry 5 (5)
Discounter 4 (4)
Electro 3 (4)
Furniture retail 2 (3)
Other 2 (3)
Distribution in every important distribution channel
Annex: Distribution
Turnover by distribution channel 2014 in % (previous year)
TOP-10 clients

OR
G0
26
A
Roadshow presentation │ July 2015 │ p. 47
European Competitors by Category
Laundy care
Kitchen goods
Cleaning
Wellbeing
Europ
Spontex Rival
Tonkita
Vileda
Swiffer
Vileda
Wenko
Metaltex
Brabantia
Gimi
Blome
Rörets Blome
Stewi
Juwel
Artweger
Brabantia
Oxo
Fackelmann WMF
Tescoma
Gefu Lurch Rösle
Zyliss
Westmark
Emsa
Tefal
ADE
Sanitas
Tanita Bosch
Terraillon
Laica
Beurer Homedics
Annex: Competitors
Kärcher

OR
G0
26
A
Roadshow presentation │ July 2015 │ p. 48
Company grounds: 108,000 square meters
Built-up area: 20,000 square meters
Employees: approx. 400
Fabrication: Metal production with power-coating,
injection molding production, textile production
Main product groups: dryers, ironing boards, cleaning products
Investments 2015: € 3 m planned in distribution logistics for Eastern Europe
Company grounds: 61,000 square meters
Built-up area: 26,000 square meters
Employees: approx. 300
Fabrication: automatic production lines, injection molding production
Main product groups: dryers (Linomatic), cleaning and kitchen products
Nassau/Germany: headquarter, marketing, sales, R&D, administration
Headquarter, logistics and production facilities Annex: Main sites
Company grounds: 85,000 square meters
Built-up area: 41,000 square meters
Employees: approx. 100
Storage Capacity: approx. 48,000 pallets
Distribution Capacity: 1,000 cubic meters
Zuzenhausen/Germany: logistic center
Blatná/Czech republic: main production facility

OR
G0
26
A
Roadshow presentation │ July 2015 │ p. 49
Disclaimer
This presentation contains forward looking statements which are based on the management’s current estimates with
regard to future developments. Such statements are subject to risks and uncertainties which are beyond Leifheit’s ability to
control or estimate precisely, such as statements on the future market environment and economic conditions, the behavior
of other market participants and government measures.
If one of these uncertain or unforeseeable factors occurs or the assumptions on which these statements are based prove
inaccurate, actual results could differ materially from the results cited explicitly or contained implicitly in these statements.
Leifheit neither intends to, nor does it accept any specific obligation to update forward-looking statements to reflect events
or developments after the date of this presentation.
Leifheit AG shall not assume any warranty for the information provided in this presentation being up-to-date, accurate,
complete or of good quality or for the suitability of the information for specific purposes.
Any liability of Leifheit AG for loss caused by the use or non-use of the information provided or by wrong or incomplete
information is excluded.
Annex

OR
G0
26
A
Roadshow presentation │ July 2015 │ p. 50
12 August 2015
Financial report for the first half-year 2015
11 November 2015
Quarterly financial report for the period ending
30 September 2015
Dates 2015
Dates Annex
OR
G0
26
A
Roadshow presentation │ July 2015 │ p. 51
Aktiengesellschaft
P.O. Box 11 65
56371 Nassau/Lahn, Germany
Telephone: +49 2604 977-218
www.leifheit-group.com
ir(at)leifheit.com