Embed Size (px)
Citation preview

1
Company presentation FY 2017
February 2018
2 2
TAG Immobilien AG | February 2018 | 2
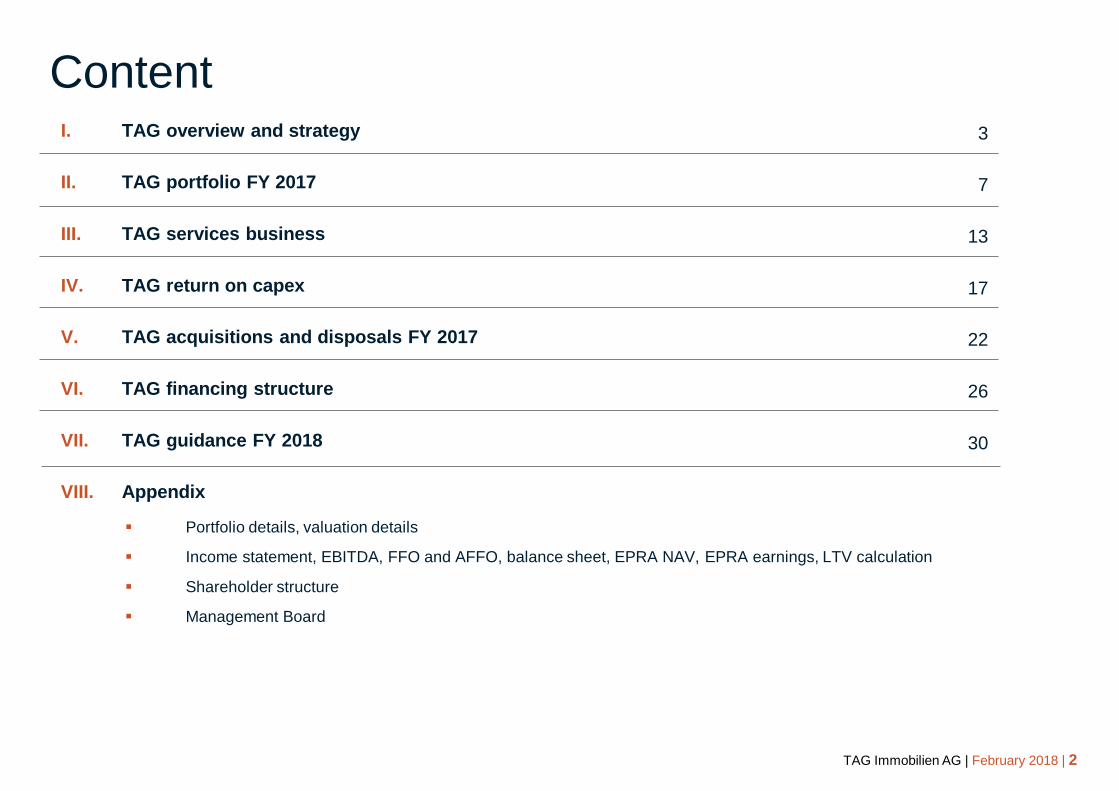
Content I. TAG overview and strategy
II. TAG portfolio FY 2017
III. TAG services business
IV. TAG return on capex
V. TAG acquisitions and disposals FY 2017
VI. TAG financing structure
VII. TAG guidance FY 2018
VIII. Appendix
Portfolio details, valuation details
Income statement, EBITDA, FFO and AFFO, balance sheet, EPRA NAV, EPRA earnings, LTV calculation
Shareholder structure
Management Board
3
7
13
17
22
26
30

3 3
TAG Immobilien AG | February 2018 | 3
TAG overview and strategy
3
TAG Immobilien AG | February 2018 | 3
4 4
TAG Immobilien AG | February 2018 | 4
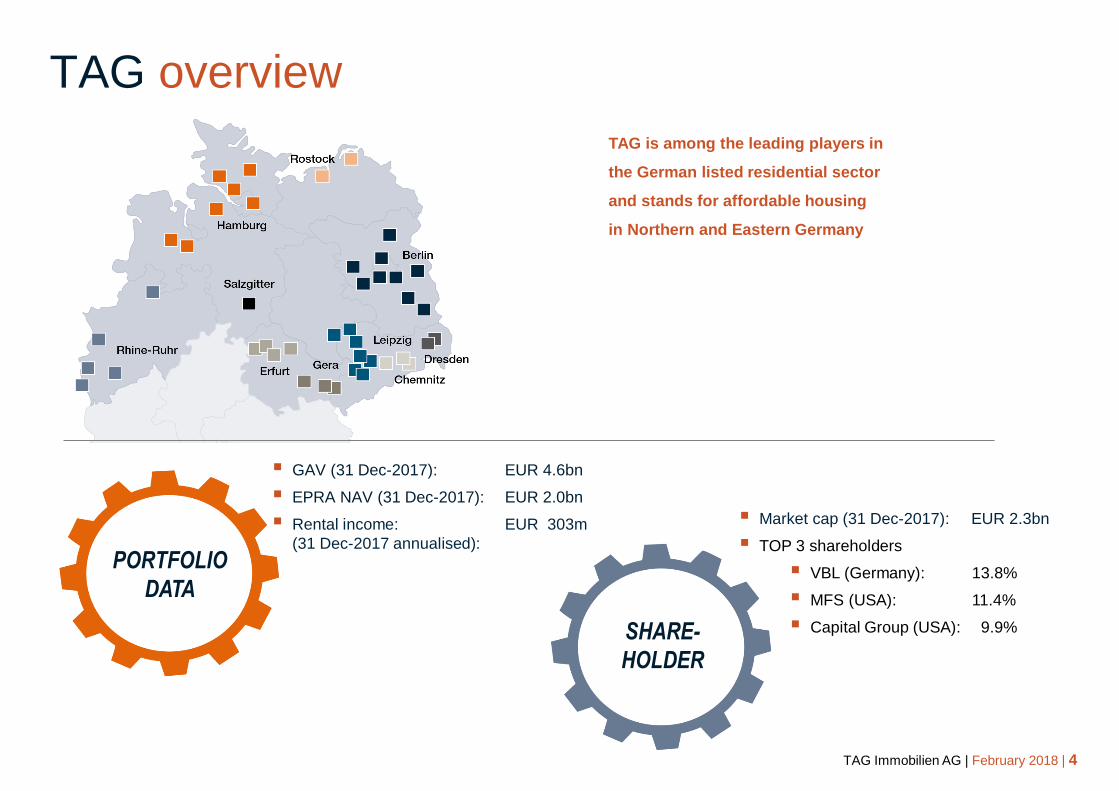
TAG is among the leading players in
the German listed residential sector
and stands for affordable housing
in Northern and Eastern Germany
GAV (31 Dec-2017): EUR 4.6bn
EPRA NAV (31 Dec-2017): EUR 2.0bn
Rental income: EUR 303m
(31 Dec-2017 annualised):
Market cap (31 Dec-2017): EUR 2.3bn
TOP 3 shareholders
VBL (Germany): 13.8%
MFS (USA): 11.4%
Capital Group (USA): 9.9% SHARE-
HOLDER
PORTFOLIO
DATA
TAG overview
5 5
TAG Immobilien AG | February 2018 | 5
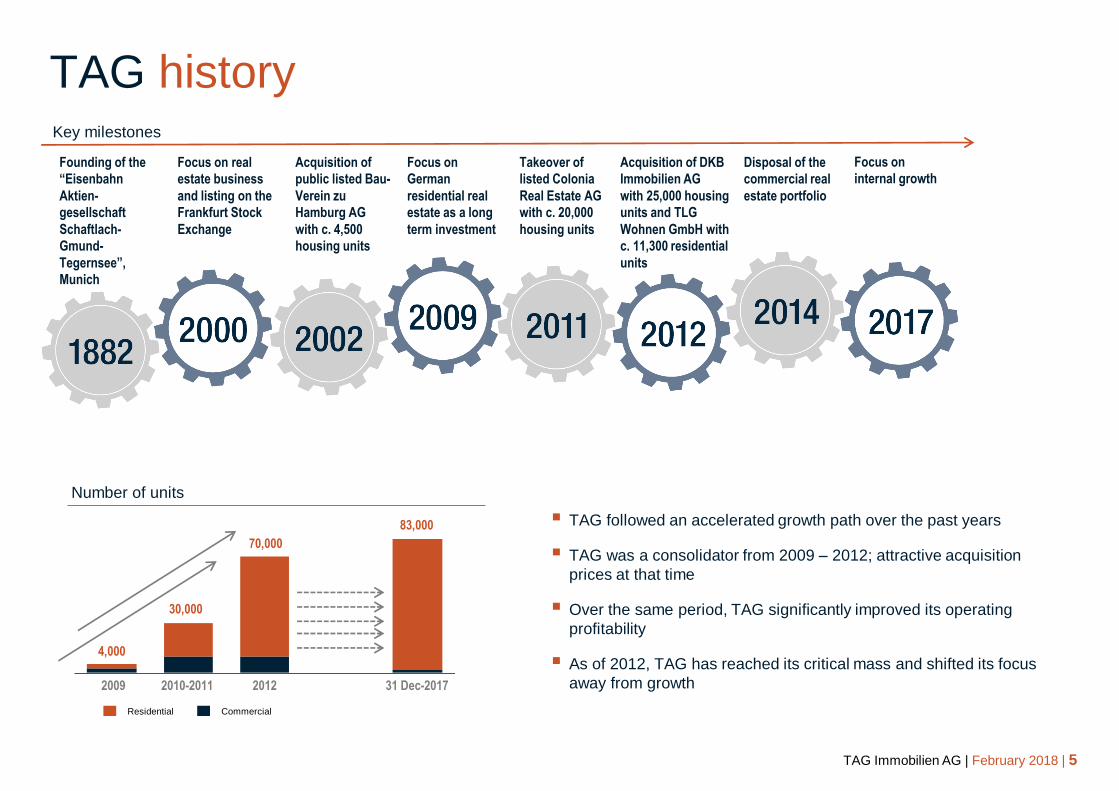
TAG history
TAG followed an accelerated growth path over the past years
TAG was a consolidator from 2009 – 2012; attractive acquisition
prices at that time
Over the same period, TAG significantly improved its operating
profitability
As of 2012, TAG has reached its critical mass and shifted its focus
away from growth
Number of units
Residential Commercial
83,000
30,000
4,000 478
70,000
2009 2010-2011 2012 31 Dec-2017
Key milestones
Founding of the
“Eisenbahn
Aktien-
gesellschaft
Schaftlach-
Gmund-
Tegernsee”,
Munich
Focus on real
estate business
and listing on the
Frankfurt Stock
Exchange
Acquisition of
public listed Bau-
Verein zu
Hamburg AG
with c. 4,500
housing units
Focus on
German
residential real
estate as a long
term investment
Takeover of
listed Colonia
Real Estate AG
with c. 20,000
housing units
Acquisition of DKB
Immobilien AG
with 25,000 housing
units and TLG
Wohnen GmbH with
c. 11,300 residential
units
Disposal of the
commercial real
estate portfolio
Focus on
internal growth

6 6
TAG Immobilien AG | February 2018 | 6
TAG strategy: internal growth as main driver
* ‘ABBA’: investing in A locations in B cities and B locations in A cities
Segment leadership
TAG has been the first to implement the
‘ABBA’* approach in the listed German
residential sector
TAG is among the largest owners of
residential properties in East Germany
Capital structure and acquisitions
Stable and long-term financing structure as
strategic goal
Disciplined and conservative approach regarding
new acquisitions
Attractive investment profile
Focus on profitable growth and not on growth in
absolute terms
Local presence is a key element of TAG’s asset
management approach
TAG acquisitions 2016
7
TAG portfolio FY 2017
TAG Immobilien AG | February 2018 | 7
8 8
TAG Immobilien AG | February 2018 | 8
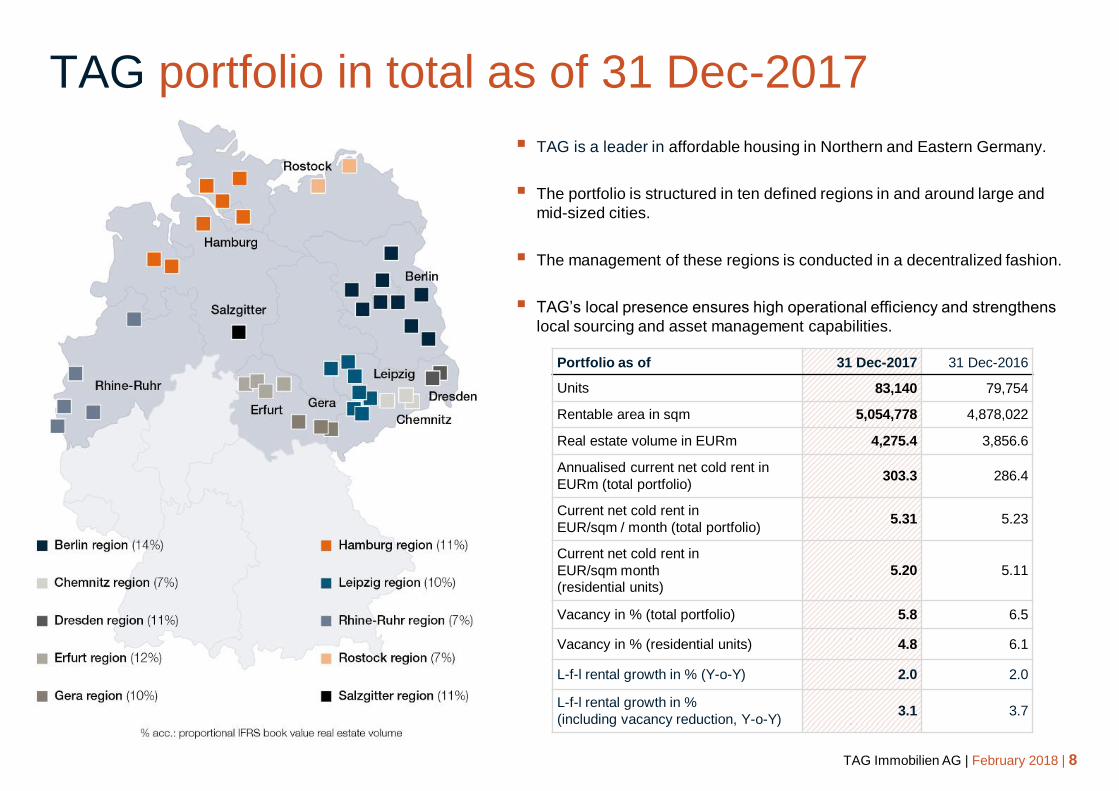
TAG portfolio in total as of 31 Dec-2017
Portfolio as of 31 Dec-2017 31 Dec-2016
Units 83,140 79,754
Rentable area in sqm 5,054,778 4,878,022
Real estate volume in EURm 4,275.4 3,856.6
Annualised current net cold rent in
EURm (total portfolio) 303.3 286.4
Current net cold rent in
EUR/sqm / month (total portfolio) 5.31 5.23
Current net cold rent in
EUR/sqm month
(residential units)
5.20 5.11
Vacancy in % (total portfolio) 5.8 6.5
Vacancy in % (residential units) 4.8 6.1
L-f-l rental growth in % (Y-o-Y) 2.0 2.0
L-f-l rental growth in %
(including vacancy reduction, Y-o-Y) 3.1 3.7
TAG is a leader in affordable housing in Northern and Eastern Germany.
The portfolio is structured in ten defined regions in and around large and
mid-sized cities.
The management of these regions is conducted in a decentralized fashion.
TAG’s local presence ensures high operational efficiency and strengthens
local sourcing and asset management capabilities.
9 9
TAG Immobilien AG | February 2018 | 9
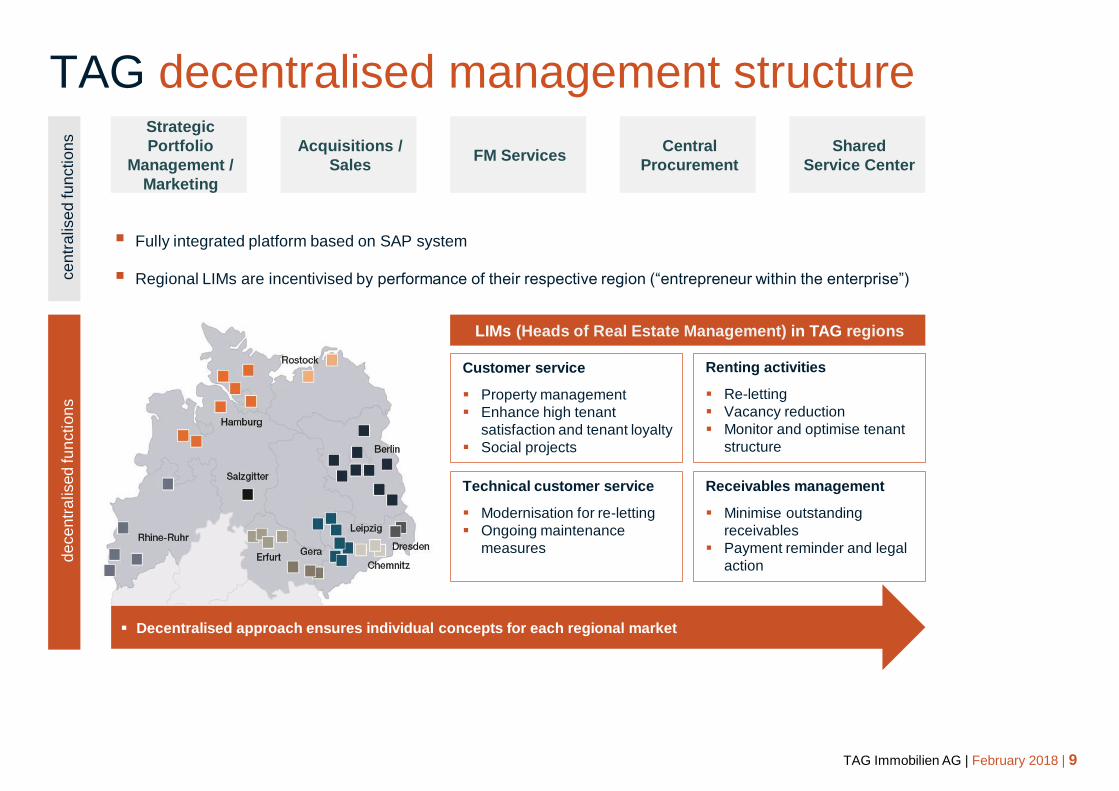
Fully integrated platform based on SAP system
Regional LIMs are incentivised by performance of their respective region (“entrepreneur within the enterprise”) ce
ntr
alis
ed
fu
nctio
ns
de
ce
ntr
alis
ed
fu
nctio
ns
Strategic
Portfolio
Management /
Marketing
Acquisitions /
Sales FM Services
Central
Procurement
Shared
Service Center
Renting activities
Re-letting
Vacancy reduction
Monitor and optimise tenant
structure
Technical customer service
Modernisation for re-letting
Ongoing maintenance
measures
Receivables management
Minimise outstanding
receivables
Payment reminder and legal
action
Customer service
Property management
Enhance high tenant
satisfaction and tenant loyalty
Social projects
Decentralised approach ensures individual concepts for each regional market
LIMs (Heads of Real Estate Management) in TAG regions
TAG decentralised management structure
10 10
TAG Immobilien AG | February 2018 | 10
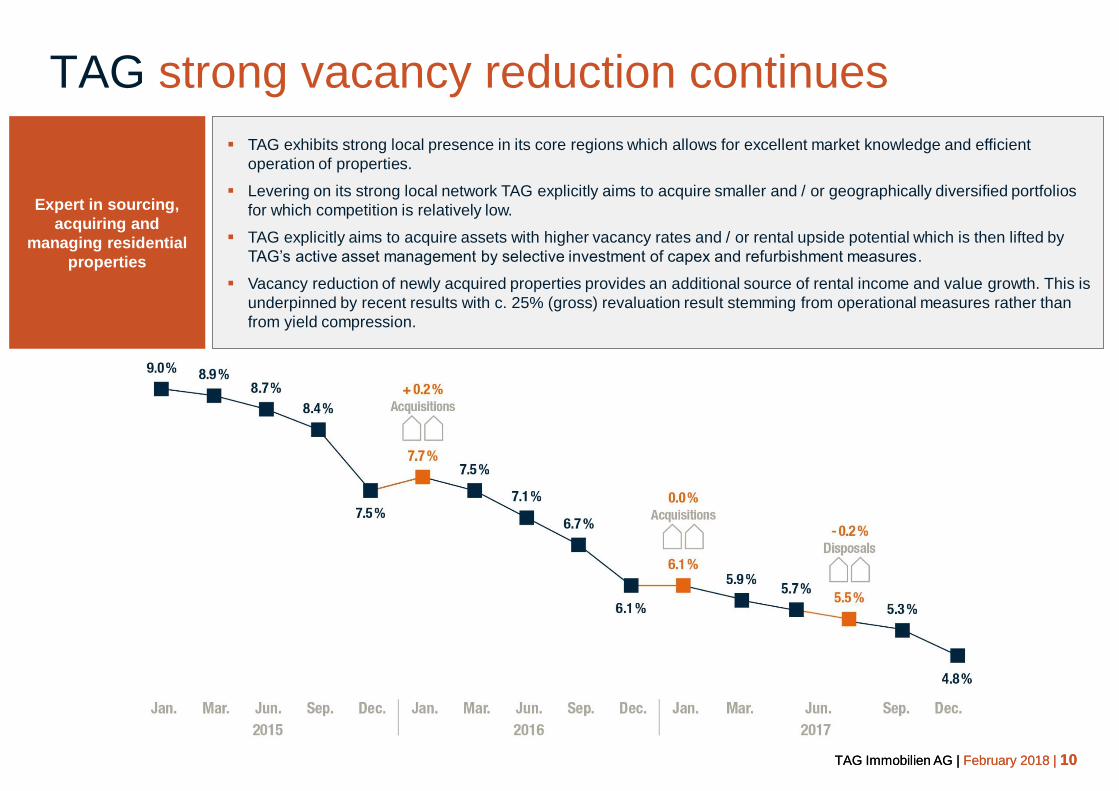
TAG strong vacancy reduction continues
Expert in sourcing,
acquiring and
managing residential
properties
TAG exhibits strong local presence in its core regions which allows for excellent market knowledge and efficient
operation of properties.
Levering on its strong local network TAG explicitly aims to acquire smaller and / or geographically diversified portfolios
for which competition is relatively low.
TAG explicitly aims to acquire assets with higher vacancy rates and / or rental upside potential which is then lifted by
TAG’s active asset management by selective investment of capex and refurbishment measures.
Vacancy reduction of newly acquired properties provides an additional source of rental income and value growth. This is
underpinned by recent results with c. 25% (gross) revaluation result stemming from operational measures rather than
from yield compression.
TAG Immobilien AG | February 2018 | 10
xxx
11 11
TAG Immobilien AG | February 2018 | 11
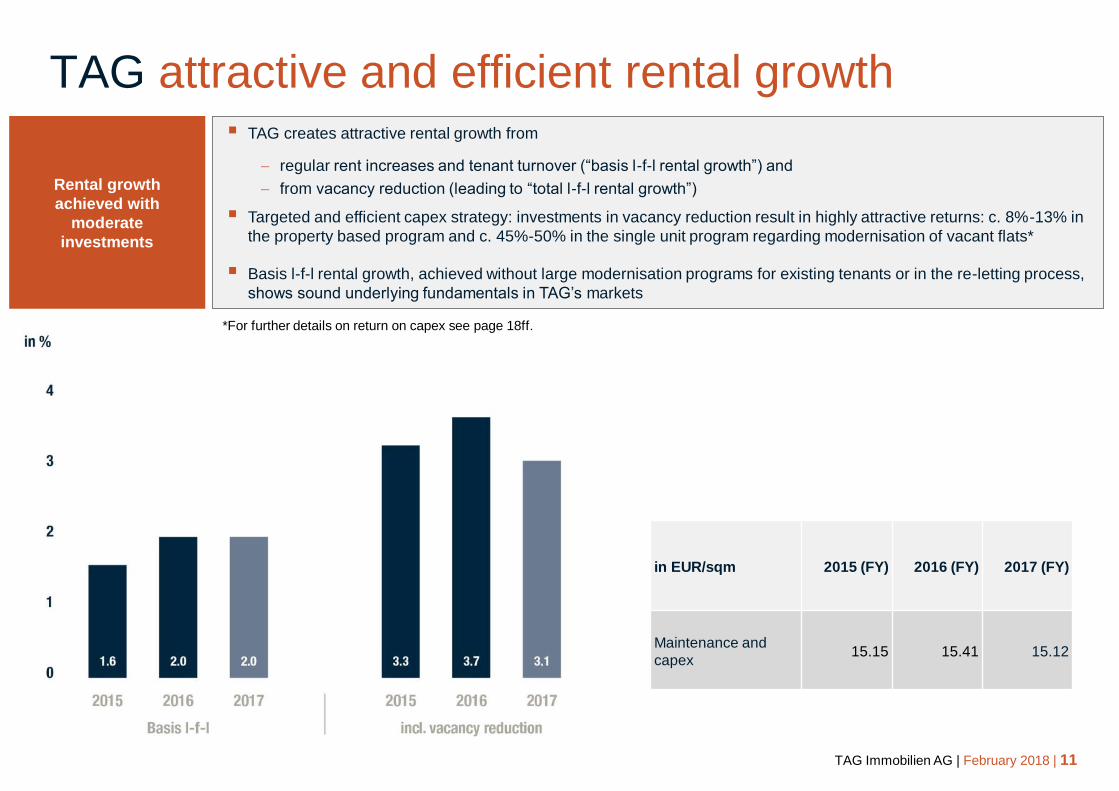
TAG attractive and efficient rental growth
Rental growth
achieved with
moderate
investments
in EUR/sqm 2015 (FY) 2016 (FY) 2017 (FY)
Maintenance and
capex 15.15 15.41 15.12
TAG creates attractive rental growth from
regular rent increases and tenant turnover (“basis l-f-l rental growth”) and
from vacancy reduction (leading to “total l-f-l rental growth”)
Targeted and efficient capex strategy: investments in vacancy reduction result in highly attractive returns: c. 8%-13% in
the property based program and c. 45%-50% in the single unit program regarding modernisation of vacant flats*
Basis l-f-l rental growth, achieved without large modernisation programs for existing tenants or in the re-letting process,
shows sound underlying fundamentals in TAG’s markets
*For further details on return on capex see page 18ff.
12 12
TAG Immobilien AG | February 2018 | 12
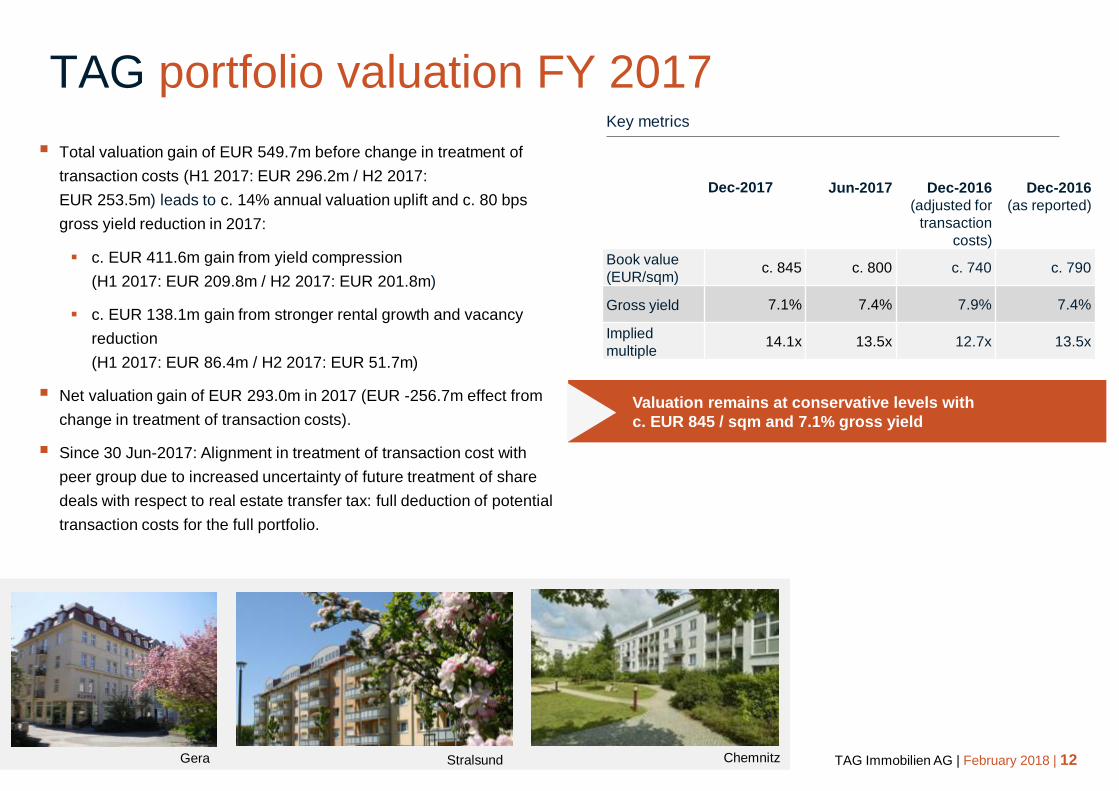
TAG portfolio valuation FY 2017
Total valuation gain of EUR 549.7m before change in treatment of
transaction costs (H1 2017: EUR 296.2m / H2 2017:
EUR 253.5m) leads to c. 14% annual valuation uplift and c. 80 bps
gross yield reduction in 2017:
c. EUR 411.6m gain from yield compression
(H1 2017: EUR 209.8m / H2 2017: EUR 201.8m)
c. EUR 138.1m gain from stronger rental growth and vacancy
reduction
(H1 2017: EUR 86.4m / H2 2017: EUR 51.7m)
Net valuation gain of EUR 293.0m in 2017 (EUR -256.7m effect from
change in treatment of transaction costs).
Since 30 Jun-2017: Alignment in treatment of transaction cost with
peer group due to increased uncertainty of future treatment of share
deals with respect to real estate transfer tax: full deduction of potential
transaction costs for the full portfolio.
Dec-2017 Jun-2017 Dec-2016
(adjusted for
transaction
costs)
Dec-2016
(as reported)
Book value
(EUR/sqm) c. 845 c. 800 c. 740 c. 790
Gross yield 7.1% 7.4% 7.9% 7.4%
Implied
multiple 14.1x 13.5x 12.7x 13.5x
Key metrics
Valuation remains at conservative levels with
c. EUR 845 / sqm and 7.1% gross yield
Gera Stralsund Chemnitz
13 13
TAG Immobilien AG | February 2018 | 13
TAG service business
13
TAG Immobilien AG | February 2018 | 13
14 14
TAG Immobilien AG | February 2018 | 14
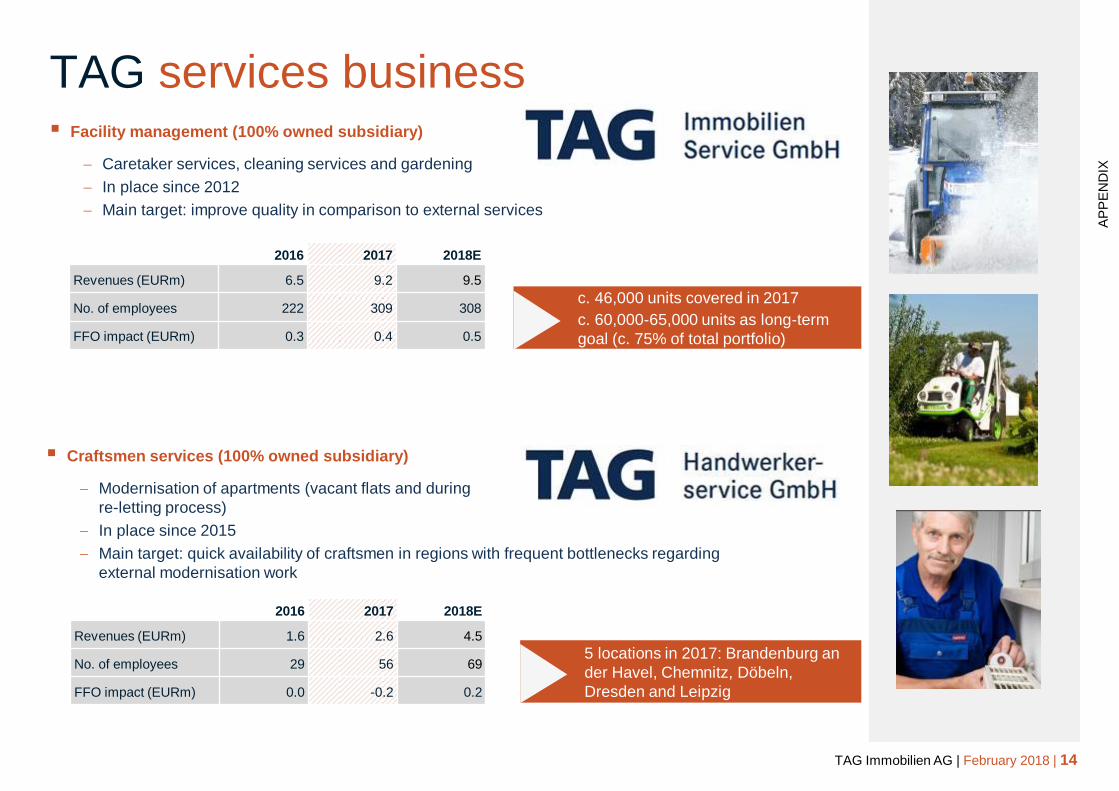
TAG services business Facility management (100% owned subsidiary)
Caretaker services, cleaning services and gardening
In place since 2012
Main target: improve quality in comparison to external services
c. 46,000 units covered in 2017
c. 60,000-65,000 units as long-term
goal (c. 75% of total portfolio)
2016 2017 2018E
Revenues (EURm) 6.5 9.2 9.5
No. of employees 222 309 308
FFO impact (EURm) 0.3 0.4 0.5
Craftsmen services (100% owned subsidiary)
Modernisation of apartments (vacant flats and during
re-letting process)
In place since 2015
Main target: quick availability of craftsmen in regions with frequent bottlenecks regarding
external modernisation work
5 locations in 2017: Brandenburg an
der Havel, Chemnitz, Döbeln,
Dresden and Leipzig
2016 2017 2018E
Revenues (EURm) 1.6 2.6 4.5
No. of employees 29 56 69
FFO impact (EURm) 0.0 -0.2 0.2
AP
PE
ND
IX
15 15
TAG Immobilien AG | February 2018 | 15
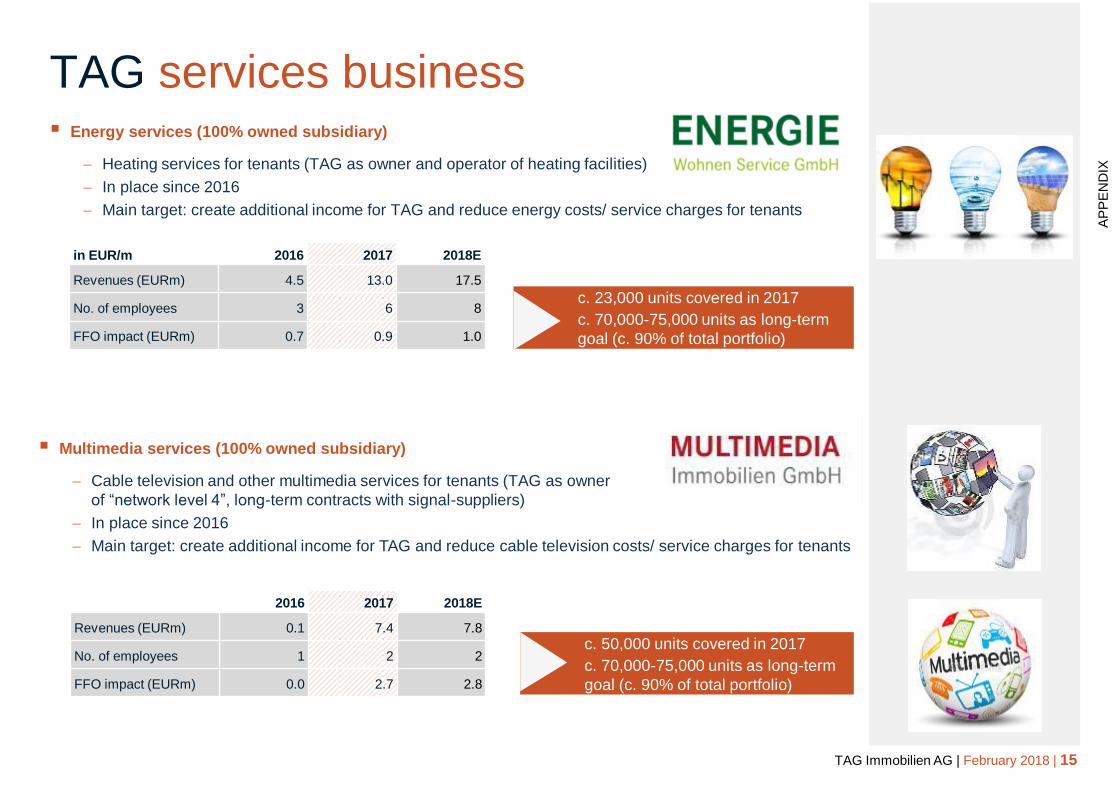
Multimedia services (100% owned subsidiary)
Cable television and other multimedia services for tenants (TAG as owner
of “network level 4”, long-term contracts with signal-suppliers)
In place since 2016
Main target: create additional income for TAG and reduce cable television costs/ service charges for tenants
TAG services business Energy services (100% owned subsidiary)
Heating services for tenants (TAG as owner and operator of heating facilities)
In place since 2016
Main target: create additional income for TAG and reduce energy costs/ service charges for tenants
c. 23,000 units covered in 2017
c. 70,000-75,000 units as long-term
goal (c. 90% of total portfolio)
in EUR/m 2016 2017 2018E
Revenues (EURm) 4.5 13.0 17.5
No. of employees 3 6 8
FFO impact (EURm) 0.7 0.9 1.0
c. 50,000 units covered in 2017
c. 70,000-75,000 units as long-term
goal (c. 90% of total portfolio)
2016 2017 2018E
Revenues (EURm) 0.1 7.4 7.8
No. of employees 1 2 2
FFO impact (EURm) 0.0 2.7 2.8
AP
PE
ND
IX
16 16
TAG Immobilien AG | February 2018 | 16
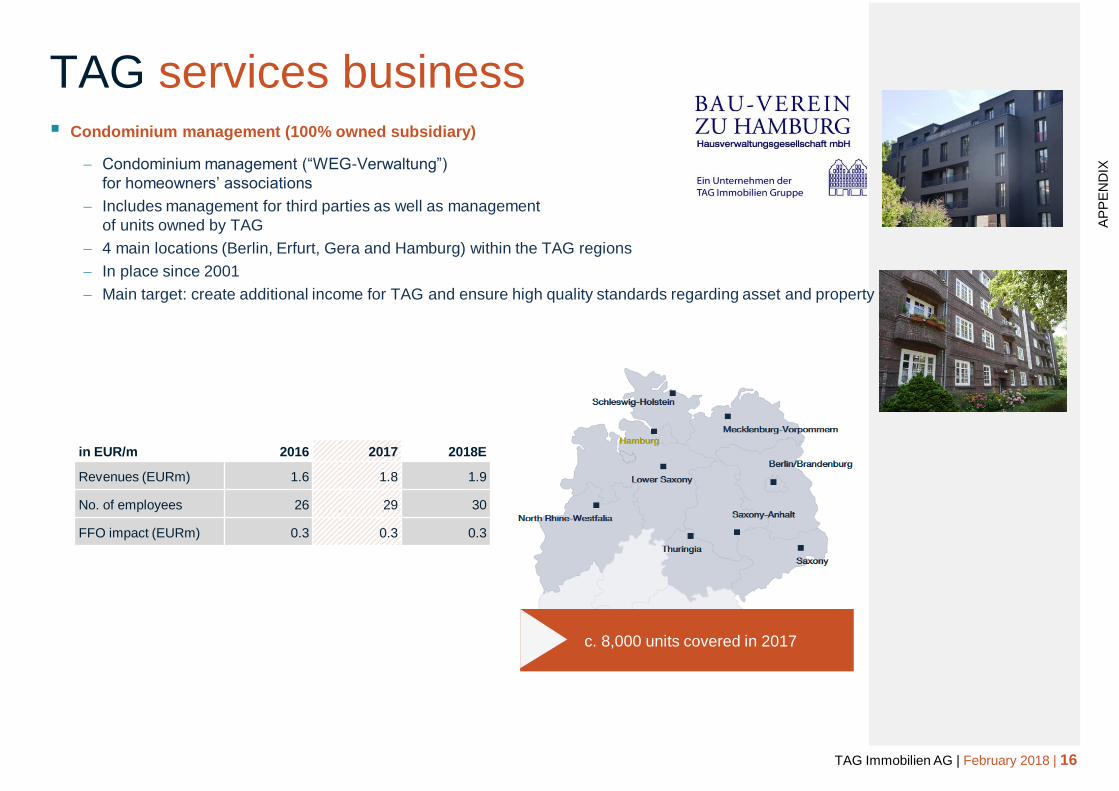
TAG services business Condominium management (100% owned subsidiary)
Condominium management (“WEG-Verwaltung”)
for homeowners’ associations
Includes management for third parties as well as management
of units owned by TAG
4 main locations (Berlin, Erfurt, Gera and Hamburg) within the TAG regions
In place since 2001
Main target: create additional income for TAG and ensure high quality standards regarding asset and property management
in EUR/m 2016 2017 2018E
Revenues (EURm) 1.6 1.8 1.9
No. of employees 26 29 30
FFO impact (EURm) 0.3 0.3 0.3
c. 8,000 units covered in 2017
AP
PE
ND
IX
TAG acquisitions 2016
17
TAG return on capex
TAG Immobilien AG | February 2018 | 17
18 18
TAG Immobilien AG | February 2018 | 18
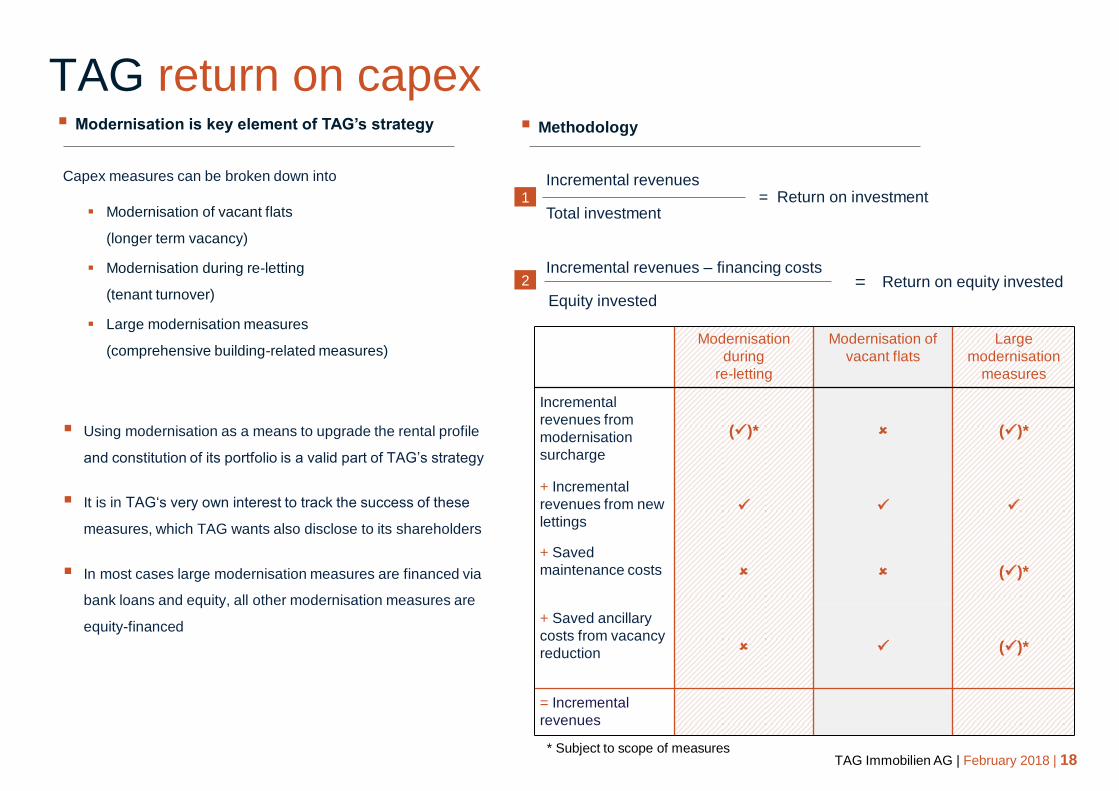
Return on equity invested
Methodology
Incremental revenues
Total investment = Return on investment
Incremental revenues – financing costs
Equity invested
Modernisation
during
re-letting
Modernisation of
vacant flats
Large
modernisation
measures
Incremental
revenues from
modernisation
surcharge
()* ()*
+ Incremental
revenues from new
lettings
+ Saved
maintenance costs ()*
+ Saved ancillary
costs from vacancy
reduction ()*
= Incremental
revenues
Capex measures can be broken down into
Modernisation of vacant flats
(longer term vacancy)
Modernisation during re-letting
(tenant turnover)
Large modernisation measures
(comprehensive building-related measures)
Using modernisation as a means to upgrade the rental profile
and constitution of its portfolio is a valid part of TAG’s strategy
It is in TAG‘s very own interest to track the success of these
measures, which TAG wants also disclose to its shareholders
In most cases large modernisation measures are financed via
bank loans and equity, all other modernisation measures are
equity-financed
Modernisation is key element of TAG’s strategy
=
* Subject to scope of measures
TAG return on capex
1
2
19 19
TAG Immobilien AG | February 2018 | 19
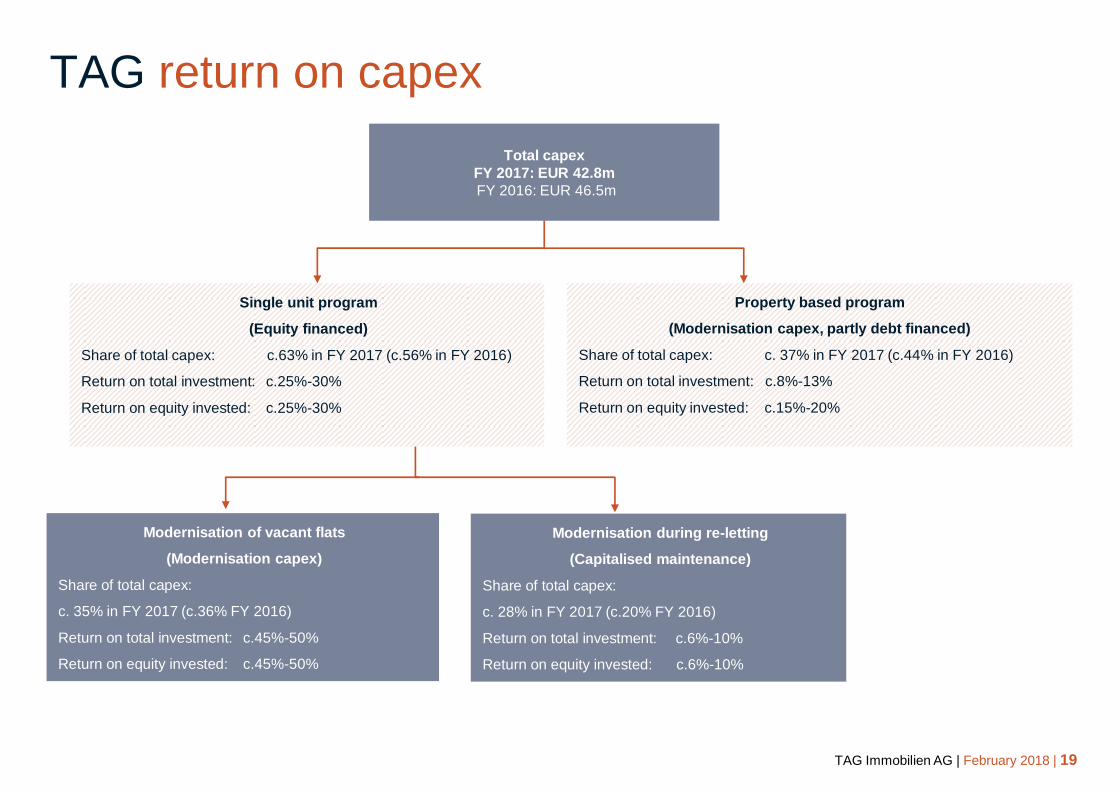
TAG return on capex
Modernisation of vacant flats
(Modernisation capex)
Share of total capex:
c. 35% in FY 2017 (c.36% FY 2016)
Return on total investment: c.45%-50%
Return on equity invested: c.45%-50%
Property based program
(Modernisation capex, partly debt financed)
Share of total capex: c. 37% in FY 2017 (c.44% in FY 2016)
Return on total investment: c.8%-13%
Return on equity invested: c.15%-20%
Modernisation during re-letting
(Capitalised maintenance)
Share of total capex:
c. 28% in FY 2017 (c.20% FY 2016)
Return on total investment: c.6%-10%
Return on equity invested: c.6%-10%
Total capex
FY 2017: EUR 42.8m
FY 2016: EUR 46.5m
Single unit program
(Equity financed)
Share of total capex: c.63% in FY 2017 (c.56% in FY 2016)
Return on total investment: c.25%-30%
Return on equity invested: c.25%-30%
TAG acquisitions 2016 TAG acquisitions and disposals FY 2017
TAG Immobilien AG | February 2018 | 20
21 21
TAG Immobilien AG | February 2018 | 21
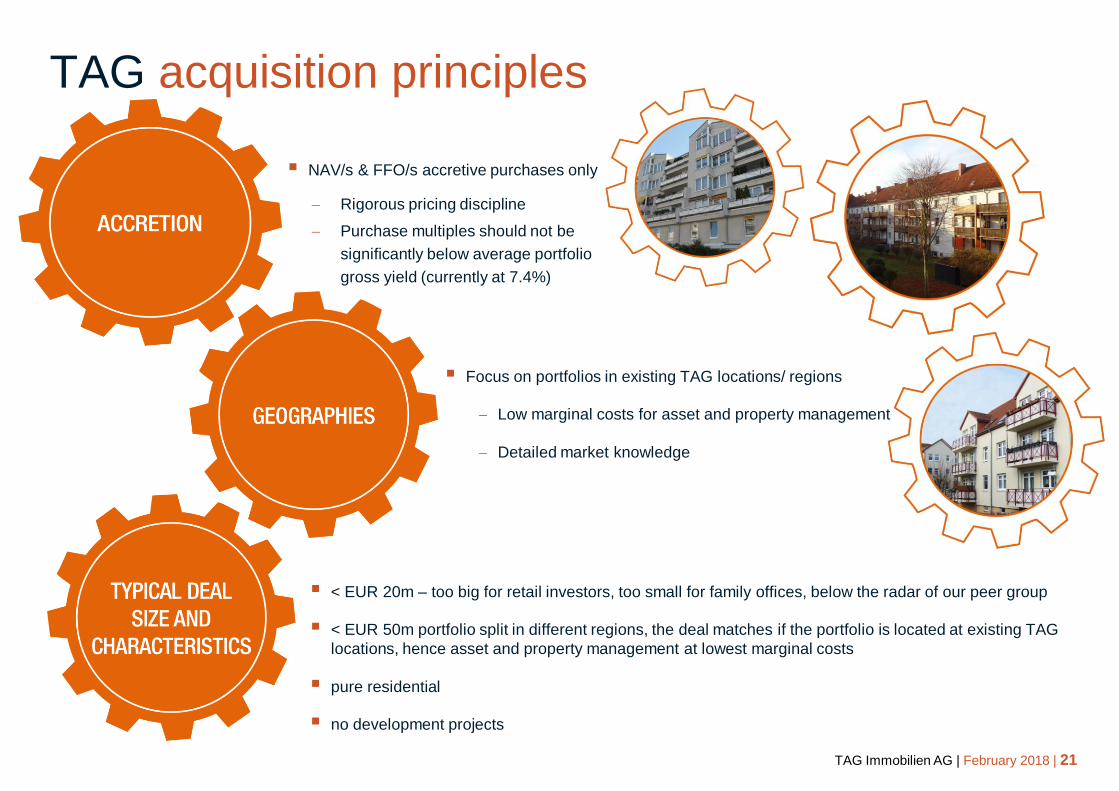
NAV/s & FFO/s accretive purchases only
Rigorous pricing discipline
Purchase multiples should not be
significantly below average portfolio
gross yield (currently at 7.4%)
Focus on portfolios in existing TAG locations/ regions
Low marginal costs for asset and property management
Detailed market knowledge
< EUR 20m – too big for retail investors, too small for family offices, below the radar of our peer group
< EUR 50m portfolio split in different regions, the deal matches if the portfolio is located at existing TAG
locations, hence asset and property management at lowest marginal costs
pure residential
no development projects
TAG acquisition principles
22 22
TAG Immobilien AG | February 2018 | 22
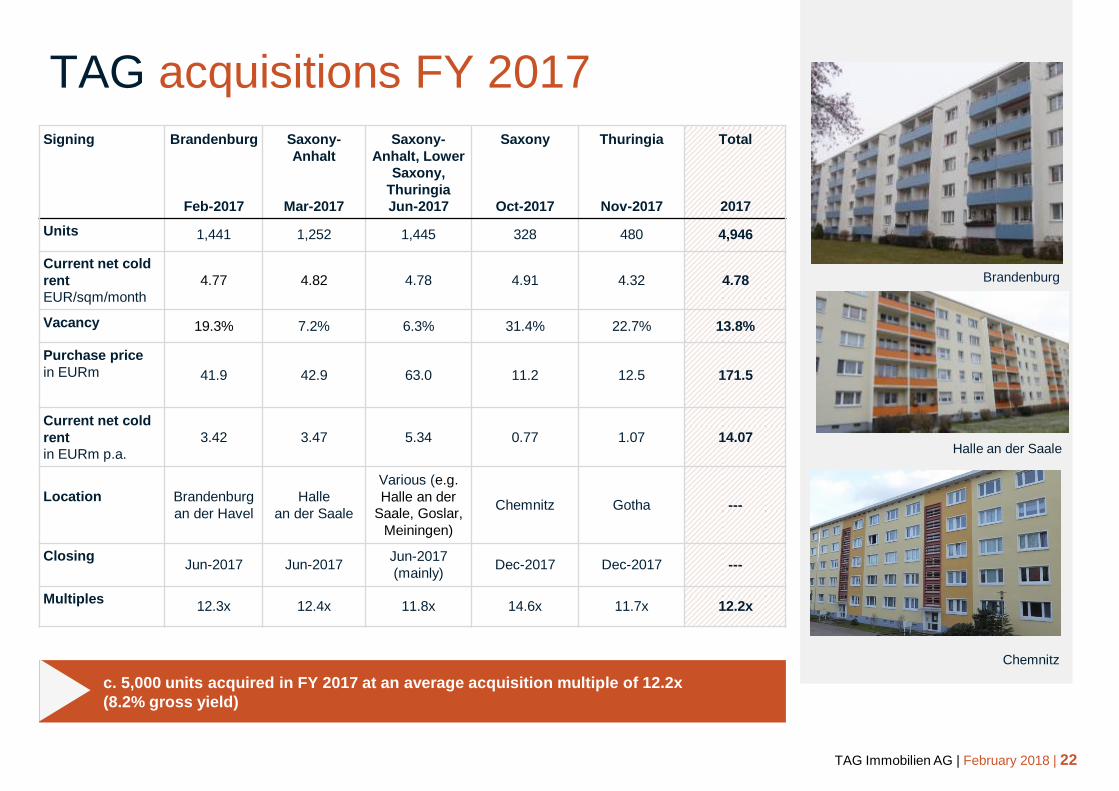
TAG acquisitions FY 2017
Signing Brandenburg
Feb-2017
Saxony-
Anhalt
Mar-2017
Saxony-
Anhalt, Lower
Saxony,
Thuringia
Jun-2017
Saxony
Oct-2017
Thuringia
Nov-2017
Total
2017
Units 1,441 1,252 1,445 328 480 4,946
Current net cold
rent
EUR/sqm/month
4.77 4.82 4.78 4.91 4.32 4.78
Vacancy 19.3% 7.2% 6.3% 31.4% 22.7% 13.8%
Purchase price
in EURm 41.9 42.9 63.0 11.2 12.5 171.5
Current net cold
rent
in EURm p.a.
3.42 3.47 5.34 0.77 1.07 14.07
Location Brandenburg
an der Havel
Halle
an der Saale
Various (e.g.
Halle an der
Saale, Goslar,
Meiningen)
Chemnitz Gotha ---
Closing Jun-2017 Jun-2017
Jun-2017
(mainly) Dec-2017 Dec-2017 ---
Multiples 12.3x 12.4x 11.8x 14.6x 11.7x 12.2x
c. 5,000 units acquired in FY 2017 at an average acquisition multiple of 12.2x
(8.2% gross yield)
Halle an der Saale
Brandenburg
Chemnitz
23 23
TAG Immobilien AG | February 2018 | 23
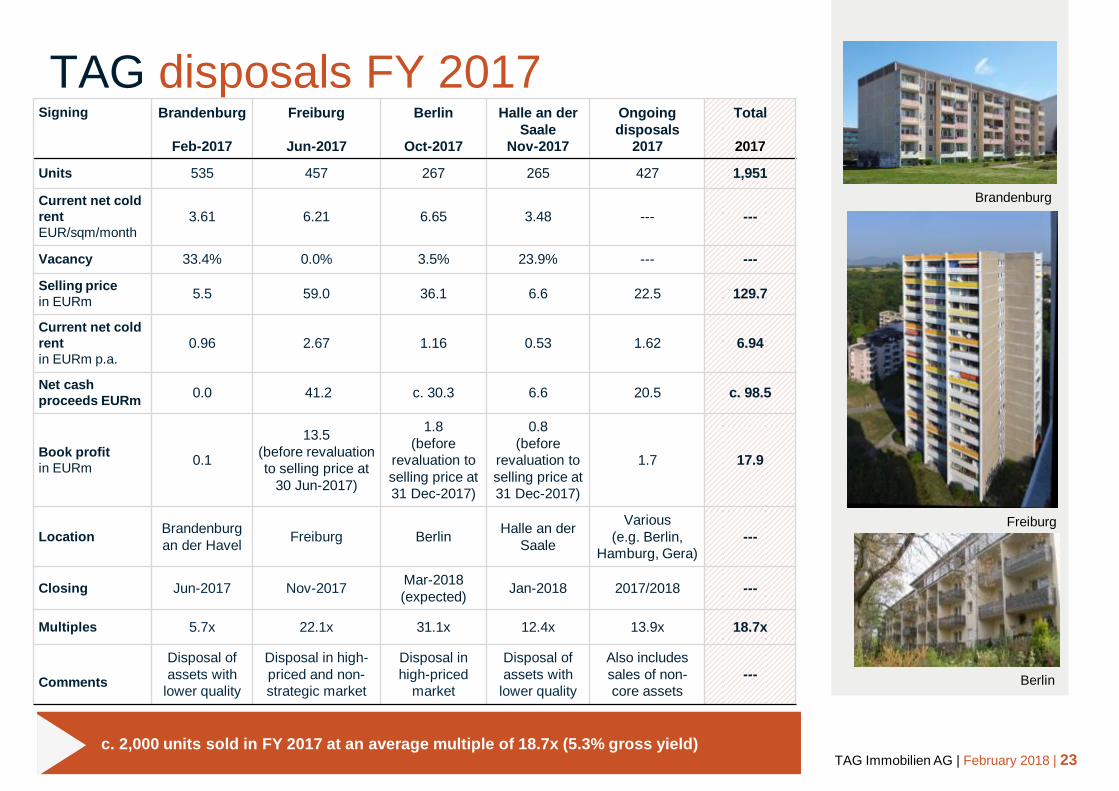
TAG disposals FY 2017 Signing
Brandenburg
Feb-2017
Freiburg
Jun-2017
Berlin
Oct-2017
Halle an der
Saale
Nov-2017
Ongoing
disposals
2017
Total
2017
Units 535 457 267 265 427 1,951
Current net cold
rent
EUR/sqm/month 3.61 6.21 6.65 3.48 --- ---
Vacancy 33.4% 0.0% 3.5% 23.9% --- ---
Selling price
in EURm 5.5 59.0 36.1 6.6 22.5 129.7
Current net cold
rent
in EURm p.a.
0.96 2.67 1.16 0.53 1.62 6.94
Net cash
proceeds EURm 0.0 41.2 c. 30.3 6.6 20.5 c. 98.5
Book profit
in EURm 0.1
13.5
(before revaluation
to selling price at
30 Jun-2017)
1.8
(before
revaluation to
selling price at
31 Dec-2017)
0.8
(before
revaluation to
selling price at
31 Dec-2017)
1.7 17.9
Location Brandenburg
an der Havel Freiburg Berlin
Halle an der
Saale
Various
(e.g. Berlin,
Hamburg, Gera)
---
Closing Jun-2017 Nov-2017 Mar-2018
(expected) Jan-2018 2017/2018 ---
Multiples 5.7x 22.1x 31.1x 12.4x 13.9x 18.7x
Comments
Disposal of
assets with
lower quality
Disposal in high-
priced and non-
strategic market
Disposal in
high-priced
market
Disposal of
assets with
lower quality
Also includes
sales of non-
core assets
---
Brandenburg
Freiburg
c. 2,000 units sold in FY 2017 at an average multiple of 18.7x (5.3% gross yield)
Berlin
TAG acquisitions 2016
24
TAG financing structure
TAG Immobilien AG | February 2018 | 24

25 25
TAG Immobilien AG | February 2018 | 25
Brandenburg
TAG cost of debt and LTV
LTV*
31 Dec-
2014
31 Dec-
2015
31 Dec-
2016
3.74% 3.45% 3.15%2.34%
Cost of debt Ø
Continuous reduction of average cost of debt
from FY 2015 onwards.
Average cost of debt as of 31 Dec-2017
excluding already refinanced corporate bond due
Aug-2018 (effective coupon 4.83%) on a pro-
forma basis down to 2.14%.
65.3% 62.7% 57.1%52.3%
New and reduced LTV target of c. 50% (formerly
c. 55%) as a consequence of strong portfolio
valuation development to be reached by
YE 2018.
Current LTV ensures efficient use of capital as
well as stable and conservative financing
structure given TAG’s moderate portfolio
valuation level (fair value per sqm of c. EUR 845
and current LTV of 52.3% leads to average
financial debt per sqm of only c. EUR 440).
31 Dec-
2017
31 Dec-
2014
31 Dec-
2015 31 Dec-
2016
31 Dec-
2017
Chemnitz
Riesa
Görlitz *For further details on LTV calculation see Appendix page 41
26 26
TAG Immobilien AG | February 2018 | 26
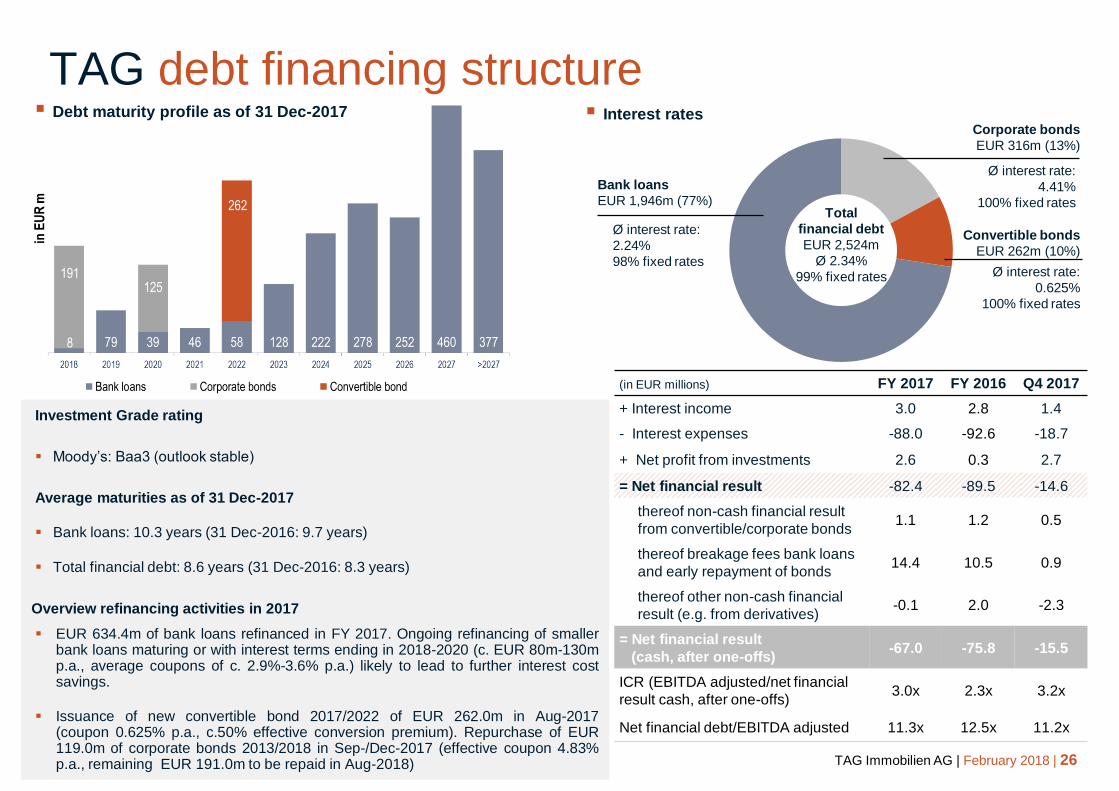
Debt maturity profile as of 31 Dec-2017
TAG debt financing structure Interest rates
Total
financial debt
EUR 2,524m
Ø 2.34%
99% fixed rates
Corporate bonds
EUR 316m (13%)
Ø interest rate:
4.41%
100% fixed rates
(in EUR millions) FY 2017 FY 2016 Q4 2017
+ Interest income 3.0 2.8 1.4
- Interest expenses -88.0 -92.6 -18.7
+ Net profit from investments 2.6 0.3 2.7
= Net financial result -82.4 -89.5 -14.6
thereof non-cash financial result
from convertible/corporate bonds 1.1 1.2 0.5
thereof breakage fees bank loans
and early repayment of bonds 14.4 10.5 0.9
thereof other non-cash financial
result (e.g. from derivatives) -0.1 2.0 -2.3
= Net financial result
(cash, after one-offs) -67.0 -75.8 -15.5
ICR (EBITDA adjusted/net financial
result cash, after one-offs) 3.0x 2.3x 3.2x
Net financial debt/EBITDA adjusted 11.3x 12.5x 11.2x
Bank loans
EUR 1,946m (77%)
Ø interest rate:
2.24%
98% fixed rates
Convertible bonds
EUR 262m (10%)
Ø interest rate:
0.625%
100% fixed rates
Investment Grade rating
Moody’s: Baa3 (outlook stable)
Average maturities as of 31 Dec-2017
Bank loans: 10.3 years (31 Dec-2016: 9.7 years)
Total financial debt: 8.6 years (31 Dec-2016: 8.3 years)
Overview refinancing activities in 2017
EUR 634.4m of bank loans refinanced in FY 2017. Ongoing refinancing of smaller bank loans maturing or with interest terms ending in 2018-2020 (c. EUR 80m-130m p.a., average coupons of c. 2.9%-3.6% p.a.) likely to lead to further interest cost savings.
Issuance of new convertible bond 2017/2022 of EUR 262.0m in Aug-2017 (coupon 0.625% p.a., c.50% effective conversion premium). Repurchase of EUR 119.0m of corporate bonds 2013/2018 in Sep-/Dec-2017 (effective coupon 4.83% p.a., remaining EUR 191.0m to be repaid in Aug-2018)
27 27
TAG Immobilien AG | February 2018 | 27
Brandenburg
Erfurt
Freiberg
Dessau
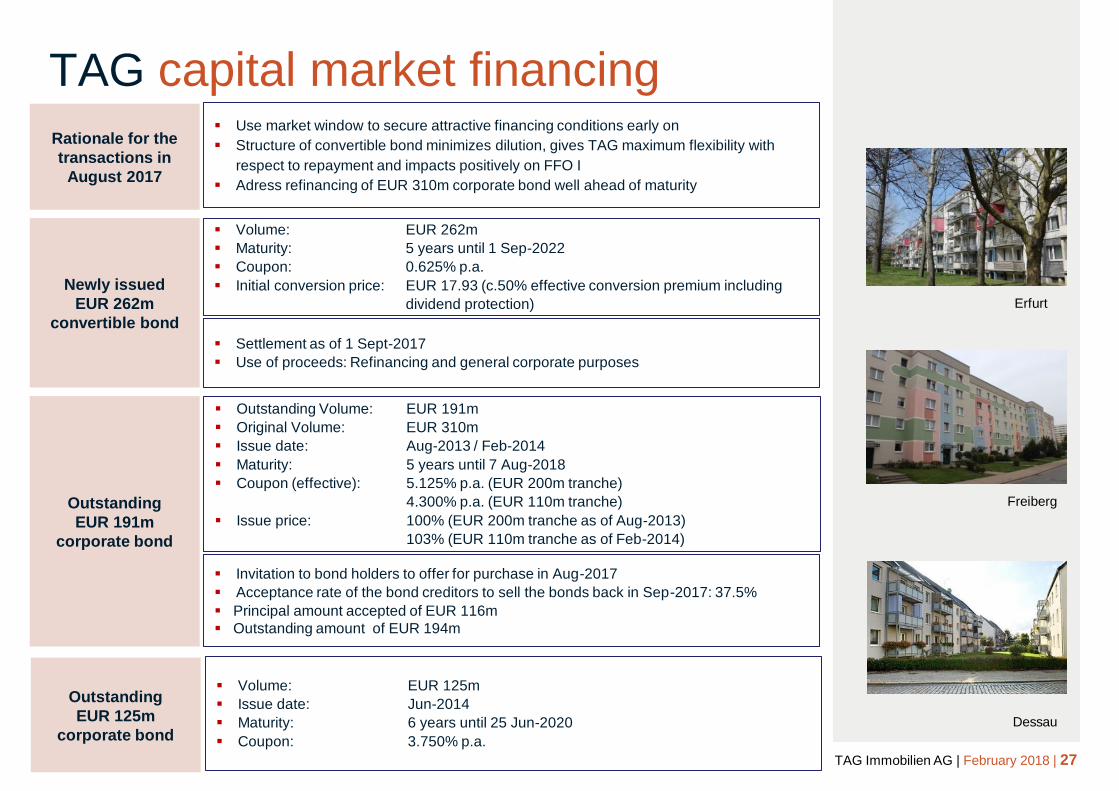
Newly issued
EUR 262m
convertible bond
Volume: EUR 262m
Maturity: 5 years until 1 Sep-2022
Coupon: 0.625% p.a.
Initial conversion price: EUR 17.93 (c.50% effective conversion premium including
dividend protection)
Settlement as of 1 Sept-2017
Use of proceeds: Refinancing and general corporate purposes
Outstanding
EUR 191m
corporate bond
Outstanding Volume: EUR 191m
Original Volume: EUR 310m
Issue date: Aug-2013 / Feb-2014
Maturity: 5 years until 7 Aug-2018
Coupon (effective): 5.125% p.a. (EUR 200m tranche)
4.300% p.a. (EUR 110m tranche)
Issue price: 100% (EUR 200m tranche as of Aug-2013)
103% (EUR 110m tranche as of Feb-2014)
Invitation to bond holders to offer for purchase in Aug-2017
Acceptance rate of the bond creditors to sell the bonds back in Sep-2017: 37.5%
Principal amount accepted of EUR 116m
Outstanding amount of EUR 194m
Outstanding
EUR 125m
corporate bond
Volume: EUR 125m
Issue date: Jun-2014
Maturity: 6 years until 25 Jun-2020
Coupon: 3.750% p.a.
Use market window to secure attractive financing conditions early on
Structure of convertible bond minimizes dilution, gives TAG maximum flexibility with
respect to repayment and impacts positively on FFO I
Adress refinancing of EUR 310m corporate bond well ahead of maturity
Rationale for the
transactions in
August 2017
TAG capital market financing

TAG acquisitions 2016
28
TAG guidance FY 2018
TAG Immobilien AG | February 2018 | 28
29 29
TAG Immobilien AG | February 2018 | 29
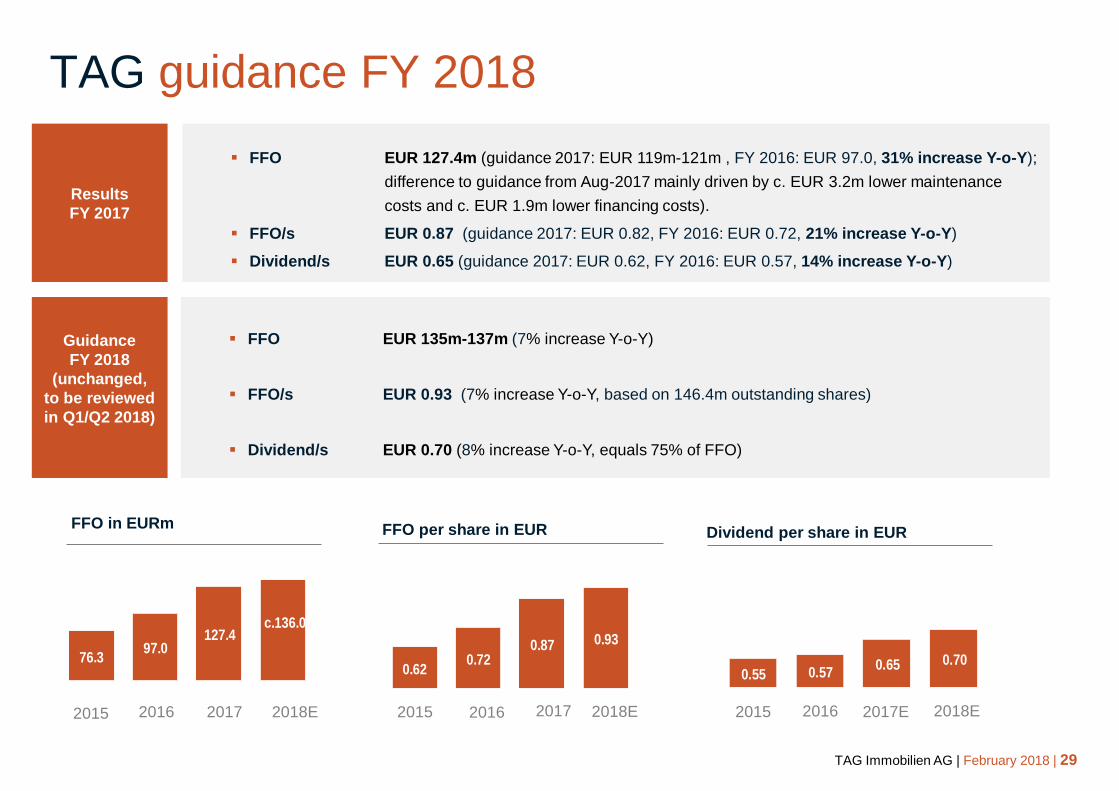
76.397.0
127.4c.136.0
0.55 0.570.65 0.70
Dividend per share in EUR FFO per share in EUR
TAG guidance FY 2018
2015 2016 2017
FFO in EURm
Guidance
FY 2018
(unchanged,
to be reviewed
in Q1/Q2 2018)
FFO EUR 135m-137m (7% increase Y-o-Y)
FFO/s EUR 0.93 (7% increase Y-o-Y, based on 146.4m outstanding shares)
Dividend/s EUR 0.70 (8% increase Y-o-Y, equals 75% of FFO)
2018E 2015 2016 2017 2018E 2015 2016 2017E 2018E
0.620.72
0.87 0.93
Results
FY 2017
FFO EUR 127.4m (guidance 2017: EUR 119m-121m , FY 2016: EUR 97.0, 31% increase Y-o-Y);
difference to guidance from Aug-2017 mainly driven by c. EUR 3.2m lower maintenance
costs and c. EUR 1.9m lower financing costs).
FFO/s EUR 0.87 (guidance 2017: EUR 0.82, FY 2016: EUR 0.72, 21% increase Y-o-Y)
Dividend/s EUR 0.65 (guidance 2017: EUR 0.62, FY 2016: EUR 0.57, 14% increase Y-o-Y)
30 30
AP
PE
ND
IX
TAG Immobilien AG | November 2017
APPENDIX
TAG Immobilien AG | February 2018 | 30
31 31
TAG Immobilien AG | February 2018 | 31
Region Units
#
Rentable
area
sqm
IFRS BV
EURm
In-
place
yield
Vacancy
Dec-
2017
Vacancy
Dec-
2016
Current
net cold
rent
EUR/
sqm
Re-
letting
rent
EUR/
sqm
L-f-l rental
growth
Y-o-Y
L-f-l rental
growth
Y-o-Y incl.
vacancy
reduction
Mainte-
nance
EUR/sqm
Capex
EUR/sqm
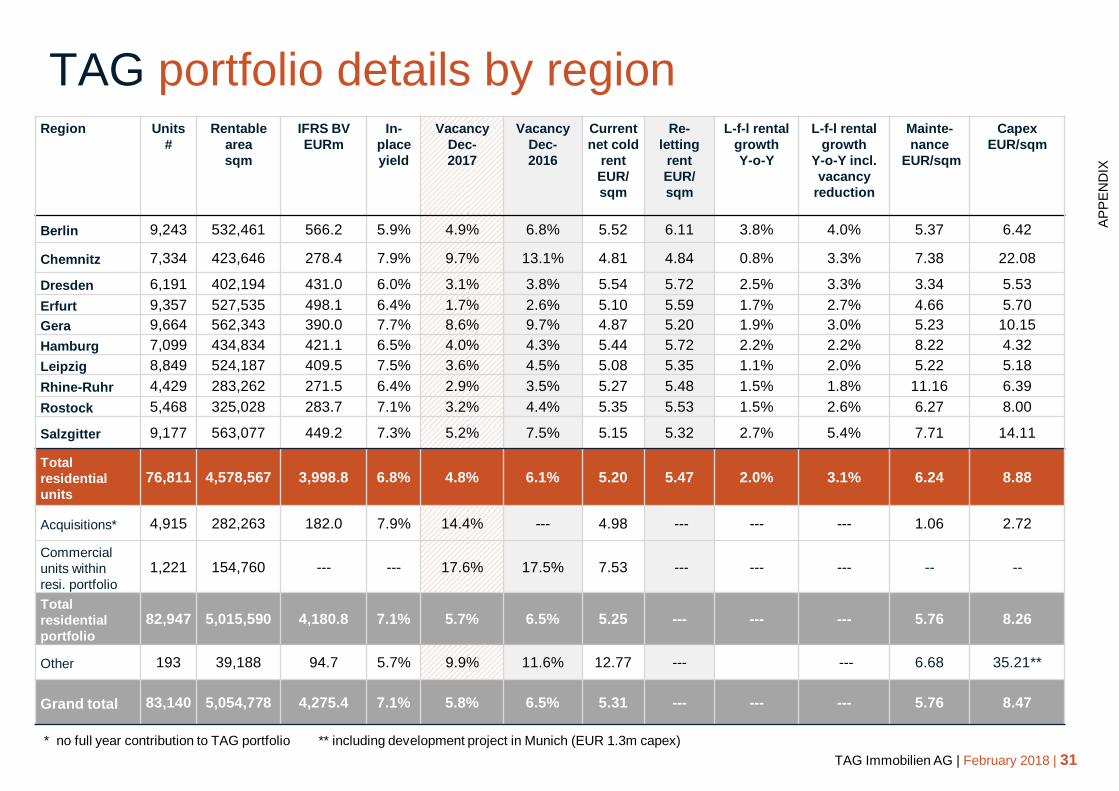
Berlin 9,243 532,461 566.2 5.9% 4.9% 6.8% 5.52 6.11 3.8% 4.0% 5.37 6.42
Chemnitz 7,334 423,646 278.4 7.9% 9.7% 13.1% 4.81 4.84 0.8% 3.3% 7.38 22.08
Dresden 6,191 402,194 431.0 6.0% 3.1% 3.8% 5.54 5.72 2.5% 3.3% 3.34 5.53
Erfurt 9,357 527,535 498.1 6.4% 1.7% 2.6% 5.10 5.59 1.7% 2.7% 4.66 5.70
Gera 9,664 562,343 390.0 7.7% 8.6% 9.7% 4.87 5.20 1.9% 3.0% 5.23 10.15
Hamburg 7,099 434,834 421.1 6.5% 4.0% 4.3% 5.44 5.72 2.2% 2.2% 8.22 4.32
Leipzig 8,849 524,187 409.5 7.5% 3.6% 4.5% 5.08 5.35 1.1% 2.0% 5.22 5.18
Rhine-Ruhr 4,429 283,262 271.5 6.4% 2.9% 3.5% 5.27 5.48 1.5% 1.8% 11.16 6.39
Rostock 5,468 325,028 283.7 7.1% 3.2% 4.4% 5.35 5.53 1.5% 2.6% 6.27 8.00
Salzgitter 9,177 563,077 449.2 7.3% 5.2% 7.5% 5.15 5.32 2.7% 5.4% 7.71 14.11
Total
residential
units
76,811 4,578,567 3,998.8 6.8% 4.8% 6.1% 5.20 5.47 2.0% 3.1% 6.24 8.88
Acquisitions* 4,915 282,263 182.0 7.9% 14.4% --- 4.98 --- --- --- 1.06 2.72
Commercial
units within
resi. portfolio
1,221 154,760 --- --- 17.6% 17.5% 7.53 --- --- --- -- --
Total
residential
portfolio
82,947 5,015,590 4,180.8 7.1% 5.7% 6.5% 5.25 --- --- --- 5.76 8.26
Other 193 39,188 94.7 5.7% 9.9% 11.6% 12.77 --- --- 6.68 35.21**
Grand total 83,140 5,054,778 4,275.4 7.1% 5.8% 6.5% 5.31 --- --- --- 5.76 8.47
TAG portfolio details by region
AP
PE
ND
IX
* no full year contribution to TAG portfolio ** including development project in Munich (EUR 1.3m capex)
32 32
TAG Immobilien AG | February 2018 | 32
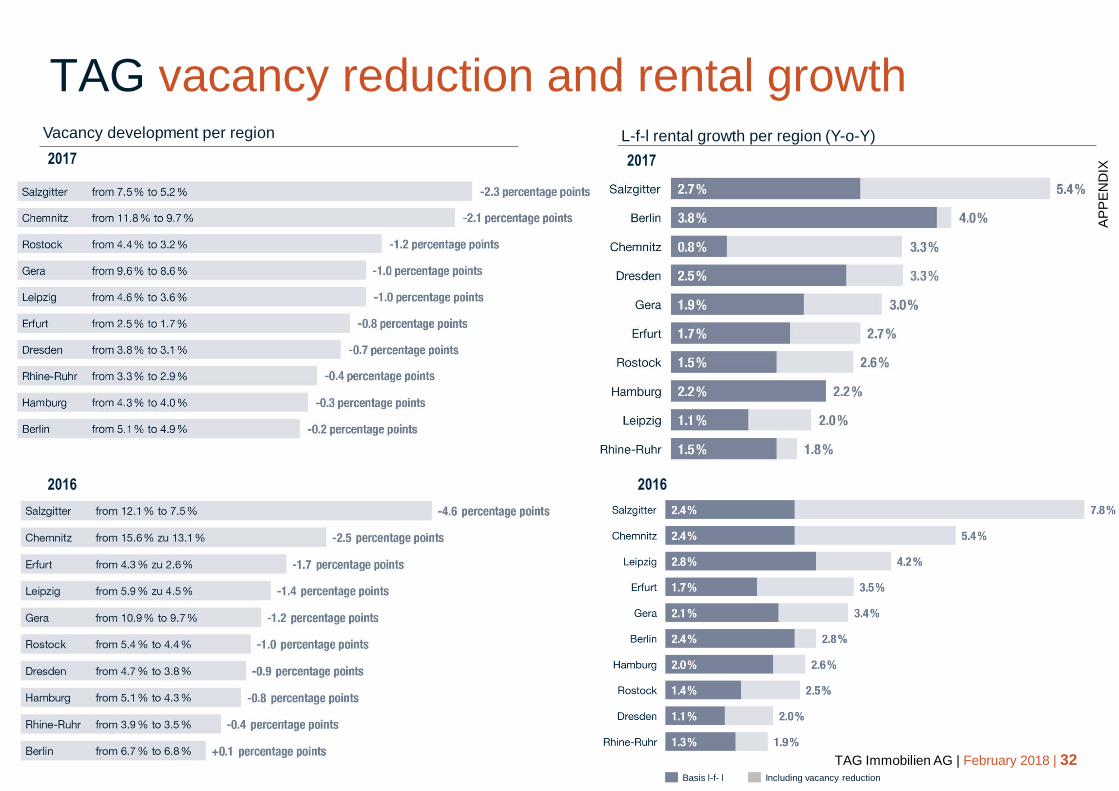
TAG vacancy reduction and rental growth
2016
2017
Vacancy development per region L-f-l rental growth per region (Y-o-Y)
2016
2017
Basis l-f- l Including vacancy reduction
AP
PE
ND
IX

33 33
TAG Immobilien AG | February 2018 | 33
TAG portfolio valuation details
Region
(in EUR millions)
Dec-2017
Fair value
(IFRS)
Dec-2017
Fair value
(EUR/sqm)
Dec-2017
Implied
multiple
FY 2017
Revaluation
gain / loss
Share of
yield
compression
Share of
operational
performance/
other market
developments
Change in
treatment of
transaction
costs
FY 2017
Net
revaluation
gain/loss
Dec-2016
Fair value
(IFRS)
Dec-2016
Fair value
(EUR/sqm)
Dec-2016
Implied
multiple
Berlin 566.2 1,002.4 15.8x 98.2 78.8 19.4 -42.1 56.2 522.0 864.5 14.6x
Chemnitz 278.4 606.7 11.9x 20.0 13.5 6.5 -17.5 2.5 226.5 585.6 12.0x
Dresden 431.0 1,038.3 16.1x 80.5 65.8 14.7 -26.5 54.0 374.8 902.9 14.4x
Erfurt 498,1 862.6 14.1x 83.9 66.1 17.8 -41.5 42.4 407.7 830.4 13.8x
Gera 390.0 660.7 12.5x 36.5 21.6 15.0 -36.0 0.6 382.8 651.5 12.7x
Hamburg 421.1 950.0 14.9x 44.6 37.4 7.2 -7.7 36.9 387.5 860.4 13.8x
Leipzig 409.5 763.1 12.8x 51.8 36.9 14.9 -28.1 23.7 372.9 725.0 12.4x
Rhine-Ruhr 271.5 917.3 14.5x 42.2 32.1 10.1 -2.7 39.6 288.0 860.6 13.7x
Rostock 283.7 860.9 13.8x 25.3 20.2 5.2 -21.7 3.7 272.8 827.4 13.6x
Salzgitter 449.2 795.6 13.4x 65.5 39.3 26.2 -31.7 33.7 407.6 722.0 12.7x
Total residential
units 3,998.8 837.2 14.0x 548.6 411.6 137.0 -255.5 293.1 3,642.6 778.7 13.4x
Acquisitions 2017
(2016) 182.0 761.4 15.0x 0.4 0.0 0.4 0.0 0.4 111.8 722.4 13.0x
Total residential
portfolio 4,180.8 833.6 14.0x 549.0 411.6 137.3 -255.5 293.5 3,754.4 776.9 13.4x
Other 94.7 2,415.6 17.5x 0.7 0.0 0.7 -1.2 -0.4 102.2 2,251.9 17.3x
Grand total* 4,275.4 845.8 14.1x 549.7 411.6 138.1 -256.7 293.0 3,856.6 790.6 13.5x
* Real estate inventory (IAS 2) and real estate within property, plant and equipment (IAS 16) valued at historical/amortized cost under IFRS.
AP
PE
ND
IX
34 34
TAG Immobilien AG | February 2018 | 34
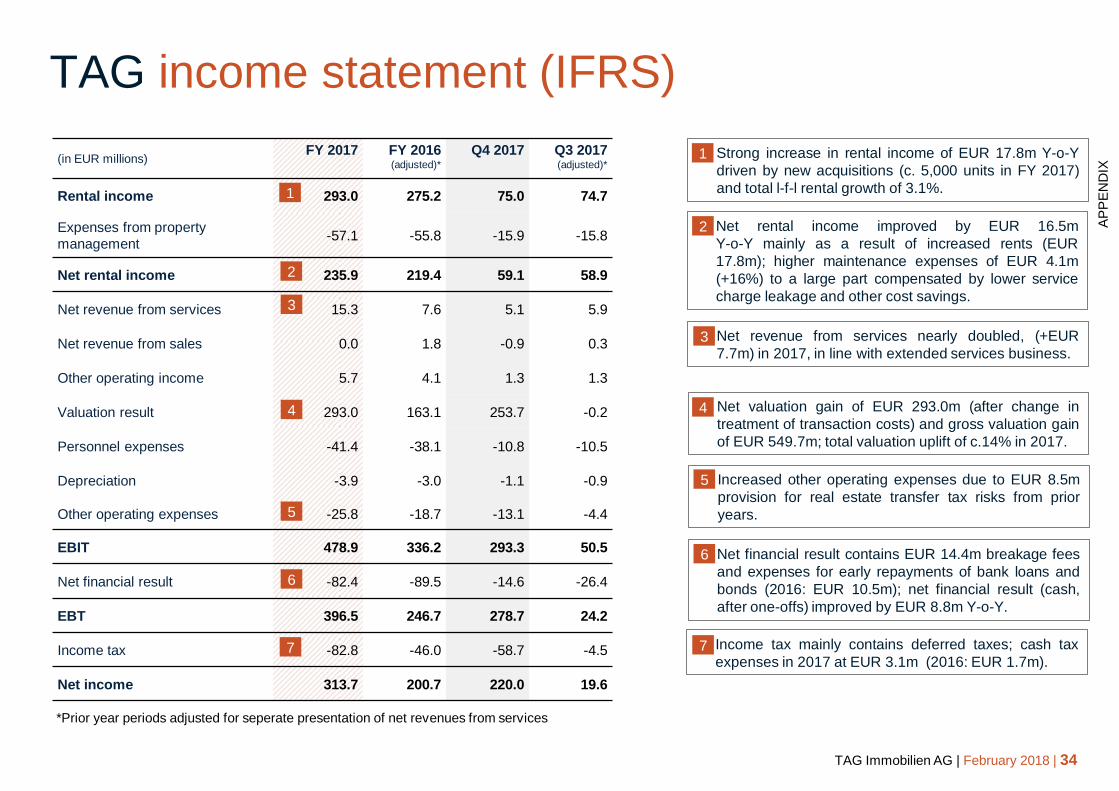
Net financial result contains EUR 14.4m breakage fees
and expenses for early repayments of bank loans and
bonds (2016: EUR 10.5m); net financial result (cash,
after one-offs) improved by EUR 8.8m Y-o-Y.
TAG income statement (IFRS)
Net revenue from services nearly doubled, (+EUR
7.7m) in 2017, in line with extended services business.
Strong increase in rental income of EUR 17.8m Y-o-Y
driven by new acquisitions (c. 5,000 units in FY 2017)
and total l-f-l rental growth of 3.1%.
Net valuation gain of EUR 293.0m (after change in
treatment of transaction costs) and gross valuation gain
of EUR 549.7m; total valuation uplift of c.14% in 2017.
Income tax mainly contains deferred taxes; cash tax
expenses in 2017 at EUR 3.1m (2016: EUR 1.7m).
Net rental income improved by EUR 16.5m
Y-o-Y mainly as a result of increased rents (EUR
17.8m); higher maintenance expenses of EUR 4.1m
(+16%) to a large part compensated by lower service
charge leakage and other cost savings.
(in EUR millions) FY 2017 FY 2016
(adjusted)*
Q4 2017 Q3 2017 (adjusted)*
Rental income 293.0 275.2 75.0 74.7
Expenses from property
management -57.1 -55.8 -15.9 -15.8
Net rental income 235.9 219.4 59.1 58.9
Net revenue from services 15.3 7.6 5.1 5.9
Net revenue from sales 0.0 1.8 -0.9 0.3
Other operating income 5.7 4.1 1.3 1.3
Valuation result 293.0 163.1 253.7 -0.2
Personnel expenses -41.4 -38.1 -10.8 -10.5
Depreciation -3.9 -3.0 -1.1 -0.9
Other operating expenses -25.8 -18.7 -13.1 -4.4
EBIT 478.9 336.2 293.3 50.5
Net financial result -82.4 -89.5 -14.6 -26.4
EBT 396.5 246.7 278.7 24.2
Income tax -82.8 -46.0 -58.7 -4.5
Net income 313.7 200.7 220.0 19.6
*Prior year periods adjusted for seperate presentation of net revenues from services
1
1
2
2
3
3
4 4
6
6
7 7
Increased other operating expenses due to EUR 8.5m
provision for real estate transfer tax risks from prior
years.
5
5
AP
PE
ND
IX
35 35
TAG Immobilien AG | February 2018 | 35
(in EUR millions) FY 2017 FY 2016 Q4 2017 Q3 2017
Net income 313.7 200.7 220.0 19.6
+ Income tax 82.8 46.0 58.7 4.5
+ Net financial result 82.4 89.5 14.6 26.4
EBIT 478.9 336.2 293.3 50.5
+ Adjustments
Net revenue from sales 0.0 -1.8 0.9 -0.3
Valuation result -293.0 -163.1 -253.7 0.2
Depreciation 3.9 3.0 1.1 0.9
One-offs
(2017: provision for real estate transfer tax risks;
2016: project and personnel costs)
8.5 0.9 8.5 0.0
EBITDA (adjusted) 198.3 175.2 50.1 51.3
EBITDA (adjusted) margin 67.7% 63.7% 66.8% 68.7%
- Net financial result
(cash, after one-offs) -67.0 -75.8 -15.5 -16.5
- Cash taxes -3.1 -1.7 -0.3 -0.7
- Cash dividend payments to minorities -0.8 -0.7 -0.2 -0.2
FFO I 127.4 97.0 34.1 33.9
- Capitalised maintenance -12.0 -9.2 -2.8 -5.6
AFFO before modernisation capex 115.4 87.8 31.3 28.3
- Modernisation capex -30.8 -37.3 -10.4 -6.2
AFFO 84.6 50.5 20.9 22.1
Net revenue from sales 0.0 1.8 -0.9 0.3
FFO II
(FFO I + net revenue from sales) 127.4 98.8 33.2 34.2
Weighted average number of shares outstanding
(in ‘000) 145,709* 135,666 146,439* 146,439
FFO I per share (EUR) 0.87 0.72 0.23 0.23
AFFO per share (EUR) 0.58 0.37 0.14 0.15
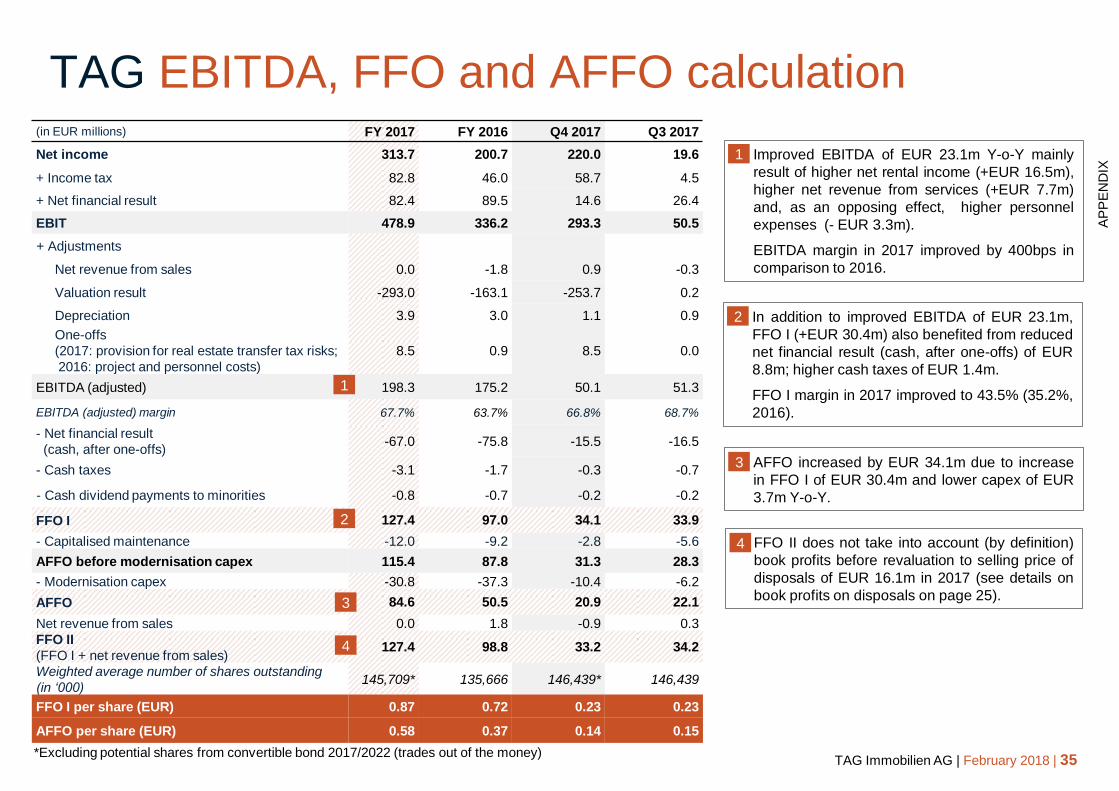
TAG EBITDA, FFO and AFFO calculation
Improved EBITDA of EUR 23.1m Y-o-Y mainly
result of higher net rental income (+EUR 16.5m),
higher net revenue from services (+EUR 7.7m)
and, as an opposing effect, higher personnel
expenses (- EUR 3.3m).
EBITDA margin in 2017 improved by 400bps in
comparison to 2016.
FFO II does not take into account (by definition)
book profits before revaluation to selling price of
disposals of EUR 16.1m in 2017 (see details on
book profits on disposals on page 25).
AFFO increased by EUR 34.1m due to increase
in FFO I of EUR 30.4m and lower capex of EUR
3.7m Y-o-Y.
In addition to improved EBITDA of EUR 23.1m,
FFO I (+EUR 30.4m) also benefited from reduced
net financial result (cash, after one-offs) of EUR
8.8m; higher cash taxes of EUR 1.4m.
FFO I margin in 2017 improved to 43.5% (35.2%,
2016).
*Excluding potential shares from convertible bond 2017/2022 (trades out of the money)
1
2
3
4
1
2
3
4
AP
PE
ND
IX
36 36
TAG Immobilien AG | February 2018 | 36
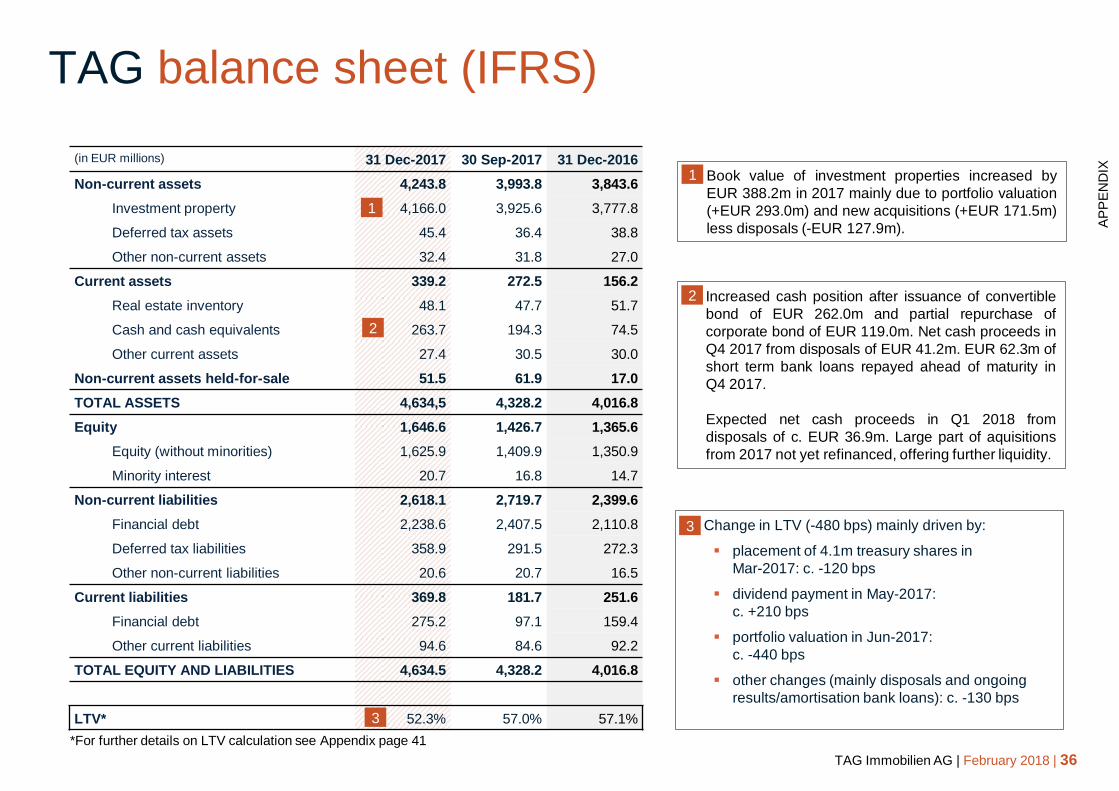
TAG balance sheet (IFRS)
Book value of investment properties increased by
EUR 388.2m in 2017 mainly due to portfolio valuation
(+EUR 293.0m) and new acquisitions (+EUR 171.5m)
less disposals (-EUR 127.9m).
(in EUR millions) 31 Dec-2017 30 Sep-2017 31 Dec-2016
Non-current assets 4,243.8 3,993.8 3,843.6
Investment property 4,166.0 3,925.6 3,777.8
Deferred tax assets 45.4 36.4 38.8
Other non-current assets 32.4 31.8 27.0
Current assets 339.2 272.5 156.2
Real estate inventory 48.1 47.7 51.7
Cash and cash equivalents 263.7 194.3 74.5
Other current assets 27.4 30.5 30.0
Non-current assets held-for-sale 51.5 61.9 17.0
TOTAL ASSETS 4,634,5 4,328.2 4,016.8
Equity 1,646.6 1,426.7 1,365.6
Equity (without minorities) 1,625.9 1,409.9 1,350.9
Minority interest 20.7 16.8 14.7
Non-current liabilities 2,618.1 2,719.7 2,399.6
Financial debt 2,238.6 2,407.5 2,110.8
Deferred tax liabilities 358.9 291.5 272.3
Other non-current liabilities 20.6 20.7 16.5
Current liabilities 369.8 181.7 251.6
Financial debt 275.2 97.1 159.4
Other current liabilities 94.6 84.6 92.2
TOTAL EQUITY AND LIABILITIES 4,634.5 4,328.2 4,016.8
LTV* 52.3% 57.0% 57.1%
Increased cash position after issuance of convertible
bond of EUR 262.0m and partial repurchase of
corporate bond of EUR 119.0m. Net cash proceeds in
Q4 2017 from disposals of EUR 41.2m. EUR 62.3m of
short term bank loans repayed ahead of maturity in
Q4 2017.
Expected net cash proceeds in Q1 2018 from
disposals of c. EUR 36.9m. Large part of aquisitions
from 2017 not yet refinanced, offering further liquidity.
Change in LTV (-480 bps) mainly driven by:
placement of 4.1m treasury shares in
Mar-2017: c. -120 bps
dividend payment in May-2017:
c. +210 bps
portfolio valuation in Jun-2017:
c. -440 bps
other changes (mainly disposals and ongoing
results/amortisation bank loans): c. -130 bps
*For further details on LTV calculation see Appendix page 41
1
2
3
1
2
3
AP
PE
ND
IX
37 37
TAG Immobilien AG | February 2018 | 37
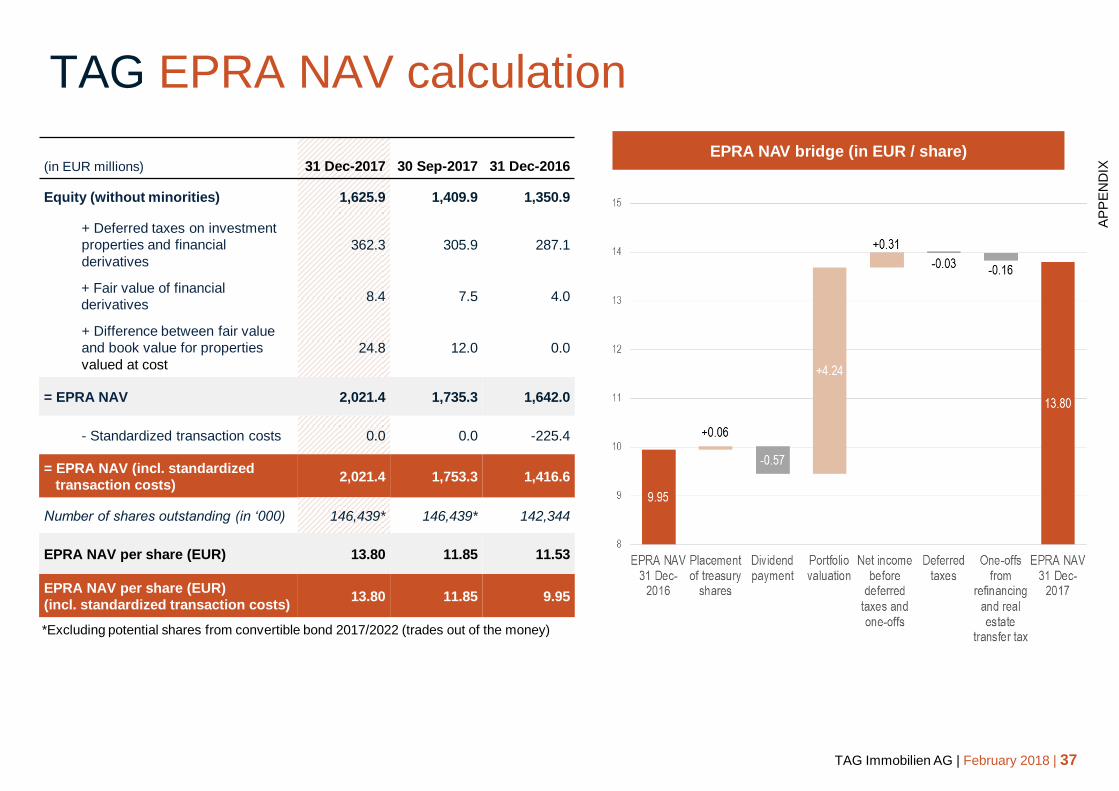
TAG EPRA NAV calculation
(in EUR millions) 31 Dec-2017 30 Sep-2017 31 Dec-2016
Equity (without minorities) 1,625.9 1,409.9 1,350.9
+ Deferred taxes on investment
properties and financial
derivatives
362.3 305.9 287.1
+ Fair value of financial
derivatives 8.4 7.5 4.0
+ Difference between fair value
and book value for properties
valued at cost
24.8 12.0 0.0
= EPRA NAV 2,021.4 1,735.3 1,642.0
- Standardized transaction costs 0.0 0.0 -225.4
= EPRA NAV (incl. standardized
transaction costs) 2,021.4 1,753.3 1,416.6
Number of shares outstanding (in ‘000) 146,439* 146,439* 142,344
EPRA NAV per share (EUR) 13.80 11.85 11.53
EPRA NAV per share (EUR)
(incl. standardized transaction costs) 13.80 11.85 9.95
EPRA NAV bridge (in EUR / share)
*Excluding potential shares from convertible bond 2017/2022 (trades out of the money)
AP
PE
ND
IX
38 38
TAG Immobilien AG | February 2018 | 38
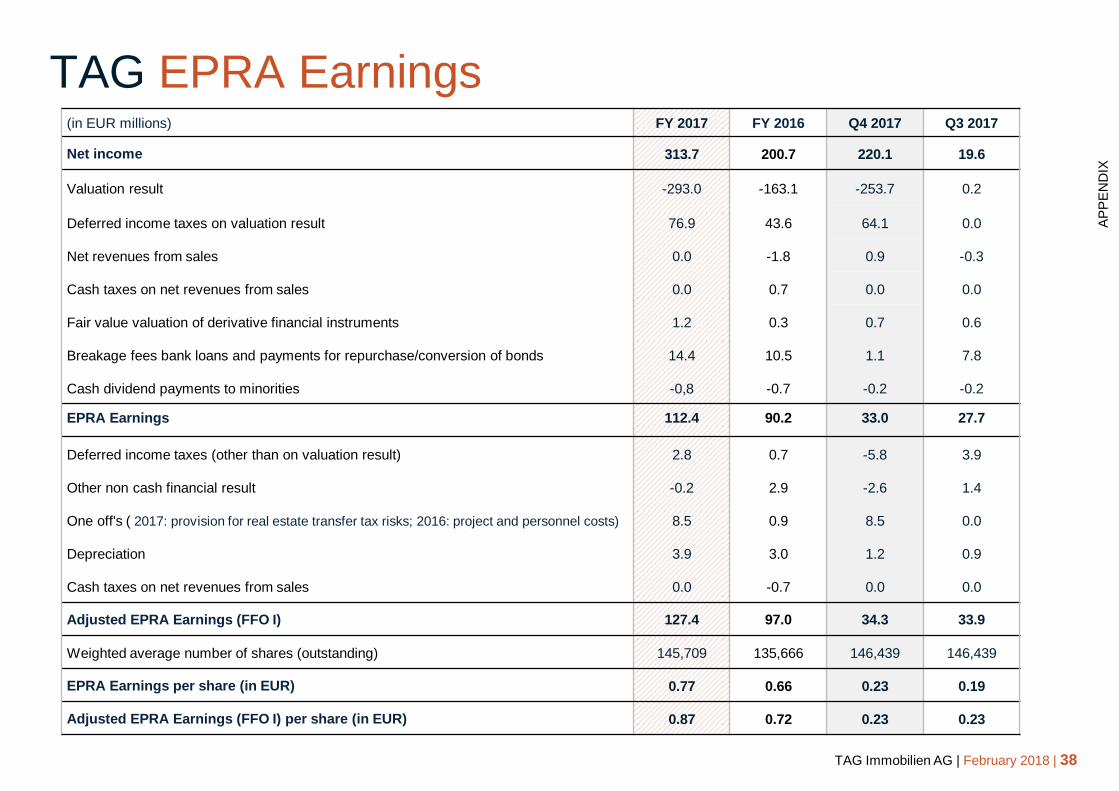
TAG EPRA Earnings (in EUR millions) FY 2017 FY 2016 Q4 2017 Q3 2017
Net income 313.7 200.7 220.1 19.6
Valuation result -293.0 -163.1 -253.7 0.2
Deferred income taxes on valuation result 76.9 43.6 64.1 0.0
Net revenues from sales 0.0 -1.8 0.9 -0.3
Cash taxes on net revenues from sales 0.0 0.7 0.0 0.0
Fair value valuation of derivative financial instruments 1.2 0.3 0.7 0.6
Breakage fees bank loans and payments for repurchase/conversion of bonds 14.4 10.5 1.1 7.8
Cash dividend payments to minorities -0,8 -0.7 -0.2 -0.2
EPRA Earnings 112.4 90.2 33.0 27.7
Deferred income taxes (other than on valuation result) 2.8 0.7 -5.8 3.9
Other non cash financial result -0.2 2.9 -2.6 1.4
One off's ( 2017: provision for real estate transfer tax risks; 2016: project and personnel costs) 8.5 0.9 8.5 0.0
Depreciation 3.9 3.0 1.2 0.9
Cash taxes on net revenues from sales 0.0 -0.7 0.0 0.0
Adjusted EPRA Earnings (FFO I) 127.4 97.0 34.3 33.9
Weighted average number of shares (outstanding) 145,709 135,666 146,439 146,439
EPRA Earnings per share (in EUR) 0.77 0.66 0.23 0.19
Adjusted EPRA Earnings (FFO I) per share (in EUR) 0.87 0.72 0.23 0.23
AP
PE
ND
IX

39 39
TAG Immobilien AG | February 2018 | 39
TAG LTV calculation
(in EUR millions) 31 Dec-2017 30 Sep-2017 31 Dec-2016
Non-current and current liabilities to banks 1,935.4 1,927.1 1,826.5
Non-current and current liabilities from corporate bonds 322.2 322.0 443.7
Non-current and current liabilities from convertible bonds 256.2 255.5 0.0
Cash and cash equivalents -264.2 -194.3 -74.5
Net financial debt 2,249.6 2,310.3 2,195.7
Book value of investment properties 4,166.0 3,925.6 3,777.8
Book value of property reported under property, plant and equipment 9.8 9.9 10.1
Book value of property held as inventory 48.1 47.7 51.7
Book value of property reported under non-current assets held-for-sale 51.5 61.9 17.0
Real estate volume 4,275,4 4,045.1 3,856.6
Book value of property for which purchase prices have already been paid (or received) in
advance -0.3 -0.9 -9.0
Difference between fair value and book value for properties valued at cost 24.8 12.0 0.0
Relevant real estate volume for LTV calculation 4,299.9 4,056.2 3,847.6
LTV 52.3% 57.0% 57.1%
AP
PE
ND
IX
40 40
TAG Immobilien AG | February 2018 | 40
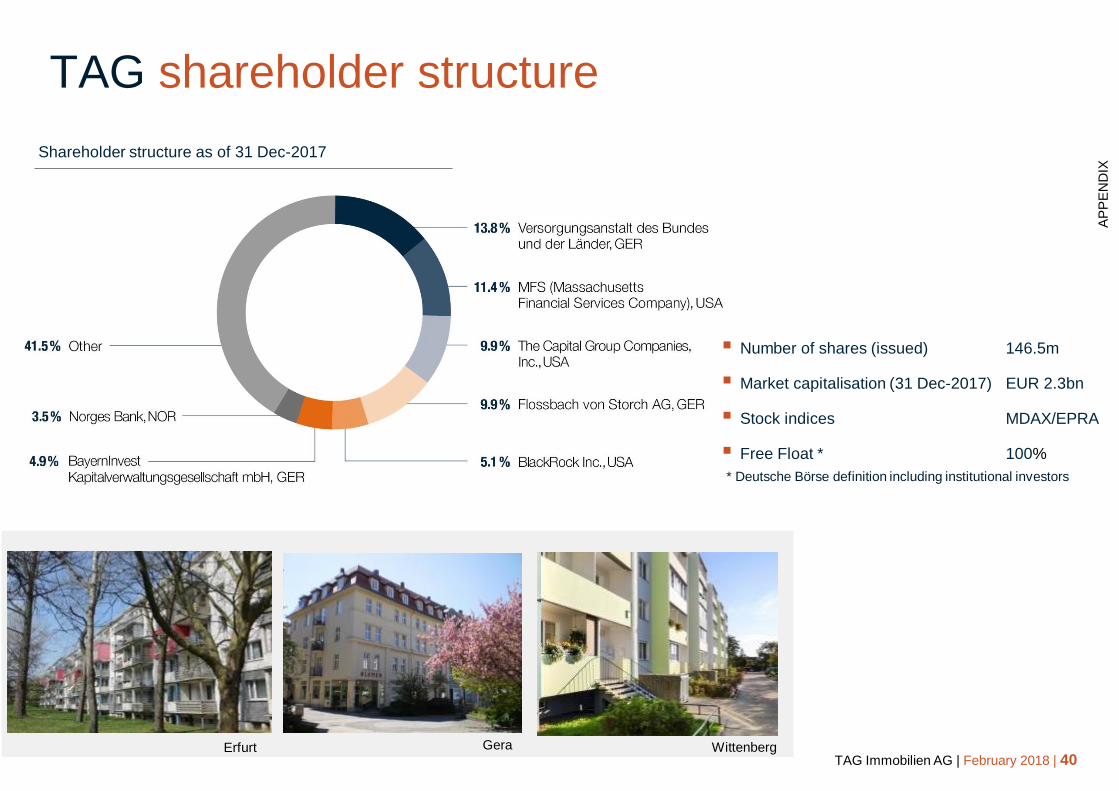
TAG shareholder structure
Shareholder structure as of 31 Dec-2017
Wittenberg Erfurt Gera
AP
PE
ND
IX
Number of shares (issued) 146.5m
Market capitalisation (31 Dec-2017) EUR 2.3bn
Stock indices MDAX/EPRA
Free Float * 100%
* Deutsche Börse definition including institutional investors
41 41
TAG Immobilien AG | February 2018 | 41
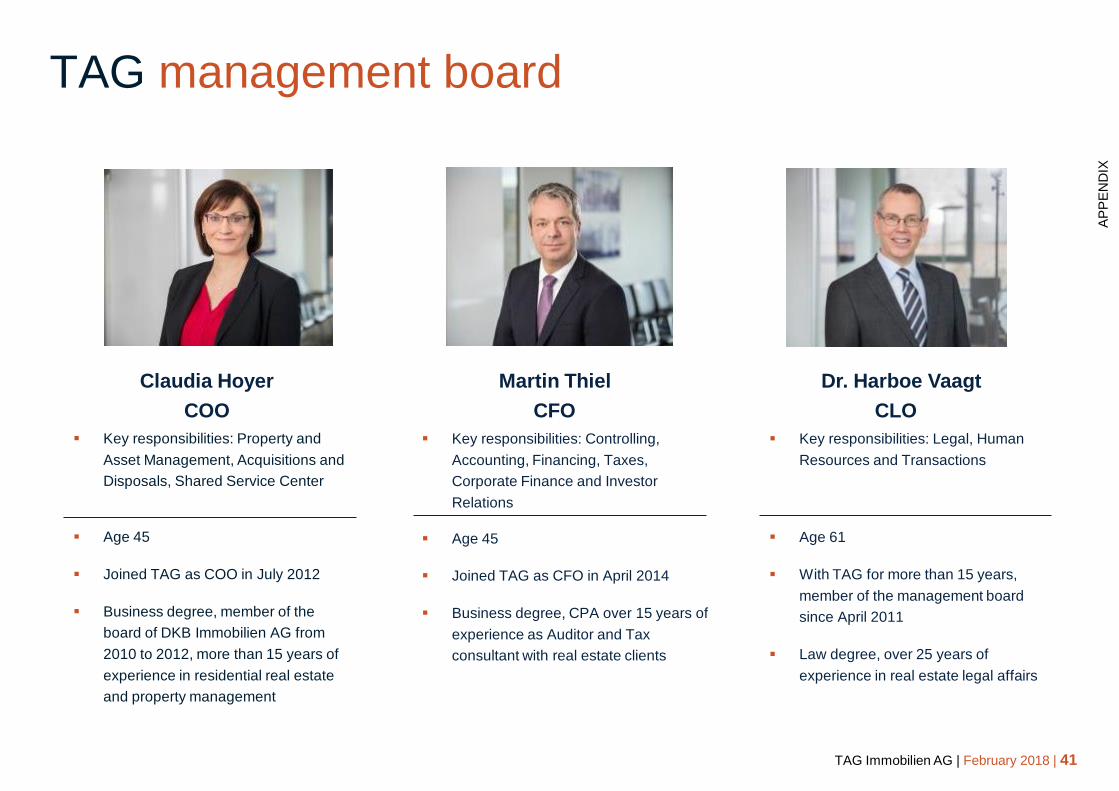
TAG management board
COO CFO CLO
Key responsibilities: Property and
Asset Management, Acquisitions and
Disposals, Shared Service Center
Age 45
Joined TAG as COO in July 2012
Business degree, member of the
board of DKB Immobilien AG from
2010 to 2012, more than 15 years of
experience in residential real estate
and property management
Key responsibilities: Controlling,
Accounting, Financing, Taxes,
Corporate Finance and Investor
Relations
Age 45
Joined TAG as CFO in April 2014
Business degree, CPA over 15 years of
experience as Auditor and Tax
consultant with real estate clients
Key responsibilities: Legal, Human
Resources and Transactions
Age 61
With TAG for more than 15 years,
member of the management board
since April 2011
Law degree, over 25 years of
experience in real estate legal affairs
Claudia Hoyer Martin Thiel Dr. Harboe Vaagt
AP
PE
ND
IX

42 42
TAG Immobilien AG | February 2018 | 42
TAG notes
AP
PE
ND
IX

43 43
TAG Immobilien AG | February 2018 | 43
TAG notes
AP
PE
ND
IX

44 44
TAG Immobilien AG | February 2018 | 44
TAG contacts
TAG Immobilien AG
Steckelhörn 5
20457 Hamburg
Phone: +49 40 380 32-0
Fax: +49 40 380 32-388
www.tag-ag.com
Martin Thiel
CFO
Phone: +49 40 380 32-222
Fax: +49 40 380 32-388
Dominique Mann
Head of Investor & Public Relations
Phone: +49 40 380 32-305
Fax: +49 40 380 32-388
TAG Contacts
TAG Immobilien AG
Steckelhörn 5
20457 Hamburg
Phone: +49 40 380 32-0
Fax: +49 40 380 32-388
www.tag-ag.com
Martin Thiel
CFO
Phone: +49 40 380 32-222
Fax: +49 40 380 32-388
Dominique Mann
Head of Investor & Public Relations
Phone: +49 40 380 32-305
Fax: +49 40 380 32-388